Article

Soft Periodic Convolutional Recurrent Network for Spatiotemporal Climate Forecast

1
Graduate School of Information Science and Technology, Osaka University, Osaka 565-0871, Japan
2
Faculty of Advanced Science and Technology, Kumamoto University, Kumamoto 860-8555, Japan
3
SANKEN (The Institute of Scientific and Industrial Research), Osaka University, Osaka 567-0047, Japan
*
Authors to whom correspondence should be addressed.
Appl. Sci. 2021, 11(20), 9728; https://doi.org/10.3390/app11209728
Submission received: 30 July 2021 / Revised: 14 September 2021 / Accepted: 16 September 2021 / Published: 18 October 2021

Abstract

:
Many machine-learning applications and methods are emerging to solve problems associated with spatiotemporal climate forecasting; however, a prediction algorithm that considers only short-range sequential information may not be adequate to deal with periodic patterns such as seasonality. In this paper, we adopt a Periodic Convolutional Recurrent Network (Periodic-CRN) model to employ the periodicity component in our proposals of the periodic representation dictionary (PRD). Phase shifts and non-stationarity of periodicity are the key components in the model to support. Specifically, we propose a Soft Periodic-CRN (SP-CRN) with three proposals of utilizing periodicity components: nearby-time (PRD-1), periodic-depth (PRD-2), and periodic-depth differencing (PRD-3) representation to improve climate forecasting accuracy. We experimented on geopotential height at 300 hPa (ZH300) and sea surface temperature (SST) datasets of ERA-Interim. The results showed the superiority of PRD-1 plus or minus one month of a prior cycle to capture the phase shift. In addition, PRD-3 considered only the depth of one differencing periodic cycle (i.e., the previous year) can significantly improve the prediction accuracy of ZH300 and SST. The mixed method of PRD-1, and PRD-3 (SP-CRN-1+3) showed a competitive or slight improvement over their base models. By adding the metadata component to indicate the month with one-hot encoding to SP-CRN-1+3, the prediction result was a drastic improvement. The results showed that the proposed method could learn four years of periodicity from the data, which may relate to the El Niño–Southern Oscillation (ENSO) cycle.

1. Introduction

Increasing climate remote sensing (e.g., weather satellite, AMeDAS), including re-analysis data that combine numerical simulations with observations, generates a massive amount of data. Furthermore, it consumes a lot of computational resources to make a forecast by using numerical weather prediction (NWP) models [1], and requires climatology knowledge to build a model, unlike machine learning (ML). Currently, many applications are using ML in the climate domain, such as tropical cyclone forecasting [2,3], long-term rainfall prediction [4], and more [5,6,7].
Time-series forecasting models [8] have emerged to forecast climate variables by learning from the historical data. Long short-term memory (LSTM) [9] is a kind of recurrent neural network (RNN) capable of learning long-term dependencies [10,11]. Recent works in ML [12,13,14] have proven that LSTM is beneficial for solving time-series climate forecasting problems.
The spatiotemporal forecasting problem in the climate domain given by the spatial and temporal data is crucial for predicting the next time frame. The convolutional long short-term memory network (ConvLSTM) [15] is the first ML method to tackle spatiotemporal climate forecasting by extending a fully connected LSTM (FC-LSTM) with convolutional structures. ConvLSTM was tested on precipitation nowcasting (up to 6 hours) in Hongkong from radar echo dataset. Our previous work [16] also showed that ConvLSTM outperformed Convolutional Neural Networks (CNNs) and linear regression for predicting geopotential height at a pressure of 300 hPa.
Meanwhile, periodic patterns, e.g., seasonality, exist in a global spatiotemporal climate pattern. For example, the positive and negative phases of the North Atlantic Oscillation (NAO) predominantly appear in boreal winter over the Northern Hemisphere [17]. In the study of Lanchang-Mekong [18], the sub-region periodicity pattern of temperature and precipitation significantly increased. Looking deeper into the periodic patterns, there are two periodic patterns that we consider in this research; (1) the phase shift, such as the late summer and early autumn [19], and (2) non-stationarity of periodicity [20,21,22]. Climate seasonal shifts in terms of spatial and intensity may not be the same every year [23]. The study of El Niño–Southern Oscillation (ENSO) [21] on South African rainfall showed that the periodic cycle may vary in many ranges of years. The study of upstream sub-basins of the Yangtze River [22] also shows statistically significant 2- to 4-year periodicities for mean areal precipitation. To tackle the problem of phase shift and non-stationarity of periodicity patterns, the model should consider the nearby time (months) and multiple cycles.
Although ConvLSTM and other novel spatiotemporal forecasting methods [24,25,26] are suitable for spatiotemporal forecasting, they do not consider periodicity, which is an essential component in climate forecasting. Periodic Convolutional Recurrent Network (Periodic-CRN) [27] has been proposed in a different domain (Taxi transportation) as a spatiotemporal forecasting model that makes use of the data’s periodicity. The idea is to store the CRN component’s output in the periodic representation dictionary (PRD) for re-use. Representations from the dictionary were used through an attention mechanism [28] to improve the forecasting accuracy of the crowd density across two taxi datasets from Beijing and Singapore.
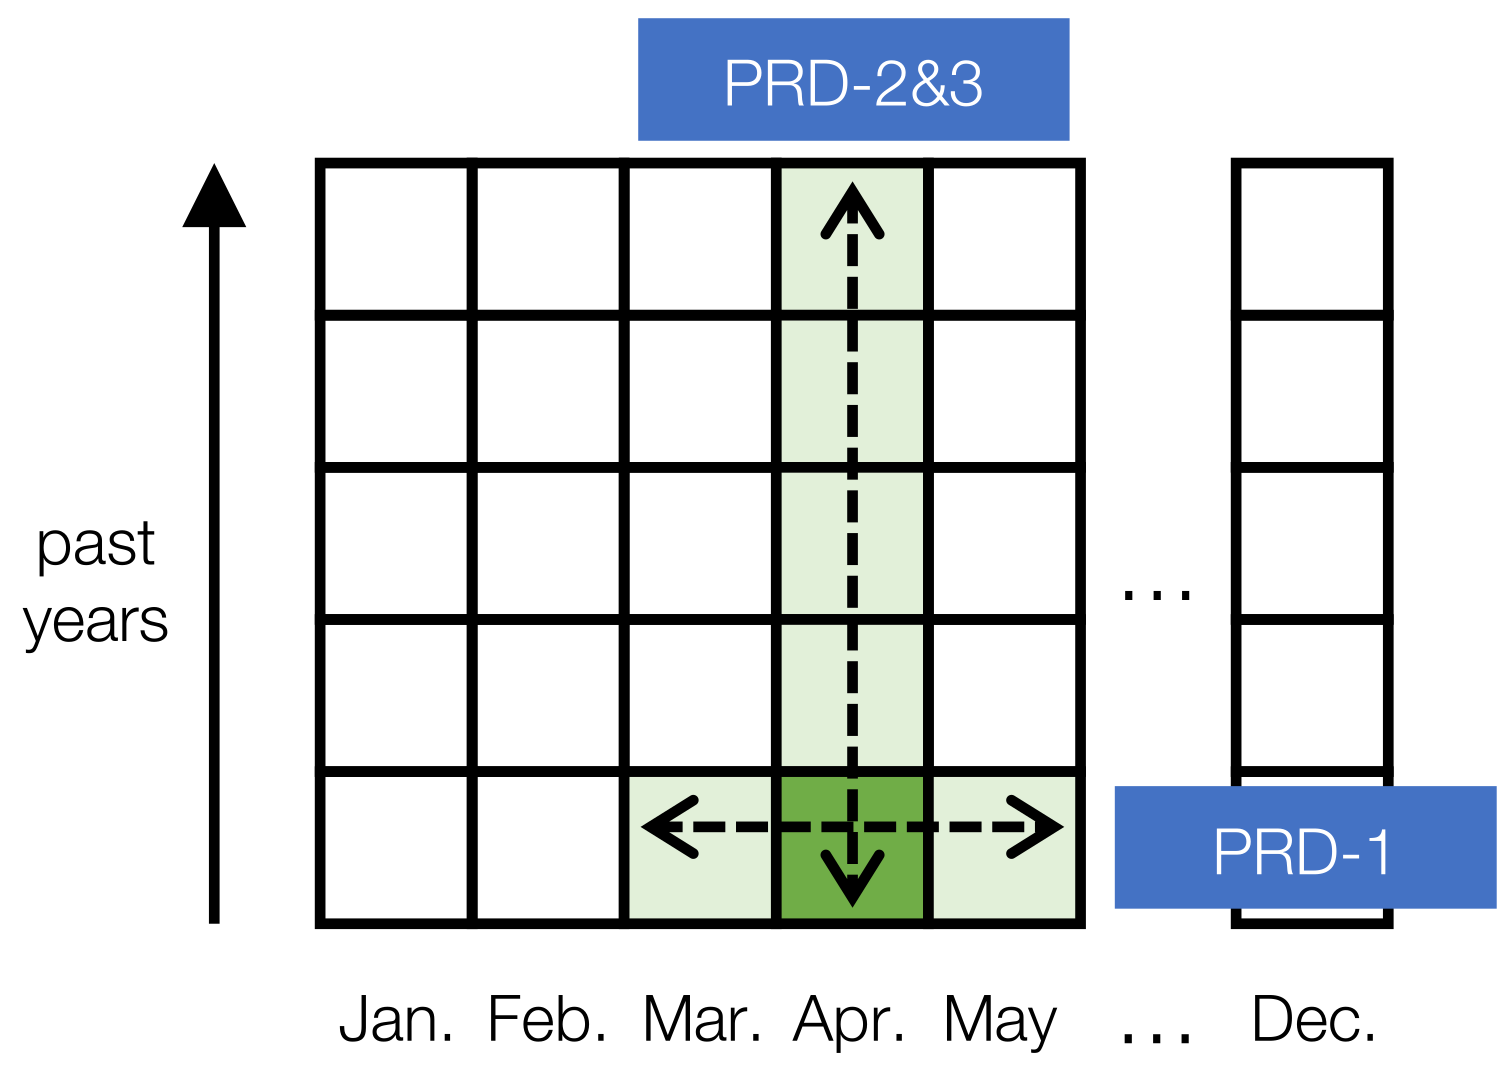
In this paper, we adapt Periodic-CRN to climate forecasting and validate the effectiveness of using periodic representation in forecasting climate variables. We propose Soft Periodic-CRN (SP-CRN) with three types of PRD that improve the prediction accuracy by considering phase shift and non-stationarity of periodicity: Nearby-Time, Periodic-Depth, and Periodic-Depth-Differencing representations, as shown in Figure 1. The experiments compared the model performances to predict one-month ahead for a geopotential height at pressure 300 hPa (ZH300) and sea surface temperature (SST) in an ERA-Interim (https://apps.ecmwf.int/datasets/data/interim-full-moda/levtype=pl/, accessed on 10 May 2021) dataset.

2. Related Work

Firstly, we introduce the works on ML-based spatiotemporal climate forecasting. Generally, a CNN is the method used to capture the spatial relationship of spatial input. However, it cannot by itself capture spatiotemporal relationships because there is no temporal memory for temporal changed patterns. A ConvLSTM [15] improves an FC-LSTM by capturing both spatial and temporal patterns, and was applied to precipitation nowcasting (short period, up to 6 hours). Since then, spatiotemporal climate forecasting has widely mentioned ConvLSTM as a baseline method [24,25,26] or adopted in other model architectures [29,30,31]. Predictive RNN (PredRNN) [24] adds extra connections between adjacent time steps in a core stack of spatiotemporal LSTM (ST-LSTM), which outperforms ConvLSTM in precipitation nowcasting. Memory-in-memory (MIM) networks [25] improve the learning of non-stationarity properties in spatiotemporal input, such as spatial correlations or temporal dependencies of local pixel values for low-level non-stationarity, and the accumulation, deformation or dissipation of radar echoes in precipitation forecasting for high-level non-stationarity. MIM captures those non-stationarity properties by adding stationary and non-stationary modules separately inside the ST-LSTM block [24]. Lastly, the most recent work on spatiotemporal climate forecasting is the spatiotemporal convolutional sequence-to-sequence network (STConvS2S) [26]. STConvS2S comprises three components, the sets of convolutional layers responsible for different tasks: the temporal block, which learns the temporal representation of sequential input by two approaches (temporal casual block [32] and temporal reversed block); spatial block, which extracts the spatial features from the temporal block; and temporal generator block, designed to output a sequence of arbitrary length. The STConvS2S outperformed or was competitive with ConvLSTM, PredRNN, MIM models for temperature (CFSR https://climatedataguide.ucar.edu/climate-data/climate-forecast-system-reanaly sis-cfsr, accessed on 22 February 2021) and rainfall (CHIRPS https://chc.ucsb.edu/data/chirps, accessed on 22 February 2021) prediction.
Secondly, we introduce ML-based climate forecasting methods that use the periodicity component to improve prediction accuracy. A seasonally integrated autoencoder (SSAE) [33] is proposed to improve short-term daily precipitation forecasting. SSAE architecture has two LSTM autoencoders: the short-term autoencoder, which learns the short-term sequential input (less than seven days), and the seasonal autoencoder which captures the seasonal change in a long-term sequential input long enough to cover the period of the wet or dry season (60–120 days). The other way is to introduce the metadata idea to the network. The prediction of a streamflow in a river [34] improves the prediction results by adding a digit for the month as one of inputs in the final position of the sequential input of LSTM, Extreme Learning Machines (ELM), and Random Forest (RF) algorithms. Committee ELM (Comm-ELM) [35] also forecasts the monthly standardized precipitation index (SPI) by adding a digit for the month to indicate yearly periodicity at the end of a sequential input to improve the prediction. However, all of these methods assume stationary periodicity, which means they can not capture the phase shift or non-stationarity of periodicity patterns.
Meanwhile, in time series analysis, the Autoregressive Integrated Moving Average (ARIMA), a statistical prediction model, is applied to a non-stationary time series to eliminate the non-stationary mean function (trend) corresponding to the "integrated" part of the model. ARIMA [36] is used in near-term regional temperature and precipitation forecasting. Seasonal ARIMA (SARIMA) [37] is an extension of ARIMA that supports a seasonal component for time series prediction. It adds difference operators to remove the seasonal component to transform the non-stationary time series into a stationary one. SARIMA analysis was found are acceptable for predicting the monthly mean temperature of Nanjing, China [38]. SARIMA was also used in the precipitation and temperature predictions at the Tehri and Uttarkashi stations in the Bhagirathi river basin in the state of Uttarakhand, India [39]. SARIMA was applied to a coastal Tuscany watershed to study hydrological cycle changes at the local scales (area) [40]. Furthermore, SARIMA was applied for the spatiotemporal analysis in the Highlands region, Algeria, to predict the local scale of precipitation [41]. However, SARIMA does not work well on multiple seasonalities [42], the daily and yearly patterns in the same time series of a climate variable (e.g., surface temperature). Empirical mode decomposition (EMD) [43] can also modify such a time series, from high to low frequency, into multi-resolution intrinsic mode functions (IMFs) while leaving the monotonous time series as the estimated trend time series. Ensemble EMD (EEMD) [44] is a variant of EMD, and is used to extract the seasonal component from a time series by selecting the IMFs of the decomposed original time series that corresponds to the seasonal averaged model.
In summary, ConvLSTM and spatiotemporal climate forecasting models [24,25,26] consider only sequential input, which is the short sequence that does not cover the periodicity patterns. SSAE [33] focuses on the long sequence that covers the entire season, but the model does not regard changes in multiple periodic cycles. SARIMA [37], EMD [43], and EEMD [44] do not address the spatial dependencies, and the decomposed time series by EMD and EEMD may not refer to the seasonality of the observations.
Meanwhile, Periodic-CRN [27] has been proposed as a spatiotemporal forecasting model in a taxi transportation domain, where it will use daily and weekly periodicity components along with the load and save mechanism in the PRD. Although Periodic-CRN improves prediction accuracy by using periodicity, it assumes stationary periodicity as PRD refers to exactly the same index of the previous cycle, which means "hard" periodicity. In this paper, we proposed SP-CRN by adapting the PRD to be a decent mechanism in the non-stationary climate domain. Our PRD approaches are novel ideas that consider phase shift and the non-stationarity of periodicity. This paper focuses on "soft" yearly periodicity, which includes nearby months and a multiple-year cycle, and use of three proposals from the PRD, satisfies climate data behavior.

3. Materials and Methods

3.1. Overview

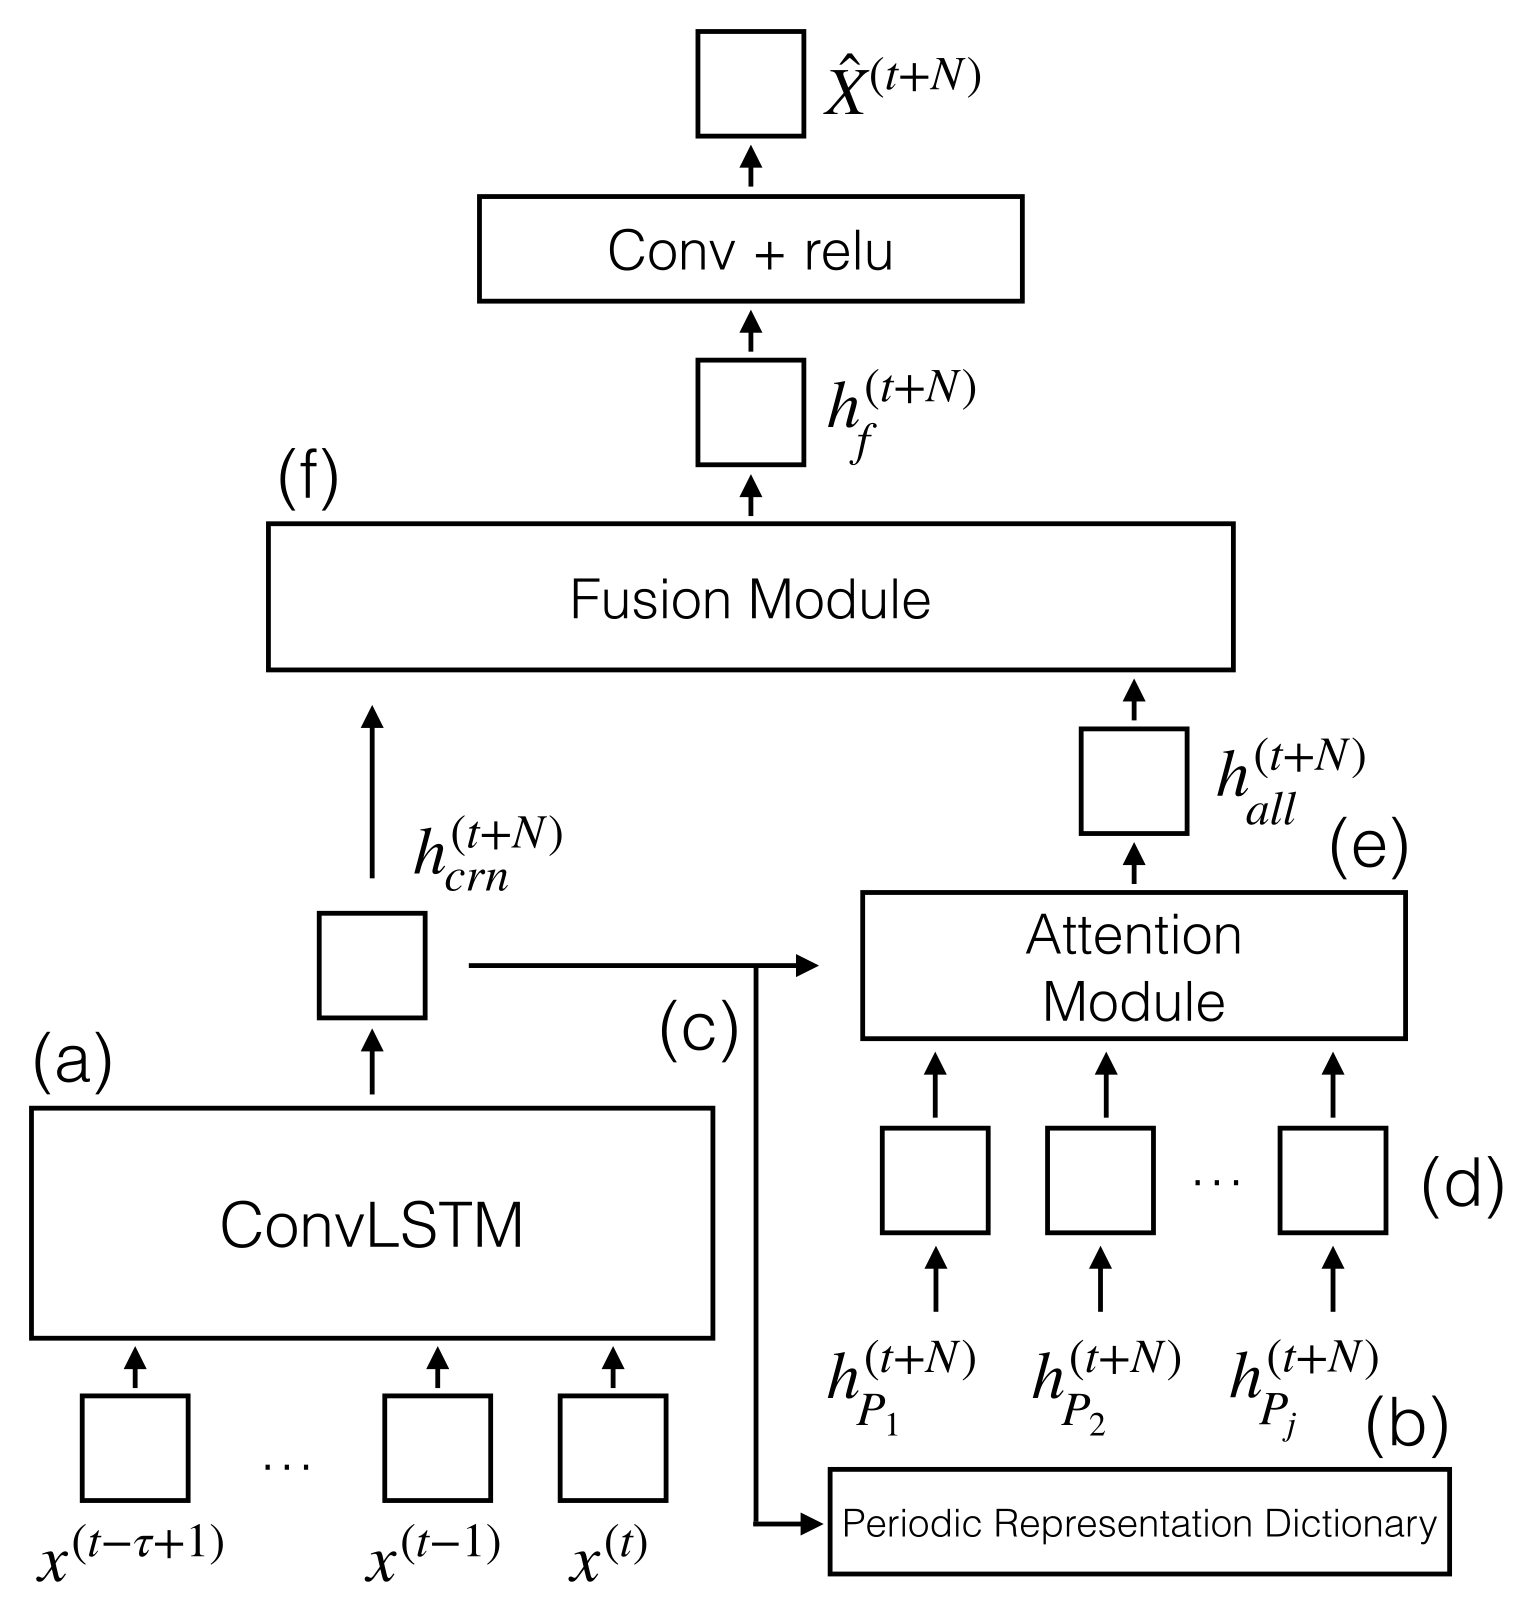
For our research, the original Periodic-CRN was modified as two components: (1) CRN and (2) periodic representation. The entire architecture is shown in Figure 2. The process of this method begins with learning the sequential input in the CRN component (Figure 2a). Then, the hidden state output from the CRN component is saved as a periodic representation (Figure 2b), and it is loaded according to the proposal described in Section 3.4. Next, to estimate the relevance of each periodic representation to the hidden state output, the representations are weighted by the attention module (Section 3.5) as the representation output from the periodic representation component. Finally, the hidden state output of the two components is combined (fusion module in Figure 2f), then reshaped with convolution operation as described in Section 3.6 to obtain the prediction.

3.2. Problem Statement

We regard our climate prediction task as similar to a next video frame prediction [45], where input is a sequence of spatial 2-dimensional data, and the output is spatial data of the next timestep. Climate data for a geo-spatio-temporal domain is aggregated into multichannels of a 2-dimensional data X ^ ( t ) R M W H , where M, W, H are the number of channels, width (longitude), and height (latitude), respectively, and t is a data time index.
Equation (1) is a problem statement, where X ^ ( t + N ) is a spatial climate variable at time t + N , where N is a natural number. θ is model parameters of the function F; τ is a natural number of a pre-defined sequence length ( τ = 1 , 2 , 3 , ), and X ( t ) , , X ( t τ + 1 ) are spatial sequence input data.
X ^ ( t + N ) = F ( X ( t ) , , X ( t τ + 1 ) ; θ )

3.3. CRN Component

To capture spatiotemporal patterns of an input sequence, we need a network that considers spatial dependencies. The convolution operator inside CRN is responsible for extracting spatial latent features from a low to high level. We selected ConvLSTM as a CRN component for this research, and named it SP-CRN (LSTM).
The CRN component is shown in Figure 2a. The spatial input data are fed into ConvLSTM in each time step. Equations (2) are those of ConvLSTM, where W x , W h and W c denote a set of weights (kernels) of current input, hidden state, and cell output, respectively. The 3D tensors x ( t ) , h ( t ) , c ( t ) , and gates i ( t ) , f ( t ) , o ( t ) are input, hidden state, cell output, input gate, forget gate, and output gate, respectively. Moreover, b denotes bias, σ denotes an sigmoid function, ∗ denotes a convolution operator and ∘ denotes a Hadamard product.
i ( t ) = σ ( W x i x ( t ) + W h i h ( t 1 ) + W c i c ( t 1 ) + b i ) f ( t ) = σ ( W x f x ( t ) + W h f h ( t 1 ) + W c f c ( t 1 ) + b f ) c ( t ) = f ( t ) c ( t 1 ) + i ( t ) tanh ( W x c x ( t ) + W h c h ( t 1 ) + b c ) o ( t ) = σ ( W x o x ( t ) + W h o h ( t 1 ) + W c o c ( t ) + b o ) h ( t ) = o ( t ) tanh ( c ( t ) )

3.4. Periodic Representation

The purpose of this component is to consider a periodic pattern of the input sequence. A hidden state output from the CRN component ( h c r n ( t + N ) ) is stored as a periodic representation (P), where c r n refers to the CRN component. The periodic representation process of the load and update mechanisms is shown in Figure 2c,d.
P is an m × d matrix, where m is time index (month) of one periodic cycle; d is the depth of periodicity, and p i , j or P [ i ] [ j ] refers to a stored representation from the CRN component. The periodic representation is loaded and updated to P where the dictionary index (starting from 1) is matched with the indexing function, described in Section 3.4.1 and Section 3.4.2. The expression h P j ( t + N ) represents loaded periodic representations from P, where j represents each of the loaded representation indices. I P is a calculated time index of the cycle used in the load and update mechanism, where I P = t ( m × t m ) .

3.4.1. Update Mechanism

The output representation from the CRN component is stored as a periodic representation to the PRD and re-used in the next periodic cycle depending on the load mechanism explained in Section 3.4.2. The update mechanism is the depth-wise queue (First-In–First-Out), where it is repeated every time step (month by month). The process has two steps: the first, shift representation, prepares the available space in P for the new representation, which is shifted from the bottom (the latest) to the top (the earliest) of P as shown in Equation (3); the second, save new representation, is the new representation ( h c r n ( t + N ) ) saved to the bottom of P as shown in Equation (4); z refers to the depth of the matrix according to the indexing function.
P [ I P ] [ z ] P [ I P ] [ z 1 ] ( for z = 2 , , d )
h c r n ( t + N ) P [ I P ] [ d ]

3.4.2. Load Mechanism

To use periodicity in the model, the representations from the PRD are loaded with three different proposals. Note that the load mechanism proceeds before the update mechanism. The representation at the bottom of P (where z = d ) is the representation of the previous periodic cycle when the time index is I P . Thus, p i , z (where i < I p ) are the representations of a current cycle. In contrast, p i , z (where i I p ) are the representations of the previous cycle as shown in Figure 3a.
1. Nearby-Time Representation: In this work, to capture a phase shift that may change every year, we extended the periodic attention mechanism component idea from the original Periodic-CRN to include nearby (months) representations for the previous year as shown in Equation (5).
In this proposal, d is 2, and z { 1 , 2 } indicate which depth of P will be used for a load mechanism. Since the update mechanism is proceeded at every time step, representations in the same depth (z) may not be in the same periodic cycle. I P n is the nearby time index; n is the incremental number indicating nearby time index representation; and n p r e is the pre-defined length. The example of the nearby-time representation proposal is shown in Figure 3a. To find a yearly periodic representation of July 1999, m was defined as 12 (yearly), t was 247 (when the time index started from January 1979); and t m was calculated as 20 (years); and I P is 7 (July). If n p r e is defined as 2, then the representations of p 1 , 5 , p 1 , 6 , p 2 , 7 , p 2 , 8 , and p 2 , 9 which are May, June, July, August and September 1998 are loaded.
h P n ( t + N ) P [ I P n ] [ z ] ( for n = n p r e , , 0 , , n p r e )
where
I P n ( I P + n ) m , if I P + n > m m ( I P + n ) , else if I P + n 0 I P + n , otherwise
z 2 , if n 0 1 , otherwise
2. Periodic-Depth Representation: The periodic representation in the first proposal, the nearby time representation, considers only one year’s prior representation. We extended the representation to be more than one period prior, and use only the same time index (phase) as shown in Equation (6) where d is the depth of P representing the number of consecutive periodic cycles. The load mechanism loads all the representations that are in the same phase of the previous cycles.
An example of periodic-depth representation proposal is shown in Figure 3b. To find a periodic representation of July 1999, d is 5, t is 247, m is 12, t m is 20, then I P is 7 (July). The representation of July 1998, 1997, 1996, 1995, and 1994 are loaded according to d = 5 .
h P z ( t + N ) P [ I P ] [ z ] ( for z = 1 , . . . , d )
3. Periodic-Depth-Differencing Representation: Similar to the second proposal, we considered the first-order derivative of the representations to capture the changes over cycles as shown in Equation (7). In this proposal, we used a differencing of two years. The load mechanism loaded the differencing of representation p i , j .
The example of periodic-depth-differencing representation proposal is shown in Figure 3c. According to the parameters set in the second proposal, to find the periodic representation of July 1999, the representation of July 1998 minus 1997, 1997 minus 1996, 1996 minus 1995, and 1995 minus 1994 were loaded.
h P z ( t + N ) P [ I P ] [ z ] P [ I P ] [ z 1 ] ( for z = 2 , . . . , d )

3.5. Attention Module

In this method as shown in Equations (8)–(10), and Figure 2e, we merged h c r n ( t + N ) and h P j ( t + N ) , where j denotes the time representation according to the proposal described in Section 3.4. The attention mechanism [28] was used to weight the multiple h P j . The scalar weight a j was learned from the network, which indicated the importance of each representation h P j , where a j [ 0 , 1 ] and j a j = 1 according to the softmax operation. The h a l l ( t + N ) denoted the periodic representation output after the attention mechanism process.
e j ( t + N ) = W f . f l a t t e n ( W e [ h c r n ( t + N ) , h P j ( t + N ) ] ) + b f
a j ( t + N ) = exp ( e j ( t + N ) ) j exp ( e j ( t + N ) )
h a l l ( t + N ) = j a j ( t + 1 ) h P j ( t + N )

3.6. Fusion Module

The periodic representation h a l l and the representation output h c r n ( t + N ) are now combined as shown in Equation (11), and Figure 2f. To prevent a dying rectified linear unit (ReLU) problem, a leaky ReLU [46] was used. Weight W e is a convolutional kernel size of 1 × 1 × 2 that reduces the representation channels to one, and the size of W f is equal to the size of the flattening operation output.
h f ( t + N ) = r e l u ( W c h c r n ( t + N ) + W P h a l l ( t + N ) )
After the fusion module, the convolution layer was used to transform the output X ^ ( t + N ) to the same size as an input. In Equation (12), the size of W f and X ^ ( t + N ) are the same size as the input. The prediction of the model is X ^ ( t + N ) .
X ^ ( t + N ) = h f ( t + N ) W f

4. Experiment Settings

4.1. ERA-Interim Dataset

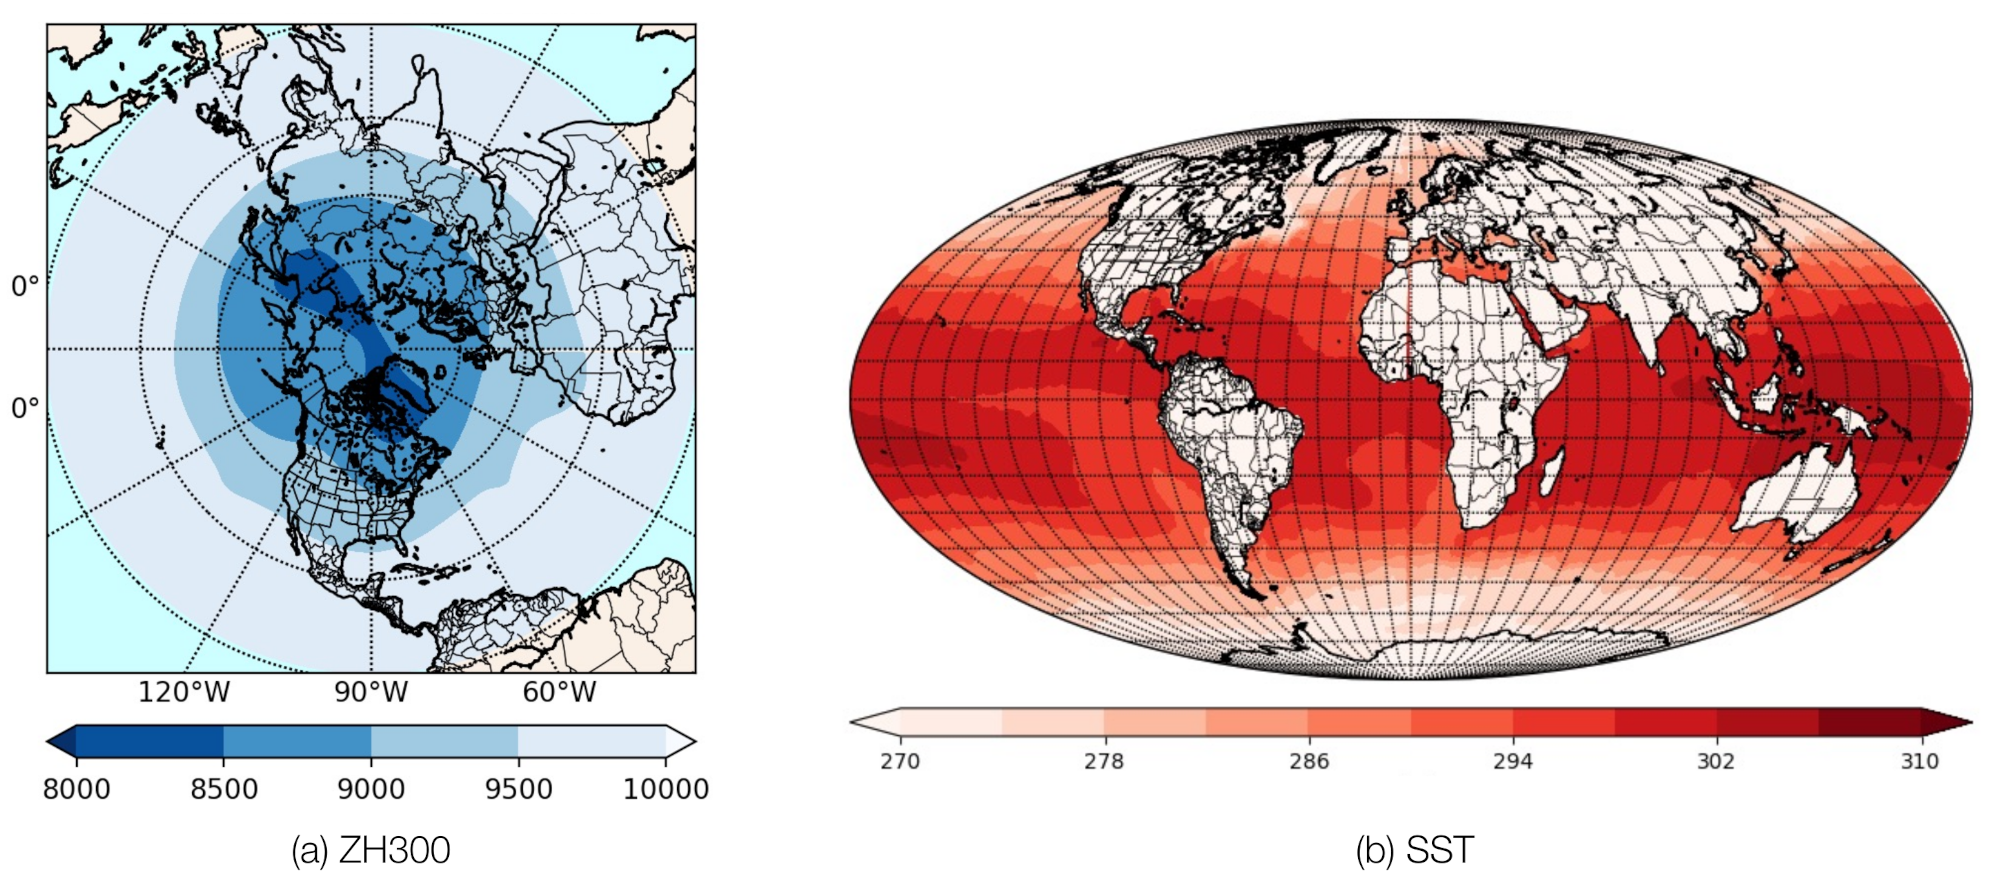
ERA-Interim is a dataset from the European Centre for Medium-Range Weather Forecasts (ECMWF), an objective re-analysis of a global atmospheric variable from 1 January 1979 to 31 August 2019. The dataset includes a 4-dimensional variational analysis (4D-Var): latitude, longitude, air pressure (height), and time. The monthly means of daily means was used as a time resolution. To validate the proposed method performance, we chose two climate variables from ERA-Interim: geopotential at 300 hPa (Z300) and sea surface temperature (SST). In addition, the two datasets used the same periods of training, validation, and test set (1979–2015, 2016, and 2017–2018, respectively). Figure 4 shows the sample of datasets.
Z300 is at the same height as the jet stream, a strong upper-tropospheric wind axis 9–12 km above sea level. The jet stream wind separates the high and low pressure systems representing hot and cold weather, respectively.Atmospheric variation in the upper troposphere is used for weather prediction at the surface because the air circulation can be a precursor to weather prediction [47]. Moreover, an upper troposphere change can cause extreme winter cold [48] over northern Europe and cold air outflows in the Northern Hemisphere [49]. In this paper, Z300 is converted to a geopotential height at pressure level 300 hPa (ZH300) divided by gravitational acceleration (9.8 m/s 2 ). Then we extracted the data to a 90 (latitude) × 360 (longitude) grid size that covered the Northern Hemisphere.
Sea surface temperature (SST) plays an important role in the interaction between the earth’s surface and atmosphere. It is an important parameter in energy balancing at the earth’s surface and is also a critical indicator of the heat of sea water. We chose a global SST with a 1 degree grid resolution, which is the spatial size of 180 (latitude) × 360 (longitude).

4.2. Evaluation Metric

As the area around the North and South Pole is less than the equator area, a latitude-weighted root mean square error (RMSE) was employed as an evaluation metric. A latitude-weighted RMSE was also the evaluation metric in WeatherBench [1], the first benchmark for data-driven, medium-range climate prediction.
R M S E = 1 N forecasts i N forecasts 1 N lat N lon j N lat k N lon L ( j ) ( f i , j , k t i , j , k ) 2 ,
where f is the model forecast, and t is the ground truth of the data. N forecasts , N lat , and N lon are the numbers for forecasting, latitude, and longitude, respectively. L ( j ) is the latitude weighting factor by the latitude (degree) at the j t h latitude index lat ( j ) :
L ( j ) = cos ( lat ( j ) ) 1 N lat j N lat cos ( lat ( j ) )

4.3. Comparison Methods

Convolutional neural networks (CNN) [50]: A CNN is a standard deep-learning method for next video frame prediction. It is also widely used and applied as a model for climate prediction. In this experiment, we used five convolutional layers, the last being the output layer with an output channel of one.
Convolution gated recurrent unit (ConvGRU) [51]: We applied a ConvGRU as a baseline method by replacing the first two layers with ConvGRU from the CNN baseline model; that is, two layers of ConvGRU and three layers of CNN. Then we applied consecutive a prior spatial input to the model.
ConvLSTM: To determine the benefit of using an LSTM structure that captures change over time, we adopted a ConvLSTM as a baseline method. The first two layers of the CNN were replaced by ConvLSTM layers, the same way as we applied the ConvGRU.
SP-CRN (GRU) and SP-CRN (LSTM): As described in Section 3, we applied the ConvGRU and the ConvLSTM as the CRN component for the SP-CRN model. The SP-CRN (LSTM) will undergo further experimentation for our periodicity proposals .

4.4. Settings

We conducted the experiments to test the hyperparameters on CNN and ConvLSTM to find suitable ones for our experiments. The hyperparameters tested compared the kernel size of 3 × 3, 5 × 5, and 7 × 7, and the number of filters of 16, 32, and 64. Though the RMSEs on validation data were slightly different, we selected the 3 × 3 kernel and 16 filters for the time of our computational resources. Then we replaced the CNN layer with a ConvLSTM layer. The same hyperparameters were used for all the methods because the baseline algorithms and the proposed method used the similar CNN base network. A dropout rate of 0.5, and ELU activation functions were applied to every layer except the output layer, which used the identity function.
We performed all the models using an Adam optimizer with a learning rate of 10 4 , using mean square error (MSE) as a loss function. Shuffled training data was used to train CNN, ConvLSTM, and ConvGRU to be more generalized; on the other hand, SP-CRN did not use shuffled training data because the PRD component considers the order of training data. We adopted early stopping with 100 epoch patience on validation loss. We trained and evaluated each model five times and computed the average RMSE from each model prediction result. The dataset was scaled using standardized (Z-score normalization) by calculating the mean and standard deviation (SD) from the whole of space and time in the training dataset. The Z-score normalization makes the learning a stable convergence and leads a better result.
All the experiments of SST were the same as for ZH300. The only difference was the size of the spatial data: 90 × 360 (ZH300) and 180 × 360 (SST). The spatial data of SST contained masking, which ignored all the terrain area (the white space in Figure 4b). We replaced the terrain area with 0 and ignored it when using the standardize method in the training dataset, and MSE in the loss function. The same hyperparameters as ZH300 were used: a 3 × 3 kernal and 16 filters. We also used the same set of comparison methods.

5. Results

5.1. Results on ZH300

5.1.1. Input Sequence Length

The input sequence length affects the model’s performance, and each climate variable may need a different length of the input. This experiment indicates the proper input sequence for each model to perform one step ahead prediction on ZH300. Figure 5 shows the average RMSE prediction results comparing the models with the input sequence length of one to six months. The SP-CRN in this experiment is utilizing the PRD proposal of nearby-time representation, where n p r e = 0 (zero nearby-time representation). The results show that when increasing the length of sequential input, the RMSE of all models is significantly decreasing. Furthermore, the RMSE results tend to be converged after the sequence length of five or six months, indicating that the five to six months prior knowledge of ZH300 is essential for one step ahead of ZH300 prediction, which is consistent with the SST memory is about six months [52]. The SST is used to indicate ENSO, which impacts the prediction of weather and climate. The results also present superiority of the models consider periodicity component, which has the lower RMSE from their base model. The SP-CRN (GRU) and the SP-CRN (LSTM) have the competitive RMSE in every length of sequential input.

5.1.2. PRD Types

We used the SP-CRN (LSTM) as the model with periodicity component to perform the PRD proposals. Note that SP-CRN refers to SP-CRN (LSTM) from now on. An input sequence length of five months was selected as the baseline setting because it was the best for the SP-CRN model in the previous experiment (Figure 5). Table 1 shows the comparison of SP-CRN for the three proposals in different settings. The SD shows the dispersion to the average RMSE value. The SP-CRN-1 (1,1,0) with an RMSE of 74.22 m is slightly better than the SP-CRN-1 (0,1,0) baseline result (RMSE of 76.89 m). The result of SP-CRN-1 (1,1,0) indicated that only the nearby-time representation of plus and minus one month in one prior periodic cycle was more important than the more than two months ( n p r e > 1 ) for ZH300 prediction. All settings for the SP-CRN-2 proposal results showed a worse prediction accuracy compared to the baseline except SP-CRN-2 (0,4,0) with an RMSE of 70.58 m, indicating the importance of the information of the previous four periodic cycles for ZH300 prediction and possibly for the four-year oscillation of ENSO [53]. All settings of SP-CRN-3 outperfored the baseline result, of which SP-CRN-3 (0,0,2) had the best with an RMSE of 67.97 m. The results clearly showed that the change over cycles significantly improved ZH300 prediction accuracy. In summary, using SP-CRN for periodicity in ZH300 prediction was most effective for periodic-depth differencing representation (PRD-3) followed by periodic-depth representation (PRD-2) and nearby-time representation (PRD-1).

5.1.3. Combination of PRD Types and Meta-Data

To indicate the performance of the periodicity component on both nearby-time and periodic-depth representation, we mixed the proposals of SP-CRN-1 (1,1,0), SP-CRN-2 (0,4,0), and SP-CRN-3 (0,0,2) because they performed the best in their settings from the previous experiment (Table 1). The mixed proposals were combined with all the combinations that were SP-CRN-1+2 (1,4,0), SP-CRN-1+3 (1,0,2), SP-CRN-2+3 (0,4,2), and SP-CRN-1+2+3 (1,4,2). We also experimented with the idea of a metadata component from the original Periodic-CRN [27] to indicate the month of the year with one-hot encoding. The metadata component was added at the end of the fusion module in Figure 2f, and Section 3.6. The prediction output in Equation (12) was changed to combine the fusion module ( h f ( t + N ) ) and metadata component outputs ( h m e t a ( t + N ) ) as shown in Equation (15), where W f and W m e t a are weight the of h f ( t + N ) and h m e t a ( t + N ) , respectively. The metadata component may help the model indicating the phase of periodicity better to increase prediction accuracy. Therefore, we selected SP-CRN-1+3 (1,0,2) as the mixed proposal to be added to the metadata component (SP-CRN-1+3-Meta (1,0,2)).
X ^ ( t + N ) = h f ( t + N ) W f + h m e t a ( t + N ) W m e t a
Table 2 shows the experimental results of each model setting that had the best prediction accuracy. All the proposals on SP-CRN had better prediction accuracy than SP-CRN (LSTM) baseline, indicating that the periodicity utilization proposals helped improve prediction accuracy. The mixed proposal of SP-CRN-1+3 (1,0,2) was the best compared with the other mixed proposals, which improved SP-CRN-1 (1,1,0) and SP-CRN-3 (0,0,2) accuracy with an RMSE of 66.39 by considering the periodicity in both directions (nearby-time and periodic-depth). In contrast, the other mixed proposals with PRD-2 were worse than their baseline models. The metadata component in SP-CRN-1+3-Meta (1,0,2) was superior at indicating the phase of periodicity and had the lowest RMSE comparing to SP-CRN-1+3 (1,0,2) (base model).

5.1.4. Spatial Distribution Analysis

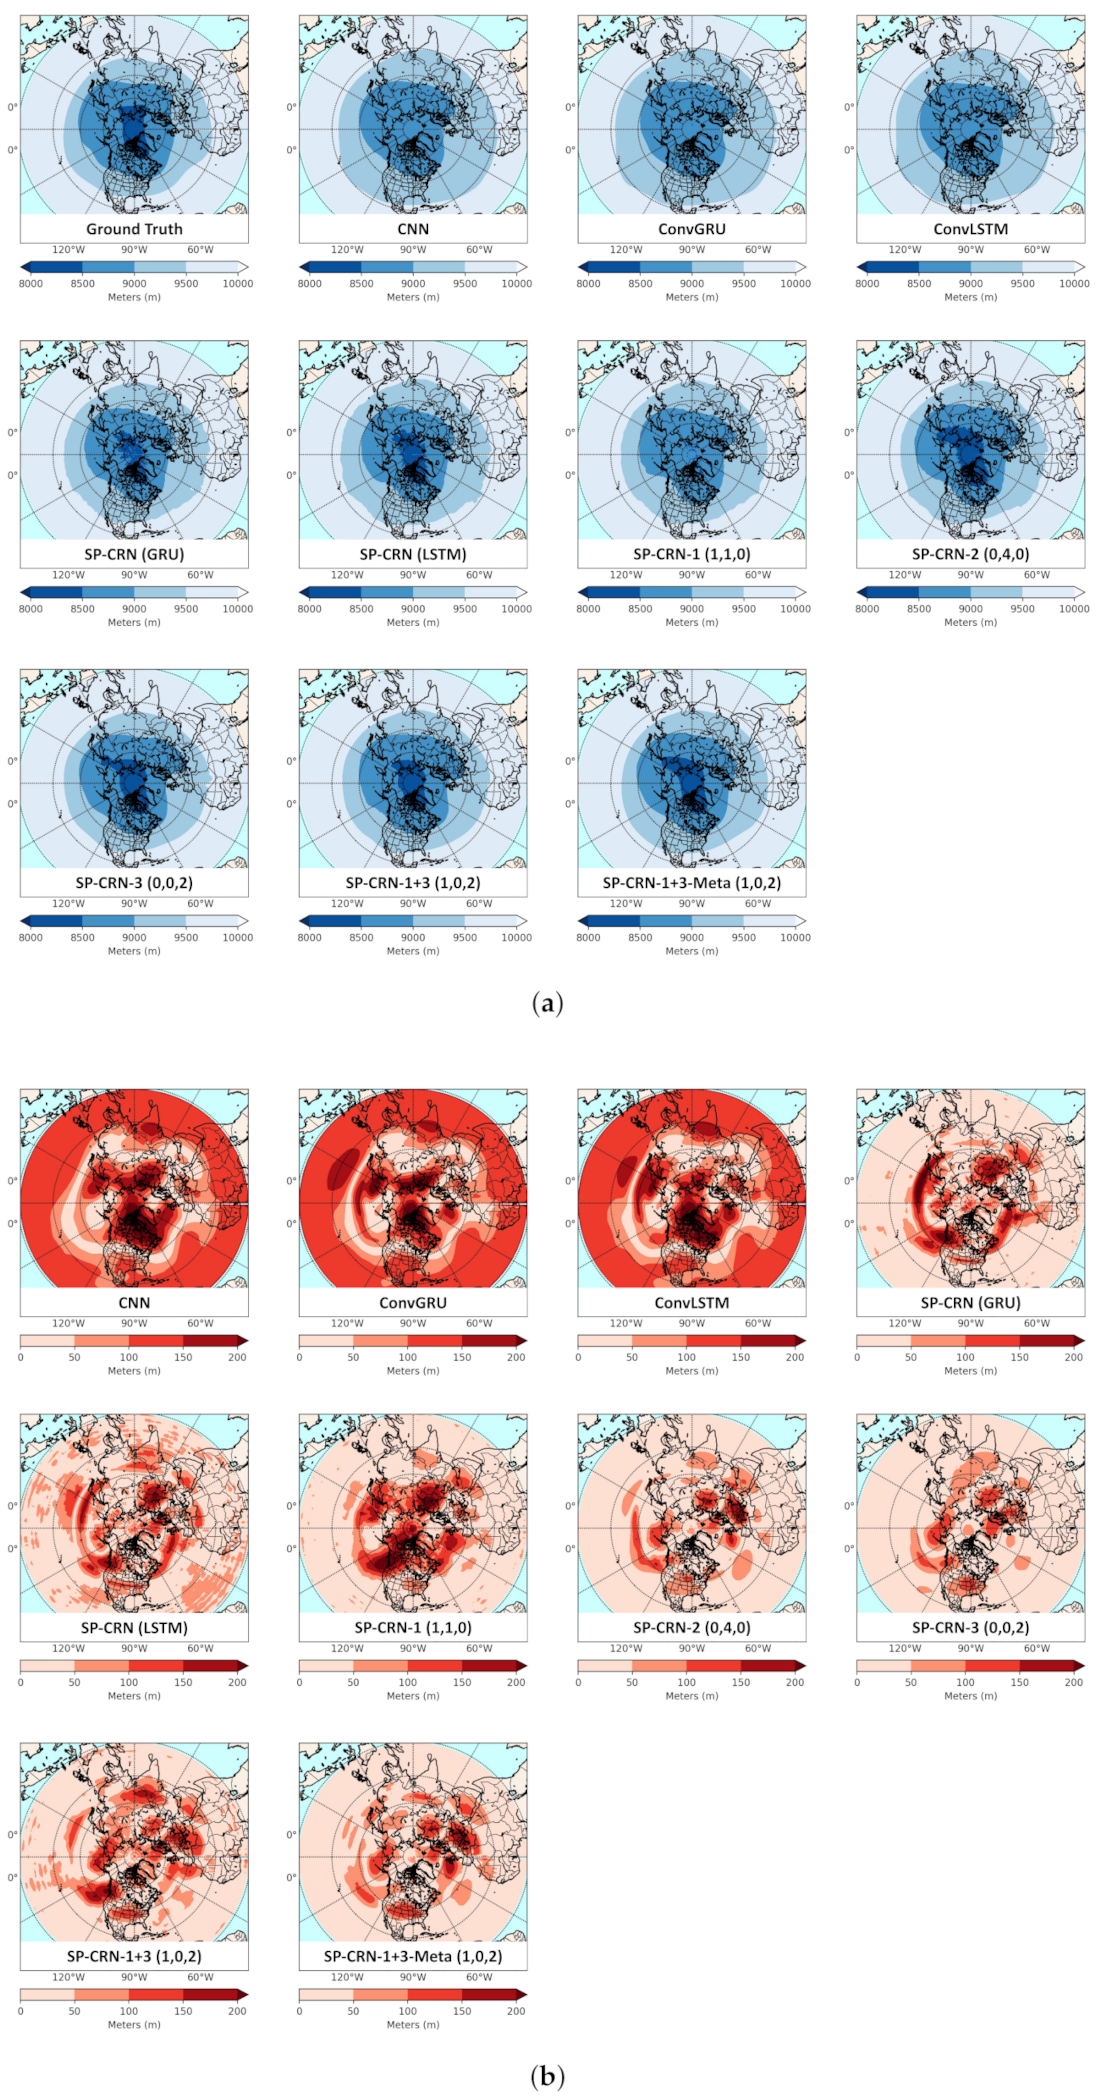
Figure 6 shows the output result and error distribution of February 2017, in which the average RMSE of the month reflected the results of the PRD proposals in Table 2. Figure 6a shows the prediction output, in which all of the methods captured the global pattern compared to the ground truth. However, the low ZH300 value around the North Pole was only captured by the SP-CRN (LSTM) methods that considered the periodic-depth representation. The prediction results indicated that the periodicity component helped the models capture a wider range of ZH300 values. Moreover, the periodic-depth representation was more important than the nearby-time representation for capturing the lowest peak value.
Figure 6b shows the spatial error distribution using the absolute error between ground truth and prediction results. The CNN, ConvGRU, and ConvLSTM results showed a large area of high error (100–150 m) around the tropical area. However, there was only a small error on the subtropical area of the CNN, ConvGRU, and ConvLSTM. Thus, the yearly change of this area was not much, which did not show a huge advantage for the model considering the periodicity components. The models that considered periodicity components, on the other hand, showed a much smaller error in the tropical area. The SP-CRN (GRU), SP-CRN (LSTM), and SP-CRN-1 could not capture the peak of low values in Figure 6a, in which they represented the high error distribution around the North Pole in Figure 6b. The SP-CRN-2 and SP-CRN-3, which considered only periodic-depth representation, showed some small area of high error distribution even when comparing SP-CRN-1+3 and SP-CRN-1+3-Meta with lower RMSE.

5.1.5. Attention Weight Analysis

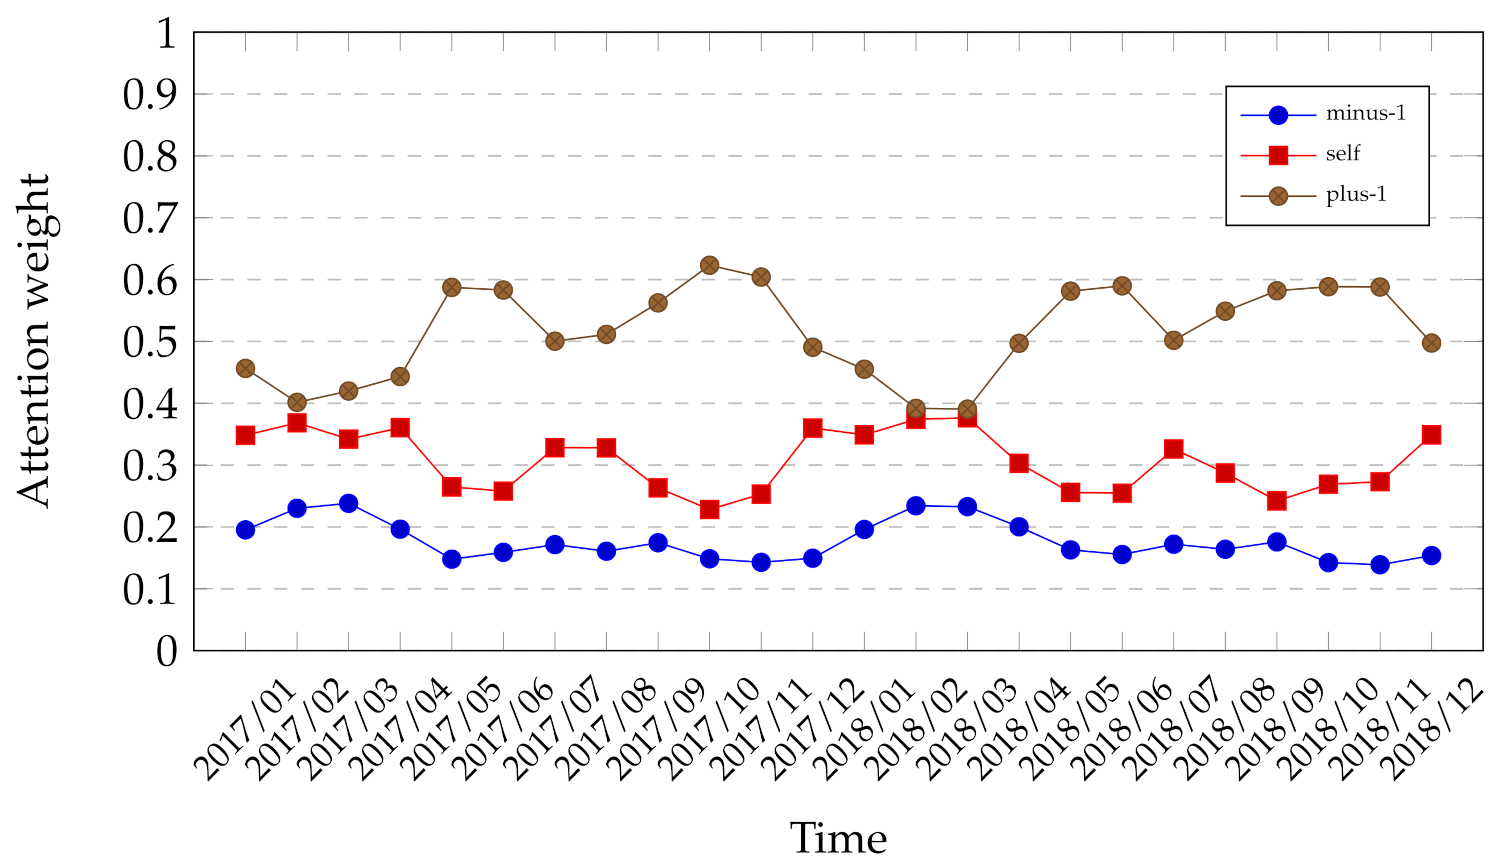
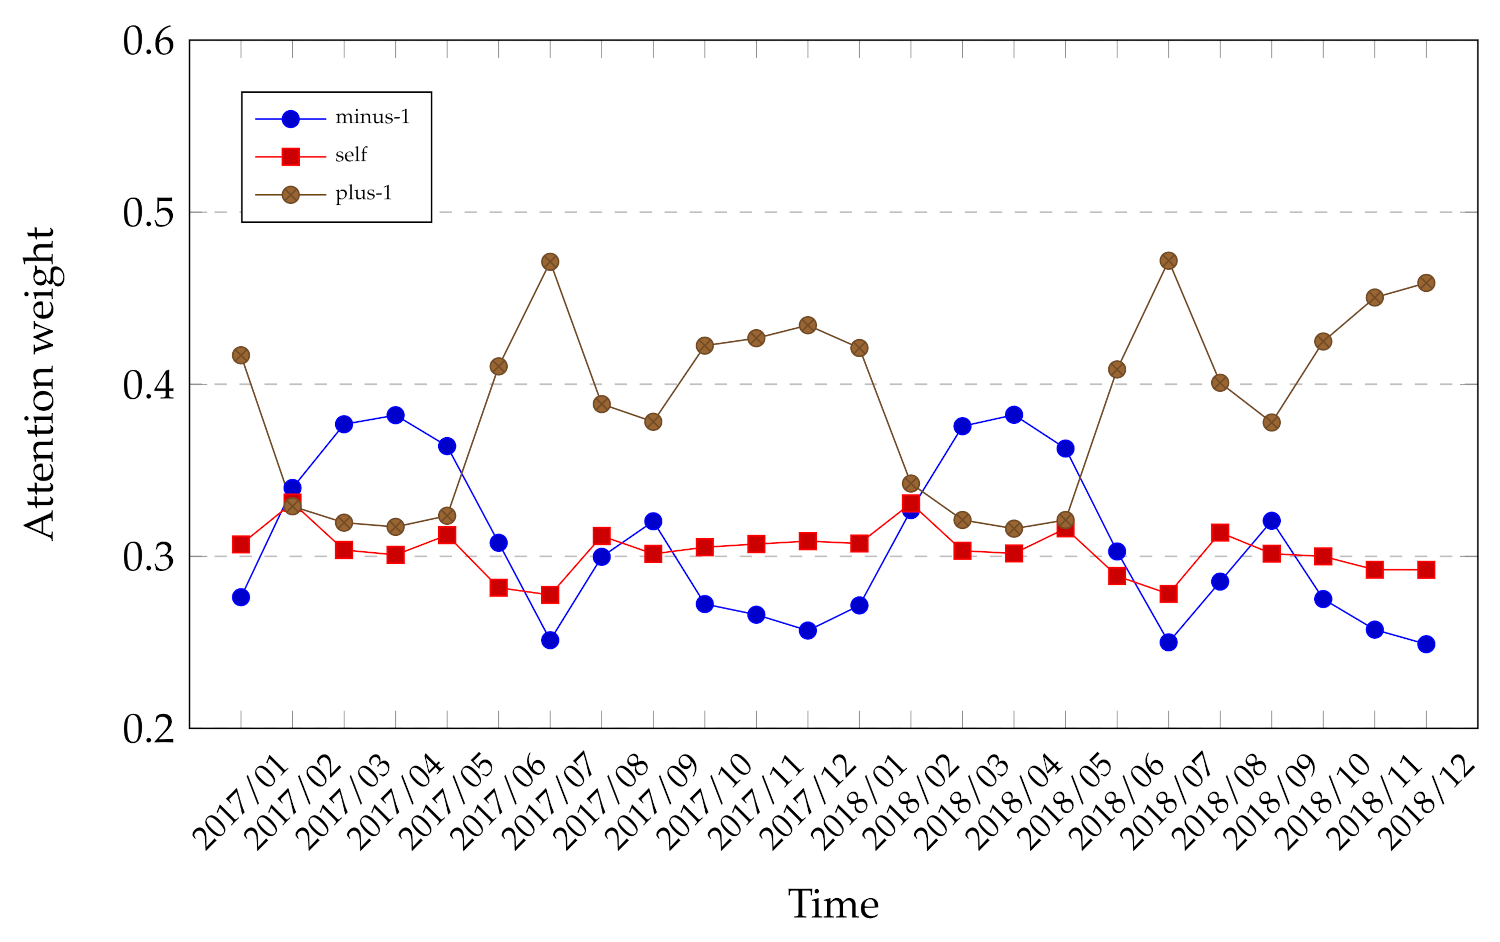
We analyzed the weight in the attention module (Section 3.5), which indicated the importance of the periodic representation collected in the PRD. Figure 7 shows the attention weight of the SP-CRN-1 (1,1,0) model, which was the best setting in SP-CRN-1 of the ZH300 prediction. The phase of periodicity for one prior periodic cycle for one month ahead (plus-1) was more important than the for same (self) or previous month (minus-1), respectively. The attention weight of plus-1 was high in May and September but low in February, while the attention weight for self was the opposite. The minus-1 was smooth for all phases, indicating the same amount of importance for every month of the ZH300 prediction.
Figure 8 shows the attention weight for the ZH300 prediction with the SP-CRN-2 (0,4,0) model. The periodic cycle of prior 1–4 years was considered together by the attention module. The overall weights were almost equal among the different depths between the weight of 0.1 to 0.4 excepts depth-4, which indicated the importance of the fourth prior year over the other years. However, depth-4 did not show the same periodic pattern in 2017 and 2018. The depth-3 showed a similar pattern with the phase shift which had the highest value in February 2017, but in 2018, the highest value was in March. The lowest value of depth-3 in 2017 was in September, but in 2018 the lowest value was in November. The attention weight dropped drastically from August to September in 2017 and 2018, but the difference in August was slightly different. In summary, depth-4 of the SP-CRN-2 (0,4,0) attention weights pattern had the highest impact while depth-3 had the steadiest.
SP-CRN-3 (0,0,2) was the best setting for PRD-3 with a periodic-depth of two. The depth of 2 with a first-order derivative had only single weight to consider, so the attention weight analysis was not necessary.

5.2. Results on SST

5.2.1. Input Sequence Length

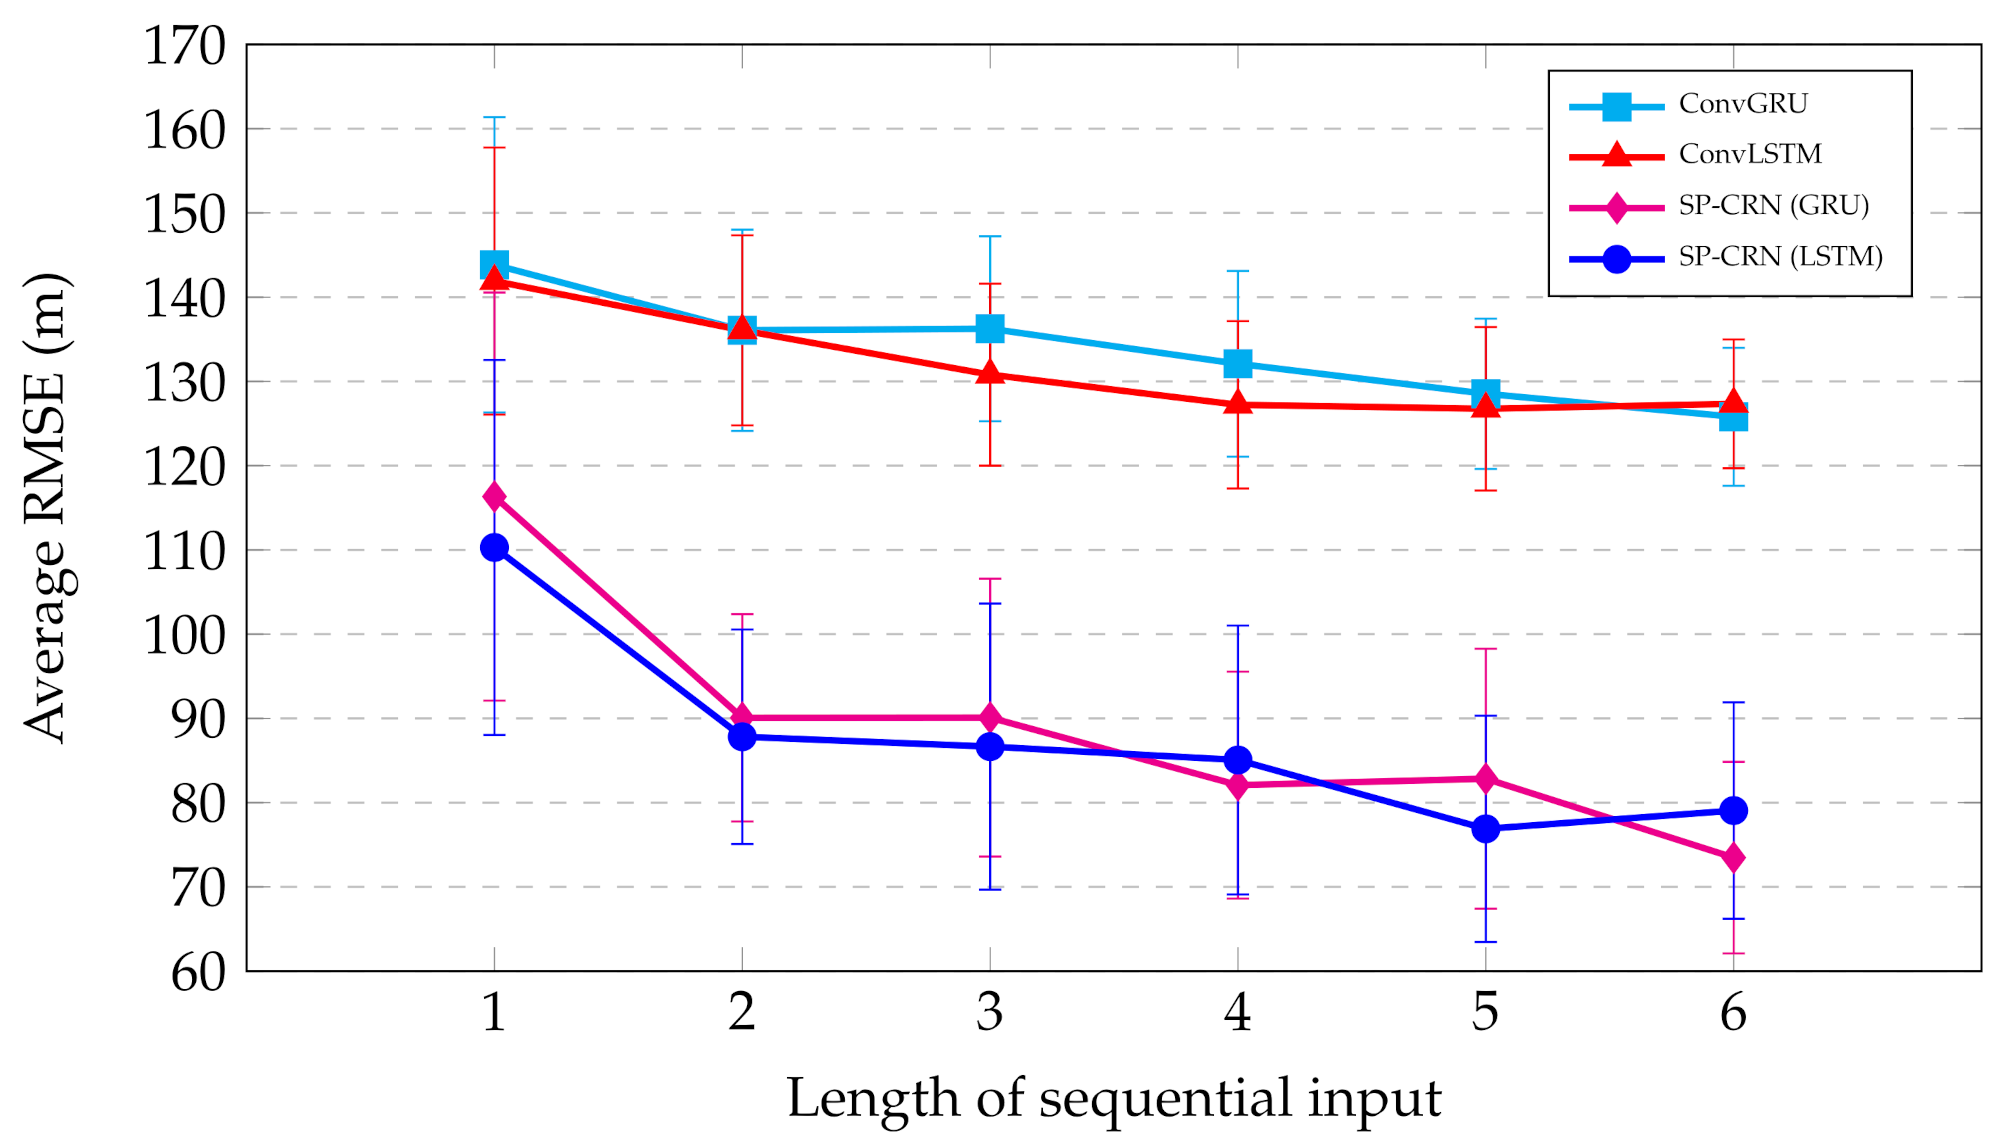
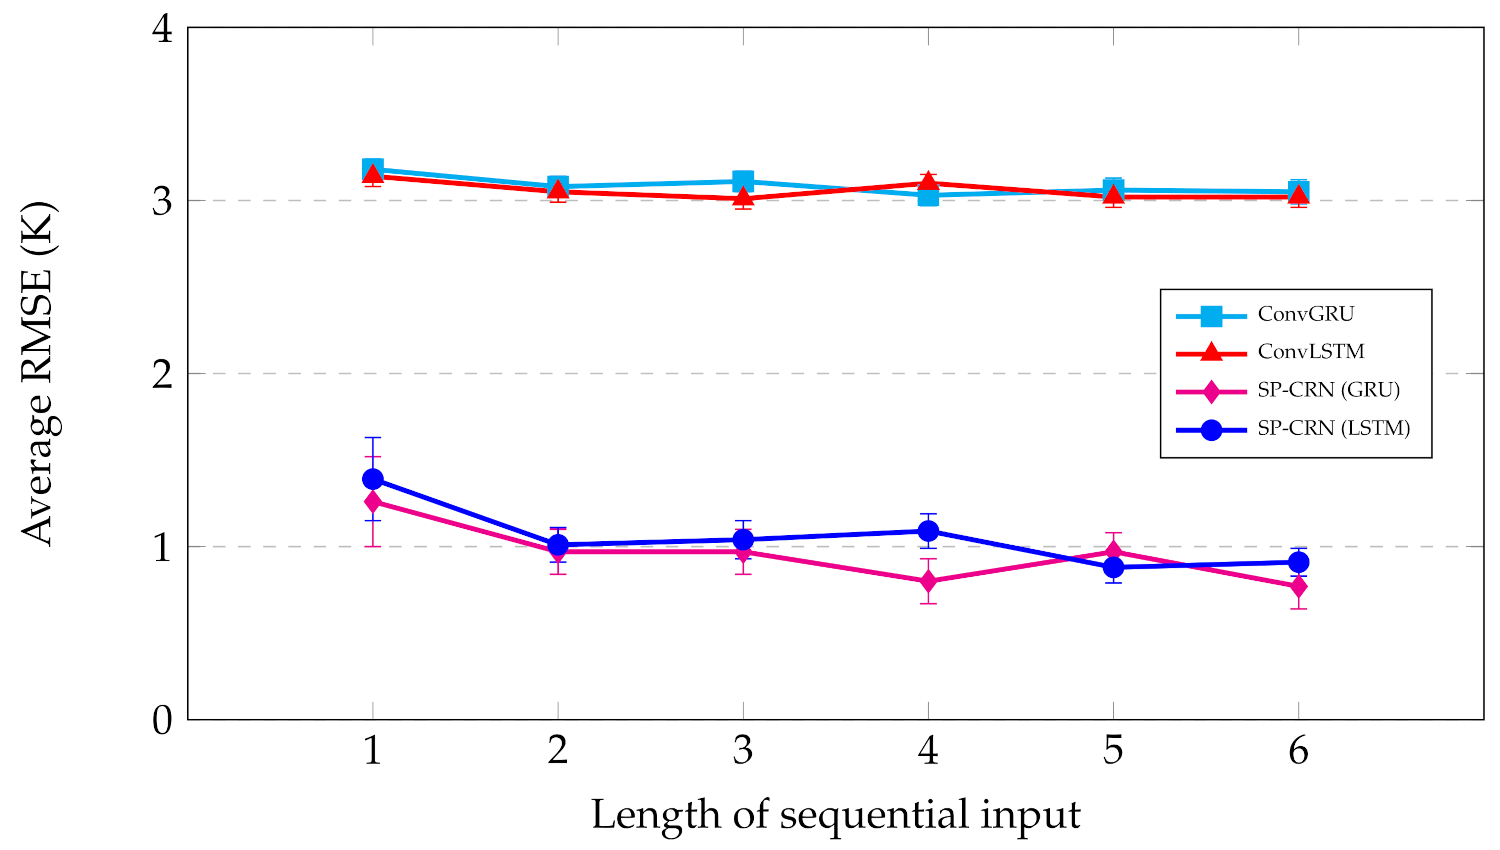
This experiment indicated the performance of comparison methods by considering the length of the sequential input. Figure 9 shows the average RMSE from a sequence length of one to six. The ConvGRU and the ConvLSTM showed the competitive results as did the SP-CRN (GRU) and SP-CRN (LSTM), which used the zero nearby-time representation as the periodicity component, which can improve prediction accuracy of base models by the SST value of around two K. The increasing input sequence length slightly decreased the RMSE of the SP-CRN (GRU) and the SP-CRN (LSTM) for SST prediction. Except for the length of one compared to two, the RMSE dropped significantly. The results demonstrated the superiority of the periodicity component over the base models. However, the length of the sequential input improved the prediction accuracy slightly.

5.2.2. PRD Types

We selected the input sequence length of five for this experiment as the SP-CRN had the lowest RMSE of 0.86 K in the previous experiment (Figure 9). Table 3 shows the results of the three proposals compared with different settings for SP-CRN. The results for SP-CRN-1 were slightly better than for SP-CRN-1 (0,1,0) (baseline). The best result was for SP-CRN-1 (1,1,0) with an RMSE of 0.79 K. The SP-CRN-2 results indicated that the importance of a prior periodic cycle of more than four years was almost identical for an SST prediction. All the settings of SP-CRN-3 outperformed the baseline result, for which SP-CRN-3 (0,0,2) had the best RMSE of 0.55 K, and the first-order derivative played an important role. The results showed that SP-CRN-2 with more than four years and SP-CRN-3 with the depth of two drastically improved prediction accuracy. In summary, the order of the effectiveness of SP-CRN in periodicity utilization for an SST prediction was PRD-3 over PRD-2 and PRD-1.

5.2.3. Combination of PRD Types and Meta-Data

We mixed the best setting of each proposal with a previous experiment (Table 3). These are SP-CRN-1 (1,1,0), SP-CRN-2 (0,6,0), and SP-CRN-3 (0,0,2). All the combinations of mixed proposal are SP-CRN-1+2 (1,6,0), SP-CRN-1+3 (1,0,2), SP-CRN-2+3 (0,6,2), and SP-CRN-1+2+3 (1,6,2). Table 4 shows the results of all the methods along with their best settings. SP-CRN-1+3 (1,0,2) was the best of all mixed proposals with an RMSE of 0.56 K, which was no statistical difference to SP-CRN-3 (0,0,2) (baseline). Mixing the proposals produced no accuracy improvement from baseline. Meanwhile, the metadata component was added to SP-CRN-1+3 (1,0,2) as shown in Equation (15) to indicate its performance for an SST prediction of the best mixed proposal. The metadata component of SP-CRN-1+3-Meta (1,0,2), on the other hand, demonstrated its superiority by improving prediction accuracy with an RMSE of 0.43 K and a small SD compared to SP-CRN-1+3 (1,0,2) (baseline).

5.2.4. Spatial Distribution Analysis

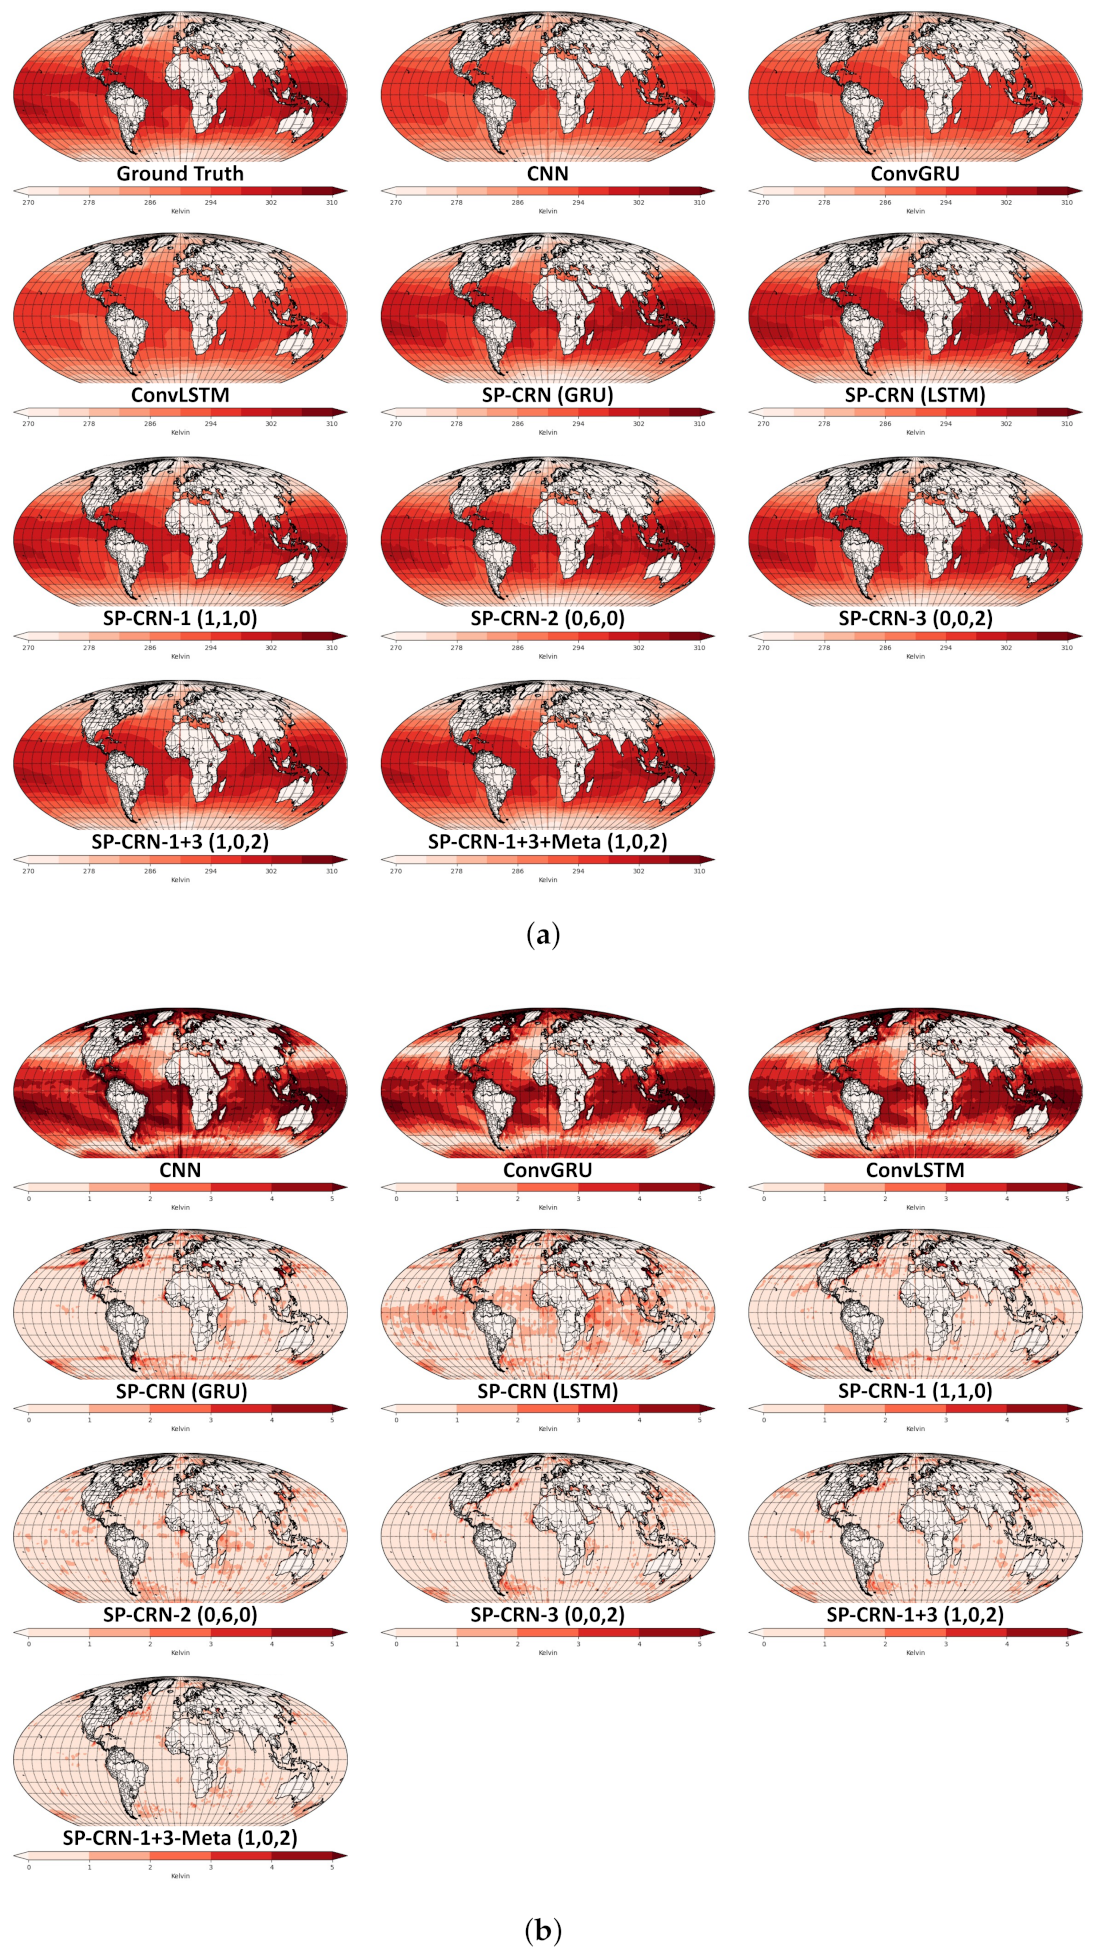
Figure 10 shows the output result and error distribution of January 2018 that reflects the order of the SP-CRN results in Table 4. Figure 10a shows the prediction output in which the methods that use periodicity components can capture changes in high and low temperature. Compared to the CNN, the ConvGRU, and ConvLSTM raely captured the Pacific Ocean’s high temperature. Only the smooth change pattern was presented in the prediction output.
Figure 10b shows the error distribution of comparison methods. The CNN, ConvGRU, and ConvLSTM showed that the extremely high temperature (Pacific Ocean) and low temperature (North and South Pole) have high error distribution, but for the model, considering the periodicity, it was not much different. SP-CRN (LSTM) showed a higher error distribution in more areas than the SP-CRN (GRU) and SP-CRN variant methods.

5.2.5. Attention Weight Analysis

Figure 11 shows the attention weight of SP-CRN-1 (1,1,0) which is the best result in the SP-CRN-1 settings. The periodic pattern for all phases was clear, similar to the pattern between 2017 and 2018. Only the second peak on plus-1 of November–December was slightly different. The plus-1 and minus-1 had occasional importance according to some months, while the attention weight of self was smooth every month. The similar periodic pattern of two years indicated a similar amount of importance in the same periodicity phase.
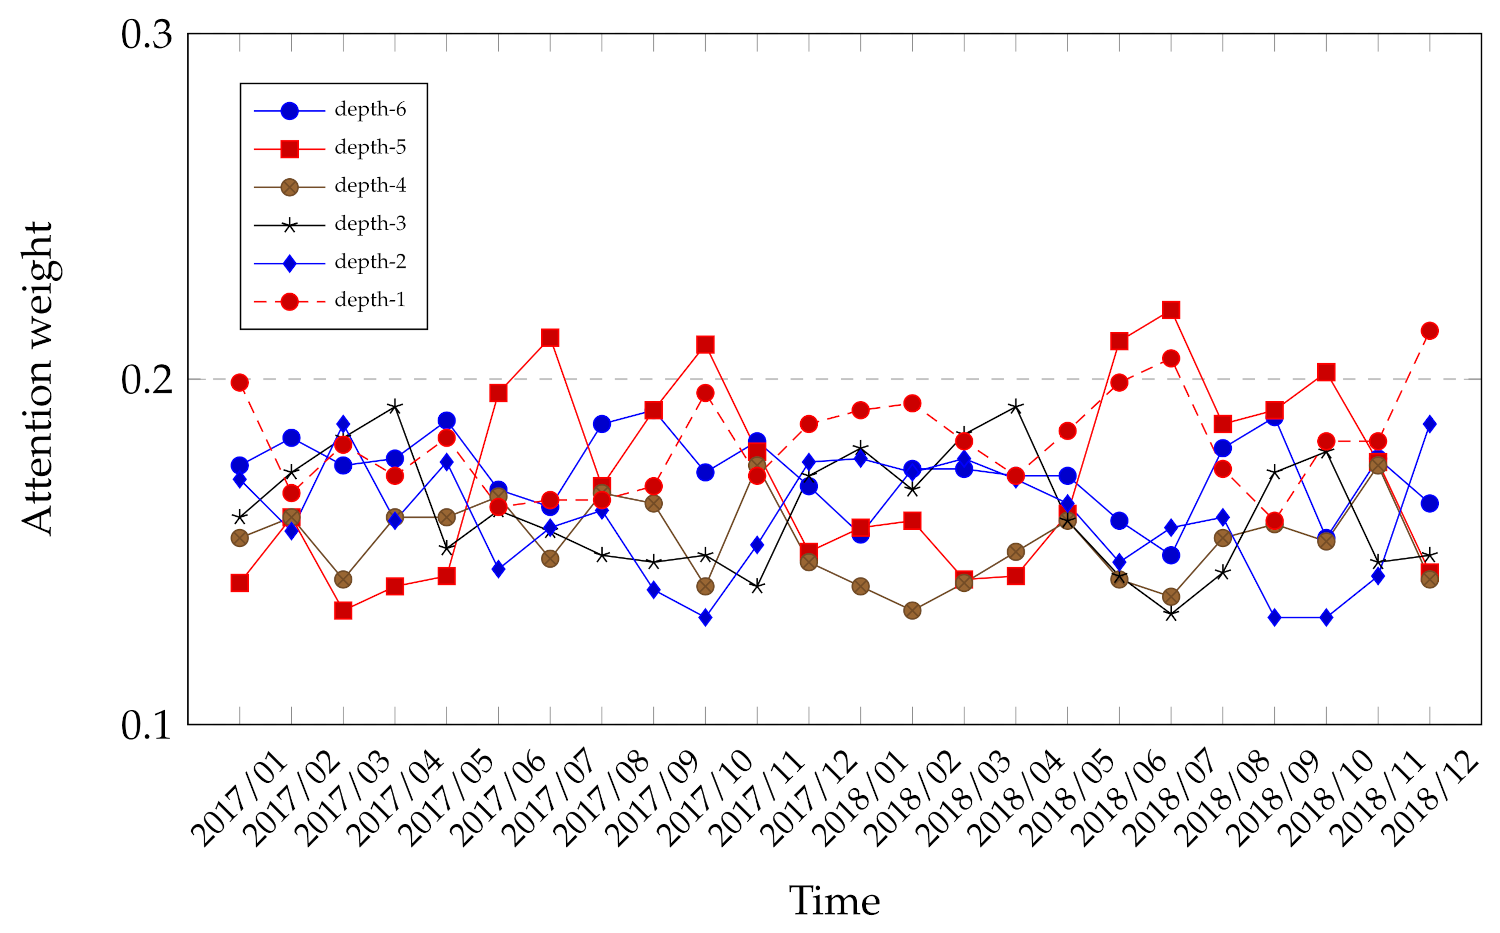
We then analyzed the attention weight of SP-CRN-2 (0,6,0) because it had the best performance compared to its settings. Figure 12 shows the attention weight of SP-CRN-2 (0,6,0) which showed the importance of periodic-depth from one to six years of a periodic cycle. The overall weights were about 0.1–0.2 for all months, which was about the average of six weights—0.167, excepts June and July for depth of five.
SP-CRN-3 (0,0,2) performed the best in the PRD-3 setting, however, it could not be analyzed because it had a single representation.

6. Discussion

First, a clear outcome of this study is that SP-CRN-1 (1,1,0) prediction results of ZH300 and SST are the best among the PRD-1. Considering only nearby one month of PRD-1 can indicate that the phase shifts of periodicity have occurred in the range of one month. During a season (a term of three months), climate variables may have a similar changing tendency. In addition, for ZH300 (Figure 7), plus-1 and self show obvious opposite relationship, while for SST (Figure 11), plus-1 and minus-1 indicate opposite relationship, which may reflect the time-scale of persistence of each change. Second, the SP-CRN-2 (0,4,0), which considers the prior periodic cycle of four years, turns out the best prediction accuracy in PRD-2 of ZH300, and the drastic accuracy improvement when considering for more than four years of SST. Quasi-biennial and ENSO time-scale variations [54] are a possible cause of the four year periodic cycle that is occurred in SP-CRN-2 results.
Meanwhile, our proposed SP-CRN model has some limitations to consider. First, depending on the property of climate variable, we need to find the best combination of PRD type and its parameter. Second, this study considers the monthly data as the time resolution and the spatial input size of the Northern Hemisphere and the entire globe for the global scale forecasting. If we want the higher time resolution, the larger size in PRD (e.g., array size of 365 for daily data) is needed that consumes the computational and memory resources. Third, it is possible to extend the SP-CRN to multi-scale periodicity as the original Periodic-CRN does (i.e., daily and weekly). However, multi-scale such as daily and yearly periodicity causes huge PRD as well. Therefore, some embedding on PRD to low dimension is needed.

7. Conclusions

In this paper, we adopted the Periodic-CRN model to use the periodicity component for climate forecasting, and proposed a Soft Periodic-CRN (SP-CRN) with three types of periodic representation dictionaries (PRD)—nearby-time (PRD-1), periodic-depth (PRD-2), and periodic-depth differencing (PRD-3) representation—to overcome the phase shift and non-stationarity of periodic patterns. The experiments were conducted to perform periodicity on ZH300 and SST of the ERA-Interim dataset. The results showed the superiority of periodicity on SP-CRN (GRU) and SP-CRN (LSTM) over their base models (ConvGRU and ConvLSTM) in every length of sequential input. Furthermore, our PRD proposals showed that the effectiveness of SP-CRN in PRD-3 over PRD-2 and PRD-1, respectively, for ZH300 and SST predictions. Considering only the periodic-depth of two in PRD-3, drastically improved prediction accuracy. Moreover, the mixed proposal of SP-CRN-1+3 (1,0,2) slightly improved ZH300 prediction accuracy from their base models. The results of ZH300 and SST also showed that prediction accuracy improved when the PRD-2 considered the prior periodic cycle of four years. This may have indicated that our PRD-2 proposal could capture the four-year periodic cycle of ENSO. Lastly, in the attention weight analysis, the importance of one-month ahead of one prior periodic cycle had the most impact on the prediction.
The findings of this research may lead to future work in using periodicity in a spatiotemporal climate forecasting model. Our proposed method can be applied to multiple resolutions of periodicity as the original Periodic-CRN. Furthermore, we will investigate more in attention weight of the periodicity.

Author Contributions

Conceptualization, K.-I.F. and T.T.; methodology, E.P. and K.-I.F.; software, E.P.; validation, E.P. and K.-I.F.; formal analysis, E.P.; investigation, E.P.; resources, E.P.; data curation, E.P.; writing—original draft preparation, E.P.; writing—review and editing, K.-I.F., T.M. and T.T.; visualization, E.P.; supervision, K.-I.F., T.M., and M.N.; project administration, K.-I.F.; funding acquisition, K.-I.F. All authors have read and agreed to the published version of the manuscript.

Funding

This work was supported in part by the Network Joint Research Center for Materials and Devices and by JSPS KAKENHI Grant Number 19K22876.

Institutional Review Board Statement

Not applicable.

Informed Consent Statement

Not applicable.

Data Availability Statement

Publicly available datasets were analyzed in this study. This data can be found here: https://apps.ecmwf.int/datasets/data/interim-full-moda/levtype=pl/, accessed on 10 May 2021.

Conflicts of Interest

The authors declare no conflict of interest. The funders had no role in the design of the study; in the collection, analyses, or interpretation of data; in the writing of the manuscript, or in the decision to publish the results.

References

  1. Rasp, S.; Dueben, P.D.; Scher, S.; Weyn, J.A.; Mouatadid, S.; Thuerey, N. WeatherBench: A Benchmark Data Set for Data-Driven Weather Forecasting. J. Adv. Model. Earth Syst. 2020, 12, e2020MS002203. [Google Scholar] [CrossRef]
  2. Ren, X.; Li, X.; Ren, K.; Song, J.; Xu, Z.; Deng, K.; Wang, X. Deep Learning-Based Weather Prediction: A Survey. Big Data Res. 2021, 23, 100178. [Google Scholar] [CrossRef]
  3. Chen, R.; Zhang, W.; Wang, X. Machine Learning in Tropical Cyclone Forecast Modeling: A Review. Atmosphere 2020, 11, 676. [Google Scholar] [CrossRef]
  4. Diez-Sierra, J.; del Jesus, M. Long-term rainfall prediction using atmospheric synoptic patterns in semi-arid climates with statistical and machine learning methods. J. Hydrol. 2020, 586, 124789. [Google Scholar] [CrossRef]
  5. Wang, C.; Hong, Y. Application of Spatiotemporal Predictive Learning in Precipitation Nowcasting. In Proceedings of the AGU Fall Meeting Abstracts, Washington, DC, USA, 10–14 December 2018; Volume 2018, p. H31H-1988. [Google Scholar]
  6. Wang, B.; Lu, J.; Yan, Z.; Luo, H.; Li, T.; Zheng, Y.; Zhang, G. Deep Uncertainty Quantification: A Machine Learning Approach for Weather Forecasting. In Proceedings of the 25th ACM SIGKDD International Conference on Knowledge Discovery &, Data Mining. Association for Computing Machinery, Anchorage, AK, USA, 4–8 August 2019; pp. 2087–2095. [Google Scholar] [CrossRef]
  7. Yonekura, K.; Hattori, H.; Suzuki, T. Short-term local weather forecast using dense weather station by deep neural network. In Proceedings of the 2018 IEEE International Conference on Big Data (Big Data); 2018; pp. 1683–1690. [Google Scholar] [CrossRef]
  8. Lim, B.; Zohren, S. Time-series forecasting with deep learning: A survey. Philos. Trans. R. Soc. A: Math. Phys. Eng. Sci. 2021, 379, 20200209. [Google Scholar] [CrossRef] [PubMed]
  9. Hochreiter, S.; Schmidhuber, J. Long Short-Term Memory. Neural Comput. 1997, 9, 1735–1780. [Google Scholar] [CrossRef]
  10. Zhou, H.; Aizen, E.; Aizen, V. Constructing a long-term monthly climate data set in central Asia. Int. J. Climatol. 2018, 38, 1463–1475. [Google Scholar] [CrossRef]
  11. Yu, R.; Zheng, S.; Anandkumar, A.; Yue, Y. Long-term Forecasting using Higher Order Tensor RNNs. arXiv 2019, arXiv:1711.00073. [Google Scholar]
  12. Nguyen, D.H.; Kim, J.B.; Bae, D.H. Improving Radar-Based Rainfall Forecasts by Long Short-Term Memory Network in Urban Basins. Water 2021, 13, 776. [Google Scholar] [CrossRef]
  13. Liu, M.; Huang, Y.; Li, Z.; Tong, B.; Liu, Z.; Sun, M.; Jiang, F.; Zhang, H. The Applicability of LSTM-KNN Model for Real-Time Flood Forecasting in Different Climate Zones in China. Water 2020, 12, 440. [Google Scholar] [CrossRef] [Green Version]
  14. Yin, J.; Deng, Z.; Ines, A.V.; Wu, J.; Rasu, E. Forecast of short-term daily reference evapotranspiration under limited meteorological variables using a hybrid bi-directional long short-term memory model (Bi-LSTM). Agric. Water Manag. 2020, 242, 106386. [Google Scholar] [CrossRef]
  15. Shi, X.; Chen, Z.; Wang, H.; Yeung, D.Y.; Wong, W.K.; Woo, W.C. Convolutional LSTM network: A machine learning approach for precipitation nowcasting. In Proceedings of the Advances in Neural Information Processing Systems, Montreal, QC, Canada, 7–12 December 2015; pp. 802–810. [Google Scholar]
  16. Phermphoonphiphat, E.; Tomita, T.; Numao, M.; Fukui, K. A Study of Upper Tropospheric Circulations over the Northern Hemisphere Prediction Using Multivariate Features by ConvLSTM. In Proceedings of the 23rd Asia Pacific Symposium on Intelligent and Evolutionary Systems, Tottori, Japan, 6–8 December 2019; pp. 130–141. [Google Scholar] [CrossRef]
  17. Feldstein, S.B. The dynamics of NAO teleconnection pattern growth and decay. Q. J. R. Meteorol. Soc. 2003, 129, 901–924. [Google Scholar] [CrossRef]
  18. Li, H.; Song, W. Characteristics of Climate Change in the Lancang-Mekong Sub-Region. Climate 2020, 8, 115. [Google Scholar] [CrossRef]
  19. De Grandpré, L.; Tardif, J.C.; Hessl, A.; Pederson, N.; Conciatori, F.; Green, T.R.; Oyunsanaa, B.; Baatarbileg, N. Seasonal shift in the climate responses of Pinus sibirica, Pinus sylvestris, and Larix sibirica trees from semi-arid, north-central Mongolia. Can. J. For. Res. 2011, 41, 1242–1255. [Google Scholar] [CrossRef]
  20. Chen, X.; Zhou, T. Relative role of tropical SST forcing in the 1990s periodicity change of the Pacific-Japan pattern interannual variability. J. Geophys. Res. Atmos. 2014, 119, 13043–13066. [Google Scholar] [CrossRef]
  21. Kane, R. Periodicities, ENSO effects and trends of some South African rainfall series: An update. S. Afr. J. Sci. 2009, 105, 199–207. [Google Scholar] [CrossRef] [Green Version]
  22. Ahmed, N.; Wang, G.; Booij, M.J.; Oluwafemi, A.; Hashmi, M.Z.U.R.; Ali, S.; Munir, S. Climatic Variability and Periodicity for Upstream Sub-Basins of the Yangtze River, China. Water 2020, 12, 842. [Google Scholar] [CrossRef] [Green Version]
  23. Savelieva, N.; Semiletov, I.; Vasilevskaya, L.; Pugach, S. A climate shift in seasonal values of meteorological and hydrological parameters for Northeastern Asia. Prog. Oceanogr. 2000, 47, 279–297. [Google Scholar] [CrossRef]
  24. Wang, Y.; Long, M.; Wang, J.; Gao, Z.; Yu, P.S. Predrnn: Recurrent neural networks for predictive learning using spatiotemporal lstms. In Proceedings of the 31st International Conference on Neural Information Processing Systems; 2017; pp. 879–888. [Google Scholar]
  25. Wang, Y.; Zhang, J.; Zhu, H.; Long, M.; Wang, J.; Yu, P.S. Memory in Memory: A Predictive Neural Network for Learning Higher-Order Non-Stationarity From Spatiotemporal Dynamics. In Proceedings of the 2019 IEEE/CVF Conference on Computer Vision and Pattern Recognition (CVPR); 2019; pp. 9146–9154. [Google Scholar] [CrossRef] [Green Version]
  26. Castro, R.; Souto, Y.M.; Ogasawara, E.; Porto, F.; Bezerra, E. STConvS2S: Spatiotemporal Convolutional Sequence to Sequence Network for weather forecasting. Neurocomputing 2021, 426, 285–298. [Google Scholar] [CrossRef]
  27. Zonoozi, A.; jae Kim, J.; Li, X.L.; Cong, G. Periodic-CRN: A Convolutional Recurrent Model for Crowd Density Prediction with Recurring Periodic Patterns. In Proceedings of the Twenty-Seventh International Joint Conference on Artificial Intelligence, IJCAI-18, International Joint Conferences on Artificial Intelligence Organization, 2018; pp. 3732–3738. [Google Scholar] [CrossRef] [Green Version]
  28. Bahdanau, D.; Cho, K.; Bengio, Y. Neural Machine Translation by Jointly Learning to Align and Translate. arXiv arXiv:1409.0473, 2016.
  29. Kim, S.; Kang, J.S.; Lee, M.; Song, S.K. DeepTC: ConvLSTM Network for Trajectory Prediction of Tropical Cyclone using Spatiotemporal Atmospheric Simulation Data. In Proceedings of the Neural Information Processing Systems Spatiotemporal Workshop; 2018. [Google Scholar]
  30. Kim, S.; Hong, S.; Joh, M.; Song, S.K. DeepRain: ConvLSTM Network for Precipitation Prediction using Multichannel Radar Data. In Proceedings of the International Workshop on Climate Informatics; 2018; pp. 89–92. [Google Scholar]
  31. Kim, S.; Kang, J.S.; Song, S.K.; Park, C.G.; Kim, B.J. DeepRainK: ConvLSTM Network for Precipitation Prediction using Hybrid Surface Rainfall Radar Data. In Proceedings of the International Workshop on Climate Informatics; 2019; pp. 83–86. [Google Scholar]
  32. Van den Oord, A.; Dieleman, S.; Zen, H.; Simonyan, K.; Vinyals, O.; Graves, A.; Kalchbrenner, N.; Senior, A.; Kavukcuoglu, K. WaveNet: A Generative Model for Raw Audio. arXiv 2016, arXiv:1609.03499. [Google Scholar]
  33. Ponnoprat, D. Short-term daily precipitation forecasting with seasonally-integrated autoencoder. Appl. Soft Comput. 2021, 102, 107083. [Google Scholar] [CrossRef]
  34. Adnan, R.M.; Zounemat-Kermani, M.; Kuriqi, A.; Kisi, O. Machine Learning Method in Prediction Streamflow Considering Periodicity Component. In Intelligent Data Analytics for Decision-Support Systems in Hazard Mitigation: Theory and Practice of Hazard Mitigation; Springer: Singapore, 2021; pp. 383–403. [Google Scholar] [CrossRef]
  35. Ali, M.; Deo, R.C.; Downs, N.J.; Maraseni, T. Multi-stage committee based extreme learning machine model incorporating the influence of climate parameters and seasonality on drought forecasting. Comput. Electron. Agric. 2018, 152, 149–165. [Google Scholar] [CrossRef]
  36. Lai, Y.; Dzombak, D.A. Use of the Autoregressive Integrated Moving Average (ARIMA) Model to Forecast Near-Term Regional Temperature and Precipitation. Weather. Forecast. 2020, 35, 959–976. [Google Scholar] [CrossRef]
  37. Williams, B.M.; Hoel, L.A. Modeling and Forecasting Vehicular Traffic Flow as a Seasonal ARIMA Process: Theoretical Basis and Empirical Results. J. Transp. Eng. 2003, 129, 664–672. [Google Scholar] [CrossRef] [Green Version]
  38. Chen, P.; Niu, A.; Liu, D.; Jiang, W.; Ma, B. Time Series Forecasting of Temperatures using SARIMA: An Example from Nanjing. IOP Conf. Ser. Mater. Sci. Eng. 2018, 394, 052024. [Google Scholar] [CrossRef]
  39. Dimri, T.; Ahmad, S.; Sharif, M. Time series analysis of climate variables using seasonal ARIMA approach. J. Earth Syst. Sci. 2020, 129, 1–16. [Google Scholar] [CrossRef]
  40. Zirulia, A.; Brancale, M.; Barbagli, A.; Guastaldi, E.; Colonna, T. Hydrological changes: are they present at local scales? Rendiconti Lincei. Scienze Fisiche e Naturali. 2021, 32, 295–309. [Google Scholar] [CrossRef]
  41. Bouznad, I.E.; Guastaldi, E.; Zirulia, A.; Brancale, M.; Barbagli, A.; Bengusmia, D. Trend analysis and spatiotemporal prediction of precipitation, temperature, and evapotranspiration values using the ARIMA models: case of the Algerian Highlands. Arab. J. Geosci. 2020, 13, 1–17. [Google Scholar] [CrossRef]
  42. Xie, T.; Ding, J. Forecasting with Multiple Seasonality. In Proceedings of the 2020 IEEE International Conference on Big Data (Big Data), Atlanta, GA, USA, 10–13 December 2020; pp. 240–245. [Google Scholar] [CrossRef]
  43. Huang, N.E.; Shen, Z.; Long, S.R.; Wu, M.C.; Shih, H.H.; Zheng, Q.; Yen, N.C.; Tung, C.C.; Liu, H.H. The empirical mode decomposition and the Hilbert spectrum for nonlinear and non-stationary time series analysis. Proc. R. Soc. Lond. Ser. A: Math. Phys. Eng. Sci. 1998, 454, 903–995. [Google Scholar] [CrossRef]
  44. Kong, Y.l.; Meng, Y.; Li, W.; Yue, A.z.; Yuan, Y. Satellite Image Time Series Decomposition Based on EEMD. Remote Sens. 2015, 7, 15583–15604. [Google Scholar] [CrossRef] [Green Version]
  45. Zhou, Y.; Dong, H.; El Saddik, A. Deep Learning in Next-Frame Prediction: A Benchmark Review. IEEE Access 2020, 8, 69273–69283. [Google Scholar] [CrossRef]
  46. Maas, A.L.; Hannun, A.Y.; Ng, A.Y. Rectifier Nonlinearities Improve Neural Network Acoustic Models. In Proceedings of the International Conference Machine Learning, Long Beach, CA, USA, 10–15 June 2013. [Google Scholar]
  47. Tomita, T.; Yamaura, T. A Precursor of the Monthly-Mean Large-Scale Atmospheric Circulation Anomalies over the North Pacific. Sci. Online Lett. Atmos. 2017, 13, 85–89. [Google Scholar] [CrossRef] [Green Version]
  48. Tomassini, L.; Gerber, E.P.; Baldwin, M.P.; Bunzel, F.; Giorgetta, M. The role of stratosphere-troposphere coupling in the occurrence of extreme winter cold spells over northern Europe. J. Adv. Model. Earth Syst. 2012, 4. [Google Scholar] [CrossRef]
  49. Kolstad, E.W.; Breiteig, T.; Scaife, A.A. The association between stratospheric weak polar vortex events and cold air outbreaks in the Northern Hemisphere. Q. J. R. Meteorol. Soc. 2010, 136, 886–893. [Google Scholar] [CrossRef] [Green Version]
  50. Krizhevsky, A.; Sutskever, I.; Hinton, G.E. Imagenet classification with deep convolutional neural networks. Adv. Neural Inf. Process. Syst. 2012, 25, 1097–1105. [Google Scholar] [CrossRef]
  51. Ballas, N.; Yao, L.; Pal, C.; Courville, A. Delving Deeper into Convolutional Networks for Learning Video Representations. arXiv 2016, arXiv:1511.06432. [Google Scholar]
  52. Latif, M.; Grötzner, A. The equatorial Atlantic oscillation and its response to ENSO. Clim. Dyn. 2000, 16, 213–218. [Google Scholar] [CrossRef]
  53. Shiotani, M. Annual, quasi-biennial, and El Niño-Southern Oscillation (ENSO)time-scale variations in equatorial total ozone. J. Geophys. Res. Atmos. 1992, 97, 7625–7633. [Google Scholar] [CrossRef]
  54. Tomita, T. The Longitudinal Structure of Interannual Variability Observed in Sea Surface Temperature of the Equatorial Oceans. J. Meteorol. Soc. Jpn. Ser. II 2000, 78, 499–507. [Google Scholar] [CrossRef] [Green Version]
Figure 1. The conceptual diagram of the proposed PRD in case of monthly representation. Each cell indicates a saved representation for the future reference. Type PRD-1 refers adjacent months of the last year, and types PRD-2 and 3 refer the same month of prior consecutive years.
Applsci 11 09728 g001
Figure 2. The SP-CRN (LSTM) architecture. (a) the CRN component, (b) the PRD, (c) update mechanism, (d) load mechanism, (e) the attention module, and (f) fusion module.
Applsci 11 09728 g002
Figure 3. Examples of the three proposals for the load mechanism to predict the climate variable of July 1999 (index 1 starts from the top left of P). (a) Nearby-Time representation with the nearby representation of 2, (b) Periodic-Depth representation with a depth of 5, and (c) Periodic-Depth-Differencing representation with a depth of 5.
Applsci 11 09728 g003
Figure 4. A sample of the monthly spatial plot of January 2018. (a) The Northern Hemisphere of ZH300 data, where deep blue represents the lower value of ZH300. (b) The entire globe in the spatial grid of SST data, where deep red represents high temperature, and the terrain area (white) is ignored. Note that these projections are just for visualization.
Applsci 11 09728 g004
Figure 5. The average RMSE of the comparison methods in different length of sequential input for ZH300 prediction. The error bar indicates the SD of the RMSE.
Applsci 11 09728 g005
Figure 6. The prediction and error distribution of ZH300 on February 2017 (a) Ground truth and prediction results. (b) Error distribution (absolute error).
Applsci 11 09728 g006
Figure 7. Attention weight on SP-CRN-1 (1,1,0) for ZH300 prediction from the average of five runs. The attention weight of minus-1, self, and plus-1 are the minus one month, the prediction month, and the plus one month of one prior periodic cycle, respectively. The scale is from 0 to 1.
Applsci 11 09728 g007
Figure 8. Attention weight on SP-CRN-2 (0,4,0) for ZH300 prediction from the average of five runs. The attention weight of depth-1 to depth-4 was the value of the prediction month for one to four prior periodic cycles. The scale is from 0.1 to 0.5.
Applsci 11 09728 g008
Figure 9. The average RMSE of comparison methods of different lengths of sequential input for SST prediction. The error bar indicates the SD of the SST.
Applsci 11 09728 g009
Figure 10. The prediction and error distribution of SST on January 2018. (a) Ground truth and prediction results. (b) Error distribution (absolute error).
Applsci 11 09728 g010
Figure 11. Attention weight of SP-CRN-1 (1,1,0) for SST prediction from the average of five runs. The attention weight of minus-1, self, and plus-1 are the minus one month, prediction month, and plus one month of one prior periodic cycle, respectively. The scale is from 0.2 to 0.6.
Applsci 11 09728 g011
Figure 12. Attention weight on SP-CRN-2 (0,6,0) for SST prediction from the average of five runs. The attention weight of depth-1 to depth-6 was the value of prediction month on prior one to six periodic cycle. The scale is from 0.1 to 0.3.
Applsci 11 09728 g012
Table 1. Evaluation of different settings on the ZH300 prediction for SP-CRN with three proposals. The settings ((x, y, z) are the numbers of the nearby-time of PRD-1, periodic-depth of PRD-2, and periodic-depth of PRD-3, respectively. The SP-CRN-1, SP-CRN-2, and SP-CRN-3 indicate each proposal in SP-CRN which was a nearby-time representation, periodic-depth representation, and periodic-depth differencing representation, respectively. The highlighted result in blue is the best prediction accuracy for each proposal, while the gray highlight in the SP-CRN baseline result.
MethodAvg. RMSE (m)SD of RMSE (m)
SP-CRN-1 (0,1,0)76.8913.43
SP-CRN-1 (1,1,0)74.2215.44
SP-CRN-1 (2,1,0)81.6413.89
SP-CRN-1 (3,1,0)84.4217.67
SP-CRN-2 (0,2,0)79.6913.96
SP-CRN-2 (0,3,0)94.8514.05
SP-CRN-2 (0,4,0)70.5812.43
SP-CRN-2 (0,5,0)103.9312.62
SP-CRN-2 (0,6,0)100.7616.23
SP-CRN-3 (0,0,2)67.9711.95
SP-CRN-3 (0,0,3)70.0512.23
SP-CRN-3 (0,0,4)69.5312.16
SP-CRN-3 (0,0,5)68.1212.13
SP-CRN-3 (0,0,6)68.2612.47
Table 2. Evaluation of different settings on the ZH300 prediction for SP-CRN and comparison methods.
MethodAvg. RMSE (m)SD of RMSE (m)
CNN141.7916.54
ConvGRU125.808.19
ConvLSTM126.759.70
SP-CRN (GRU)73.4711.37
SP-CRN (LSTM)76.8913.43
SP-CRN-1 (1,1,0)74.2215.44
SP-CRN-2 (0,4,0)70.5812.43
SP-CRN-3 (0,0,2)67.9711.95
SP-CRN-1+2 (1,4,0)82.8913.85
SP-CRN-1+3 (1,0,2)66.3912.21
SP-CRN-2+3 (0,4,2)88.4410.56
SP-CRN-1+2+3 (1,4,2)80.5911.65
SP-CRN-1+3-Meta (1,0,2)50.2712.77
Table 3. Evaluation of different settings on SST predictions for SP-CRN with three proposals. The highlighted result in blue shows the best prediction accuracy for each proposal, while the highlight in gray is the SP-CRN baseline result.
MethodAvg. RMSE (K)SD of RMSE (K)
SP-CRN-1 (0,1,0)0.880.09
SP-CRN-1 (1,1,0)0.790.10
SP-CRN-1 (2,1,0)0.820.08
SP-CRN-1 (3,1,0)0.840.12
SP-CRN-2 (0,2,0)1.290.11
SP-CRN-2 (0,3,0)0.960.05
SP-CRN-2 (0,4,0)0.630.06
SP-CRN-2 (0,5,0)0.630.05
SP-CRN-2 (0,6,0)0.610.05
SP-CRN-3 (0,0,2)0.550.04
SP-CRN-3 (0,0,3)0.560.06
SP-CRN-3 (0,0,4)0.570.05
SP-CRN-3 (0,0,5)0.570.05
SP-CRN-3 (0,0,6)0.560.05
Table 4. Evaluation of different settings on the SST prediction for SP-CRN and comparison methods.
MethodAvg. RMSE (K)SD of RMSE (K)
CNN3.320.05
ConvGRU3.030.06
ConvLSTM3.020.06
SP-CRN (GRU)0.770.13
SP-CRN (LSTM0.880.09
SP-CRN-1 (1,1,0)0.790.10
SP-CRN-2 (0,6,0)0.610.05
SP-CRN-3 (0,0,2)0.550.04
SP-CRN-1+2 (1,6,0)0.740.08
SP-CRN-1+3 (1,0,2)0.560.05
SP-CRN-2+3 (0,6,2)0.650.05
SP-CRN-1+2+3 (1,6,2)0.610.05
SP-CRN-1+3-Meta (1,0,2)0.430.03
Publisher’s Note: MDPI stays neutral with regard to jurisdictional claims in published maps and institutional affiliations.