Article

Parameter Estimation and Application of Anisotropic Yield Criteria for Cylindrical Aluminum Extrusions: Theoretical Developments and StereoDIC Measurements

Department of Mechanical Engineering, University of South Carolina, 300 Main Street, Columbia, SC 29208, USA
*
Author to whom correspondence should be addressed.
Appl. Sci. 2021, 11(20), 9701; https://doi.org/10.3390/app11209701
Submission received: 20 September 2021 / Revised: 10 October 2021 / Accepted: 14 October 2021 / Published: 18 October 2021
(This article belongs to the Special Issue Structural Integrity of Aluminium Alloys)

Abstract

:
Theoretical and experimental studies are presented to characterize the anisotropic plastic response under torsion loading of two nominally identical aluminum Al6061-T6 extruded round bars. Theoretical models are developed using isotropic (Von Mises 1913) and anisotropic (Barlat 1991) yield criteria, along with isotropic strain hardening formulae, to model post-yield behavior under simple torsion loading. For the case of simple shear loading, incremental plasticity theory is used to determine the theoretical elastic, plastic, and total shear strains. A set of experiments are performed to calibrate Barlat’s 1991 yield function. Several specimens are extracted at different orientations to the longitudinal direction of each round Al6061-T6 bar and tested under uniaxial tension and simple torsion to optimally determine all anisotropic (Barlat 1991) yield function parameters. During loading, Stereo Digital Image Correlation (DIC) is used to quantify surface deformations for the torsion experiments and a baseline tension specimen to identify and correct measurement anomalies. Results show the isotropic yield model either underestimates or overestimates the experimental shear strains for both extrusions. Conversely, results using the Barlat 1991 anisotropic yield criteria are in excellent agreement with experimental measurements for both extrusions. The presence of significant differences in the anisotropic parameters for nominally similar extrusions confirms that plastic anisotropy is essential for the accurate prediction of mechanical behavior in longitudinally extruded Al6061-T6 bars.

1. Introduction

Aluminum alloys are used extensively in a wide range of industries, including automobile, aerospace, transportation, and civilian infrastructure, with the material undergoing various processes such as rolling, extrusion, and forging to manufacture a component [1,2,3]. Depending upon the manufacturing operation, anisotropy can arise due to variations in as-manufactured material [4,5,6]. To predict the response of such materials, well-known isotropic yield functions based on the work of Tresca [7] and Von Mises [8] have been modified by several researchers such as Hill [9,10,11,12], Hosford [13], Gotoh [14], Logan and Hosford [15], Barlat and Lian [16], Barlat et al. [17,18,19,20,21], Karafillis and Boyce [22], Bron and Besson [23], Cazacu et al. [24], Plunkett et al. [25] and Bai and Wierzbicki [26]. The widely used quadratic yield criterion of Hill [9,10] includes six material parameters that are obtained from uniaxial tensile and shear experiments for the three principal directions. Later, Hill [11,12] developed a modified version of the earlier formulation (Hill [9,10]) to model in-plane anisotropy for sheet metals. Barlat et al. [16,17,18,19,20] proposed different sets of anisotropic yield functions for metals, such as Yld91, Yld2000-2d, Yld 2004-8d, and Yld2004-18p. In particular, the Yld91 (Barlat [17]) criterion requires six parameters in the yield function formulation to model the material anisotropy. Later, Barlat [20,21] extended this approach to linear transformation-based anisotropic yield functions, including Yld2004-8d and Yld2004-18p.
Fourmeau et al. [27] performed numerical simulations and experiments to investigate the effect of plastic anisotropy on the mechanical behavior of a high-strength AA7075-T651 aluminum plate. In their work, the authors utilized the Yld2004-18p anisotropic yield function (Barlat [21]) to show that the experimentally observed anisotropic behavior of the plate could be modeled effectively. Tardif and Kyriakides [28] performed 3D finite element simulations using both anisotropic (Yld2004-3D) and isotropic (Von Mises, [8], and Hosford [13] models to predict the experimental material response of Al 6061-T6 sheet metal undergoing large strains. In their work, the anisotropy of the Al 6061-T6 sheet was characterized by a set of uniaxial and biaxial tests conducted in parallel using the 3D Yld2004-18P (Barlat [21]) yield criterion. The predicted material hardening behavior was assessed by comparing both measured and simulation-based force-displacement response, with results showing the Yld2004-18P model matches very well with the experimental result while the isotropic models have shown considerable deviation from the measurements. Additional relevant aluminum material investigations, including both experimental and numerical, can be found in the publications of Korkolis and Kyriakides [29,30,31,32], Korkolis et al. [33], Giagmouris et al. [34], Seidt and Gilat [35], Zhang [36], Kuwabara et al. [37], Esmaeilpour et al. [38,39], Pahlevanpour et al. [40], Mooney et al. [41], and Kondori [42], Rahmaan et al. [43] and their references.
Sutton et al. [44] presented an approach based on incremental plasticity theory to determine the stresses and associated elastic and plastic strains from the total strain measured on a sample surface undergoing nominally plane stress or plane strain conditions. Kim et al. [45] developed and applied the virtual fields method (VFM) to determine the constitutive parameters by calculating the stress fields from the heterogeneous strain fields, showing that the hardening law is important to predict the stress-strain relationship. More background on this subject can be found in Pannier et.al. [46], Avril et al. [47], Coppieters et al. [48], and Coppieters & Kuwabara [49].
In addition to yield criteria, several researchers including Ludwik [50], Hollomon [51], Voce [52], Swift [53], and Ludwigson [54] have focused on the flow rule and work hardening behavior for nominally isotropic materials, with limited studies [Stoughton and Yoon [55], Rousselier et al. [56]] regarding the effect of anisotropy on strain hardening in aluminum alloys.
The material extrusion process is important in different industries. The extrusion-based layered deposition is among the most commonly used additive manufacturing technologies due to its manufacturing flexibility, capability, low cost, and relative simplicity. More on the material extrusion process and behavior of materials produced by extrusion-based additive manufacturing can be found Feng et al. [57], Vyavahare et.al [58], Jiang et al. [59], Parpala et al. [60], and Kaill et al. [61].
As many machine parts and other devices are subjected to torsion, it is very important to learn the mechanical behavior of metal under torsion loading. There have been limited studies investigating theoretical elastic-plastic strain considering anisotropic and isotropic yielding behavior of extruded Al6061-T6 under torsion loading. In this study, the authors employ incremental plasticity with the conjugate work principle to develop the theoretical equations for predicting the elastic, plastic, and total strains due to the application of simple torsional shear stress for both isotropic and anisotropic yield criteria, (e.g., Von Mises [8] and Barlat Yld91 [17]), resulting in separate theoretical models (All six Barlat Yld91 anisotropic yield criteria parameters for each of the Al6061-T6 materials are determined through (1) uniaxial tension experiments on specimens extracted from different directions in each extrusion, and (2) a simple torsion experiment for a longitudinal cylindrical specimen). Section 2 presents both the theoretical foundations employed to model the anisotropic and isotropic material behavior, along with the procedures employed for model parameter identification using the models. Section 3 provides the material specifications while also describing in detail the experimental considerations to determine anisotropc yield function and hardening parameters in this study. Assuming post-yield strain hardening is isotropic in both models (An assumption that is consistent with those of most previous investigators. Post-yielding hardening parameters are determined from tensile experiments on a specimen extracted from the longitudinal direction in the extrusion). Section 4 provides additional modeling details, along with the predicted stress-strain behavior of the extruded Al-6061 T6 tubular sample. In this section, details regarding the models and comparison of total shear strain using the models and experimental measurements for both the Von Mises [8] and Barlat Yld91 [17] are presented. Section 5 provides additional discussion of results. A Summary and Conclusions for the work are given in Section 6.

2. Background Theory for Yield Functions and Plastic Strain

Since the initiation of macroscopic plastic deformation is associated with the concept of material yielding, the ability to predict yield for a range of multi-axial stress states is an essential component of the analysis and design processes. A general form for the yield function can be written:
F σ i j , ε ¯ p = σ ¯ σ i j κ ε ¯ p
where σ ¯ σ i j represents the effective stress for a given stress state, σ i j ,     κ ε ¯ p is the hardening rule derived from uniaxial tension data and ε ¯ p is the equivalent plastic strain. Employing incremental plasticity, an increment of total strain ( d ε i j ) for any strain component at an arbitrary point can be expressed as the sum of an elastic strain increment ( d ε i j   e ) and a plastic strain increment d ε i j p as follows:
d ε i j = d ε i j e + d ε i j p
The elastic strain increments in Equation (2) can be determined from Hooke’s law, with the elastic response of the tubular specimen experimentally shown to be nominally isotropic (The authors performed multiple tensile experiments for specimens extracted longitudinally and along several radial directions).
d ε i j e = 1 E 1 + υ d σ i j υ d σ k k δ i j
where d σ i j represents an increment of the stress tensor, E is the elastic modulus, υ is Poisson’s ratio and δ i j is the Kronecker delta symbol.
For plastic deformation, increments in plastic work/dissipation ( d W p ) in terms of increments in equivalent plastic ( d ε ¯ p )   strain are employed with an effective stress ( σ ¯ ) and thus connect general multi-axial states to uniaxial experimental results in the following way;
d W p = σ ¯ · d ε ¯ p = σ i j · d ε i j p
In Equations (1) and (4), the effective stress ( σ ¯ = σ ¯ B a ) employed in the Barlat yield function can be written;
σ ¯ = σ ¯ B a = ( 1 2 ) 1 m 3   J 2   1 2 ( { 2 cos 2 θ + π 6 m + 2 cos 2 θ 3 π 6 m + 2 cos 2 θ + 5 π 6 m } ) 1 m
where m is an integer with m = 8 for FCC materials such as aluminum alloys. The parameter θ can be expressed as (The parameter, θ, in Equation (5) is unrelated to rotations associated with coordinate transformations in either plane stress or plane strain),
θ = c o s 1 J 3 J 2 3 2
where J 2 and J 3 are the second and third invariants of the deviatoric stress tensor, S i j . For the Barlat Yld91 [17] anisotropic yield criterion, S i j , J 2 , and J 3 are defined as follows:
S i j = S x S x y S z x S x y S y S y z S z x S y z S z = C B 3 H G H A C 3 F G F B A 3
S i j = c C b B 3 h H g G h H a A c C 3 f F g G f F b B a A 3
J 2 = f F 2 + g G 2 + h H 2 3 + a A c C 2 + c C b B 2 + b B a A 2 54
J 3 = c C b B a A c C b B a A 54 + f g h F G H c C b B f F 2 + a A c C g G 2 + b B a A h H 2 6
In these equations, A = σ y σ z ,     B = σ z σ x ,     C = σ x σ y ,     F = σ y z ,     G = σ z x ,     H = σ x y . The variables a, b, c, f, g, and h are material-specific yield function parameters. For an isotropic material, a = b = c = d = f = g = 1, so that deviations of the parameters from unity indicate the presence of anisotropy in the material response (The Barlat yield function reduces to the Von Mises criterion if m = 2, with a = b = c = f = g = h = 1).
The Von Mises effective stress ( σ ¯ = σ ¯ v M ) for materials undergoing isotropic plasticity can be written.
σ ¯ = σ ¯ v M = 3 2 S i j S i j
Incremental equivalent plastic strain ( d ε ¯ p ) is represented through an isotropic hardening power-law rule for all cases and is modeled as shown in the following equation (Sutton et al. [38]);
σ ¯ ε ¯ p = σ 0 ( ε ε 0 ) 1 n
ε ¯ p σ ¯ = n ( σ ¯ σ 0 ) n 1 1 E
where n is the hardening parameter, σ 0 is the initial yield stress and ε 0 is the corresponding strain.

3. Experimental Investigations and Parameters Determination

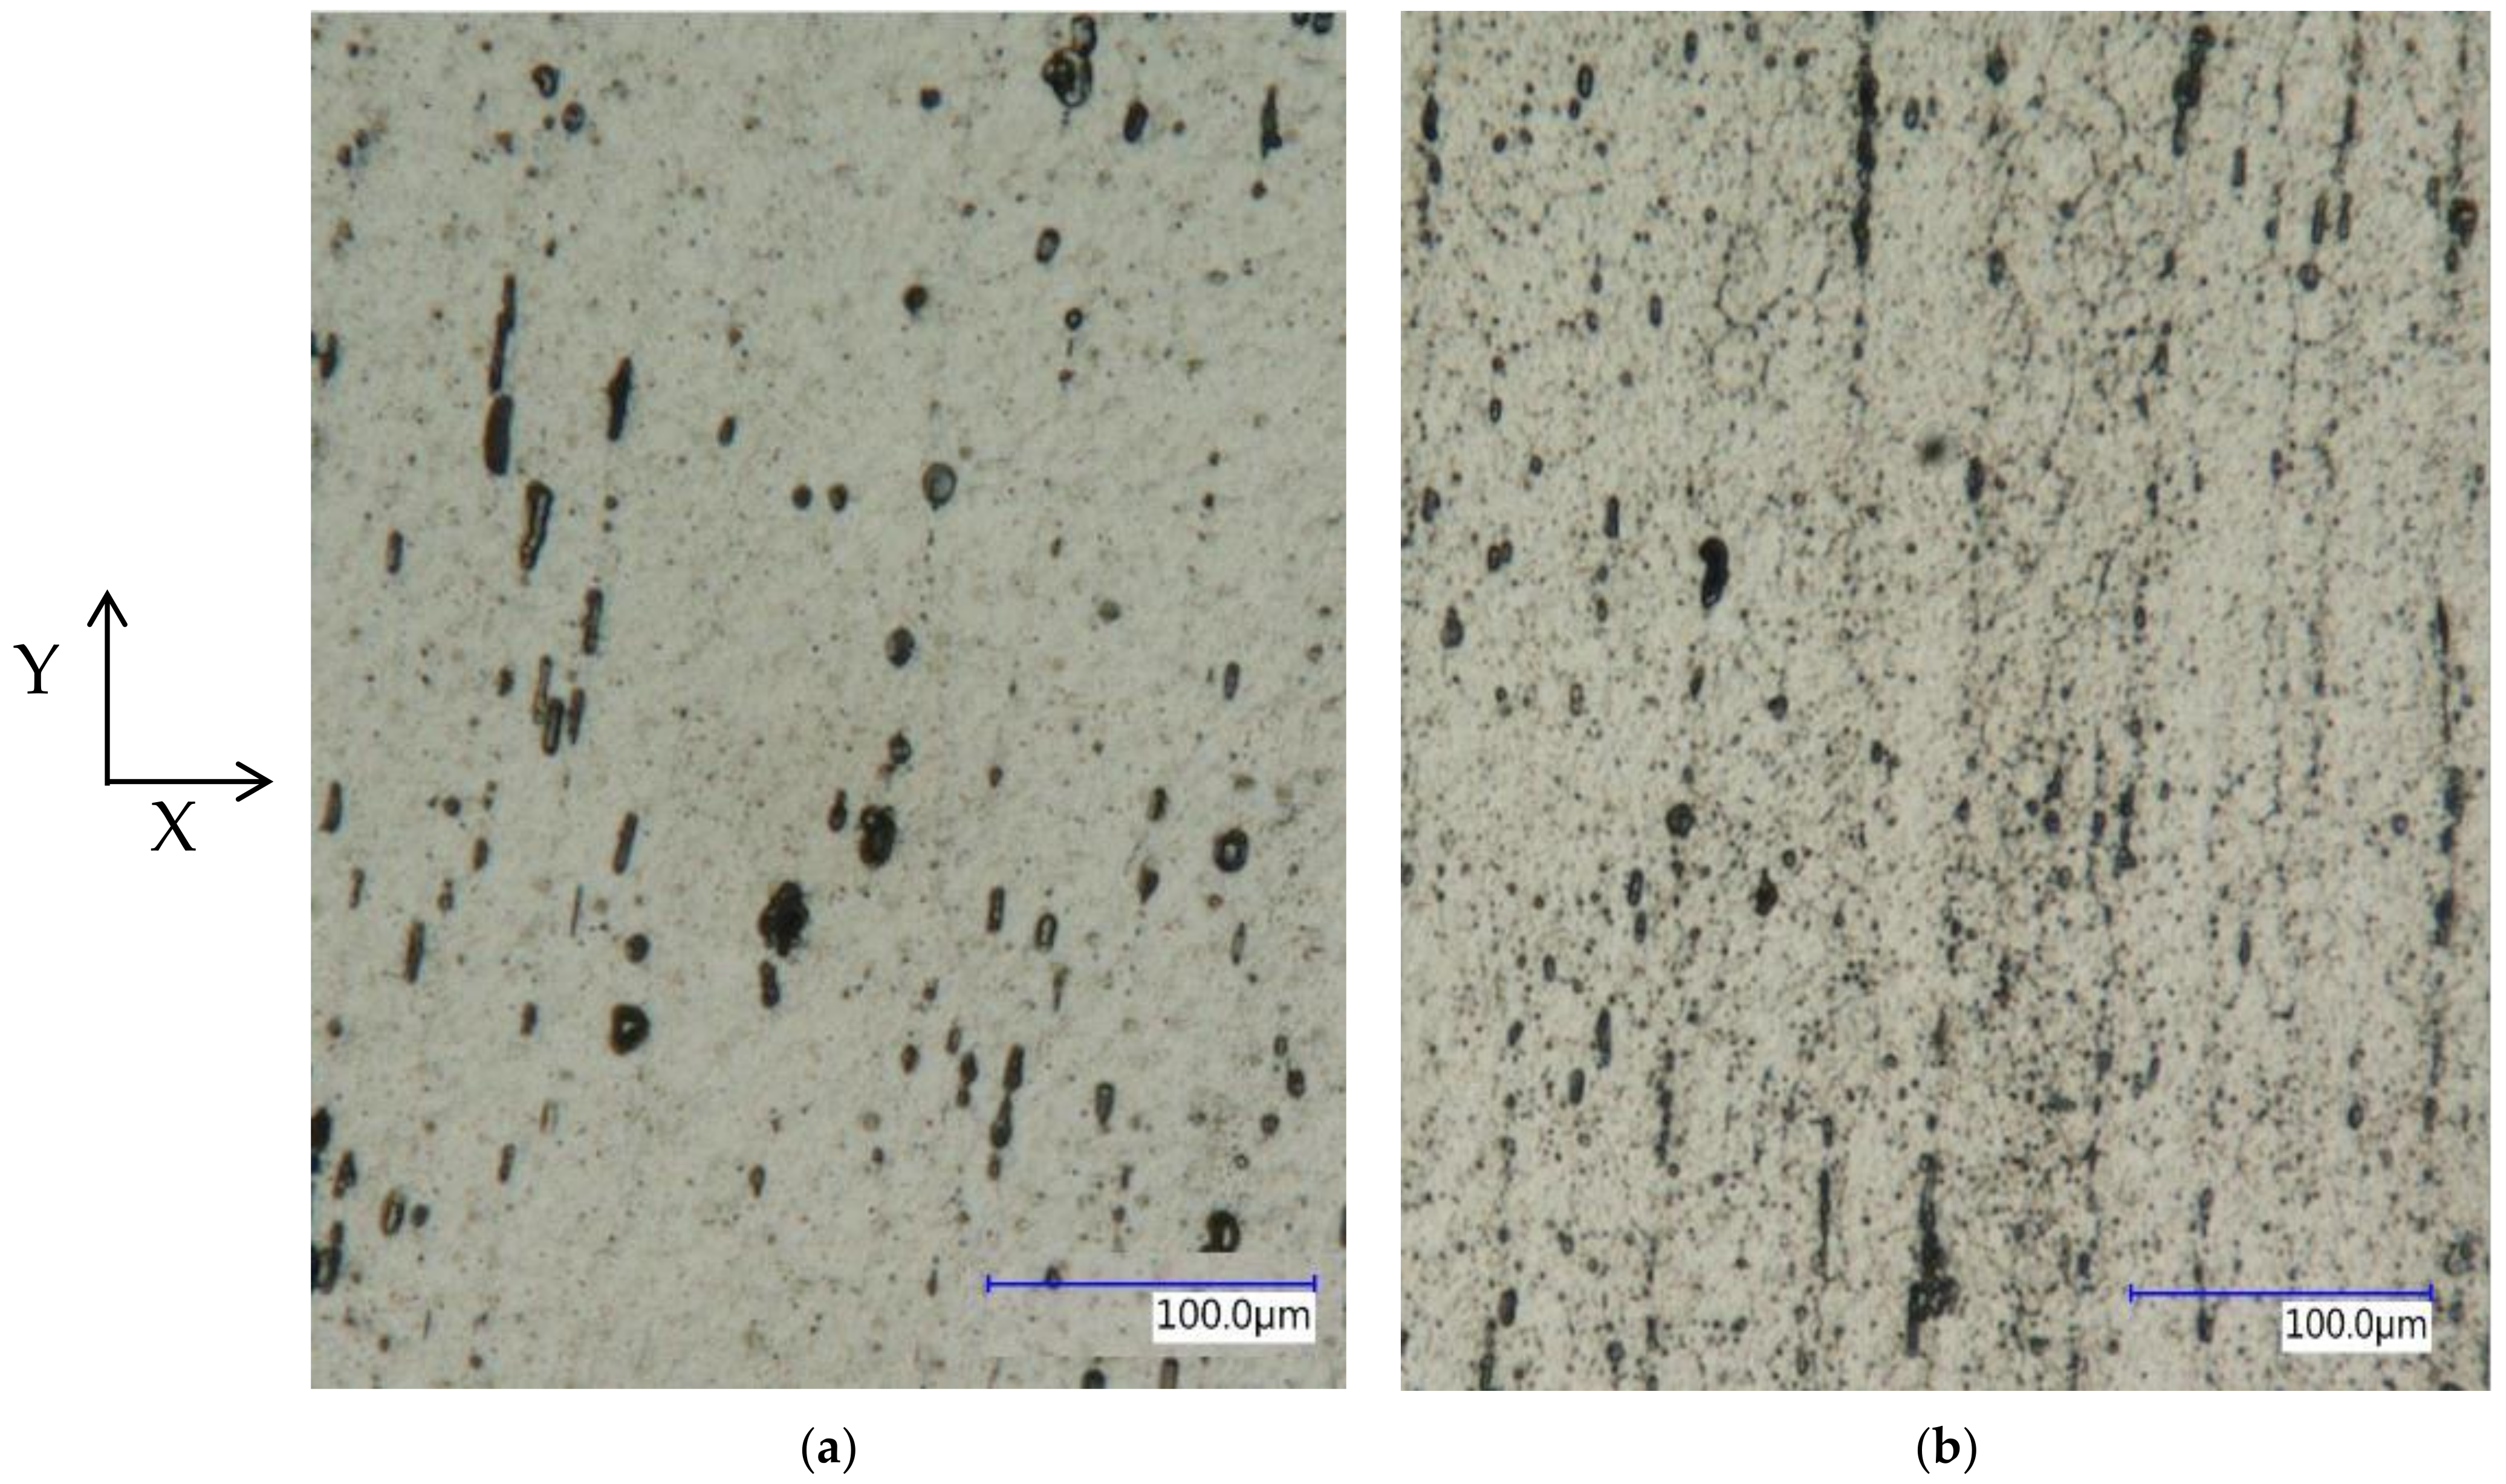
3.1. Material Properties and Microstructure

Two extruded, seamless, drawn Al6061-T6 round bars specimens, designated as “mother bars” MB1 and MB2, were acquired from McMaster-Carr for this study. Each bar is 28.575 mm in external diameter and 1.83 m long. The reported mechanical properties and chemical composition for the two specimens that were stated to have undergone nominally similar manufacturing processes are shown in Table 1. To improve our understanding of the large differences in ultimate and yield stresses shown in Table 1, the microstructures on longitudinal-radial planes extracted for MB1 and MB2 are shown in Figure 1. Comparison of the photographs in Figure 1 indicates that MB2 has undergone much higher elongation and transverse compressive deformation during extrusion than MB1.

3.2. Anisotropic Yield Function and Hardening Parameters

To employ the Barlat Yld91 yield criterion for model predictions, both the elastic material properties and all six parameters in Equation (5) must be determined. To do so, the investigators performed a specific series of experiments, including tension and torsion loading, on specimens extracted at different orientations with respect to the longitudinal direction (Y direction as shown in Figure 2) from MB1 and MB2 bars. Details regarding the sample preparation and experimental set up are given in the Appendix A. Table 2 lists the detailed experimental plan for all specimens to determine Barlat Yld91 parameters. The experimental setup for the LTD samples is shown in the Appendix A.
True stress vs. true strain data for the uniaxial tension experiments (LDD, RDD0, RDD45, and RDD90 specimens) and shear stress vs. shear strain (γ) for the torsion experiment (LDT specimen) for MB1 and MB2 specimens are shown in Figure 3 and Figure 4, respectively. The axial stress is calculated at each load level using the axial force and cross-sectional area,
σ x x = F x A
In these equations, F x is the axial force, A = t • w is the cross-sectional area of the rectangular specimens, where t is the specimen thickness and w is the width of the gage section,
For the torsion experiments, the shear stress in the thin-walled tubular specimen is calculated for each applied torque using the torsion equation [62],
σ x y = T r A
where, T is applied torque, r is generally the mean radius for thin-walled specimens and A is the cross-sectional area given by A = π (ro2ri2), with outer tube radius, ro, and inner tube radius, ri.
True stress (σ) and true strain (ε) are calculated using standard formulae:
σ = σ e n g 1 + ε e n g
ε = l n 1 + ε e n g
where σ e n g σ x x and ε e n g are engineering stress and engineering strain, respectively (Since strains are less than 0.05 in these studies, Lagrangian strain measurements obtained by StereoDIC are excellent estimates for the engineering strains, and hence are used in Equations (11)and (12) to determine true strain and true stress).
The yield stresses in the three orthogonal orientations for MB1 and MB2 extrusions can be determined using the yield stress data for the LDD, RDD0, and RDD90 experiments. Three of the six anisotropic coefficients in Equation (5) are obtained from the three uniaxial stresses at yielding in the directions of the orthotropic symmetry axes X, Y and Z (Figure 2 and Figure A1b) via a Newton-Raphson numerical procedure (The effective stress, (σ) from the LDD measurements for each bar material u considered to be the “reference” stress state, σo, and will be used to normalize results for both MB1 and MB2. As shown in Figure 3a, σo = 287 Mpa for MB1 and Figure 4a, σo = 342 Mpa for MB2). The effective stress, ( σ ¯ ), from the LDD measurements is considered to be the “reference” stress state.
The parameter, g, is obtained using (i) the estimated a, b, and c parameters, (ii) the plane stress transformation equations for the Z-X plane with ϕ = −45o to relate the applied axial stress in the rotated specimen to the stresses in the X-Y-Z coordinate system, and (iii) Equation (5) to define an equation for g. Finally, to determine the parameters f and h, the data in Figure 3b and Figure 4b for the RDD specimens shows that there is circumferential symmetry in the longitudinally extruded rod material. Consistent with this observation, the authors assume that the yield stress due to shear are equal in both the X-Y plane and the Y-Z planes, so that f = h. Following this procedure, the six yield function parameters for the two 28.6 mm diameters extruded Al 6061 rods were determined, and the results are shown in Table 3 for both the MB1 and MB2 extruded aluminum bar materials.
Figure 5 presents a comparison of the Barlat Yld91 anisotropic yield function predictions and the Von Mises isotropic yield function predictions for the case of biaxial loading in the X-Y plane.
The procedure of obtaining Elastic and Power Law Hardening parameters is given in the Appendix A. Table 4 presents the results of elastic and power-law hardening parameters for both MB1 and MB2 bars.

4. Theoretical Prediction and Experiments for Simple Torsion Case

Once the elastic, hardening, and anisotropic yielding parameters are obtained for the two extruded bar materials, the theoretical formulae given in Section 2 can be combined to predict the complete history of elastic-plastic deformations in thin-walled tubular specimens that are subjected to simple torsional loading.
Figure 6 presents a flow chart for the numerical program that was developed and implemented by the authors to predict the elastic and plastic strains. Every step, the program is determined effective stress according to Barlat’s and von Mises’s yield function presented in Equations (5) and (6) respectively and then compare it with reference yield stress state. If the effective stress is below the yield stress, the model only determines elastic shear strain (Equation (3)) which is equal to total shear strain. After yielding, incremental plasticity is combined with the elastic equations to predict the total shear strain (Equations (2)–(4) and (8)) for specimens subjected to known applied shear stresses. The input load cell data is presented in Figure 7. The accuracy of the predictions is assessed by direct comparison to the experimental measurements for the total shear strain on the specimen surface during torsional loading using the same loading path as shown in Figure 7. For that, two simple torsion experiments were conducted using MB1 and MB2 tubular specimens (Figure A1c).
As discussed in Appendix A, all surface strain measurements were obtained using a stereovision system with VIC-3D software employed to analyze the images. Baseline studies using images at zero load showed the standard deviation in the measured surface effective strain is ≤100 με. During torsional loading, variability in the measured surface strains increased with the signal-to-noise ratio ≥ 16 for all torsional loads, confirming that the measured surface strains are within +/− 6% of the average value used for comparison to the theoretical predictions.
Figure 8 and Figure 9 present direct comparisons of the experimental shear stress vs. total shear strain measurements to theoretical predictions using isotropic and anisotropic yield criteria for MB1 and MB2 specimens, respectively. Inspection of the results shows that the model using the Barlat anisotropic yield function is in very good agreement with experimental measurements, with differences less than 5% for both specimens. Conversely, predictions using a Von Mises isotropic yield function show deviations from the experimental data ranging up to 10% and 25% for the MB1 and MB2 specimens, respectively.

5. Discussion of Results

A cursory inspection of the data in Figure 3 and Figure 4 indicates the longitudinal extrusion process results in (a) circumferential symmetry in the material response for both MB1 and MB2 specimens, (b) a greater than 20% increase in tensile yield stress for the MB2 specimen, and (c) a reduction in shear yield stress by 12% for the MB2 specimens. The measured increase in tensile yield stress is nominally consistent with manufacturer data shown in Table 1. Interestingly, the radial tensile results for both MB1 and MB2 specimens are quite similar.
The effect of anisotropy in the behavior of both longitudinally extruded Al6061-T6 cylindrical tubes is evident in the values of the six Yld61 parameters in Table 3 for both MB1 and MB2 bars. Several of the parameters show significant deviation of the six anisotropic parameters from unity, where unity is the value required for isotropic yielding. Though there are slight changes in elemental composition shown in Table 1, the most likely source of the different behavior for MB1 and MB2 specimens is the longitudinal extrusion process that resulted in significant changes in material microstructure that are shown in Figure 1. As noted previously, the large difference in microstructure for MB1 and MB2 mother bars (Figure 1) shows that the MB2 specimen has undergone much higher elongation and transverse compression than MB1 during the “nominally similar” extrusion processes. Such differences are consistent with the observed increase in work-hardening that are shown in Table 4, as well as the higher yield stress and higher ultimate stresses shown in Table 1 for MB2 relative to MB1.
As shown in Figure 5, the Barlat Yld91 [17] predictions for tensile loading in the radial direction (X) and axial direction (Y) are in excellent agreement with the experimental data, whereas the Von Mises yield criterion overpredicts the required yield stress for loading in the radial direction by up to 25%. The source of the relatively strong yield anisotropy is most evident in the Figure 3 and Figure 4, where yield stresses in radial directions for the MB2 material is ~25% lower than in the longitudinal direction (270 Mpa vs. 340 Mpa). Furthermore, as shown in Figure 5, the effect of yield anisotropy is largest for σxy ≈ 0.5, with the Barlat criteria predicting yielding for lower stresses (15% for MB1, 30% for MB2) than the Von Mises criteria. Thus, the Barlat yield criteria provides substantially improved accuracy in the prediction of yielding for those applications where such differences are truly important.
As shown in Figure 8 and Figure 9, prediction of the torsional specimen response during loading shows that (a) isotropic yield models underestimate by ~10% the experimental results for MB1 and substantially over-estimate the response by ~25% for MB2. When using the Barlat Yld91 anisotropic yield criterion, the deviation is less than 5% for both specimens, again demonstrating the importance of anisotropy for accurate prediction of material response in extruded material systems. This observation is consistent with previous studies by Fourmeau et al. [27] and Tardif & Kyriakides [28].
Regarding the choice of yield criteria, the investigators selected the Barlat Yld9 [17] anisotropic yield function with six material parameters (rather than the Yld2000-2d, Yld 2004-8d or Yld2004-18p [20,21] models) for two reasons. First, the diameter of two mother bars was 28.575 mm, which was relatively small, limiting the ability to extract usable specimens from different directions for parameter identification. Secondly, the longitudinal extrusion process of the Al6061-T6 tubes develops similar material response in all circumferential directions, limiting the number of required specimen orientations necessary for anisotropic model calibration. Based on the results shown in Figure 8 and Figure 9, the selection of the Yld91 criterion reduced the complexity of the experimental program while also providing excellent agreement with experimental observations.

6. Summary and Conclusions

In this study, the elastic, plastic, and total shear strain components are obtained (a) theoretically through computational modeling using both the Von Mises and Barlat Yld91 yield criteria with incremental plasticity, and (b) experimentally using StereoDIC for extruded, thin-walled tubular specimens subjected to applied torsional loads. Results from the experimental studies and analytic modeling are summarized as follows:
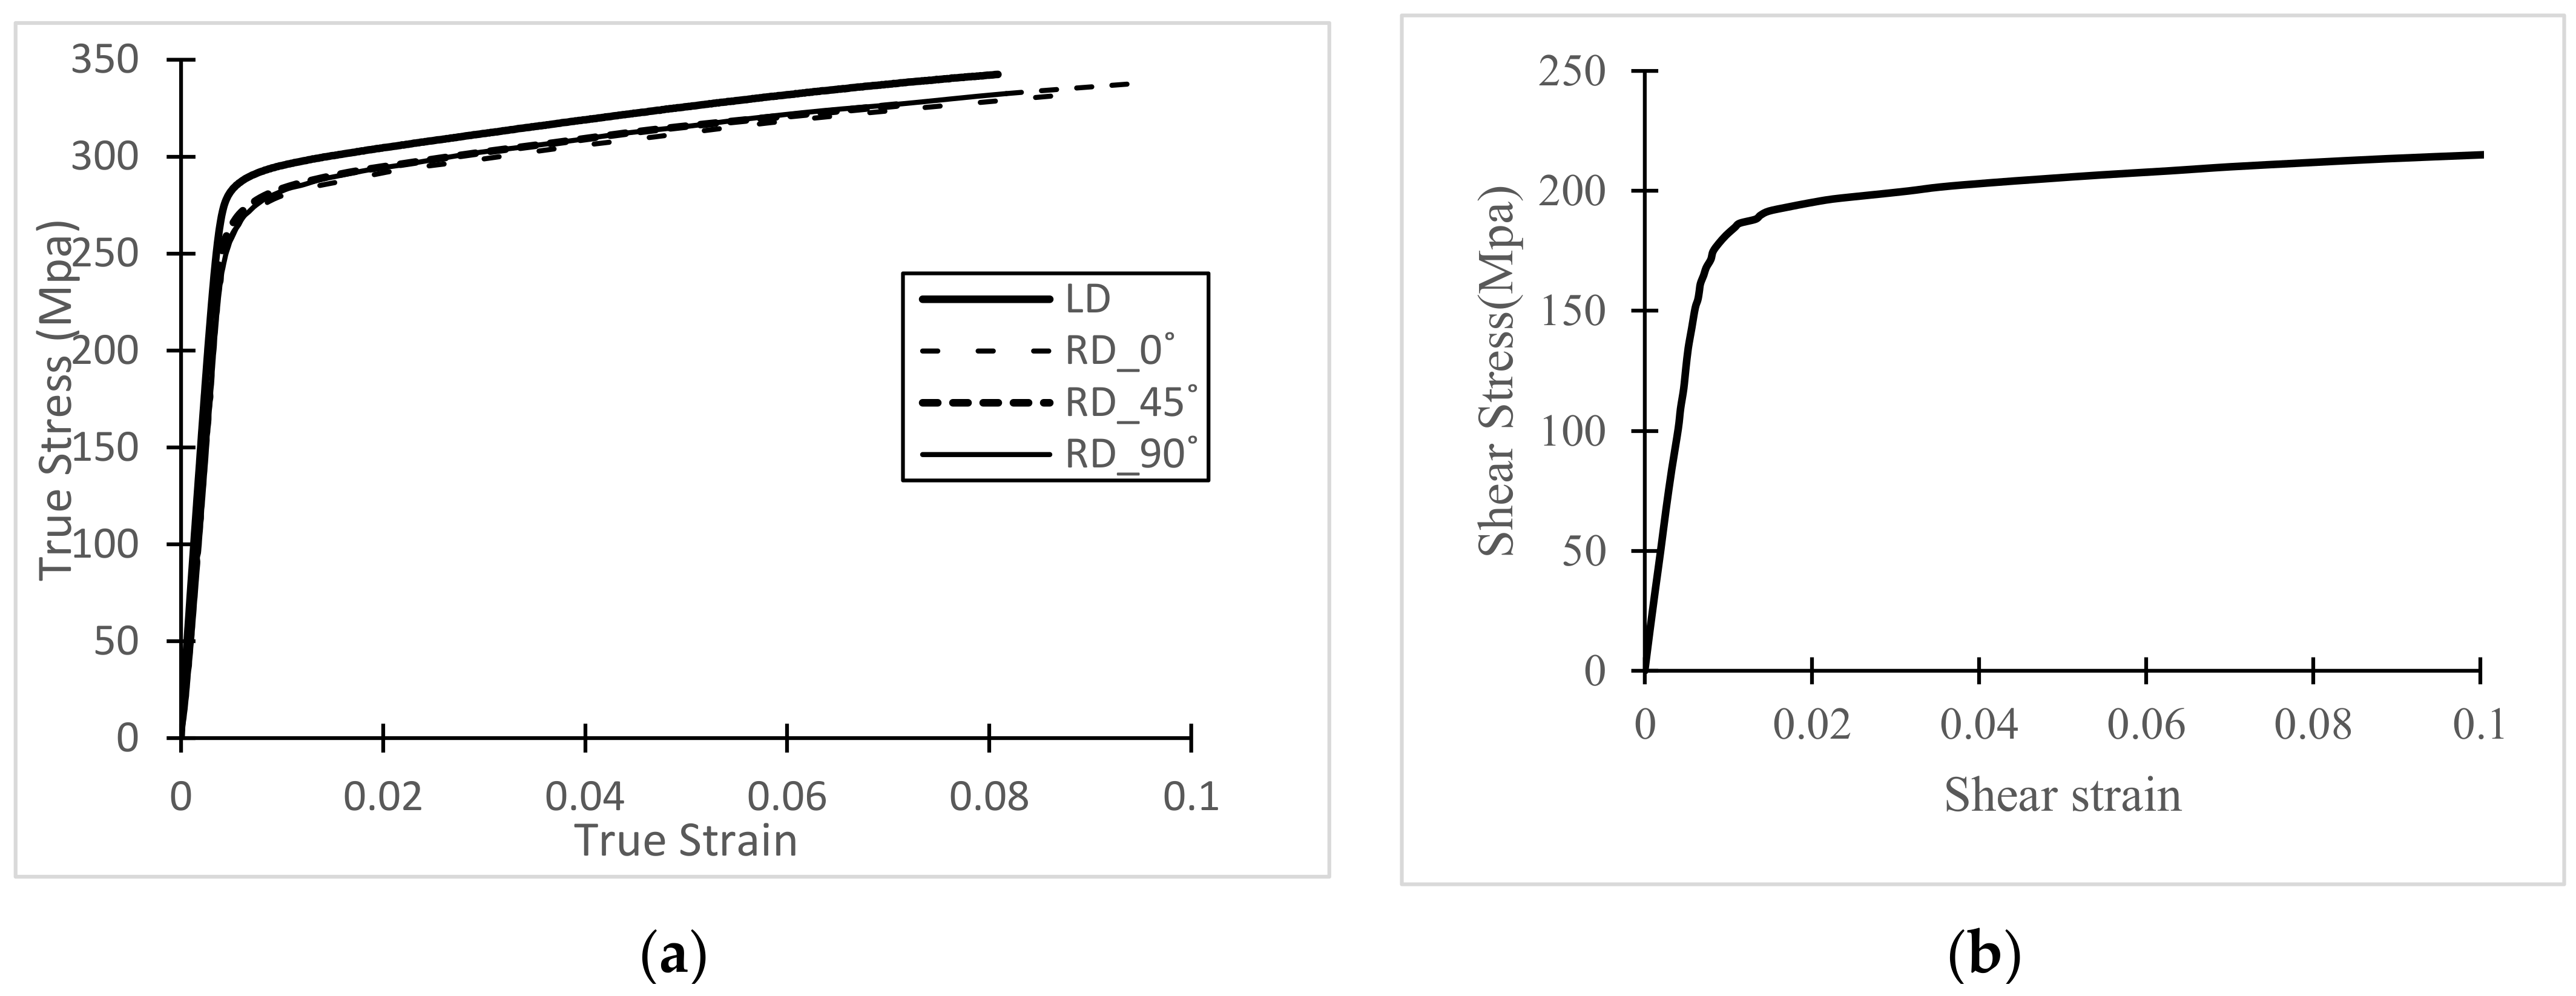
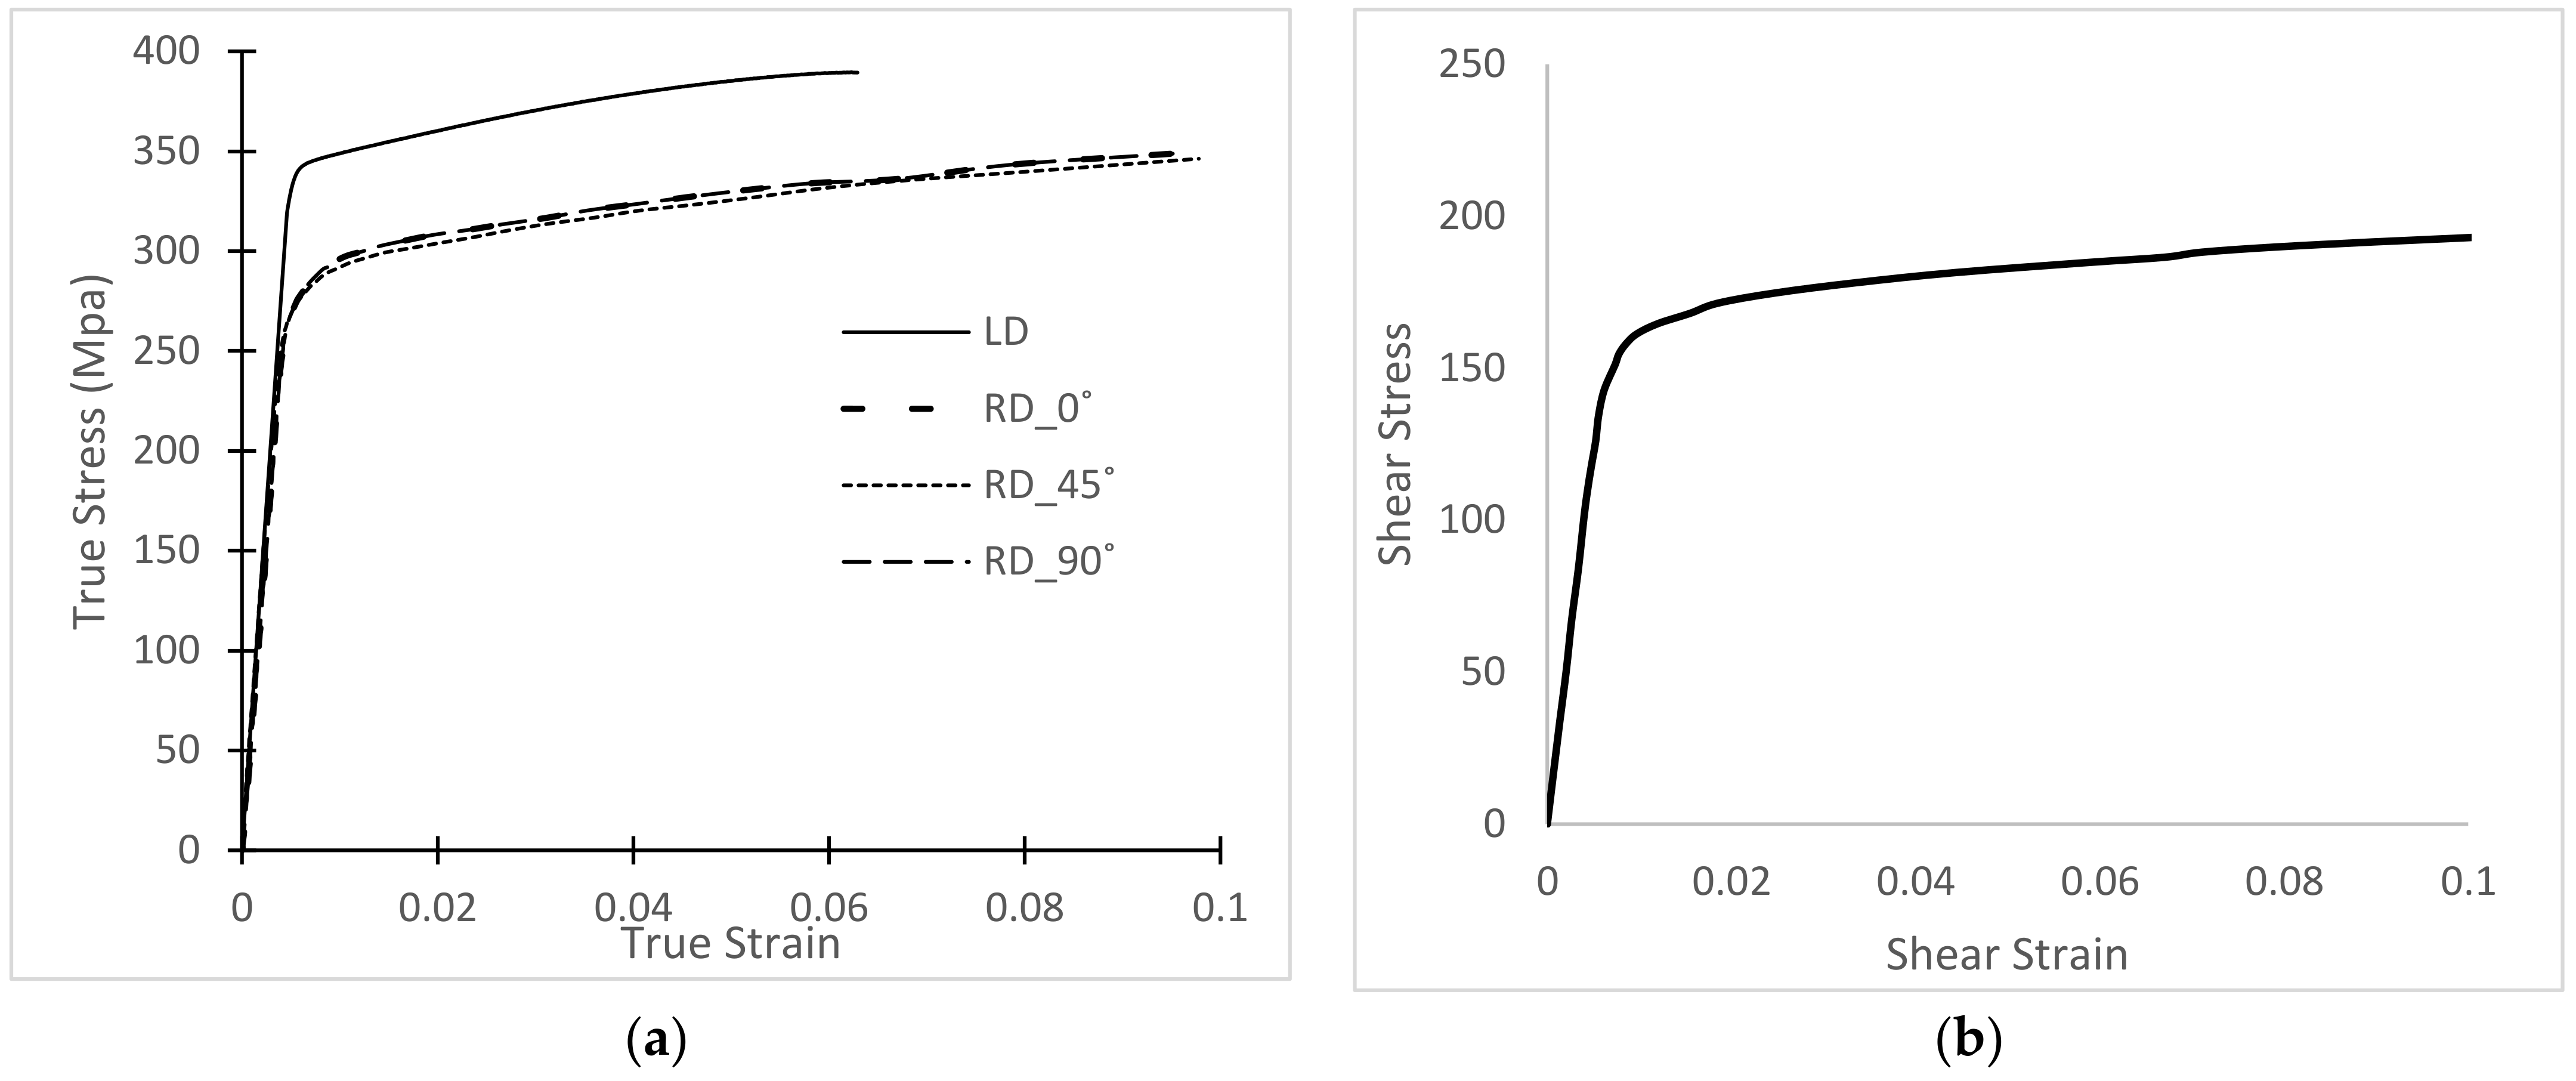
  • Uniaxial tension and simple torsion experiments were performed on a series of specially machined tubular and dog-boned rectangular specimens extracted from two longitudinally extruded Al6061-T6 cylindrical bars to obtain the required material parameters for anisotropic yield criteria. Here, the yield function Yld91 developed by Barlat et al., with six measured material parameters, is used to model the anisotropic response of the extruded aluminum material and an isotropic yield criterion using the Von Mises criteria is employed to predict an isotropic response.
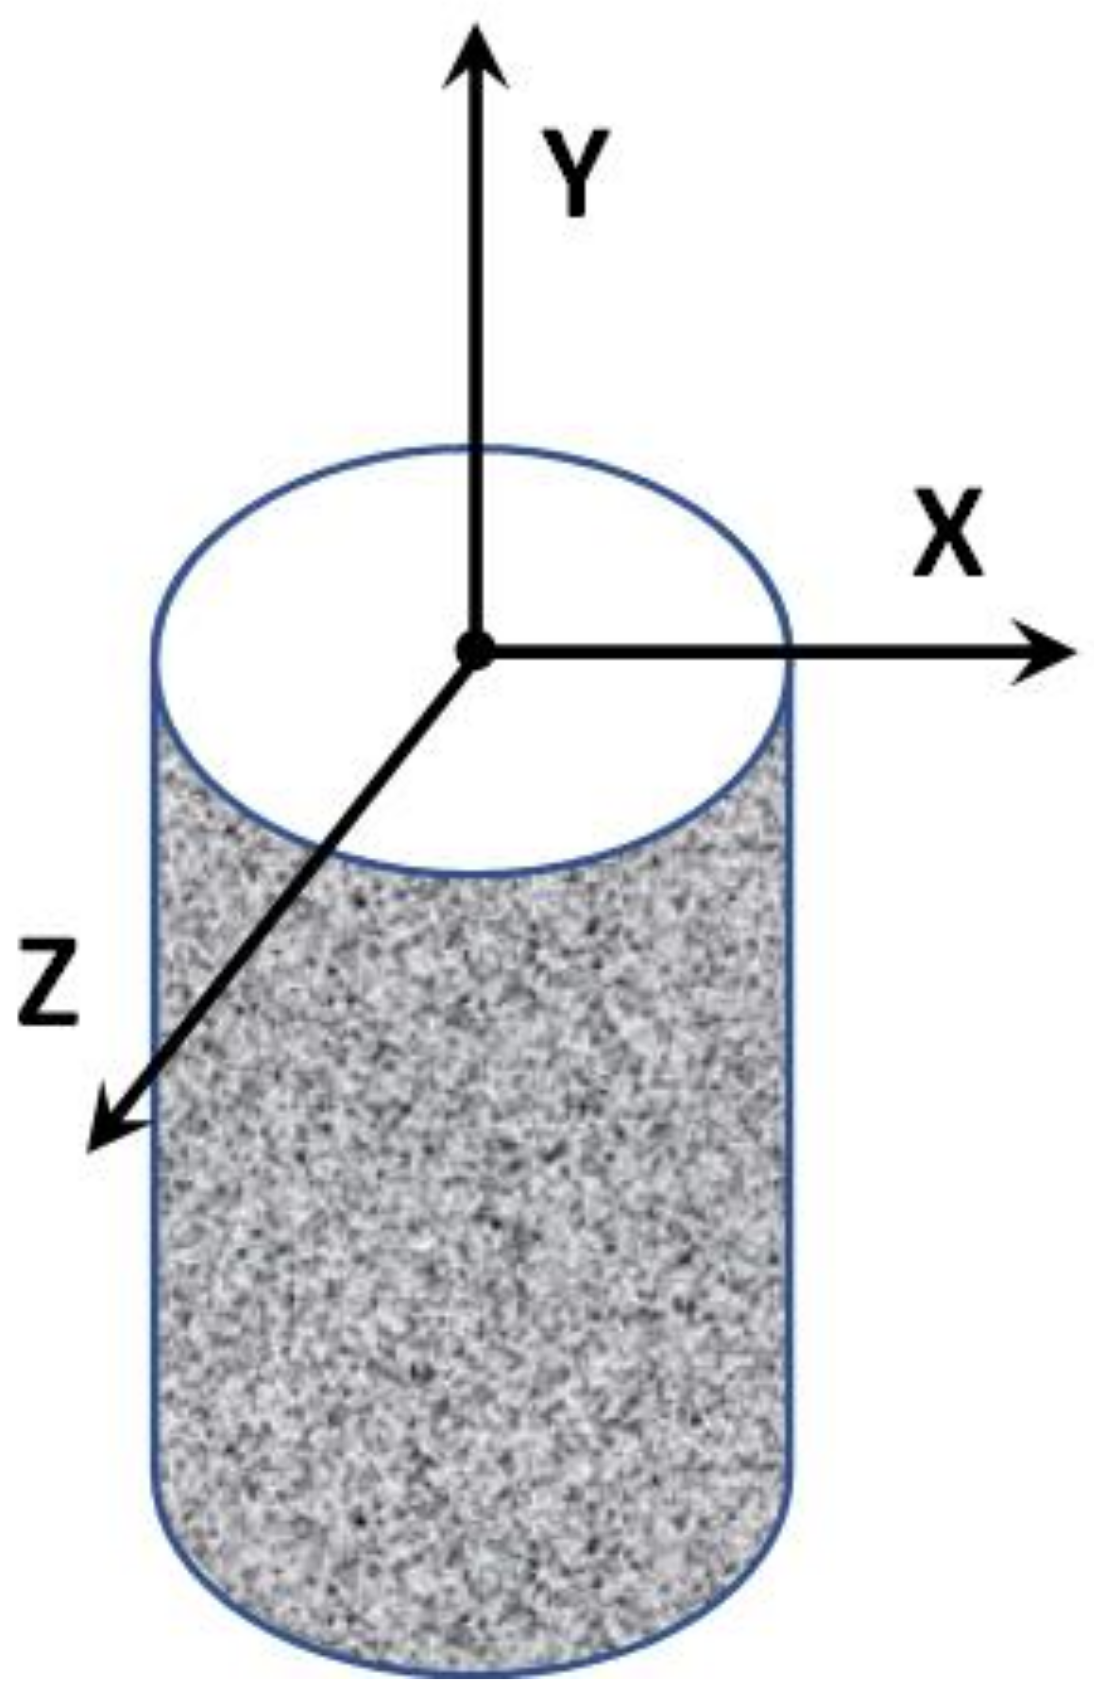
  • Since the extrusion process is circumferentially symmetric for our longitudinal extrusions, yield stresses in all radial directions are expected to be similar, a condition that was confirmed from a series of radially oriented specimen experiments.
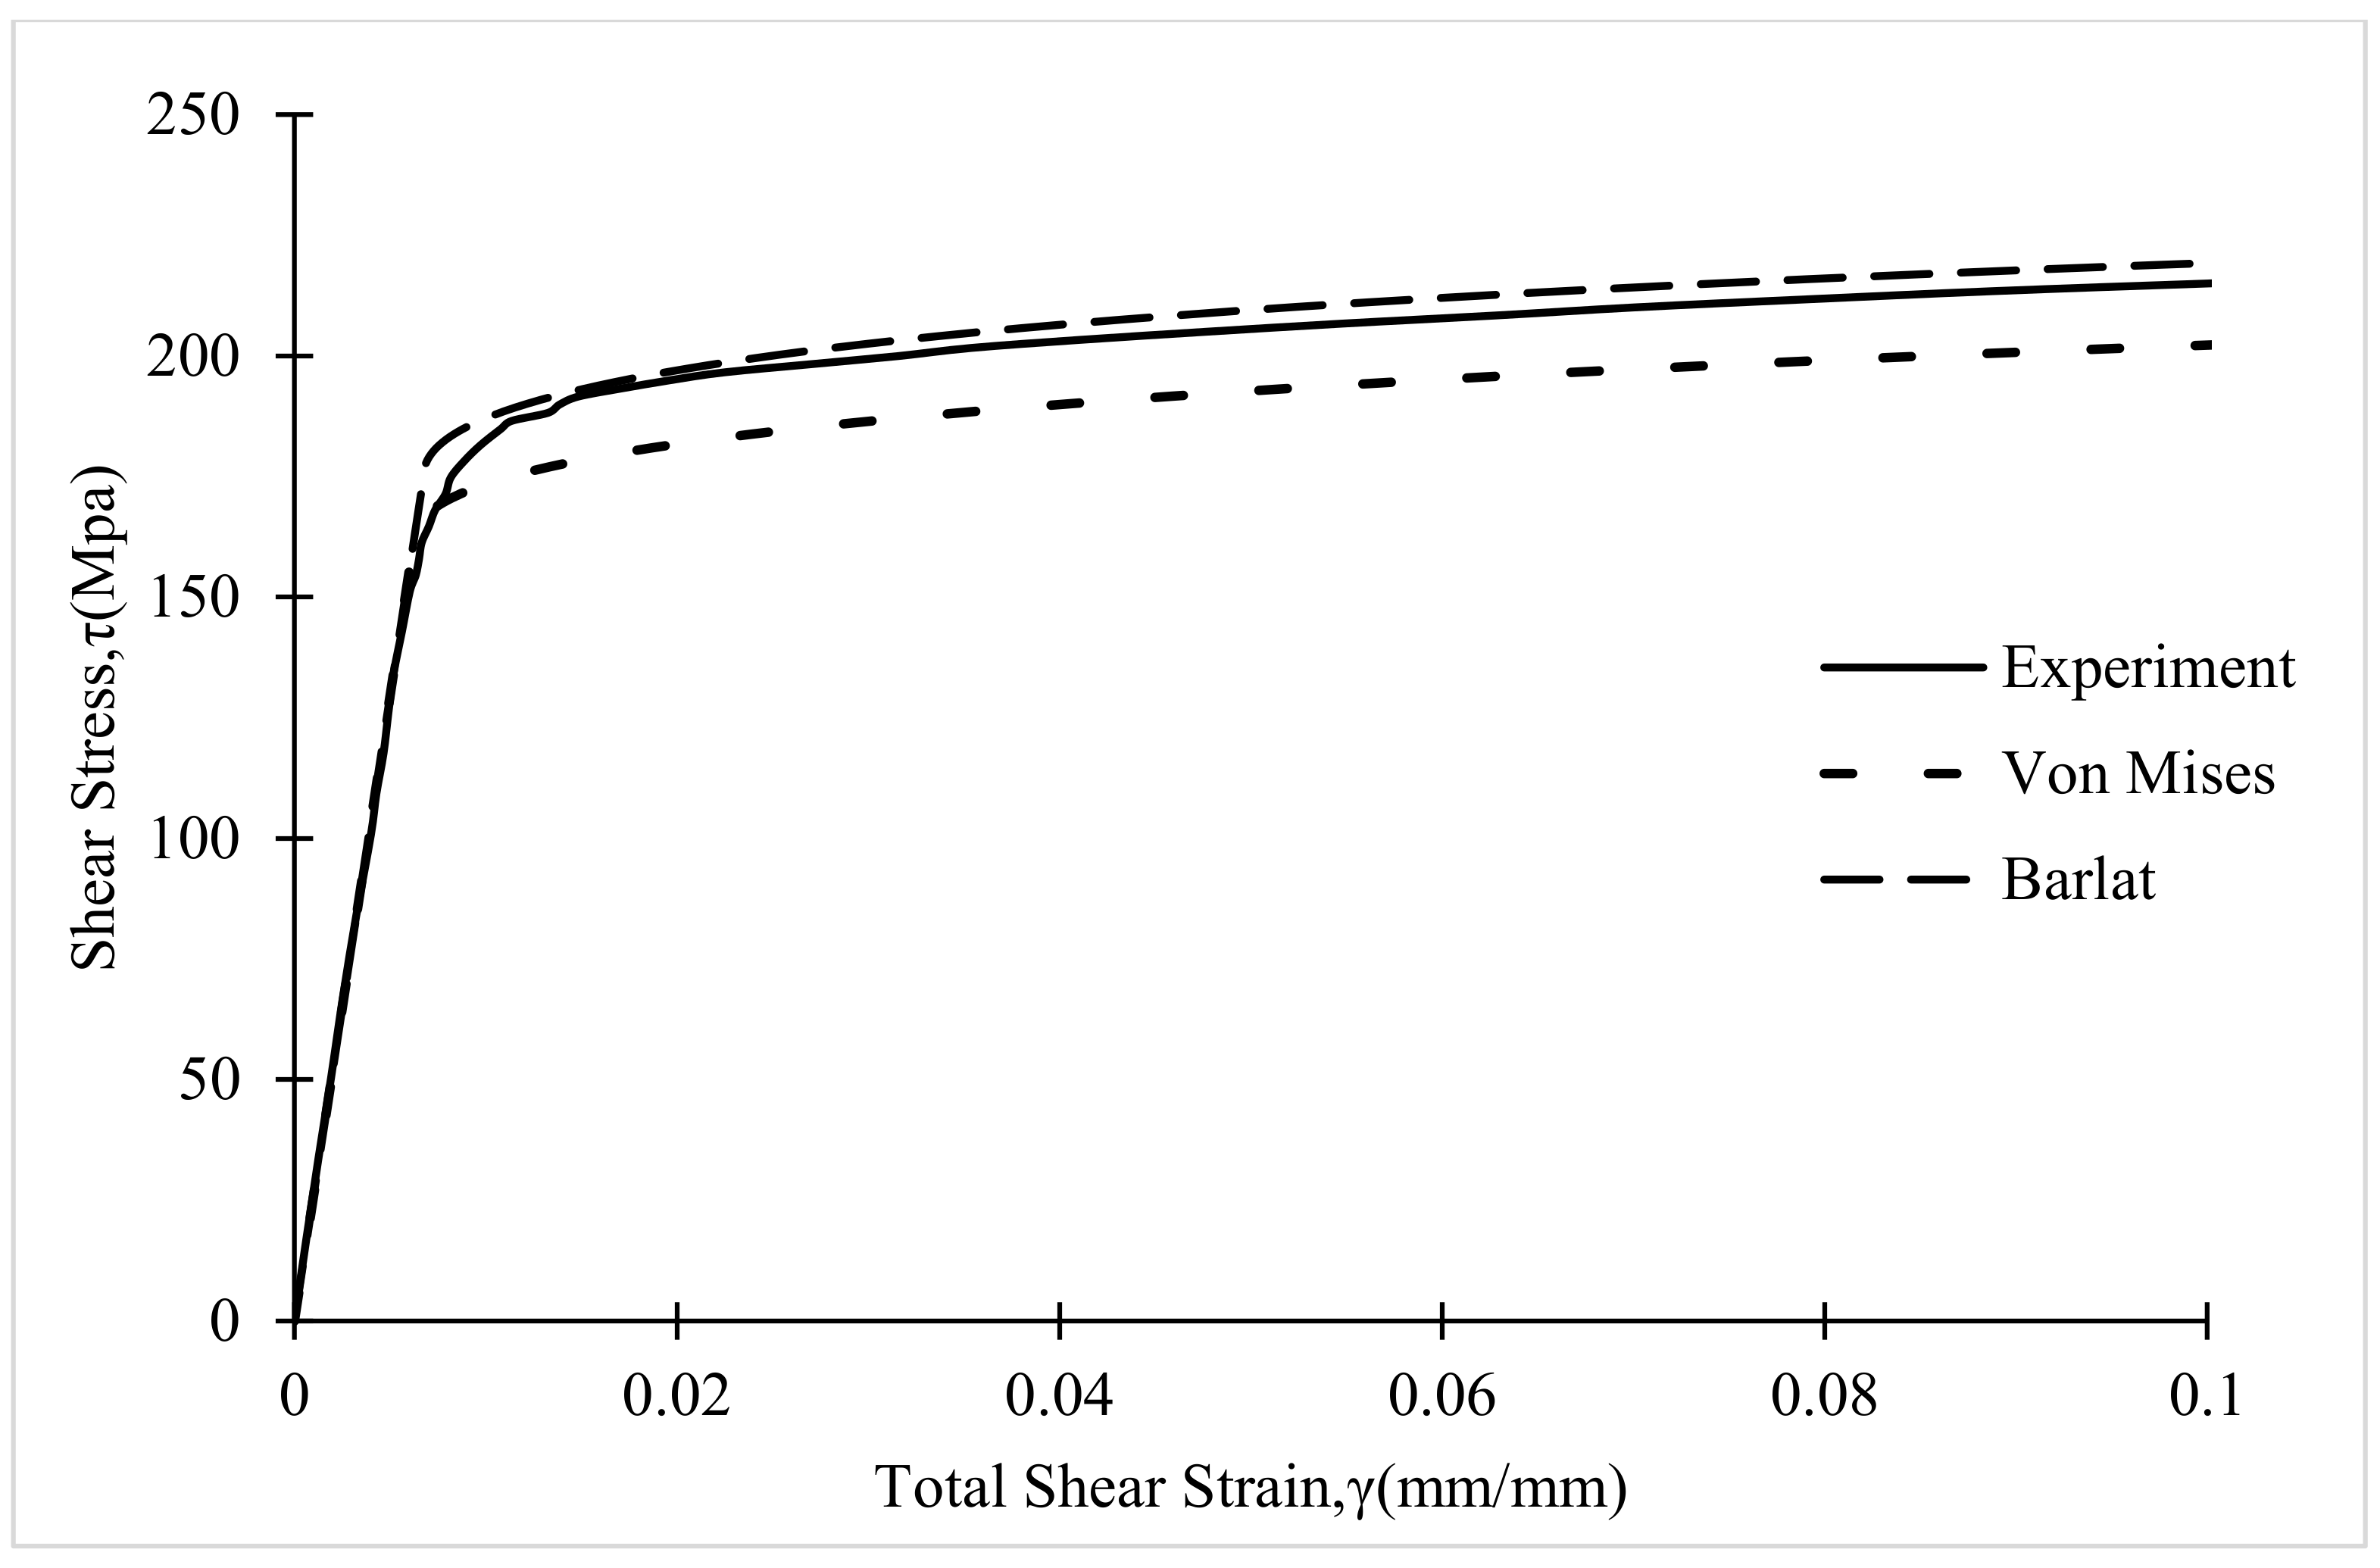
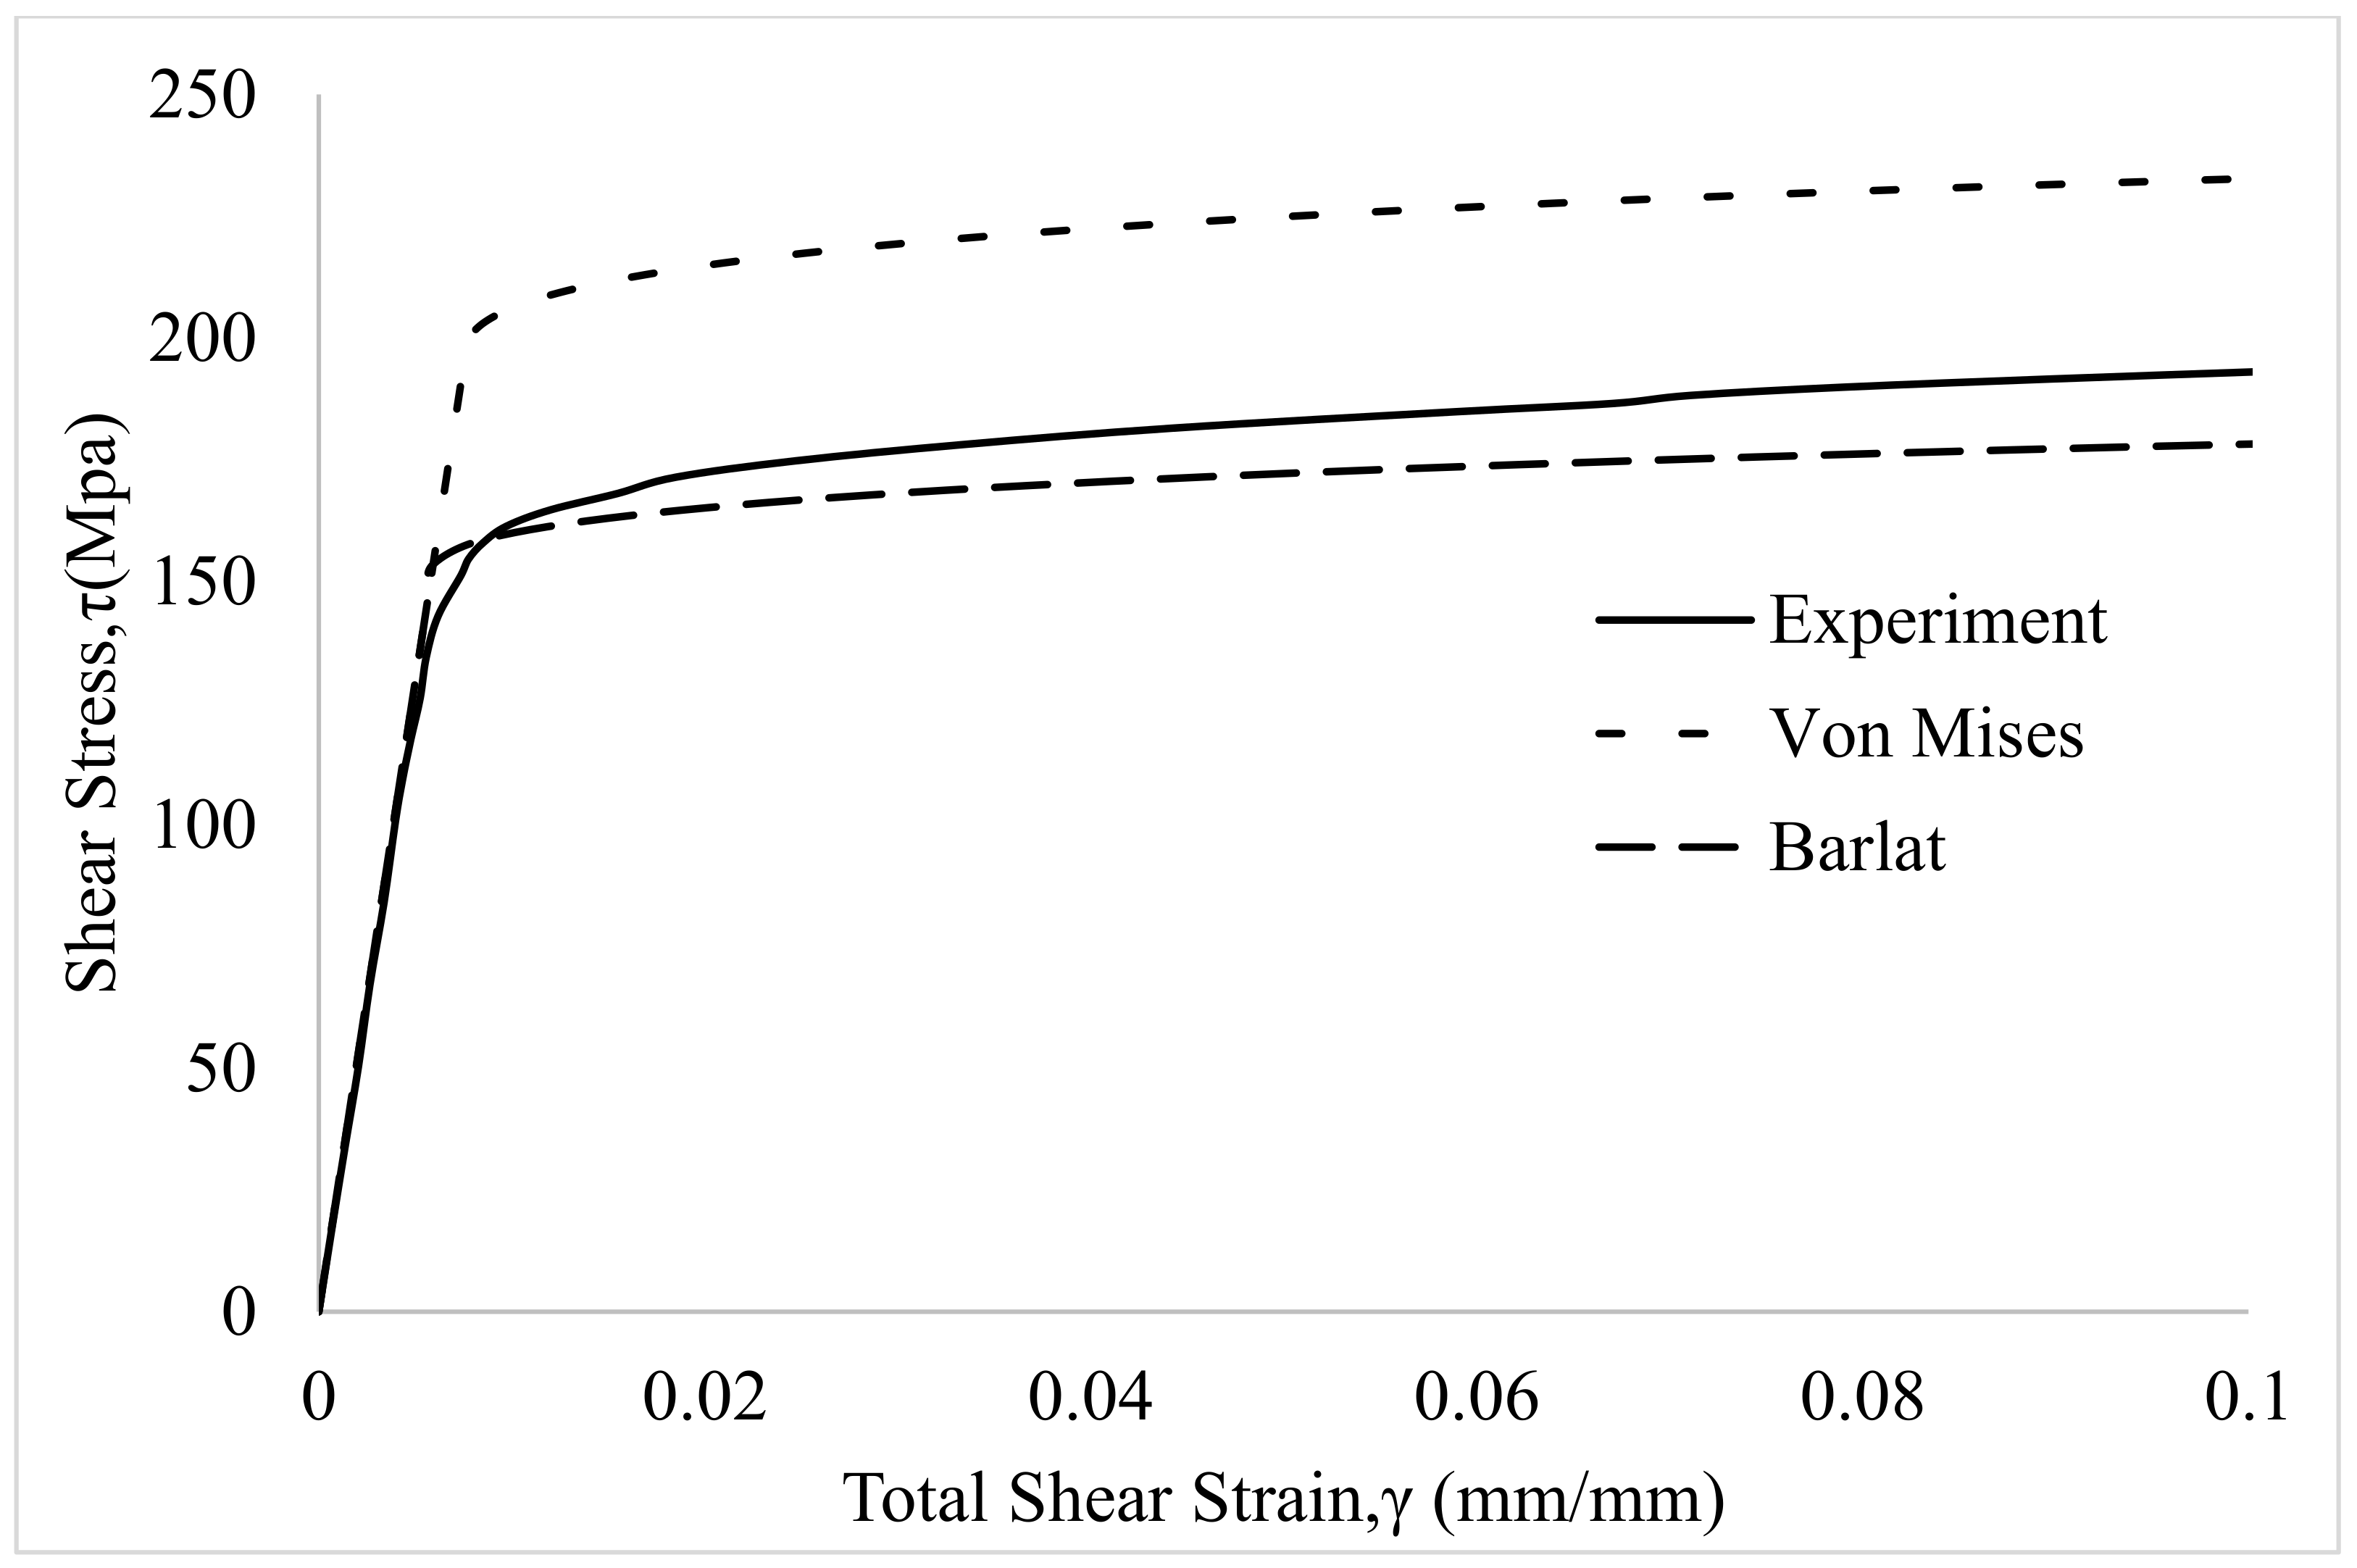
  • Assuming isotropic strain hardening beyond yielding, the Von Mises isotropic and Barlat Yld91 parameters yield functions with power-law hardening and incremental theory of plasticity are used to develop and then implement a constitutive model for elastic-plastic material behavior and predict the response of the extruded MB1 and MB2 material. These constitutive models are implemented in a relatively simple numerical analysis platform to predict the stress-strain response for both materials undergoing torsional loading.
  • Theoretical results indicate that results obtained using the anisotropic yield function are in excellent agreement with simple torsion experiments for both materials. Conversely, results obtained using an isotropic yield function underestimate, and then over-estimate, the stress-strain response of the MB1 and MB2 specimens, respectively.
  • Direct comparison of the experimental and theoretical results indicates that both extruded Al6061-T6 materials are significantly anisotropic, with the longitudinal yield stress deviating from the radial yield behavior in the extruded materials by over 20%. Furthermore, for biaxial loading cases, the Barlat yield criteria provides improved accuracy in the prediction of yielding for those applications where isotropic yielding is not adequate.
  • Predictions of the stress-strain response for the MB1 and MB2 tubular specimens using the Barlat Yld91 anisotropic yield criterion are in excellent agreement with experimental measurements, with differences less than 5% for both specimens, clearly demonstrating the importance of yielding anisotropy for accurate prediction of material response when undergoing complex manufacturing processes, including longitudinal extrusion.
  • Results also show that the nominally similar extrusion processes for mother bars MB1 and MB2 are not the same, with substantial differences in the stress-strain behavior for the two materials being consistent with microstructural features that indicate the MB2 extrusion process was more severe.

Author Contributions

In this article, the formal analysis was done by F.Y. and M.A.S. The detailed methodology was provided by F.Y., M.A.S., X.D. and A.P.R. The theoretical and numerical analysis was done by F.Y. The experiment was conducted by F.Y. and M.R., F.Y. prepared the original draft; review and editing were done by M.A.S., X.D. and A.P.R. All authors have read and agreed to the published version of the manuscript.

Funding

The authors would like to acknowledge the financial support provided by the Department of Mechanical Engineering at the University of South Carolina. The support provided by Edward Walton, CFO and VP for finance at the University of South Carolina, through internal grant 15540E233 for laboratory development and equipment purchase, is deeply appreciated as it was essential for the experimental studies in this work.

Institutional Review Board Statement

Not applicable.

Informed Consent Statement

Not applicable.

Data Availability Statement

Data will be available by contacting the corresponding author for a reasonable request.

Acknowledgments

The support of William Bradley and all members of the Department of Mechanical Engineering Machine Shop in the development and manufacturing of the specimens is deeply appreciated.

Conflicts of Interest

The authors declare no conflict of interest.

Appendix A

Appendix A.1. Sample Design and Preparation

As shown in Figure A1b, thin-walled longitudinal direction tube (LDT) geometries were designed to maintain nearly uniform stress in the test section while ensuring the ability to yield the specimen without torsional buckling. Machining of the tubular specimens was performed using the internal diameter as a reference to ensure minimum wall eccentricity in the test section (measured eccentricity is +/−0.001 mm). The inner and outer diameters of the sample were measured using (a) micro-computed tomography (XCT), and (b) a T-gage (Telescoping gage, amazon.com). For torsion experiments, each LDT specimen is 144.78 mm long with a uniform central section that is 24.13 mm long with 1.27 mm wall thickness; measurements show a variance of +/−0.001 mm for the wall thickness.
For uniaxial tension loading, Figure A1c,d show the two types of dog-bone specimens that were manufactured. The dog bone specimens are prepared using advanced pre-programmed software and code-controlled computerized numerical control (CNC) machining techniques. The tensile axis of the 50 mm long Longitudinal Direction Dog-bone (LDD) specimen shown in Figure A1c is oriented along the longitudinal direction of the MB bars. The tensile axes of the Radial Direction Dog-bone (RDD) specimens shown in Figure A1d are oriented radially at angles of 0°, −45°, and 90° with respect to the arbitrary x-direction; the specimens are designated RDD0, RDD45 and RDD90, respectively. Due to size limitations imposed by the extruded bar diameter, the RDD specimens are relatively small, with a gage length of 10 mm.
Figure A1. (a) Tension and tension torsion test specimens’ orientations as excised from both the longitudinal and radial directions (LD and RD) of the mother bars MB1 and MB2. Geometries are (b) LDT, (c) LDD and (d) RDD0, RDD45, RDD90 for radial specimens. (All units in mm).
Applsci 11 09701 g0a1aApplsci 11 09701 g0a1b

Appendix A.2. Experimental Setup

The setup for torsion test shown in Figure A2 consists of an electromechanical tension-torsion test system and a stereovision imaging system. The stereovision system used to obtain images of each specimen during mechanical loading consists of a pair of stereo digital cameras, high-intensity, low-heat, white LED light sources, and a calibration grid. A rigid crossbar is used to mount the cameras, and a tripod is employed to mount the rigid bar. A suitable random pattern was adhered to the surface of the LDT samples by initially coating surface with a thin coat of flat white paint and lightly over-spraying with flat black paint to obtain high contrast speckles with an average size of 0.250 mm. A dedicated computer with StereoDIC image processing software VIC-Snap and VIC-3D [63] was used to acquire synchronized images and perform image analysis to measure full-field strains. Calibration of the stereovision system was performed using standard patterns (Kahn-Jetter et al. [64], Luo et al. [65], Sutton et al. [66], Correlated Solutions, Inc., Irmo, SC, USA [63], with the authors adopting a modified methodology using a large angle calibration procedure described previously (Sutton et al. [67], Yasmeen et al. [68,69,70]). The mechanical loading system has tension/torsion capacities of 22 kN/300 N-m and is configured so that each test specimen can be subjected to uniaxial force, torsional moment or a combination of axial force and torsional moment in a proportional or non-proportional manner using either load control or displacement control.
The test system for the miniature RDD specimens included a stereomicroscope for high magnification image and a Psylotech micro-tensile test system (Psylotech Incorporated [71]) to apply tensile loading. Figure A3 presents the experimental setup. The Psylotech micro-tensile test frame used in these studies is a flexible, computer-controlled system capable of communicating with the stereo-microscope image acquisition system so that StereoDIC can be performed on images that are synchronized with the applied load. The RDD specimens also were patterned by applying a similar light coat of white paint, followed by a micro-scale black pattern applied using an airbrush system. Average speckle size on the RDD specimens is 0.013 mm. A specialized back-lit calibration pattern methodology is used in to calibrate the stereo-microscope imaging system. Both the RDD imaging system components (e.g., cameras, lenses, lighting) and the VIC-3D image analysis parameters (e.g., subset size, subset spacing) are summarized in Table A1.
The LDD specimens are uniaxially loaded in a table-top MTS system without stereo imaging for strain measurement. Instead, an MTS extensometer is attached to the gage section for axial strain measurements.
Figure A2. Experimental setup for simple torsion loading of LDT specimens using Stereovision system and electromechanical tension-torsion load cell.
Applsci 11 09701 g0a2
Figure A3. Experimental setup (a) for uniaxial tensile loading of RDD0, RDD45, RDD90 specimens using microscope Stereovision and micro-tensile test system (b) close view of micro-tensile test grip.
Applsci 11 09701 g0a3
Table A1. Cameras and system parameters for VIC-3D and VIC-3D stereo-microscope.
Parameter #Vic-3DVic-3D Stereo-Microscope
Cameras and LensesGrasshopper3 GS3-U3-91S6M (8 bits, 3376 × 2704)
Schneider XENOPLAN 1.9/35-0511
5 MP CMOS PointGrey camera (2448 × 2048)
LightingWhite LED LightingLEO with a linear polarizing film
Calibration14 × 10 dot grid, 5 mm dot size (H95-00-03), 70 stereo calibration image pairs15 × 15 dot grid, 0.28 mm dot size, 70 stereo calibration image pairs
Lens distortion1st order radial distortion correction10 stereo distortion image pairs
Subset size29 × 29 pixels235 × 35 pixels2
Step size9 pixels11 pixels
Filter typeCenter-weighted Gaussian filter
Shape functionAffine
Strain filter size5 × 5
Strain measurementLagrangian large strain tensor definition for all strain components
Average speckle size0.25 mm0.013 mm

Appendix A.3. Elastic Modulus, Poisson’s Ratio and Hardening Parameter for Extruded Rods

The modulus of elasticity (E) and Poisson’s ratio (υ) were determined using measurements obtained during the uniaxial tension experiments on the RDD0 specimens using the standard equations
E = σ x x ε x x
υ = ε y y ε x x
where the stresses and strains are measured within the proportional limit. The hardening parameters for both MB1 and MB2 specimens are determined from the true stress vs. true strain data shown in Figure A4 through fitting of the logarithm of Equation (7) in the main body of the paper to the logarithms of true stress vs. logarithms of true strain data. The elastic material properties and the power law hardening parameters are shown in Table 4 in the main body of the paper.
Figure A4. True stress vs. true strain from LDD tension experiment for MB1 and MB2 rod material.
Applsci 11 09701 g0a4

References

  1. Zhou, W.; Shao, Z.; Yu, J.; Lin, J. Advances and Trends in Forming Curved Extrusion Profiles. Materials 2021, 14, 1603. [Google Scholar] [CrossRef]
  2. Hirsch, J. Aluminium Alloys for Automotive Application. Mater. Sci. Forum 1997, 242, 33–50. [Google Scholar] [CrossRef]
  3. Tisza, M.; Czinege, I. Comparative study of the application of steels and aluminium in lightweight production of automotive parts. Int. J. Light. Mater. Manuf. 2018, 1, 229–238. [Google Scholar] [CrossRef]
  4. Zhou, W.; Yu, J.; Lu, X.; Lin, J.; Dean, T.A. A comparative study on deformation mechanisms, microstructures and mechanical properties of wide thin-ribbed sections formed by sideways and forward extrusion. Int. J. Mach. Tools Manuf. 2021, 168, 103771. [Google Scholar] [CrossRef]
  5. Becker, D.; Schikorra, M.; Tekkaya, A.E. Manufacture of 3D Curved Profiles for Structure Components. Adv. Mater. Res. 2008, 43, 1–8. [Google Scholar] [CrossRef] [Green Version]
  6. Staupendahl, D.; Becker, C.; Weinrich, A.; Hermes, M.; Tekkaya, A.E. Innovative forming processes for tubes, profiles and sheets made of modern steel grades [Innovative umformverfahren für rohre, profile und bleche aus modernen stahlwerkstof-fen]. Stahl Eisen 2012, 132, 47–54. [Google Scholar]
  7. Tresca, H. Memoire sur l’écoulement des solides à de forte pressions. Acad. Sci. Paris 1864, 2, 59. [Google Scholar]
  8. Mises, R.V. Mechanik der festen Körper im plastisch-deformablen Zustand. Nachr. Ges. Wiss. Göttingen Math.-Phys. Kl. 1913, 1913, 582–592. [Google Scholar]
  9. Hill, R. A theory of the yielding and plastic flow of anisotropic metals. Proc. R. Soc. London. Ser. A Math. Phys. Sci. 1948, 193, 281–297. [Google Scholar] [CrossRef] [Green Version]
  10. Hill, R. Theoretical Plasticity of Textured Aggregates. In Mathematical Proceedings of the Cambridge Philosophical Society; Cambridge University Press: Cambridge, UK, 1979; Volume 85, pp. 179–191. [Google Scholar]
  11. Hill, R. Constitutive modelling of orthotropic plasticity in sheet metals. J. Mech. Phys. Solids 1990, 38, 405–417. [Google Scholar] [CrossRef]
  12. Hill, R. A user-friendly theory of orthotropic plasticity in sheet metals. Int. J. Mech. Sci. 1993, 35, 19–25. [Google Scholar] [CrossRef]
  13. Hosford, W.F. A generalized isotropic yield criterion. J. Appl. Mech. 1972, 39, 1172. [Google Scholar] [CrossRef]
  14. Gotoh, M. A theory of plastic anisotropy based on a yield function of fourth order (plane stress state)—I. Int. J. Mech. Sci. 1977, 19, 505–512. [Google Scholar] [CrossRef]
  15. Logan, R.W.; Hosford, W.F. Upper-bound anisotropic yield locus calculations assuming <111>-pencil glide. Int. J. Mech. Sci. 1980, 22, 419–430. [Google Scholar] [CrossRef] [Green Version]
  16. Barlat, F.; Lian, K. Plastic behavior and stretchability of sheet metals. Part I: A yield function for orthotropic sheets under plane stress conditions. Int. J. Plast. 1989, 5, 51–66. [Google Scholar] [CrossRef]
  17. Barlat, F.; Lege, D.J.; Brem, J.C. A six-component yield function for anisotropic materials. Int. J. Plast. 1991, 7, 693–712. [Google Scholar] [CrossRef]
  18. Barlat, F.; Maeda, Y.; Chung, K.; Yanagawa, M.; Brem, J.C.; Hayashida, Y.; Lege, D.J.; Matsui, K.; Murtha, S.J.; Hattori, S.; et al. Yield function develop-ment for aluminum alloy sheets. J. Mech. Phys. Solids 1997, 45, 1727–1763. [Google Scholar] [CrossRef]
  19. Barlat, F.; Becker, R.; Hayashida, Y.; Maeda, Y.; Yanagawa, M.; Chung, K.; Brem, J.; Lege, D.; Matsui, K.; Murtha, S.; et al. Yielding description for solution strengthened aluminum alloys. Int. J. Plast. 1997, 13, 385–401. [Google Scholar] [CrossRef]
  20. Barlat, F.; Brem, J.; Yoon, J.W.; Chung, K.; Dick, R.; Lege, D.; Pourboghrat, F.; Choi, S.-H.; Chu, E. Plane stress yield function for aluminum alloy sheets—part 1: Theory. Int. J. Plast. 2003, 19, 1297–1319. [Google Scholar] [CrossRef]
  21. Barlat, F.; Aretz, H.; Yoon, J.W.; Karabin, M.; Brem, J.; Dick, R. Linear transfomation-based anisotropic yield functions. Int. J. Plast. 2005, 21, 1009–1039. [Google Scholar] [CrossRef]
  22. Karafillis, A.; Boyce, M. A general anisotropic yield criterion using bounds and a transformation weighting tensor. J. Mech. Phys. Solids 1993, 41, 1859–1886. [Google Scholar] [CrossRef]
  23. Bron, F.; Besson, J. A yield function for anisotropic materials Application to aluminum alloys. Int. J. Plast. 2004, 20, 937–963. [Google Scholar] [CrossRef]
  24. Cazacu, O.; Plunkett, B.; Barlat, F. Orthotropic yield criterion for hexagonal closed packed metals. Int. J. Plast. 2006, 22, 1171–1194. [Google Scholar] [CrossRef]
  25. Plunkett, B.; Cazacu, O.; Barlat, F. Orthotropic yield criteria for description of the anisotropy in tension and com-pression of sheet metals. Int. J. Plast. 2008, 24, 847–866. [Google Scholar] [CrossRef]
  26. Bai, Y.; Wierzbicki, T. A new model of metal plasticity and fracture with pressure and Lode dependence. Int. J. Plast. 2008, 24, 1071–1096. [Google Scholar] [CrossRef]
  27. Fourmeau, M.; Børvik, T.; Benallal, A.; Lademo, O.G.; Hopperstad, O.S. On the plastic anisotropy of an aluminium alloy and its influence on constrained multi-axial flow. Int. J. Plast. 2011, 27, 2005–2025. [Google Scholar] [CrossRef]
  28. Tardif, N.; Kyriakides, S. Determination of anisotropy and material hardening for aluminum sheet metal. Int. J. Solids Struct. 2012, 49, 3496–3506. [Google Scholar] [CrossRef] [Green Version]
  29. Korkolis, Y.; Kyriakides, S. Inflation and burst of anisotropic aluminum tubes for hydroforming applications. Int. J. Plast. 2008, 24, 509–543. [Google Scholar] [CrossRef]
  30. Korkolis, Y.P.; Kyriakides, S. Inflation and burst of aluminum tubes. Part II: An advanced yield function including deformation-induced anisotropy. Int. J. Plast. 2008, 24, 1625–1637. [Google Scholar] [CrossRef]
  31. Korkolis, Y.P.; Kyriakides, S. Hydroforming of anisotropic aluminum tubes: Part II analysis. Int. J. Mech. Sci. 2011, 53, 83–90. [Google Scholar] [CrossRef]
  32. Korkolis, Y.P.; Kyriakides, S. Path-dependent failure of inflated aluminum tubes. Int. J. Plast. 2009, 25, 2059–2080. [Google Scholar] [CrossRef]
  33. Korkolis, Y.P.; Kyriakides, S.; Giagmouris, T.; Lee, L.-H. Constitutive Modeling and Rupture Predictions of Al-6061-T6 Tubes Under Biaxial Loading Paths. J. Appl. Mech. 2010, 77, 064501. [Google Scholar] [CrossRef]
  34. Giagmouris, T.; Kyriakides, S.; Korkolis, Y.; Lee, L.-H. On the localization and failure in aluminum shells due to crushing induced bending and tension. Int. J. Solids Struct. 2010, 47, 2680–2692. [Google Scholar] [CrossRef] [Green Version]
  35. Seidt, J.; Gilat, A. Plastic deformation of 2024-T351 aluminum plate over a wide range of loading conditions. Int. J. Solids Struct. 2013, 50, 1781–1790. [Google Scholar] [CrossRef]
  36. Zhang, K.; Holmedal, B.; Hopperstad, O.; Dumoulin, S.; Gawad, J.; Van Bael, A.; Van Houtte, P. Multi-level modelling of mechanical anisotropy of commercial pure aluminium plate: Crystal plasticity models, advanced yield functions and parameter identification. Int. J. Plast. 2014, 66, 3–30. [Google Scholar] [CrossRef]
  37. Kuwabara, T.; Mori, T.; Asano, M.; Hakoyama, T.; Barlat, F. Material modeling of 6016-O and 6016-T4 aluminum alloy sheets and application to hole expansion forming simulation. Int. J. Plast. 2016, 93, 164–186. [Google Scholar] [CrossRef]
  38. Esmaeilpour, R.; Kim, H.; Park, T.; Pourboghrat, F.; Mohammed, B. Comparison of 3D yield functions for finite element simulation of single point incremental forming (SPIF) of aluminum 7075. Int. J. Mech. Sci. 2017, 133, 544–554. [Google Scholar] [CrossRef]
  39. Esmaeilpour, R.; Kim, H.; Park, T.; Pourboghrat, F.; Xu, Z.; Mohammed, B.; Abu-Farha, F. Calibration of Barlat Yld2004-18P yield function using CPFEM and 3D RVE for the simulation of single point incremental forming (SPIF) of 7075-O aluminum sheet. Int. J. Mech. Sci. 2018, 145, 24–41. [Google Scholar] [CrossRef]
  40. Pahlevanpour, A.; Behravesh, S.; Adibnazari, S.; Jahed, H. Characterization of anisotropic behaviour of ZK60 extrusion under stress-control condition and notes on fatigue modeling. Int. J. Fatigue 2019, 127, 101–109. [Google Scholar] [CrossRef]
  41. Mooney, B.; Kourousis, K.I.; Raghavendra, R.; Agius, D. Process phenomena influencing the tensile and anisotropic characteristics of additively manufactured maraging steel. Mater. Sci. Eng. A 2018, 745, 115–125. [Google Scholar] [CrossRef]
  42. Kondori, B.; Madi, Y.; Besson, J.; Benzerga, A. Evolution of the 3D plastic anisotropy of HCP metals: Experiments and modeling. Int. J. Plast. 2019, 117, 71–92. [Google Scholar] [CrossRef]
  43. Rahmaan, T.; Noder, J.; Abedini, A.; Zhou, P.; Butcher, C.; Worswick, M.J. Anisotropic plasticity characterization of 6000- and 7000-series aluminum sheet alloys at various strain rates. Int. J. Impact Eng. 2019, 135, 103390. [Google Scholar] [CrossRef]
  44. Sutton, M.A.; Deng, X.; Liu, J.; Yang, L. Determination of elastic-plastic stresses and strains from measured surface strain data. Exp. Mech. 1996, 36, 99–112. [Google Scholar] [CrossRef]
  45. Kim, J.H.; Serpantié, A.; Barlat, F.; Pierron, F.; Lee, M.G. Characterization of the post-necking strain hardening be-havior using the virtual fields method. Int. J. Solids Struct. 2013, 50, 3829–3842. [Google Scholar] [CrossRef] [Green Version]
  46. Pannier, Y.; Avril, S.; Rotinat, R.; Pierron, F. Identification of Elasto-Plastic Constitutive Parameters from Statically Undetermined Tests Using the Virtual Fields Method. Exp. Mech. 2006, 46, 735–755. [Google Scholar] [CrossRef] [Green Version]
  47. Avril, S.; Pierron, F.; Pannier, Y.; Rotinat, R. Stress Reconstruction and Constitutive Parameter Identification in Plane-Stress Elasto-plastic Problems Using Surface Measurements of Deformation Fields. Exp. Mech. 2007, 48, 403–419. [Google Scholar] [CrossRef]
  48. Coppieters, S.; Cooreman, S.; Sol, H.; Van Houtte, P.; Debruyne, D. Identification of the post-necking hardening behaviour of sheet metal by comparison of the internal and external work in the necking zone. J. Mater. Process. Technol. 2011, 211, 545–552. [Google Scholar] [CrossRef]
  49. Coppieters, S.; Kuwabara, T. Identification of Post-Necking Hardening Phenomena in Ductile Sheet Metal. Exp. Mech. 2014, 54, 1355–1371. [Google Scholar] [CrossRef] [Green Version]
  50. Ludwik, P. Elemente der Technologischen Mechanik; Springer: Berlin/Heidelberg, Germany, 1909. [Google Scholar] [CrossRef]
  51. Hollomon, J.H. Tensile deformation. Aime Trans. 1945, 12, 1–22. [Google Scholar]
  52. Voce, E. The relationship between stress and strain for homogeneous deformation. J. Inst. Met. 1948, 74, 537–562. [Google Scholar]
  53. Swift, H. Plastic instability under plane stress. J. Mech. Phys. Solids 1952, 1, 1–18. [Google Scholar] [CrossRef]
  54. Ludwigsen, D.C. Modified stress-strain relation for FCC metals and alloys. Metall. Trans. 1971, 2, 2825–2828. [Google Scholar] [CrossRef]
  55. Stoughton, T.B.; Yoon, J.W. Anisotropic hardening and non-associated flow in proportional loading of sheet metals. Int. J. Plast. 2009, 25, 1777–1817. [Google Scholar] [CrossRef]
  56. Rousselier, G.; Barlat, F.; Yoon, J.W. A novel approach for anisotropic hardening modeling. Part II: Anisotropic hardening in proportional and non-proportional loadings, application to initially isotropic material. Int. J. Plast. 2010, 26, 1029–1049. [Google Scholar] [CrossRef]
  57. Feng, X.; Cui, B.; Liu, Y.; Li, L.; Shi, X.; Zhang, X. Curved-layered material extrusion modeling for thin-walled parts by a 5-axis machine. Rapid Prototyp. J. 2021, 27, 1378–1387. [Google Scholar] [CrossRef]
  58. Vyavahare, S.; Teraiya, S.; Kumar, S. Auxetic structures fabricated by material extrusion: An experimental investigation of gradient parameters. Rapid Prototyp. J. 2021, 27, 1041–1058. [Google Scholar] [CrossRef]
  59. Jiang, S.; Sun, M.; Zhan, Y.; Li, H.; Sun, W. A dynamic model of laminated material extrusion additive manufacturing plate with the property of orthogonal anisotropy. Rapid Prototyp. J. 2021, 27, 785–796. [Google Scholar] [CrossRef]
  60. Parpala, R.C.; Popescu, D.; Pupaza, C. Infill parameters influence over the natural frequencies of ABS specimens obtained by extrusion-based 3D printing. Rapid Prototyp. J. 2021, 27, 1273–1285. [Google Scholar] [CrossRef]
  61. Kaill, N.; Campbell, R.; Pradel, P. Porosity in multi-axis material extrusion of short-fibre composites. Rapid Prototyp. J. 2021, 27, 362–370. [Google Scholar] [CrossRef]
  62. Meguid, S.A.; Malvern, L.E. An Experimental Investigation into the Plastic Flow and Strain Hardening of Mild Steel Under Proportional and Abruptly Changing Deformation Paths at a Controlled Rate. J. Eng. Mater. Technol. 1983, 105, 147–154. [Google Scholar] [CrossRef]
  63. Correlated Solutions, Inc. Available online: https://www.correlatedsolutions.com/ (accessed on 1 July 2020).
  64. Kahn-Jetter, Z.L.; Chu, T. Three-dimensional displacement measurements using digital image correlation and photogrammic analysis. Exp. Mech. 1990, 30, 10–16. [Google Scholar] [CrossRef]
  65. Luo, P.F.; Chao, Y.J.; Sutton, M.A.; Peters, W.H. Accurate measurement of three-dimensional deformations in deformable and rigid bodies using computer vision. Exp. Mech. 1993, 33, 123–132. [Google Scholar] [CrossRef]
  66. Sutton, M.A.; Orteu, J.J.; Schreier, H. Image Correlation for Shape, Motion and Deformation Measurements: Basic Concepts, Theory and Applications; Springer Science & Business Media: Boston, MA, USA, 2009. [Google Scholar]
  67. Sutton, M.A.; Yan, J.H.; Tiwari, V.; Schreier, H.W.; Orteu, J.J. The effect of out-of-plane motion on 2D and 3D digital image correlation measurements. Opt. Lasers Eng. 2008, 46, 746–757. [Google Scholar] [CrossRef] [Green Version]
  68. Yasmeen, F.; Rajan, S.; Sutton, M.A.; Schreier, H.W. Experimental Study of Measurement Errors in 3D-DIC Due to Out-of-Plane Specimen Rotation. In International Digital Imaging Correlation Society; Springer: Cham, Switzerland, 2017; pp. 211–215. [Google Scholar] [CrossRef]
  69. Yasmeen, F.; Balcaen, R.; Sutton, M.A.; Debruyne, D.; Rajan, S.; Schreier, H.W. Sensitivity of in-plane strain measurement to calibration parameter for out-of-plane specimen rotations. Exp. Mech. 2018, 58, 1115–1132. [Google Scholar] [CrossRef]
  70. Yasmeen, F.; Sutton, M.A.; Rajan, S.; Schreier, H.; Campbell, A. Effect of surface normal variability on local surface strain measurements in StereoDIC. Opt. Lasers Eng. 2020, 138, 106373. [Google Scholar] [CrossRef]
  71. Psylotech Incorporated. 2006. Available online: https://www.psylotech.com/μs/ (accessed on 1 July 2020).
Figure 1. Microstructure of (a) Al6061-T6 MB1, and (b) Al6061-T6 MB2 longitudinally extruded round bar specimens. Images obtained at 1000X using a Keyence microscope. The axes X and Y represent the radial and longitudinal directions, respectively.
Applsci 11 09701 g001
Figure 2. Coordinate system used throughout the developments. The X-axis is an arbitrarily selected radial direction that approximately corresponds to the bisector between the pair of stereo-cameras used for surface strain measurements (see Appendix A). The Y-axis is in the longitudinal direction. The Z axis is another radial direction that is orthogonal to X and Y.
Applsci 11 09701 g002
Figure 3. MB1 specimen results for (a) true stress vs. true strain measurements for tension loading of the LDD, RDD0, RDD45, and RDD90 specimens and (b) shear stress vs. shear strain for torsion of LDT specimens.
Applsci 11 09701 g003
Figure 4. MB2 specimen results for (a) true stress vs. true strain measurements for tension loading of the LDD, RDD0, RDD45, and RDD90 specimens and (b) shear stress vs. shear strain for torsion of LDT specimens.
Applsci 11 09701 g004
Figure 5. Predicted normalized yield surfaces for biaxial stress states with Barlat and Von Mises yield function for two Al 6061-T6 bar.
Applsci 11 09701 g005
Figure 6. Flow chart theoretical prediction of total shear strain using isotropic and anisotropic yield criteria.
Applsci 11 09701 g006
Figure 7. Torque vs. time data acquired from electro-mechanical system load cell during simple torsion experiments.
Applsci 11 09701 g007
Figure 8. Comparison of experimental and theoretical shear stress vs. total shear strain response for Al6061-T6, MB1.
Applsci 11 09701 g008
Figure 9. Comparison of experimental and theoretical shear stress vs. total shear strain response for Al6061-T6, MB2.
Applsci 11 09701 g009
Table 1. Mechanical properties and chemical composition of Al6061-T6 MB1 and MB2 tubes given by the manufacturer (McMaster-Carr).
Rod StockMechanical PropertiesChemical Composition
AlloyDia (mm)Ultimate Strength (MPa)Yield Strength (MPa)Elongation (%)SiFeCuMnMgCrZnTi
MinMaxMinMaxMinMax
6061-T6 MB128.575317.2327.5286.1299.416.5180.710.280.330.050.890.050.020.02
6061-T6 MB228.575341.3375.8319.3355.815.819.50.760.370.330.110.900.110.060.03
Table 2. Experimental Scheme for determining material properties of Al 6061-T6 MB1 and MB2 bar.
Trial NoModeLoad CellStrain Measurement ApproachSpecimenMaterial
Al 6061-T6
Number of Experiments
1TensionMTSExtensometerLDDMB12
MB22
2TensionPsylotech micro- tensile testerVIC 3D with stereo
microscope
RDD0MB12
MB22
RDD45MB12
MB22
RDD90
MB12
MB22
3TorsionElectromechanical TestResources frame with torsion load cellsVIC 3D software with
standard cameras
LDTMB12
MB22
Table 3. Anisotropic yield function parameters for longitudinally extruded Al6061-T6 rods.
6061-T6 Al Tubemabcfgh
MB181.00001.15161.0000.87501.08350.8750
MB281.00001.44521.0001.20691.30591.2069
Table 4. Elastic properties and power law hardening parameters.
Material Properties6061-T6 Al Tube (MB1)6061-T6 Al Tube (MB2)
Modulus of Elasticity69 Gpa69 Gpa
Poisson’s ratio0.330.33
Hardening Parameter, n13.5116.47
Publisher’s Note: MDPI stays neutral with regard to jurisdictional claims in published maps and institutional affiliations.

