Article

A Cross-Correlation-Based Approach to Pattern Distortion and Mutual Coupling for Shared-Aperture Antennas

1
Department of Electrical Engineering, Ulsan National Institute of Science and Technology (UNIST), Ulsan 44919, Korea
2
LIG Nex1, Co., Ltd., Seongnam 13488, Korea
*
Author to whom correspondence should be addressed.
Appl. Sci. 2021, 11(20), 9652; https://doi.org/10.3390/app11209652
Submission received: 8 September 2021 / Revised: 7 October 2021 / Accepted: 11 October 2021 / Published: 15 October 2021

Abstract

:

Featured Application

Although the proposed method is originally used for shared-aperture antennas that are composed of multiple antennas operating in different frequency bands for various applications, such as radar, electronic warfare, and communications, we think that the proposed approach can also be extended to any application where both mutual coupling and platform effects seriously affect antenna characteristics.

Abstract

This paper proposes a pattern distortion coefficient as a new figure of merit to quantitatively evaluate both mutual coupling and pattern distortions in multi-antenna systems. The proposed coefficient is defined as a cross correlation between unaffected and affected far-field patterns of antennas under test, and the input patterns are weighted using a Gaussian function to consider the target operation angle. The feasibility of the proposed approach is validated using a two-antenna system composed of an inverted-F antenna and a microstrip patch antenna, and the amount of mutual coupling is adjusted by changing the distance between the two antennas. The evaluation is further extended to a single-antenna system with a conducting wall that produces strong platform effects with serious pattern distortions. The results demonstrate that the proposed figure of merit provides quantitative insight into the amplitude and phase distortions of far-field patterns that can be caused by both mutual coupling and platform effects.

1. Introduction

Military mobile platforms, such as naval ships and unmanned aerial vehicles, are equipped with multiple antenna systems operating on different frequency bands to perform various missions: radar, electronic warfare (EW), and communications [1,2,3]. However, the installation of multiple antennas often raises the radar detection rate, especially when more antennas are protruded from the body of the mobile platforms, due to increased radar cross sections [4,5,6,7]. Thus, active research has been carried out on a shared-aperture antenna (SAA) to integrate multiple antennas into a limited space below the surface for future mobile platforms [8,9,10]. Although the SAA allows for a reduced detection rate and various functionalities, there are some inevitable issues that must be resolved to allow its practical use. First, the probability of a system malfunction may increase due to wave scattering and mutual interference between nearby antennas arranged within a restricted aperture area [11]. The interference becomes more significant when operating frequencies, including harmonic resonances, are overlapped with each other, which is unavoidable because the EW antenna occupies a broad bandwidth with a max–min frequency ratio greater than 10:1 [12,13]. Second, the radiation properties of high-band antennas are often distorted by the electrically large geometry of low-band antennas due to serious platform effects—i.e., wave scattering, reflection, blockage, and diffraction [14,15,16]. Third, scan blindness occurs in beamforming operations when radar antennas exhibit strong mutual coupling [17,18]. Therefore, it is essential to suppress the mutual coupling while preventing undesired pattern distortions caused by platform effects. Note that pattern distortion also occurs when strong mutual coupling exists; however, scattering parameters do not fully represent the degree of pattern distortion, but only the amount of power coupled to other antenna ports [19]. Although there is an alternative approach to a quantitative evaluation of pattern distortion that calculates the average deviation between stand-alone and distorted patterns [20], it is not suitable for estimating phase distortions that are critical for the beamforming operation. Thus, there has been increasing demand for a new figure of merit (FoM) that fully considers the effects of both mutual coupling and pattern distortion.
In this paper, we propose a pattern distortion coefficient as a new FoM for quantitatively evaluating both mutual coupling and pattern distortions in multi-antenna systems. The proposed coefficient is defined as a cross correlation between unaffected and affected far-field patterns of an antenna under testing (AUT) for any cause: mutual coupling, platform effects, or both. It is worth noting that the unaffected pattern must be obtained by eliminating only the cause of what we are interested in, herein called “cause of interest”. For instance, if we are interested in the effect of only a low-band antenna, then the proposed pattern distortion coefficient should be calculated by analyzing the far-field patterns of the AUT with and without the low-band antenna. In our approach, the input patterns were weighted using a Gaussian function whose mean and standard deviation were adjusted to specify the main angular range for the target antenna operation. The proposed FoM was evaluated for a two-antenna system composed of an inverted-F antenna (IFA) operating at 1.5 GHz and a microstrip patch antenna with a resonant frequency of 6 GHz. The standard deviation of the Gaussian weights was adjusted to allow us to better see the tendency, and the results were compared with the conventional mutual coupling by changing the antenna interval and observation frequency. The evaluation was further extended to a single-antenna system mounted beside a conducting wall that generated strong platform effects to provide a quantitative insight into the amplitude and phase distortions of far-field patterns. Sample antennas were then fabricated to mimic the evaluation scenarios above, and the feasibility of the proposed approach was demonstrated through measurement. The results confirm that the proposed FoM can well-describe pattern distortions caused by both mutual coupling and platform effects.

2. Proposed Pattern Distortion Coefficient

Figure 1a shows a two-antenna system composed of a conventional IFA and a probe-fed patch antenna are mounted on a conducting ground with dimensions of 200 mm × 200 mm. Their design parameters are tuned for resonance at 1.5 GHz and 6 GHz, respectively, and detailed values are listed in Table 1. Note that this system is an example that describes an SAA with two antenna types operating in different frequency bands, and the antenna can be any type operating at any frequency that the SAA system requires. The pattern distortion coefficient, ρPDC, is then defined by:
ρ P D C = 4 π [ E u n ¯ ( θ , ϕ ) E a f f ¯ * ( θ , ϕ ) ] g ( θ , ϕ ) d Ω 4 π [ E u n ¯ ( θ , ϕ ) E u n ¯ * ( θ , ϕ ) ] g ( θ , ϕ ) d Ω 4 π [ E a f f ¯ ( θ , ϕ ) E a f f ¯ * ( θ , ϕ ) ] g ( θ , ϕ ) d Ω
where E u n ¯ ( θ , ϕ ) indicates an unaffected far-field pattern that is obtained without the cause of interest, as in Figure 1b, and E a f f ¯ ( θ , ϕ ) represents a distorted pattern of the AUT. The cross correlation between the unaffected and affected pattern—i.e., E u n ¯ θ , ϕ E a f f ¯ * ( θ , ϕ ) —is weighted by the Gaussian function, which is written as:
g ( θ , ϕ ) = 1 2 π σ θ σ ϕ exp ( θ μ θ ) 2 2 σ θ 2 ( ϕ μ ϕ ) 2 2 σ ϕ 2 ,
where μ and σ indicate the mean and standard deviation. This equation can be reduced to:
g ( θ ) = 1 2 π σ θ exp ( θ μ θ ) 2 2 σ θ 2 ,
when the Gaussian weighting is applied only in the θ-direction. In the same manner, the Gaussian function is weighted to the auto-correlation of each pattern with a denominator of (1) for normalization purposes. Figure 2a shows a Gaussian function determined by μθ = 0° and σθ = 43.5°. Figure 2b presents a comparison of the radiation patterns before and after the Gaussian weighting for a microstrip patch antenna, whose half-power beamwidth is 102°. As can be seen, by applying the Gaussian weighting the degree of pattern distortion can be anticipated mainly within the target angular range required for its operation. Note that the definition of the proposed FoM is distinguished with an envelope correlation coefficient (ECC) because of the input far-field patterns. More specifically, the ECC is widely used to evaluate the channel capacity for multi-input and multi-output (MIMO) antennas and uses the far-field patterns of two different antennas that have the same resonant frequency. Conversely, the proposed approach takes an input from the same antenna before and after distortion; thus, the proposed FoM can be used to evaluate the distortion by any cause of interest—e.g., mutual coupling, platform effects, or both—at any frequency. Furthermore, by the given definition, the proposed FoM is also capable of evaluating a single-antenna system for pattern distortion affected by platform effects, whereas none of the other FoMs are capable of such evaluation.

3. Demonstration of the Proposed Approach

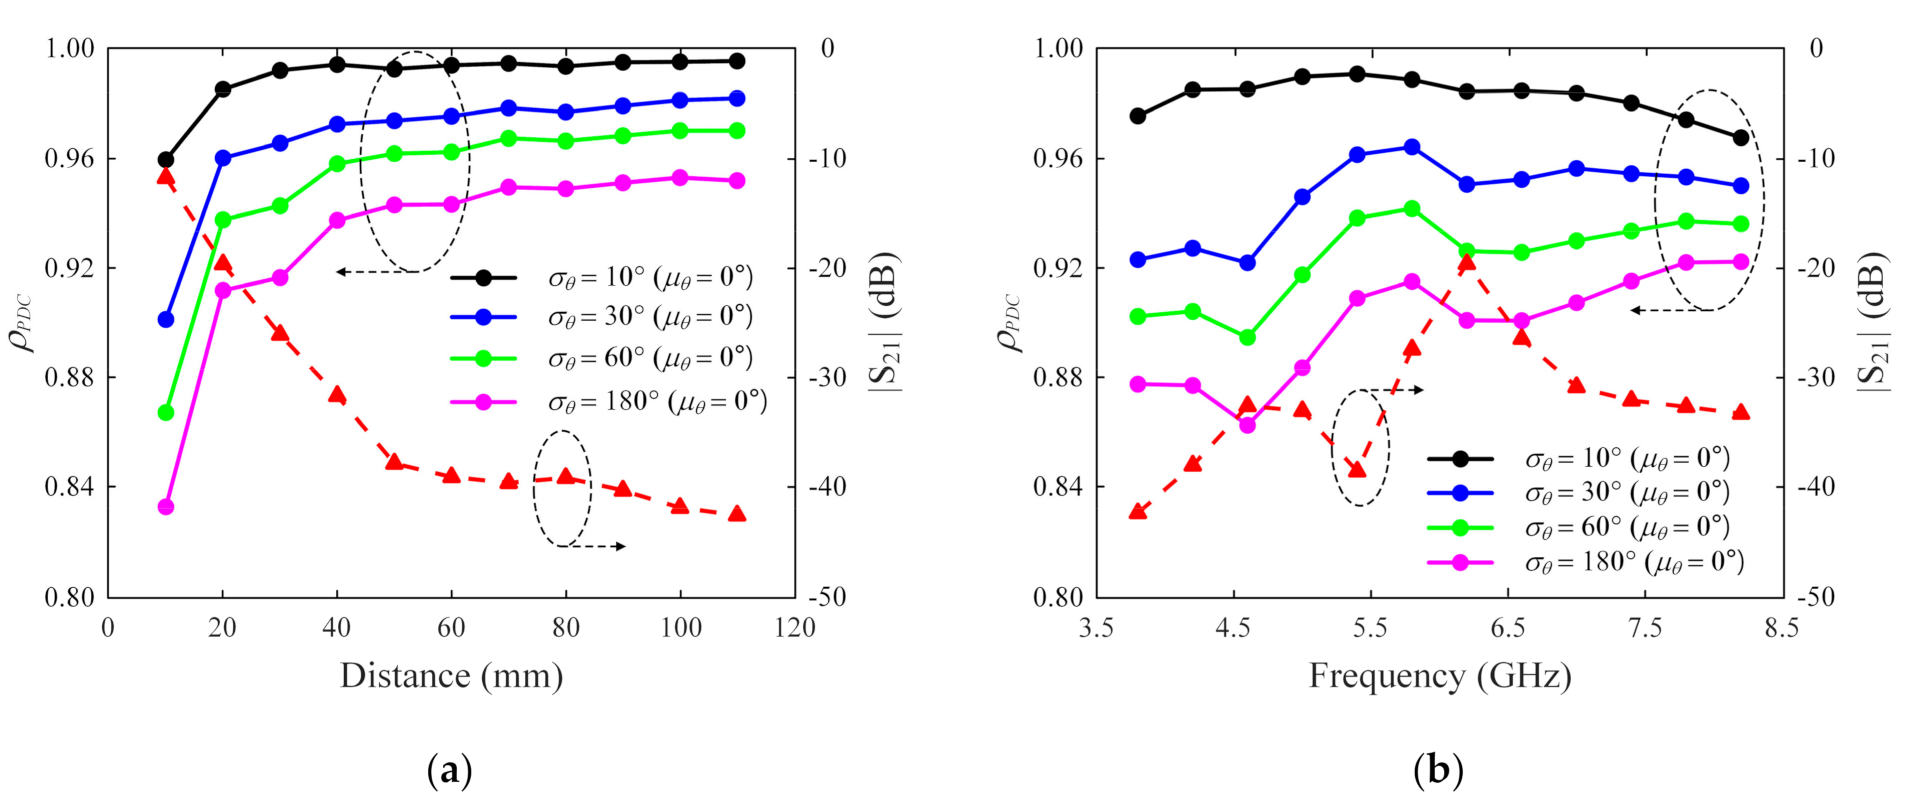
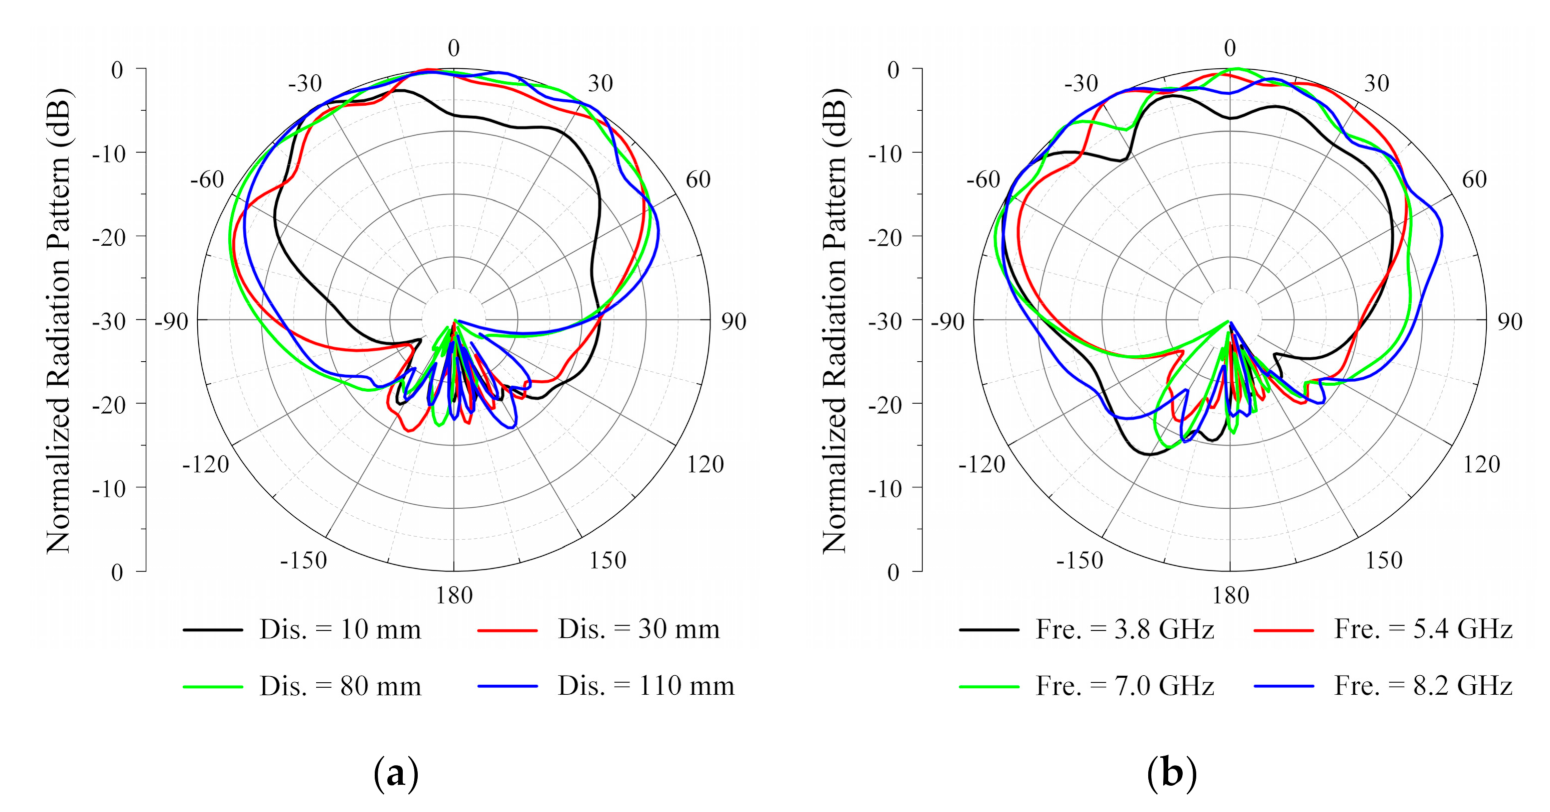
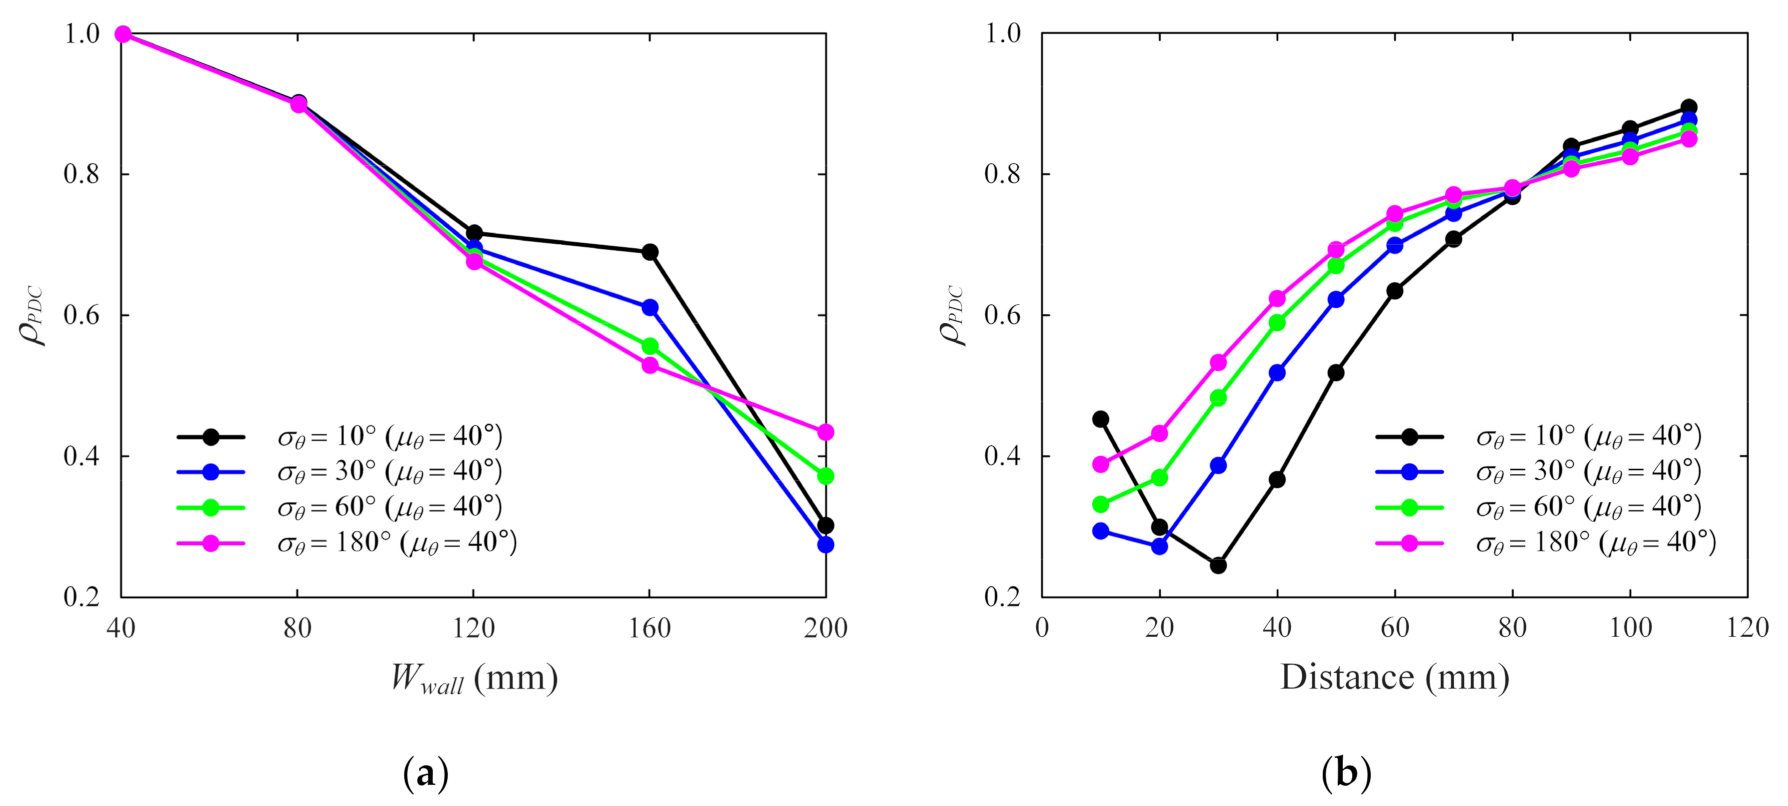
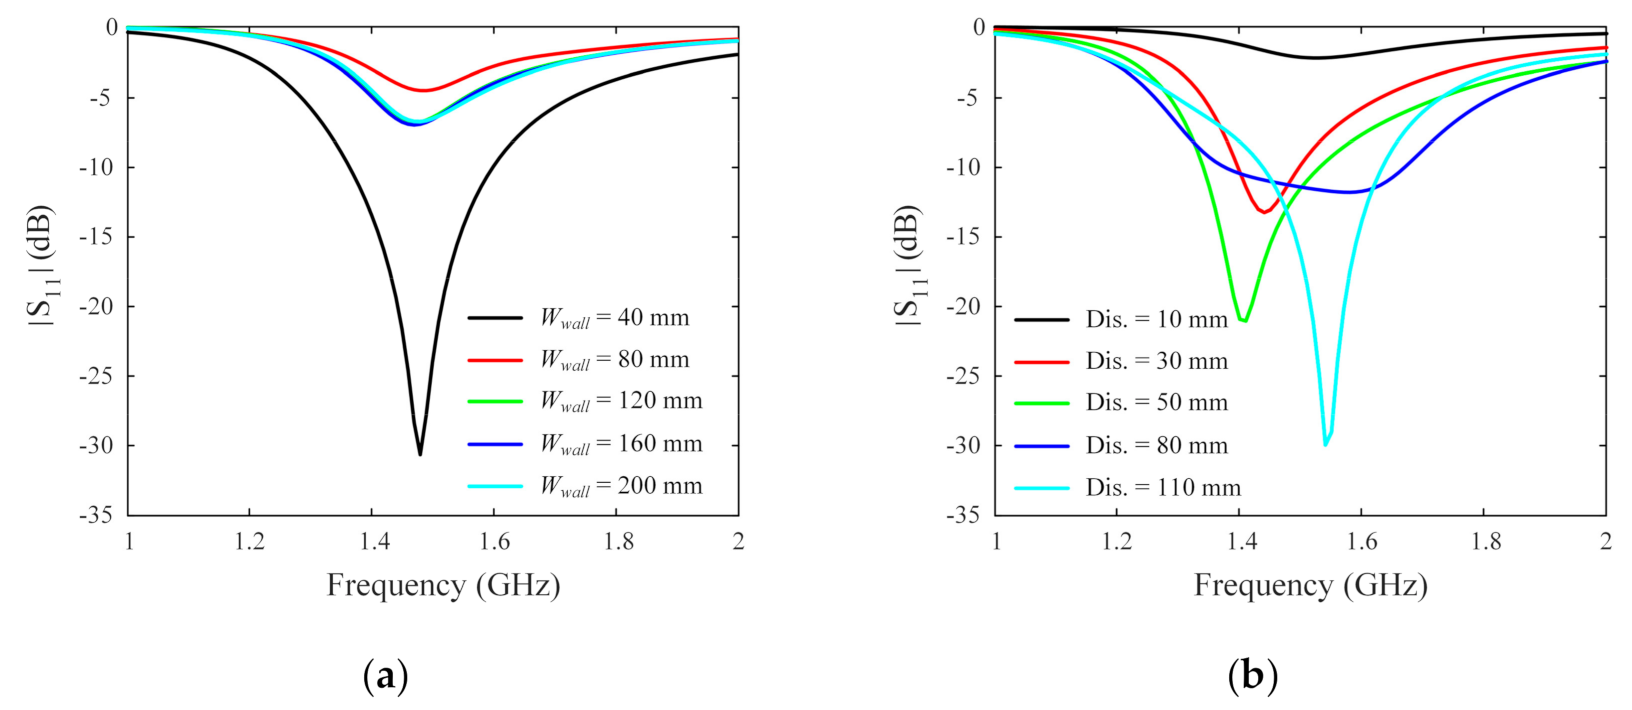
3.1. Parametric Studies

Figure 3a shows the variations in ρPDC according to the distance between two antennas. In this observation, the position of the patch antenna is adjusted, while the port of the IFA is located at a reference point, Pref. The mutual coupling is presented by |S21|, given as a red dashed line, and is compared to ρPDC, which is calculated using weighted patterns with different σθ from 10° to 180° for the same μθ of 0°. The reason we provided comparisons between ρPDC and |S21| is to demonstrate if the proposed coefficient can reflect the effect of mutual coupling as well as the pattern distortion. Indeed, the electrically large geometry of the lower-band antenna and its harmonic resonances can cause unexpected increases in mutual coupling and pattern distortion in higher-band spectrums. The results show that ρPDC tends to increase as σθ decreases because the observation window of θ becomes narrower. In addition, both ρPDC and |S21| show a convergence behavior in an inverse proportional manner, and ρPDC drops to 0.83 for σθ = 180° as |S21| rises to −11 dB at 10 mm. These results imply that pattern distortion is highly correlated to mutual coupling, which is well-represented by ρPDC. Therefore, we can give a design guideline for the SAA that, for instance, the distance between the two antennas should be maintained at greater than 20 mm for ρPDC ≥ 0.9. Figure 3b presents ρPDC variations in terms of frequency when the distance is fixed at 20 mm. |S21| varies between −20 dB and −42 dB and shows two peaks of −32 dB and −20 dB at 4.6 GHz and 6.2 GHz, respectively. The purpose of measuring the variation in ρPDC according to frequency is to confirm if our approach is effective for the out-of-band emission as well as the pattern distortion, simultaneously. In general, |S21| provides better insight to the system interference from the power standpoint; however, pattern distortion can be another critical issue caused by mutual coupling, especially in the SAA. It is worth pointing out that the lower peak at 4.6 GHz exhibits a more distorted pattern with ρPDC = 0.86 at σθ = 180° compared to the higher peak whose ρPDC is greater than 0.9. This is because ρPDC does not measure the pattern distortion caused by only the mutual coupling but also the other causes from the surrounding environment, such as nearby antennas and platforms. Although the conventional approach of calculating the maximum pattern deviation can be an easy interpretation to the pattern distortion, it provides only the amplitude deviation. In contrast, the proposed coefficient considers both the amplitude and phase distortion of the radiation patterns, which has potential benefits in beamforming operations.
Figure 4a presents the distorted radiation patterns of the patch antenna at 6 GHz with respect to the distance. The pattern distortion of the antenna becomes more obvious as the distance to the IFA decreases. This corresponds to the tendency shown in Figure 3a—that is, ρPDC has a lower value when the patch is closer to the IFA. The distorted radiation patterns of the patch antenna according to the frequency are shown in Figure 4b. This also shows that the proposed coefficient represents the amount of distortion in the radiation pattern of an AUT well.
The evaluation is extended to a single-antenna system with an IFA mounted beside a conducting wall whose height and width are Hwall and Wwall, as illustrated in Figure 5. The given environment produces strong platform effects, and unaffected patterns are separately calculated for each distance to the wall. It is assumed that Hwall is scaled as Wwall/2, and μθ is 40°, which indicates the angle of the maximum gain of the stand-alone IFA. Figure 6a shows the variations in ρPDC for various Wwall at 20 mm, while Figure 6b presents those for different distances with Wwall = 200 mm. As can be seen, when Wwall = 40 mm, ρPDC is close to unity, which implies that the pattern is almost identical to the case without the conducting wall. However, ρPDC is drastically reduced to 0.27 when Wwall becomes larger; thus, Wwall should be smaller than 80 mm for ρPDC ≥ 0.9. A similar trend can be observed in the case of the distance variations, and the antenna should be placed 80 mm away from the wall to guarantee ρPDC ≥ 0.8.
Figure 7a,b show the distorted radiation patterns of the IFA at 1.5 GHz according to the size of the conducting wall and the distance, respectively. It is obvious that the patterns are more distorted for larger platform sizes and closer distances, which agrees well with the trend of ρPDC presented in Figure 6. Figure 8 presents the variations in |S11| for the IFA mounted beside the wall with different design parameters. As can be seen in Figure 8a, the conducting wall size affects the level of |S11|, while the distance to the wall causes unexpected frequency shifts with distortions of impedance matching properties, as illustrated in Figure 8b.

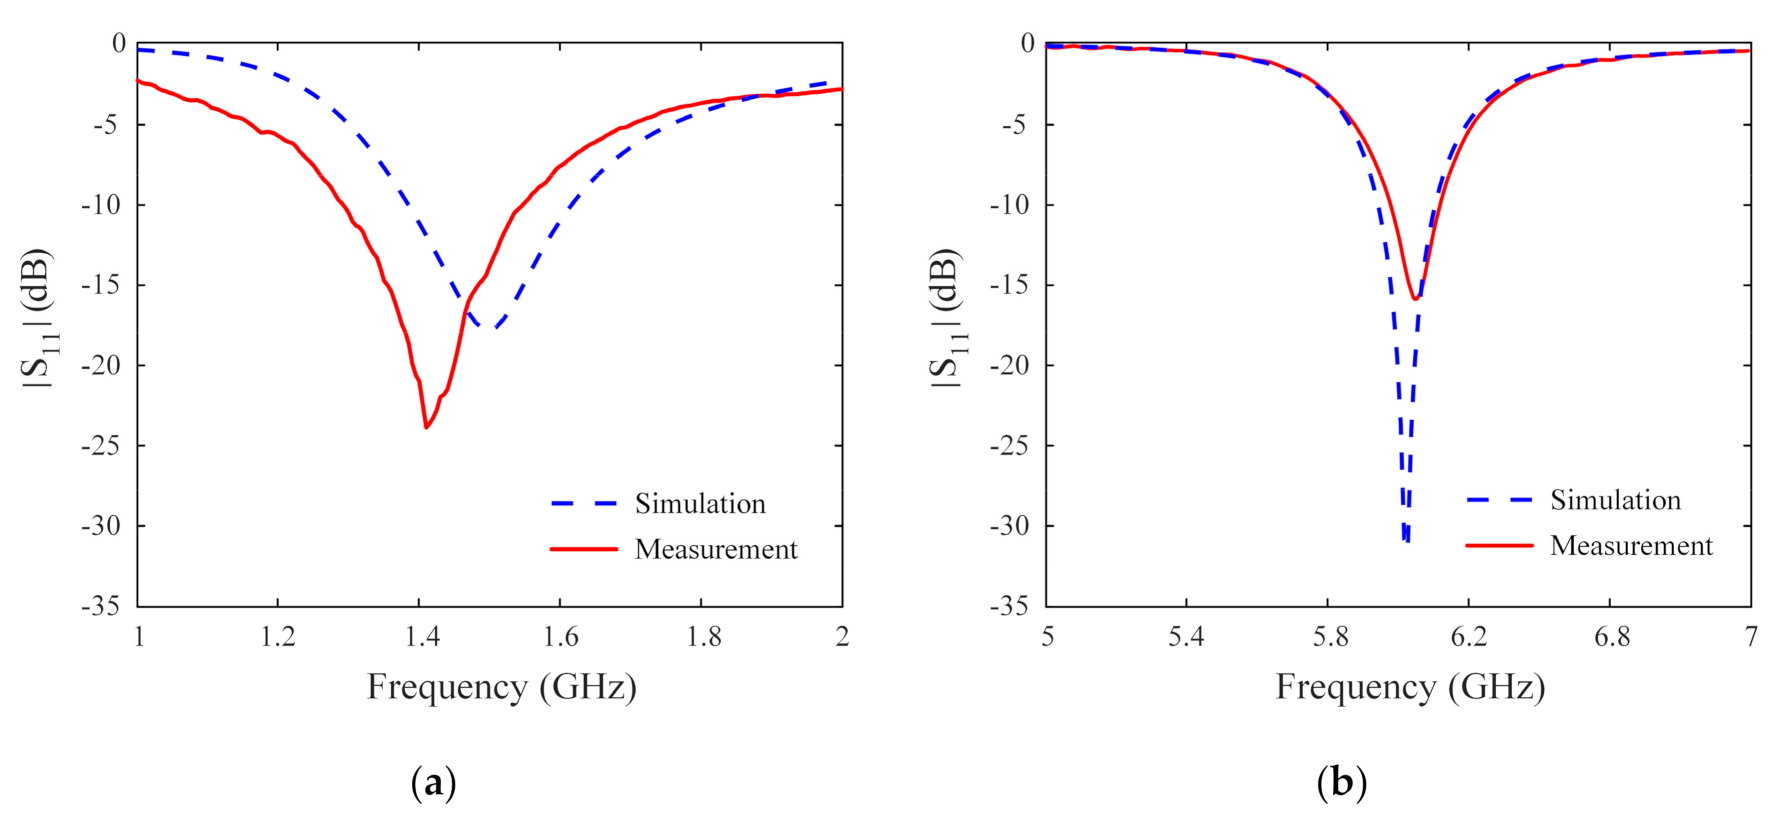
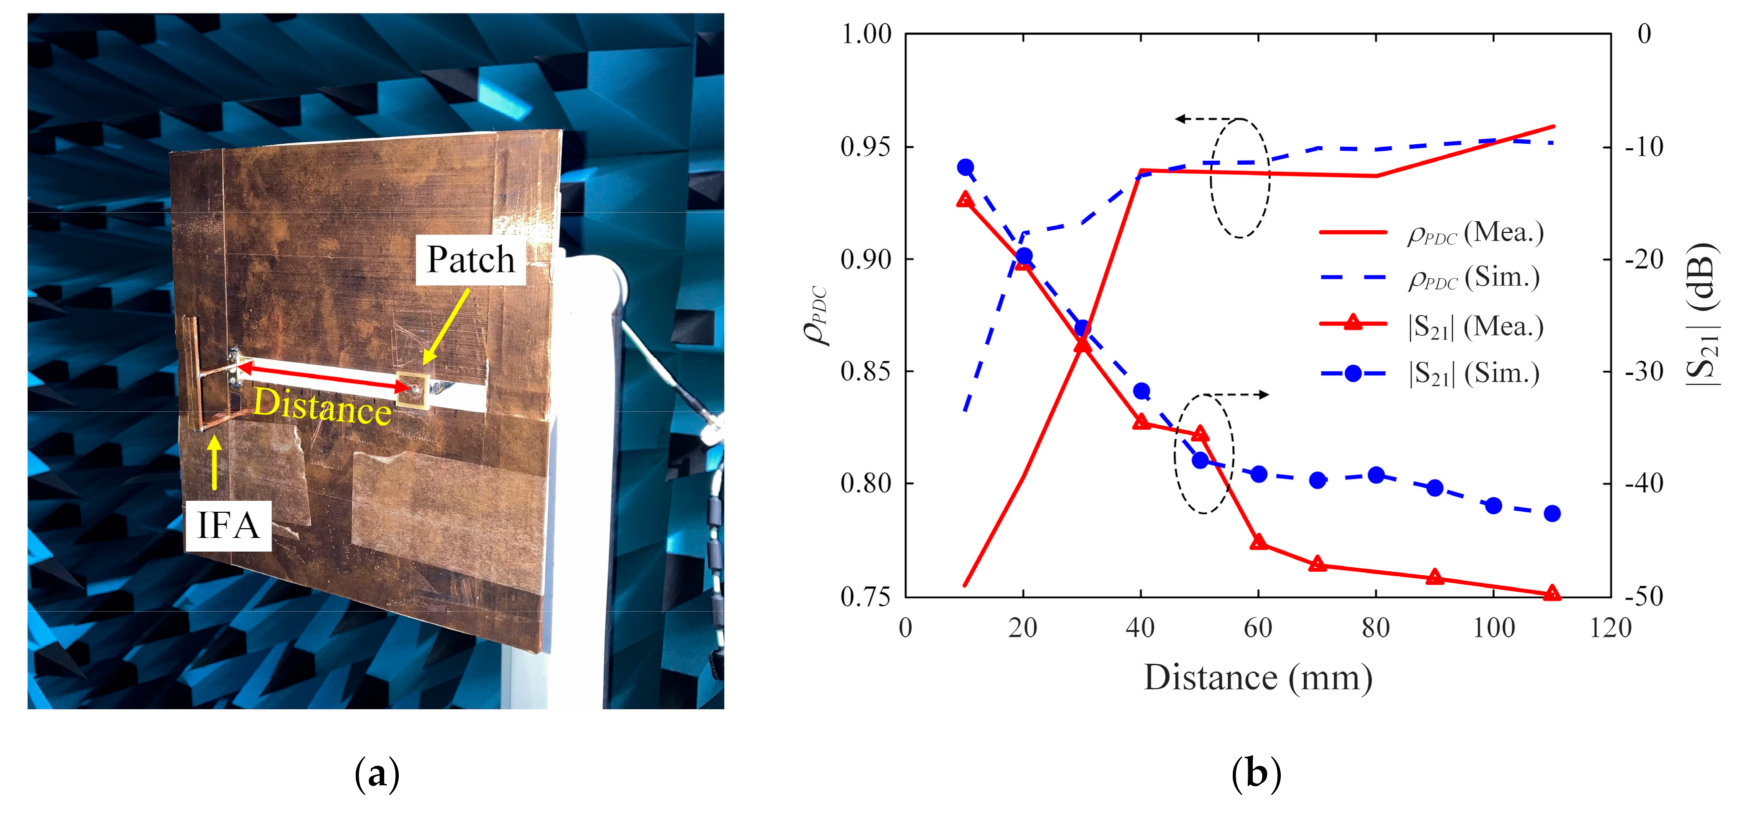
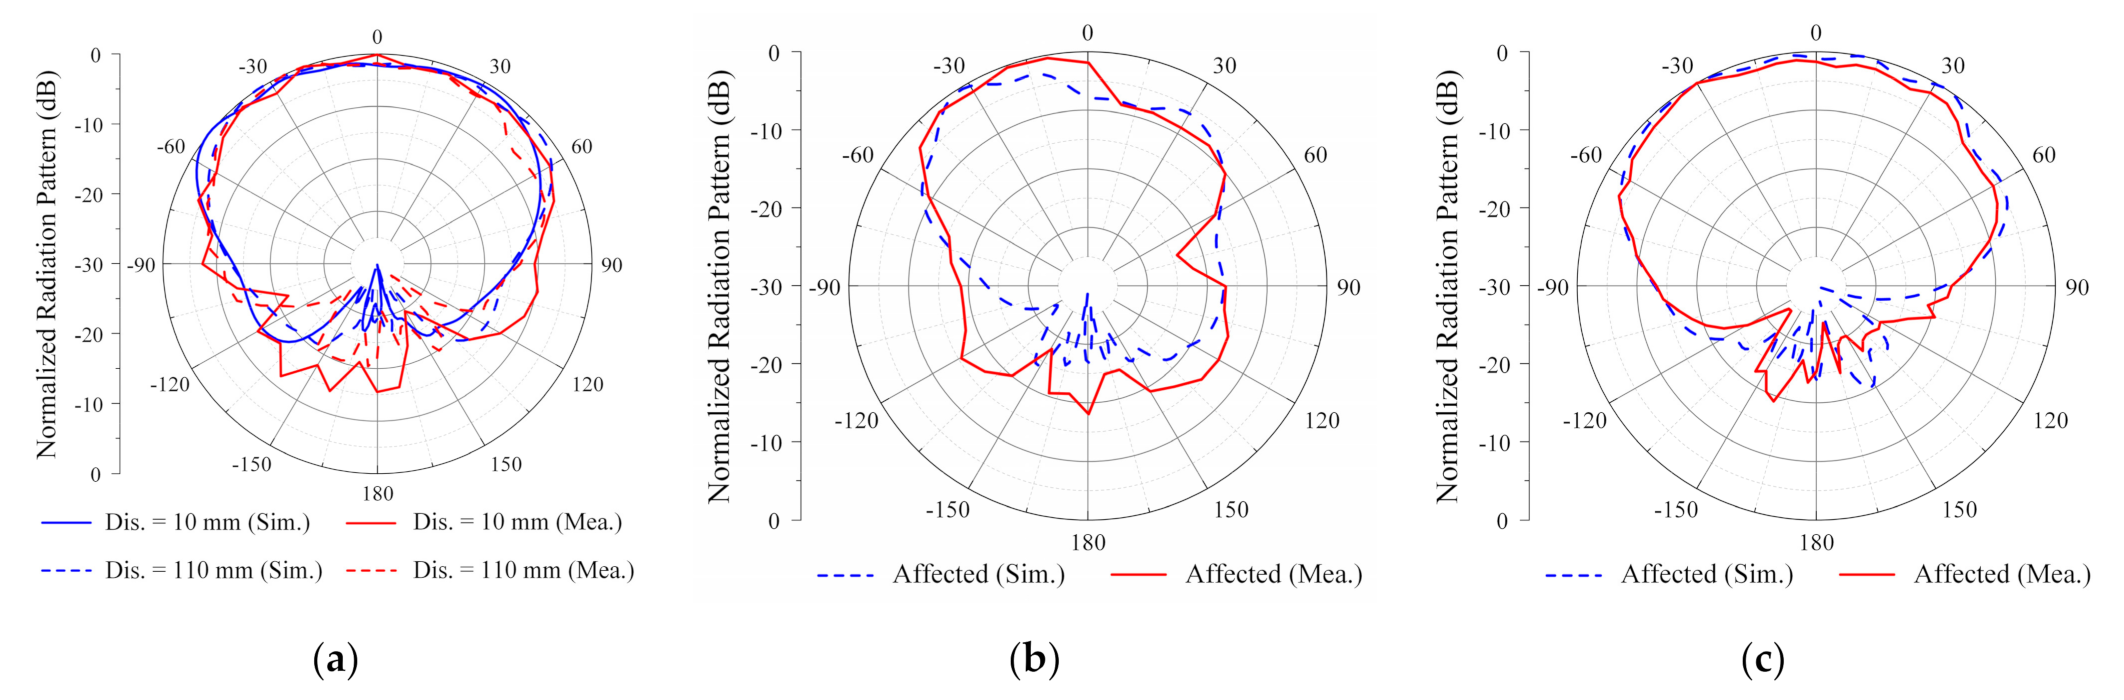
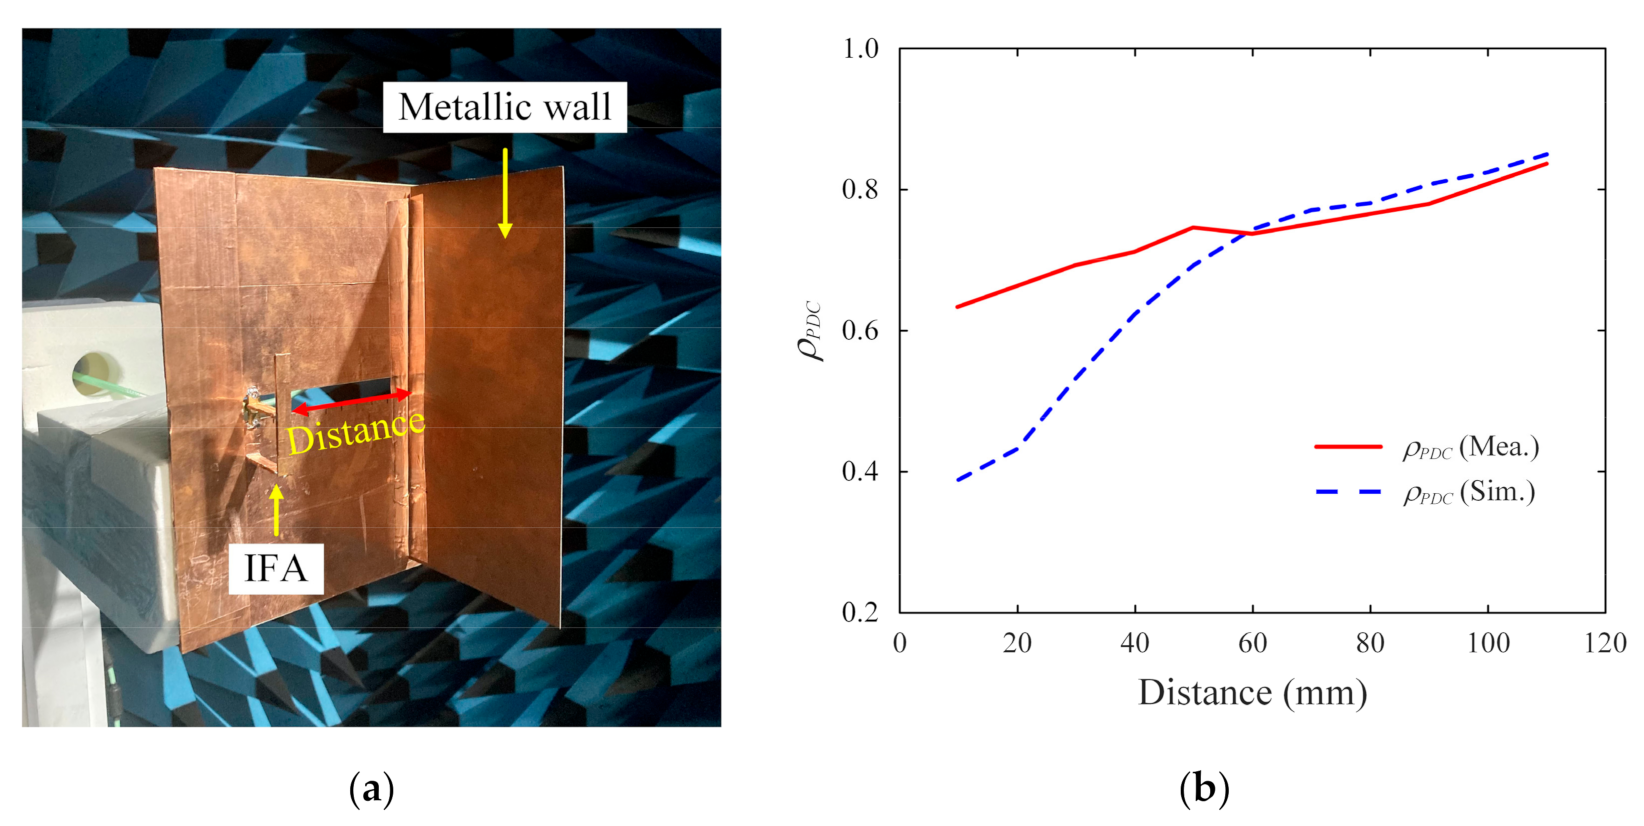
3.2. Fabrication and Measurement

To further demonstrate the proposed FoM, we fabricated the IFA and the patch antenna operating at 1.5 GHz and 6 GHz, respectively, to describe the environment of the SAA mounted in a 200 mm × 200 mm area. Figure 9 shows comparisons between the simulated and measured reflection coefficients of the two antennas. The fabricated IFA resonates at 1.41 GHz, which is similar to the simulated result of 1.5 GHz. The patch antenna is fabricated on an FR4 substrate (εr = 4.4, tanδ = 0.02) having a size of 15 mm × 15 mm and a thickness of 1 mm, and its resonance occurs at 6.03 GHz for simulation and 6.05 GHz for measurement.
Figure 10a shows a photograph of the fabricated antennas on the ground, which were installed in a full anechoic chamber to measure radiation patterns. In this two-port system, the patch antenna is tested for pattern distortions, and its port—i.e., Port 2—is designed to move away from Port 1 of the IFA to adjust the distance between them. The measurement was conducted with an angular resolution of 5° for both θ- and φ-directions, while an in-active antenna port, herein called Port 1, is terminated by a 50 Ω load. Figure 10b presents the variations in ρPDC according to the distances between 10 mm and 110 mm, which are compared with those of |S21|. Each point of ρPDC is calculated using two radiation patterns of the patch antenna—i.e., E u n ¯ ( θ , ϕ ) and E a f f ¯ ( θ , ϕ ) —each of which is collected without and with the IFA, respectively. It is worth pointing out that the unaffected pattern of E u n ¯ ( θ , ϕ ) cannot be reused for a different distance because the relative position of the patch antenna is also changed with respect to the center of the ground. As can be seen, both the simulation and measurement show good agreement, and the decreasing tendency of |S21| is well reflected in the variation of ρPDC with an increasing trend. More specifically, the measured ρPDC tends to increase from 0.76 to 0.96 as the measured|S21| decreases from −14.8 dB to −49.8 dB for greater intervals.
Figure 11a presents the normalized radiation patterns of the patch antenna without the IFA for different antenna intervals. The blue and red lines indicate simulated and measured patterns, and the results for different distances of 10 mm and 110 mm are distinguished by solid and dashed lines, respectively. Figure 11b,c show comparisons of the simulated and measured radiation patterns for different antenna intervals, and these patterns were used to calculate the ρPDC in Figure 10b. The results confirm that the stand-alone patterns of the patch antenna are similar with each other, although their relative positions with respect to the ground center are different. In addition, as the distance increases from 10 mm to 110 mm, the maximum pattern deviation between the unaffected and affected patterns reduces from 14 dB to 3.1 dB in the upper hemisphere. This implies that the proposed FoM of ρPDC can be used as a quantitative measure of the pattern distortions, which cannot be fully represented by |S21|.
Figure 12a shows a photograph of the measurement setup for the IFA mounted on the ground with a conducting wall. The position of the wall is adjusted with an interval of 10 mm to calculate the ρPDC variation, as presented in Figure 12b. This setup gives quantitative changes in the pattern distortions for a single-antenna system affected by platform effects, which is the sole benefit of the proposed approach compared to other conventional FoMs. In the tested range of distance, the simulated ρPDC varies between 0.39 and 0.85 and the measured ρPDC varies from 0.63 to 0.84, with the same increasing trend as that shown in the simulation. However, we must admit that the measured and simulated ρPDC are more deviated at a closer distance to the wall. Such disagreement is due to strong platform effects that cause wave blockage, reflection, and scattering, which generates more fluctuations in radiation patterns. Nevertheless, the proposed coefficient ρPDC can provide straightforward and quantitative evaluation on the pattern distortion even for a single antenna system, which cannot be observed from |S11|.
Figure 13 presents comparisons of the unaffected and affected patterns for different values of ρPDC at 10 mm, 40 mm, and 110 mm. The blue and red lines specify simulated and measured results, and the solid and dashed lines indicate unaffected and affected patterns, respectively. As can be seen, although the conducting wall produces an enormous amount of the pattern distortions, the maximum pattern deviation gradually reduces from 23.9 dB to 15.2 dB to 11.2 dB as the distance becomes greater. This tendency can also be found in the trend of ρPDC, which corresponds to the values of ρPDC = 0.63, ρPDC = 0.71, and ρPDC = 0.84, respectively.
In our experiments, there are some discrepancies between the simulated and measured results, especially when stronger mutual coupling or platform effects exist, although the measured ρPDC shows a similar tendency as the simulation. The possible causes for this issue are as follows: first, because the proposed coefficient uses the phase information of the radiation pattern, its calculation is sensitively affected by the information of a phase center in the multi-antenna system. In the measurement, the fabricated platform in the anechoic chamber is displaced whenever the phase center changes to a different distance to the antenna or the wall, which might have caused some error in the phase information of the patterns. Second, the antennas might also have geometric error in fabrication because they were fabricated in a laboratory environment. This geometric error results in unwanted shifts in resonant frequency, which deviates both the amplitude and phase of the radiation patterns. Third, the measured ρPDC was calculated by using radiation patterns measured with an angular interval of 5°, while the simulation was based on an angular interval of 1°. Because stronger mutual coupling and platform effects produce more fluctuations in radiation patterns, the antenna needs to be measured with narrower angular steps for a more accurate estimation of ρPDC.

4. Conclusions

We proposed the pattern distortion coefficient as a new FoM for the quantitative evaluation of both mutual coupling and pattern distortions in multi-antenna systems. The proposed coefficient is based on a cross correlation between unaffected and affected far-field patterns of an AUT, and the input patterns are weighted by a Gaussian function to consider the target operation angle. The feasibility of the proposed FoM was confirmed by fabricating the IFA and the patch antenna resonating at 1.41 GHz and 6.05 GHz, respectively, to describe the two-antenna system exhibiting a mutual coupling environment. The evaluation was further extended to the single-antenna system with a conducting wall that caused strong platform effects with serious pattern distortions. The results demonstrated that the pattern distortions are highly correlated with the proposed FoM of ρPDC; thus, it provides quantitative insight into the amplitude and phase distortions of the far-field patterns. Furthermore, the proposed FoM has great potential to give critical design guidelines for multi-antenna systems that usually suffer from both mutual coupling and platform effects.

Author Contributions

Conceptualization and methodology, J.M.H. and J.Y.; validation and formal analysis, J.M.H.; resources and data curation, H.K. and Y.K.; writing—original draft preparation, J.M.H.; writing—review and editing, G.B.; visualization, J.M.H.; supervision and project administration, G.B. All authors have read and agreed to the published version of the manuscript.

Funding

This research received no external funding.

Acknowledgments

This research was supported by the Defense Challengeable Future Technology Program of Agency for Defense Development, Republic of Korea.

Conflicts of Interest

The authors declare no conflict of interest. The funders had no role in the design of the study; in the collection, analysis, or interpretation of data; in the writing of the manuscript; or in the decision to publish the results.

References

  1. Tavik, G.C.; Hilterbrick, C.L.; Evins, J.B.; Alter, J.J.; Crnkovich, J.G.; de Graaf, J.W.; Habicht, W.; Hrin, G.P.; Lessin, S.A.; Wu, D.C.; et al. The advanced multifunction RF concept. IEEE Trans. Microw. Theory Tech. 2005, 53, 1009–1020. [Google Scholar] [CrossRef]
  2. Kemkemian, S.; Nouvel-Fiani, M. Toward common radar & EW multifunction active arrays. In Proceedings of the 2010 IEEE International Symposium on Phased Array Systems and Technology, Waltham, MA, USA, 12–15 October 2010; pp. 777–784. [Google Scholar] [CrossRef]
  3. Dawber, W.N.; Pote, M.F.; Turner, S.D.; Graddon, J.M.; Barker, D.; Evans, G.; Wood, S.G. Integrated antenna architecture for high frequency multifunction naval systems. In Proceedings of the 2006 CIE International Conference on Radar, Shanghai, China, 16–19 October 2006; pp. 1–5. [Google Scholar] [CrossRef]
  4. Thummaluru, S.R.; Kumar, R.; Chaudhary, R.K. Isolation enhancement and radar cross section reduction of MIMO antenna with frequency selective surface. IEEE Trans. Antennas Propag. 2018, 66, 1595–1600. [Google Scholar] [CrossRef]
  5. Umair, H.; Latef, T.B.A.; Yamada, Y.; Hassan, T.; Mahadi, W.N.L.B.W.; Othman, M.; Kamardin, K.; Hussein, M.I. Quarter wavelength Fabry–Perot Cavity antenna with wideband low monostatic radar cross section and off-broadside peak radiation. Appl. Sci. 2021, 11, 1053. [Google Scholar] [CrossRef]
  6. Dikmen, C.M.; Cimen, S.; Cakir, G. Planar octagonal-shaped UWB antenna with reduced radar cross section. IEEE Trans. Antennas Propag. 2014, 62, 2946–2953. [Google Scholar] [CrossRef]
  7. Jiang, W.; Liu, Y.; Gong, S.; Hong, T. Application of bionics in antenna radar cross section reduction. IEEE Antennas Wirel. Propag. Lett. 2009, 8, 1275–1278. [Google Scholar] [CrossRef]
  8. Mei, P.; Zhang, S.; Pedersen, G.F. A dual-polarized and high-gain X-/Ka-band shared-aperture antenna with high aperture reuse efficiency. IEEE Trans. Antennas Propag. 2021, 69, 1334–1344. [Google Scholar] [CrossRef]
  9. Li, T.; Chen, Z.N. Metasurface-Based Shared-Aperture 5G S-K-Band Antenna Using Characteristic Mode Analysis. IEEE Trans. Antennas Propag. 2018, 66, 6742–6750. [Google Scholar] [CrossRef]
  10. Chen, Y.; Vaughan, R.G. Dual-Polarized L-Band and Single-Polarized X-Band Shared-Aperture SAR Array. IEEE Trans. Antennas Propag. 2018, 66, 3391–3400. [Google Scholar] [CrossRef]
  11. Rao, P.H.; Sujitha, S.; Selvan, K.T. A Multiband, Mutipolarization Shared-Aperture Antenna: Design and evaluation. IEEE Antennas Propag. Mag. 2017, 59, 26–37. [Google Scholar] [CrossRef]
  12. Zhang, J.F.; Cheng, Y.J.; Liu, S.H. A large frequency ratio shared-aperture antenna based on structure reuse. In Proceedings of the 2018 International Symposium on Antennas and Propagation (ISAP), Busan, South Korea, 23–26 October 2018; pp. 1–2. [Google Scholar]
  13. Zhang, J.F.; Cheng, Y.J.; Ding, Y.R.; Bai, C.X. A dual-band shared-aperture antenna with large frequency ratio, high aperture reuse efficiency and high channel isolation. IEEE Trans. Antennas Propag. 2018, 67, 853–860. [Google Scholar] [CrossRef]
  14. Wang, C.; Chen, Y.; Liu, G.; Yang, S. Aircraft-integrated VHF band antenna array designs using characteristic modes. IEEE Trans. Antennas Propag. 2020, 68, 7358–7369. [Google Scholar] [CrossRef]
  15. Chou, H.-T.; Lu, K.-Y.; Chen, Y.-C.; Hsu, H.-T.; Huang, N.-T. Analysis and synthesis of phased array antennas in the presence of electrically large and complex platforms via a hybrid numerical code. In Proceedings of the 2010 International Conference on Electromagnetics in Advanced Applications, Sydney, NSW, Australia, 20–24 September 2010; pp. 458–461. [Google Scholar] [CrossRef]
  16. Yang, S.J.; Yanga, Y.; Zhang, X.Y. Low scattering element based aperture-shared array for multi-band base stations. IEEE Trans. Antennas Propag. 2021, 1. [Google Scholar] [CrossRef]
  17. Manga, A.A.; Gillard, R.; Loison, R.; Roy-Naneix, I.L.; Renard, C. Experimental validation of a correcting coupling mechanism to extend the scanning range of narrowband phased array antennas. IEEE Trans. Antennas Propag. 2020, 68, 2078–2086. [Google Scholar] [CrossRef] [Green Version]
  18. Pozar, D.; Schaubert, D. Scan blindness in infinite phased arrays of printed dipoles. IRE Trans. Antennas Propag. 1984, 32, 602–610. [Google Scholar] [CrossRef]
  19. Zhang, C.; Lai, Q.; Gao, C. Measurement of active S-parameters on array antenna using directional couplers. In Proceedings of the 2017 IEEE Asia Pacific Microwave Conference (APMC), Kuala Lumpur, Malaysia, 13–16 November 2017; pp. 1167–1170. [Google Scholar] [CrossRef]
  20. Nikulina, Y.S.; Stenanov, M.A. The criteria of antenna pattern distortion estimation. In Proceedings of the 2018 XIV International Scientific-Technical Conference on Actual Problems of Electronics Instrument Engineering (APEIE), Novosibirsk, Russia, 2–6 October 2018; pp. 426–428. [Google Scholar] [CrossRef]
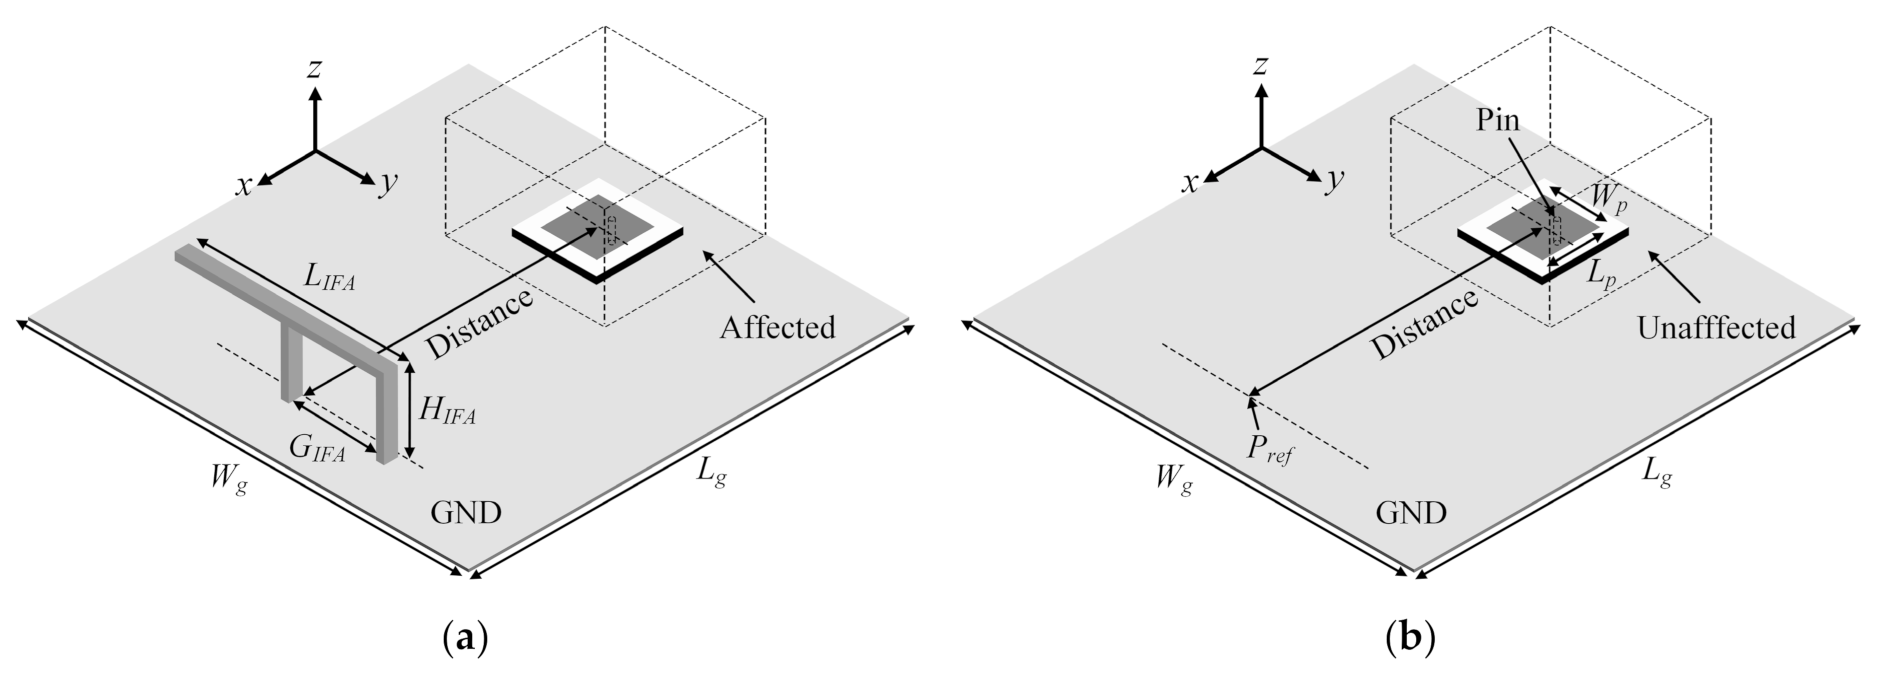
Figure 1. Illustration of the antenna system where (a) IFA is situated besides a patch antenna (affected) and (b) the patch antenna is mounted alone (unaffected).
Applsci 11 09652 g001
Figure 2. Gaussian weight and normalized radiation pattern when applying gaussian weight. (a) Gaussian function g(θ) where μθ = 0° and σθ = 43.5°. (b) Comparison of weighted and non-weighted radiation patterns of a microstrip patch antenna.
Applsci 11 09652 g002
Figure 3. Simulated variation in ρPDC and |S21| for patch antenna according to (a) the distance at 6 GHz and (b) frequency (distance = 20 mm).
Applsci 11 09652 g003
Figure 4. Simulated normalized patterns of the patch antenna in the xz-plane according to (a) distance at 6 GHz and (b) frequency (distance = 20 mm).
Applsci 11 09652 g004
Figure 5. Illustration of the antenna system where a metallic wall is situated beside the IFA.
Applsci 11 09652 g005
Figure 6. Simulated variation in ρPDC for IFA according to (a) the metallic wall size (distance = 20 mm) and (b) distance (Wwall = 200 mm).
Applsci 11 09652 g006
Figure 7. Simulated normalized patterns of the IFA in the xz plane according to (a) the metallic wall size (distance = 20 mm) and (b) distance (Wwall = 200 mm).
Applsci 11 09652 g007
Figure 8. Simulated |S11| of the IFA according to (a) the metallic wall size (distance = 20 mm) and (b) distance (Wwall = 200 mm).
Applsci 11 09652 g008
Figure 9. Simulated and measured reflection coefficients of (a) the IFA and (b) the patch antenna.
Applsci 11 09652 g009
Figure 10. Photograph of the measurement set-up and the measured results. (a) Measurement of ρPDC for the fabricated patch antenna in an anechoic chamber. (b) Simulated and measured results of ρPDC and |S21| according to the distance.
Applsci 11 09652 g010
Figure 11. Simulated and measured normalized patterns of the patch antenna in the yz plane at 6 GHz: (a) unaffected radiation patterns with distance = 10 mm (solid lines) and 110 mm (dashed lines), (b) affected radiation pattern at distance = 10 mm, and (c) affected radiation pattern at distance = 110 mm.
Applsci 11 09652 g011
Figure 12. Photograph of the measurement set-up and measured results. (a) Measurement of ρPDC for the fabricated IFA in an anechoic chamber. (b) Simulated and measured ρPDC according to distance.
Applsci 11 09652 g012
Figure 13. Simulated and measured normalized radiation of the IFA in the yz plane at 1.5 GHz: patterns at distances (a) 10 mm, (b) 40 mm, and (c) 110 mm.
Applsci 11 09652 g013
Table 1. Design parameters of the IFA and probe-fed patch antenna.
ParameterWgLgLIFAHIFAGIFAWpLp
Value (mm)20020051.425.725.711.211.2
Publisher’s Note: MDPI stays neutral with regard to jurisdictional claims in published maps and institutional affiliations.

