Article

Mirau-Based CSI with Oscillating Reference Mirror for Vibration Compensation in In-Process Applications

Measurement Technology, Department of Electrical Enginering and Computer Science, University of Kassel, Wilhelmshoeher Allee 71, 34121 Kassel, Germany
*
Author to whom correspondence should be addressed.
Appl. Sci. 2021, 11(20), 9642; https://doi.org/10.3390/app11209642
Submission received: 4 September 2021 / Revised: 11 October 2021 / Accepted: 12 October 2021 / Published: 15 October 2021
(This article belongs to the Special Issue Optical In-Process Measurement Systems)

Abstract

:
We present a Mirau-type coherence scanning interferometer (CSI) with an oscillating reference mirror and an integrated interferometric distance sensor (IDS) sharing the optical path with the CSI. The IDS works simultaneously with the CSI and measures the distance changes during the depth scanning process with high temporal resolution. The additional information acquired by the IDS is used to correct the CSI data disturbed by unwanted distance changes due to environmental vibrations subsequent to the measurement. Due to the fixed reference mirror in commercial Mirau objectives, a Mirau attachment (MA) comprising an oscillating reference mirror is designed and built. Compared to our previous systems based on the Michelson and the Linnik interferometer, the MA represents a novel solution that completes the range of possible applications. Due to its advantages, the Mirau setup is the preferred and most frequently used interferometer type in industry. Therefore, the industrial use is ensured by this development. We investigate the functioning of the system and the capability of the vibration compensation by several measurements on various surface topographies.

1. Introduction

Optical topography sensors such as scanning confocal microscopes (SCM) [1] and coherence scanning interferometers (CSI) [2,3] are well-established measuring instruments in industry and research for the contactless inspection of surface topographies with height structures in the micro- and nanometer range. However, these topography sensors are sensitive to external disturbances, which distort the corresponding controlled depth scanning procedure. Therefore, a close-to-machine employment is not possible with conventional SCM and CSI instruments. As a consequence, in industrial applications, samples are investigated by these optical sensors under highly controlled conditions on an anti-vibration table.
One solution for full-field in situ measurements provides fast measuring methods such as single or dual shot approaches [4,5,6]. However, as the depth of field is required to cover the whole height range of the specimen, the lateral resolution and axial accuracy are usually worse compared to CSI, e.g., in case of the approach presented in [5] the lateral resolution is specified by 30 µm for an NA of 0.28 and thus exceeds the Rayleigh resolution of the system. Another approach is given by the usage of an additional laser interferometer besides the main measuring system, the output of which is used to actively compensate for deflections caused by environmental vibrations [7,8,9,10]. Schäfer et al. [9] report a setup where vibrations are measured with respect to the measuring table of the specimen using a quadrature interferometer. The quadrature signal is used to move the entire CSI contrarily to the deflections caused by the vibration using a piezo driven stage. In contrast, Teale et al. [10] present a CSI with a vibration compensation for in situ depth measurements in a deep reactive ion etcher. Besides the light of low temporal coherence used for CSI, a laser beam propagates through the Michelson interferometer in order to detect vibrations. The output of the laser interferometer is used in a closed-loop with a piezo element, which actively compensates for vibrations by moving the reference mirror. Besides these active vibration compensation techniques, passive approaches have also been demonstrated to be suitable for vibration compensation. The recorded interference signals may be postprocessed, as shown by Deck [11] for a phase shifting interferometer, where a so-called phase-error pattern is used to remove deviations caused by vibrations. In order to reduce the effect of noise, Kiselev et al. [12] correlate the measured interferogram with a nominal one.
Another promising approach for passive vibration compensation in CSI is the use of an interferometric distance sensor (IDS) integrated in the optical path of the CSI setup. The changed distance between CSI and surface under investigation caused by a depth scan is measured by the IDS simultaneously to the CSI measurement. This also enables the detection of vibrations, which are represented by an additional change in path length between CSI and specimen. The interference signal obtained by the IDS provides distance measuring values at a high frequency. These are used to correct the CSI datasets subsequent to the measurement. This method is introduced by Tereschenko et al. and is utilized in a Michelson [13,14] as well as in a Linnik [15] interferometer setup. The working principle of the IDS is based on an optical path length modulation (OPLM) due to a sinusoidal oscillation of the used reference mirror. If this OPLM is fast enough, distance changes can be monitored with high temporal resolution. Depending on the oscillation frequency of the reference mirror, high measurement speeds of up to 116 kHz can be achieved [16]. This enables the detection of vibrations comprising ultrasonic frequencies. An early report of this approach is given by Sasaki and Okazaki [17]. The method is also used in several sensor constellations, which are adapt to other areas of application as reported in [16,18,19,20,21,22].
In contrast to the two interferometer arrangements described by Tereschenko et al. [14,15] Mirau-type CSI instruments are usually preferred in industrial and other practical applications due to their advantages, namely, a sufficient numerical aperture (NA), a compact design, as well as low dispersion distortions. Furthermore, Mirau systems encompass a simple handling due to less demanding adjustment compared to, e.g., a Linnik setup. Moreover, significantly lower system costs result from the configuration with only one microscope objective lens [23]. Therefore, extending the range of application and especially making the method accessible for industrial use requires the transfer of the previously described vibration compensation technique to a Mirau CSI. However, due to the need of a sinusoidally oscillating reference mirror, this method is not directly applicable to conventional Mirau-type CSI system. To overcome this, and to make the method described above suitable for use with a Mirau interferometer, a self-designed and build Mirau setup with oscillating reference mirror is presented in this article. Therefore, a microscope objective lens providing a long working distance and a glass thickness compensation is used and extended to a Mirau interferometer by applying a Mirau attachment (MA). The MA consists inter alia of the oscillating reference mirror that enables the IDS to share the optical path with the CSI.
The sensor setup is introduced in Section 2 with focus on the Mirau extension. Afterwards, the IDS signal processing and correction of the CSI signals is described in Section 3. In Section 4, we present measurement results to validate the transfer characteristics and vibration compensation capabilities of our Mirau CSI on several specimens. A conclusion is drawn in Section 5 and an outlook to further investigations will be given.

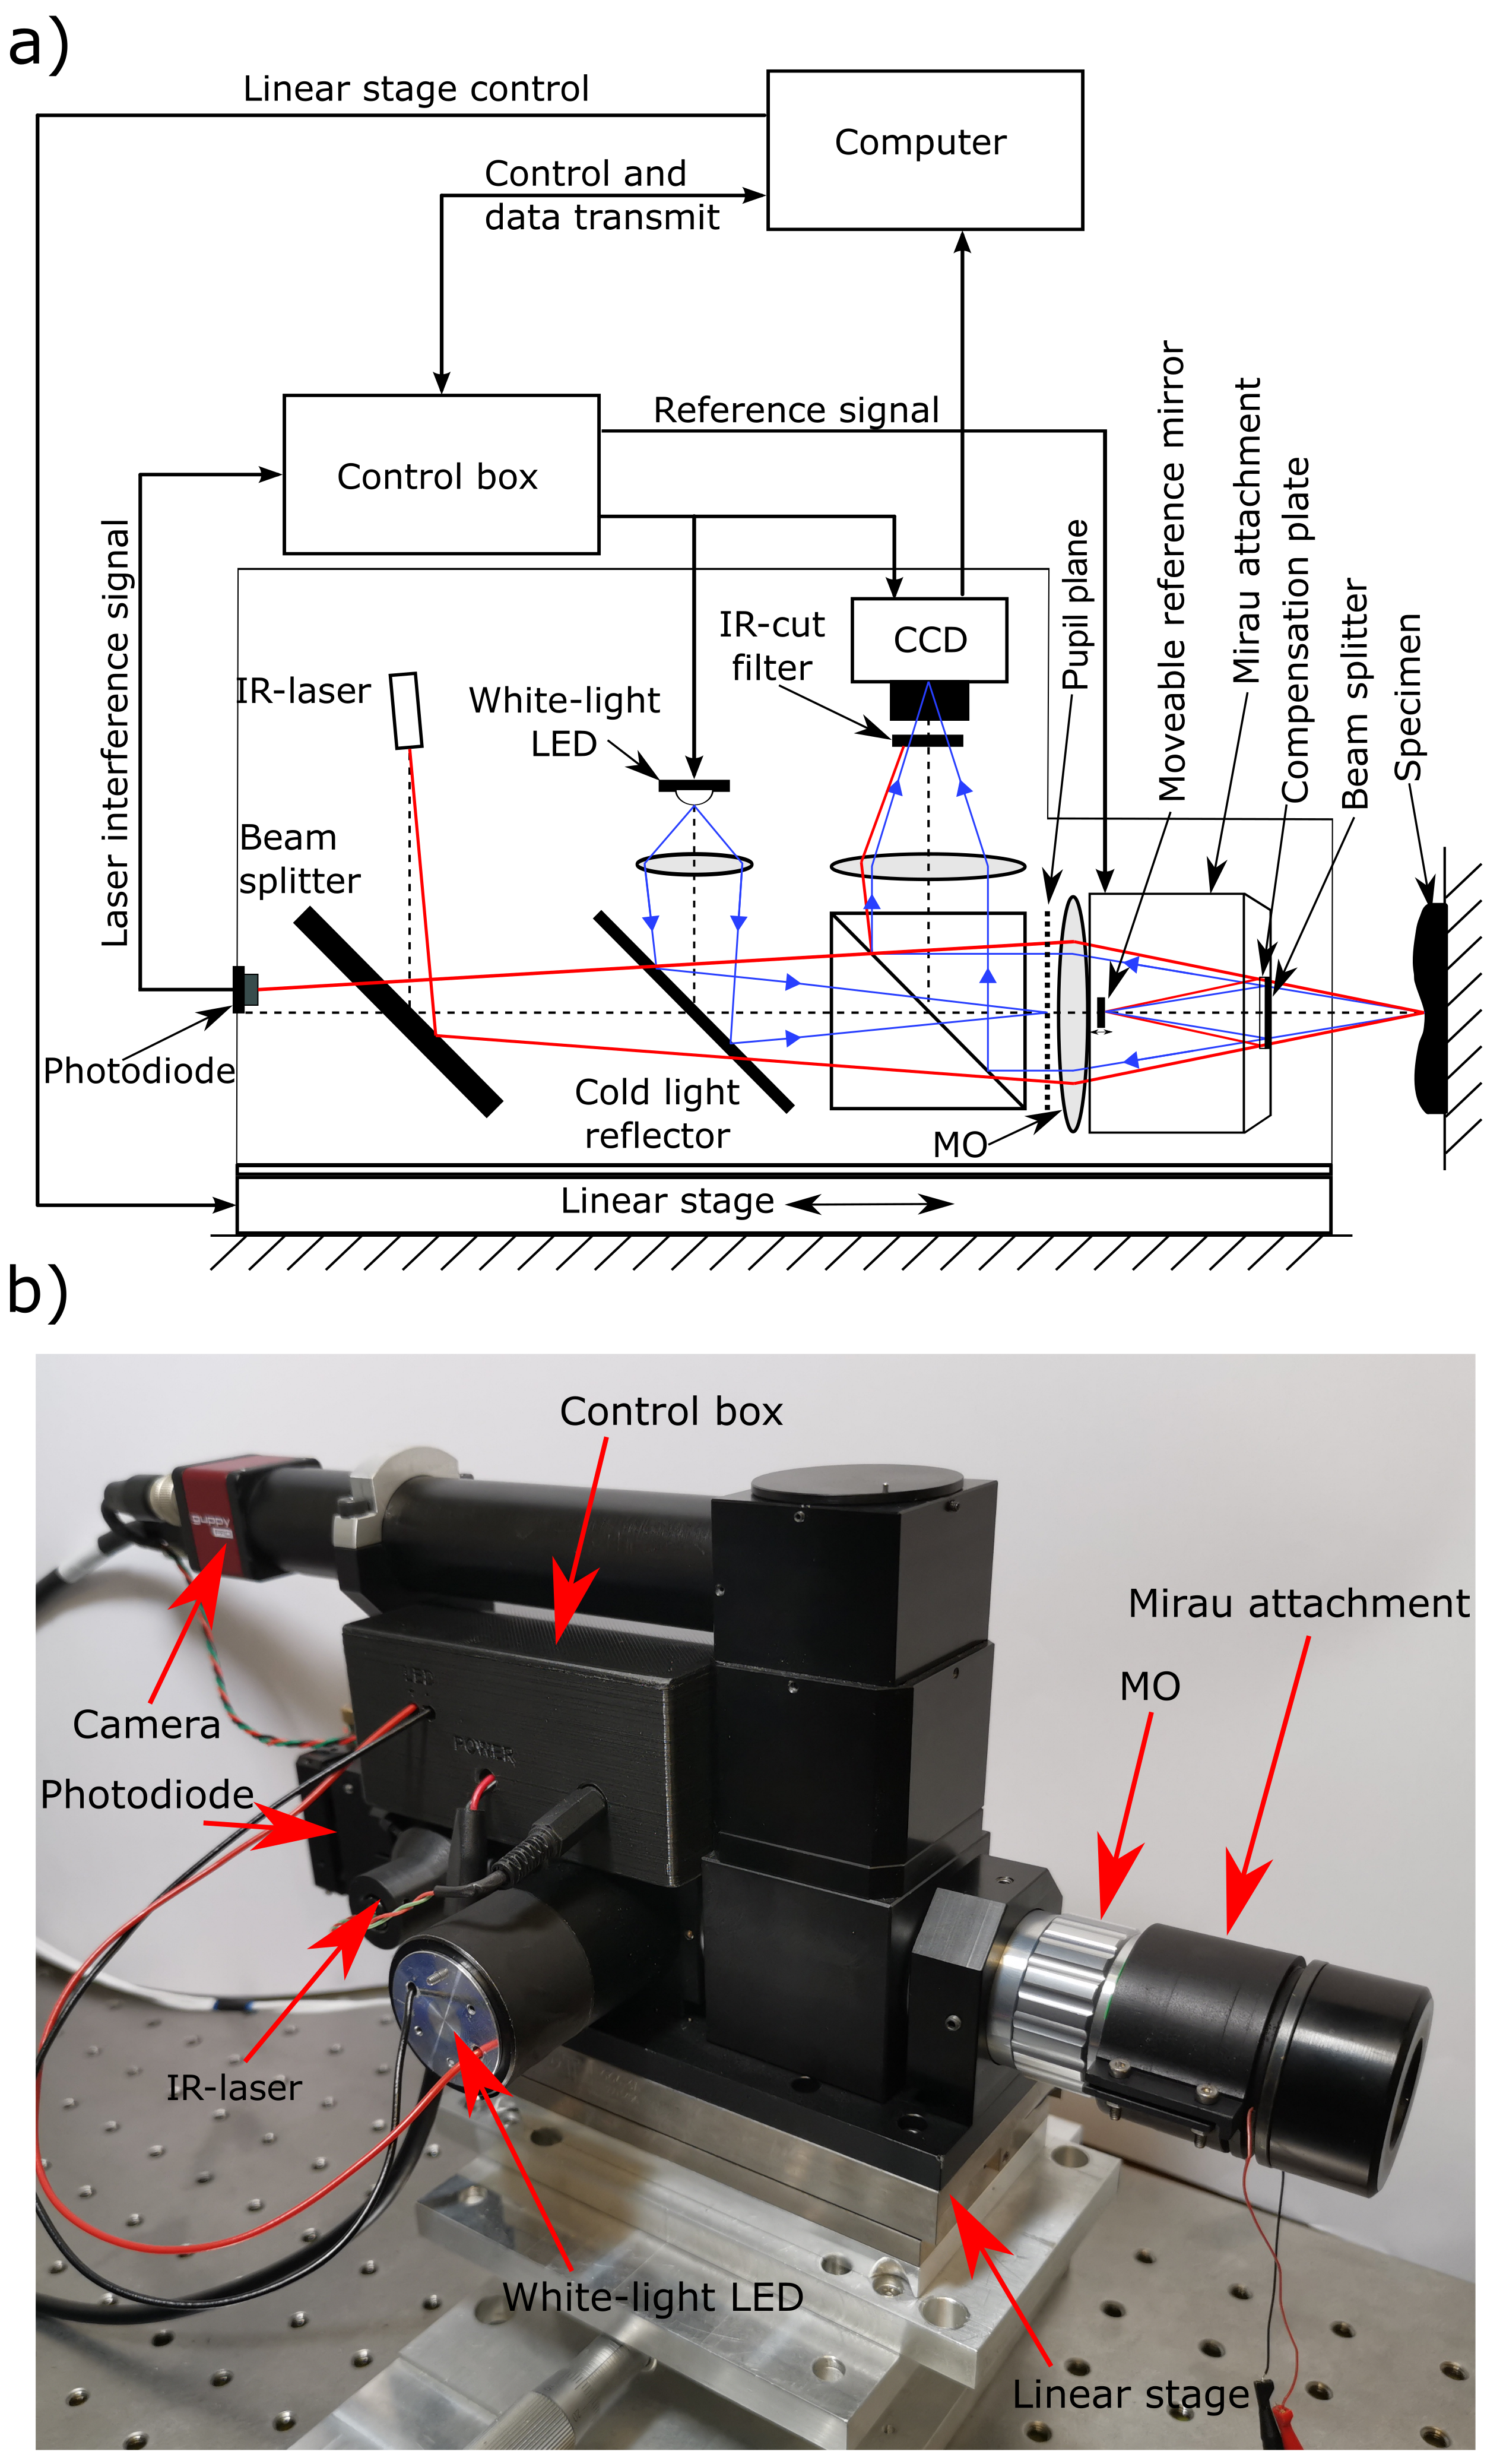
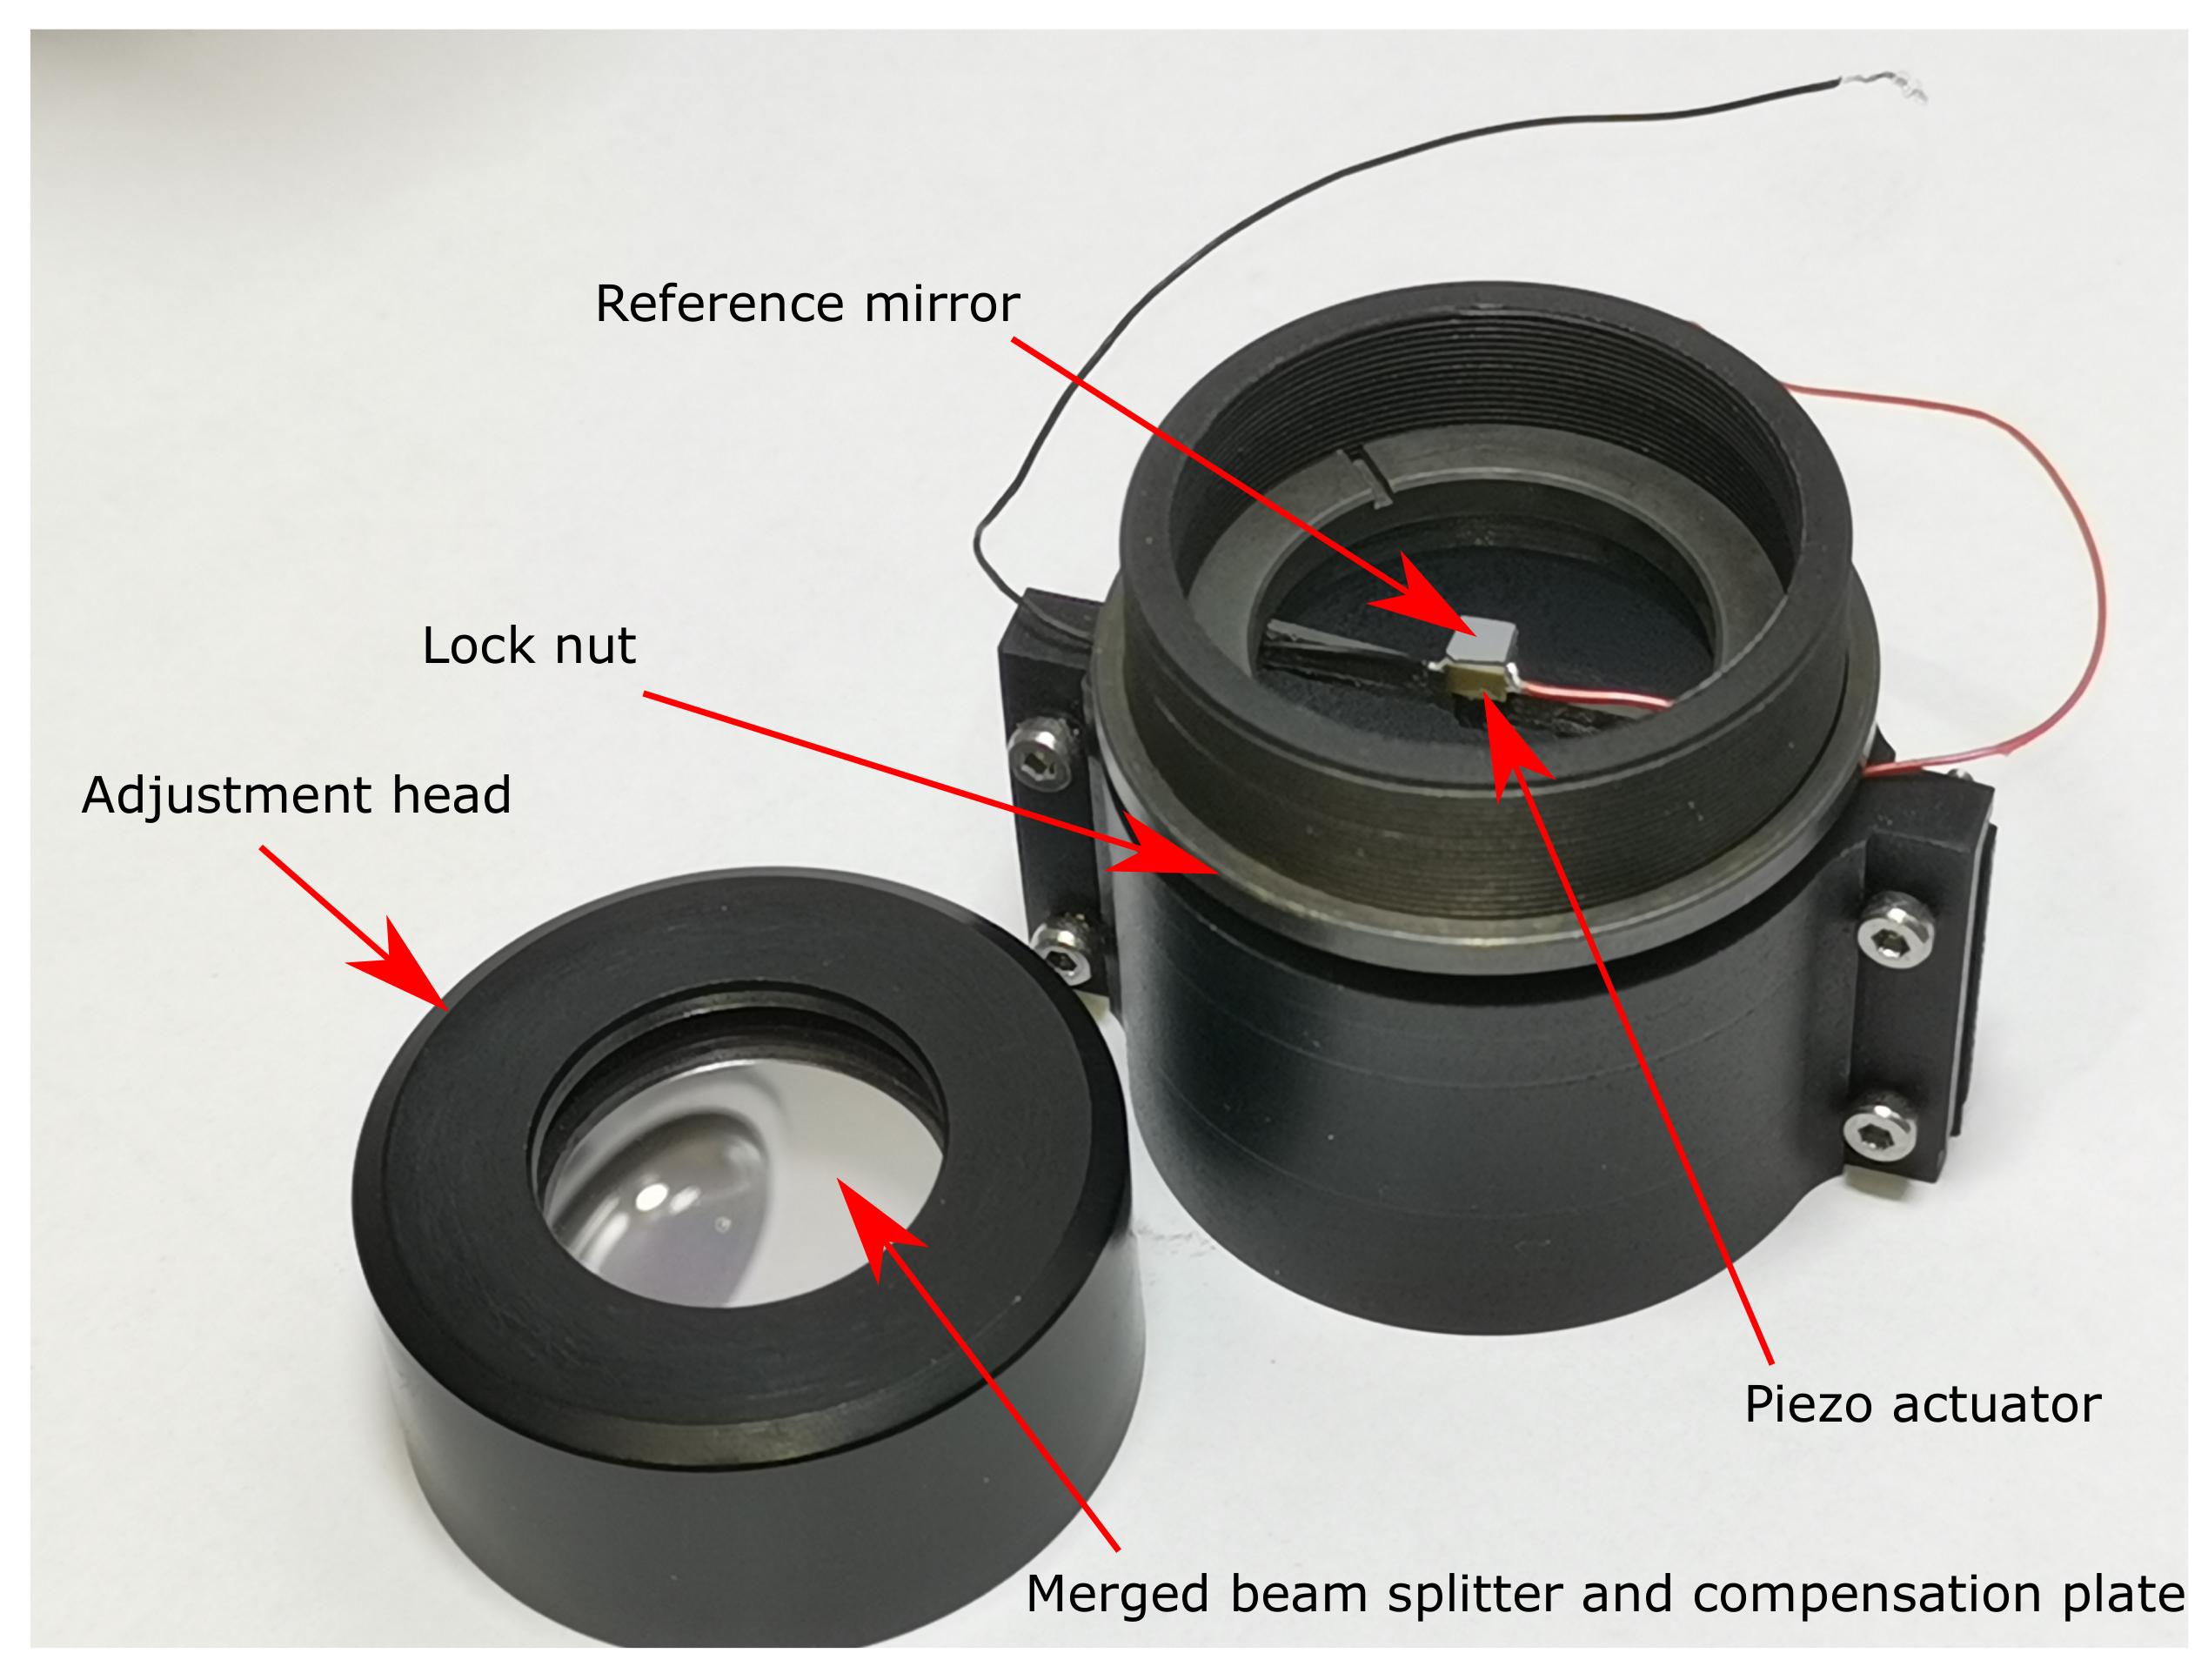
2. Sensor Configuration

The proposed sensor setup is based on a Mirau CSI. The temporally low coherent light emitted by an LED and the coherent infrared laser beam with a wavelength of 850 nm emitted by a diode laser are combined by a cold light reflector as shown in Figure 1a to share a common optical path. The laser beam is collimated, whereas the light from the LED is focused via a condenser lens to the pupil plane of the microscope objective (MO) in order to realize a Köhler illumination.
This leads to a collimated illumination of the surface, where each illuminated point in the pupil plane acts a secondary point source. The light reflected from the surface of the reference mirror as well as the scattered light from the sample are superimposed by a beam splitter plate and is then collected by the infinity corrected MO. The resulting interference pattern is then detected in the image plane by the CCD camera. The infrared light is separated from the temporally low coherent light by an IR-cut filter and recorded by a photodiode. Introducing a sinusoidal modulation of the optical path difference (OPD) by an oscillating reference mirror, the laser interferometer works as an IDS [14,16]. Both CSI and IDS work simultaneously and share the oscillating reference mirror. In order to reduce blurring of the captured camera frames, camera and LED triggering are synchronized with the mirror deflection, so that the camera frame is captured at the turning points of the oscillating reference mirror, where its motion speed is close to zero (visualized in the following Section by a trigger impulse shown in Figure 3). The control of the measurement process is provided by the control-box which is explained in more detail in [13,24]. As a consequence, a stroboscopic illumination is required to perform the measurement procedure. Short pulses of approximately 5–10 µs with overvoltage and overcurrent are generated by the LED to illuminate the surfaces of specimen and reference mirror with enough light. The IR-laser source is tilted relatively to the optical axis to be not blocked by the reference mirror located in the center of the optical axis. The interference signal obtained by the superimposed partial laser beams, which are reflected from the reference mirror and the surface to be measured, is detected by a photodiode. Only a small portion of the NA is used to focus and detect the laser spot by the MO. The practical realization of the sensor setup is depicted in Figure 1b.
As mentioned before, a MA is developed to realize a Mirau type setup with oscillating reference mirror for the IDS. Figure 2 shows a detailed photograph of the MA. It consists of three parts: the main body, an adjustment head and a clamping ring. In order to avoid dependencies on the manufacturing tolerances, the beam splitter plate is adjustably mounted to balance the interferometer arms. Therefore, the adjustment head including the plate beam splitter and the compensation plate is connected to the main body by a fine-thread, which has a pitch of 0.5 mm according to DIN 13-3.
Further, a cover glass thickness compensated MO of Mitutoyo (G Plan Apo) with a magnification of 20x is used [25]. This MO provides a long working distance of 30.6 mm (while using a 3.5 mm thick cover glass) and an NA of 0.28. These properties enable an integration of the beam splitter plate and a compensation plate inside the MA avoiding any additional optical aberrations. In order to reduce dispersion, these two components have identical design parameters related to refractive index, geometrical dimensions, and surface quality. Therefore, these glasses are fabricated meeting high requirements. Both components are made of the same glass type (H-K9L) with a refractive index of n d = 1.51680 manufactured by CDGM [26]. The thickness tolerance is ±2 µm, while the surface requirements are given by, e.g., flatness λ / 10 , parallelism < 30″ and surface quality specified by a scratch and dig of 20-10. According to the MO specifications for the cover-glass, the thickness of both, the beam splitter plate and the compensation plate is 1.75 mm, respectively. To avoid an additional mount with inaccuracy due to manufacturing tolerances, these two elements are merged while the beam splitter coating is between the elements.
Respecting the mounting position of the reference mirror within the optical path, small dimensions of the mirror are needed to avoid obscurations. In addition, a mounting position as close as possible to the MO is chosen for the reference mirror to place it next to the pupil plane. As a result the shading is reduced as much as possible. The reference mirror is sinusoidally deflected by a miniature multilayer piezo actuator (PI PICMA PL0xx) [27]. With compact dimensions of 2 mm × 2 mm × 2 mm this component yields a peak-to-peak amplitude of approximately 2.2 µm. A small piece of coated silicon wafer acting as flat reference mirror is placed on the piezo actuator (see Figure 2). The piezo actor deflects the reference mirror in axial direction with an oscillation frequency of 1 kHz, due to the need of a sufficient elongation for an error-free signal evaluation. Note that the oscillation frequency is limited by the used piezo controller (Thorlabs MDT694B).
The electrical connection wires of the piezo actuator are led out of the housing. Therefore, a bracket for the piezo is designed with two bars of the same width as the diameter of the wires to avoid additional obscuration. However, a high bending strength is necessary to suppress additional vibrations. The bracket is made of a glass bead reinforced polyamide (PA12-GB) and is manufactured by a selective laser sintering (SLS) process. This manufacturing method provides high accuracy in combination with low cost. The piezo generates a high waste heat during operation, so that these bars must be able to dissipate a high amount of heat. The operation at an excitation frequency of 1 kHz is possible without any impact on the performance of the piezo actuator. However, a mount made of copper might be necessary for use with much higher excitation frequency in order to achieve a better heat management.

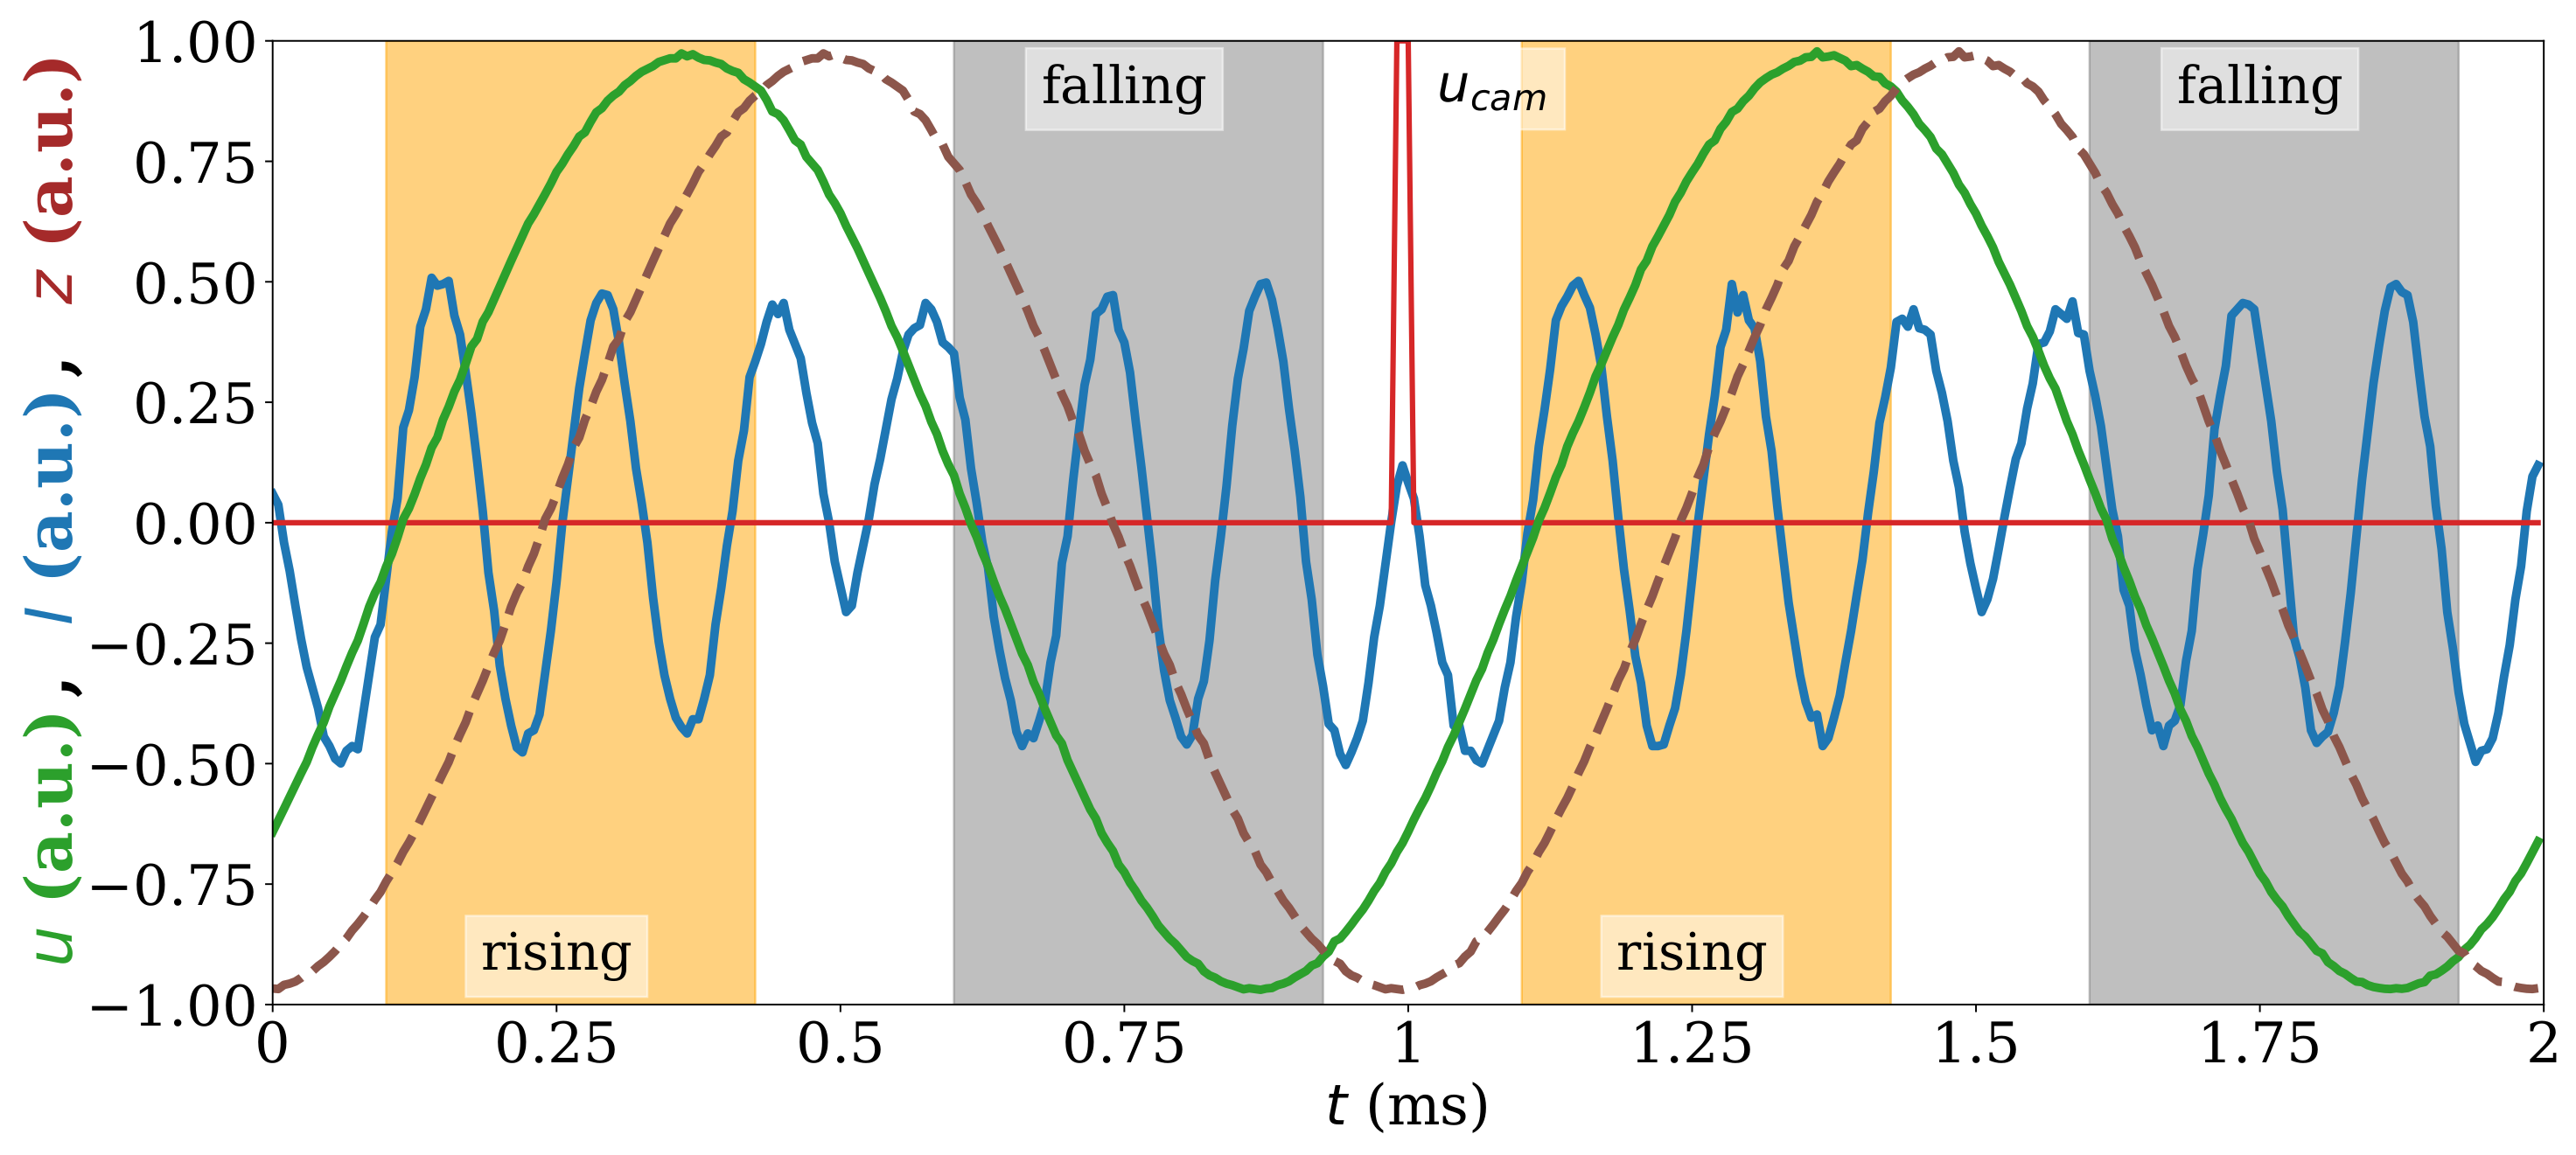
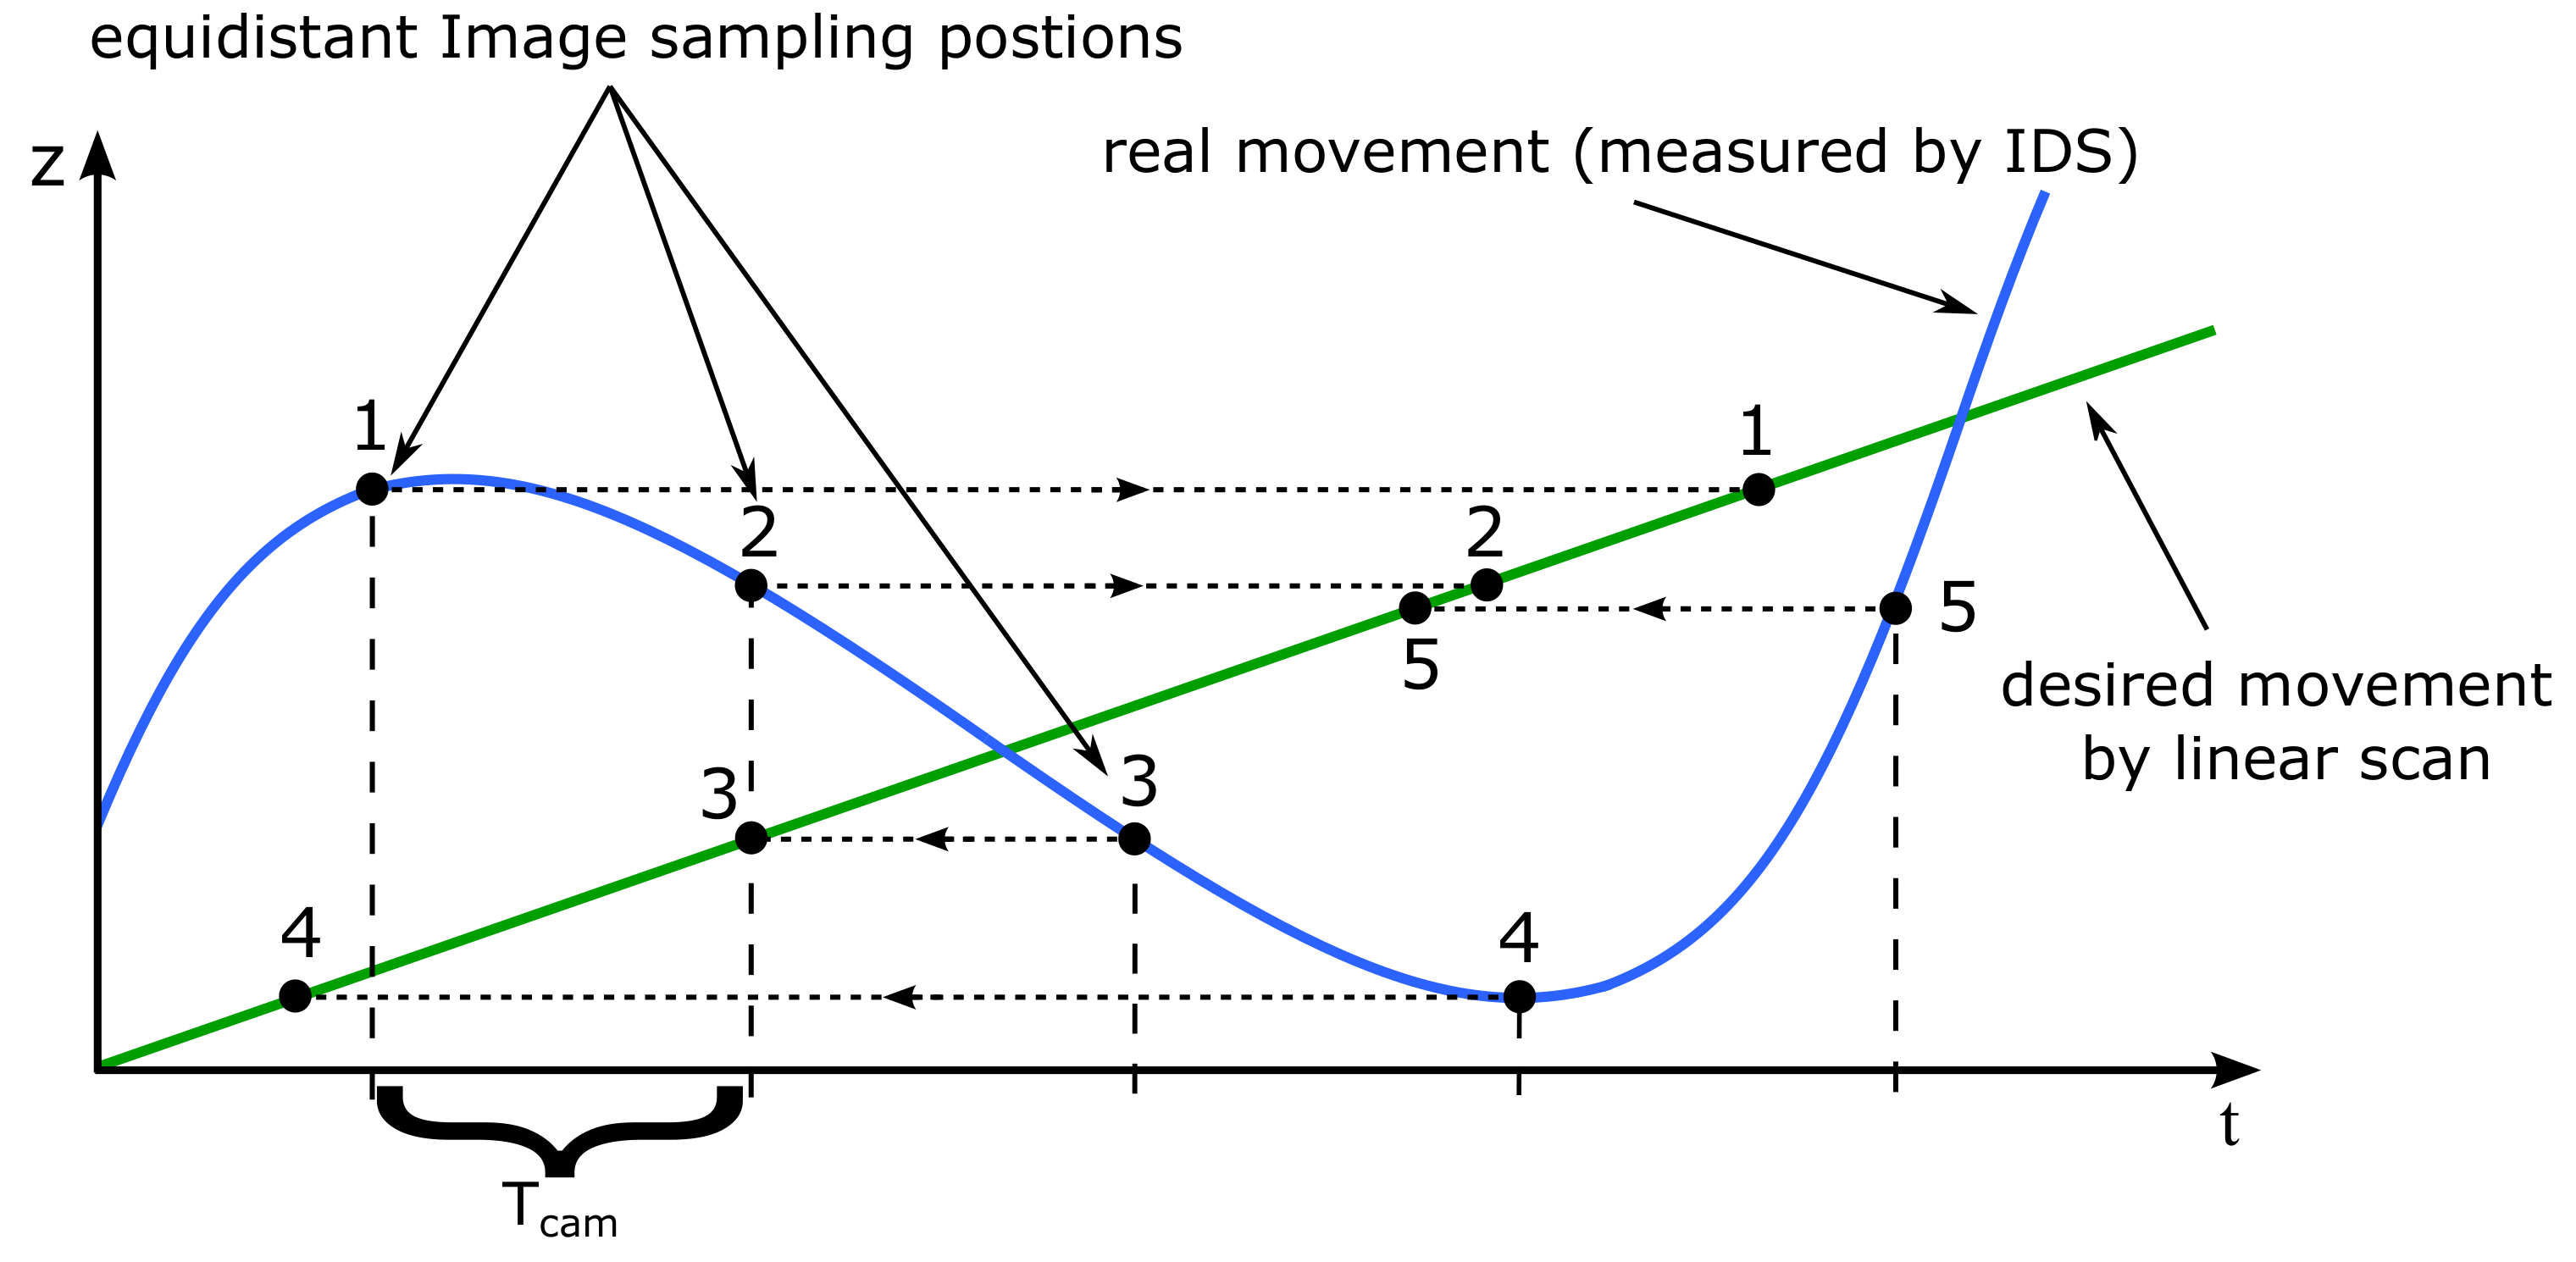
3. Signal Processing

The signal processing is done subsequent to the measurement procedure. The vibration compensating signal processing can be separated into two parts. In the first part, the correction of the distorted CSI signals occurs, whereby the evaluation of the IDS signal is performed to obtain the distance changes during the CSI measurement followed by the correction of the CSI datasets. These corrected CSI interference signals are then analyzed in the second step.
A two-beam interference signal can be described by
I int = I m + I r + 2 I m I r | γ 12 | cos ( Φ ) ,
where I m and I r represent the intensities of reflected beams from the measurement object and the reference mirror, respectively. | γ 12 | is the absolute value of the complex degree of coherence, which is <1 in case of the CSI depending on the use of temporally low coherent light. The phase Φ is represented by
Φ CSI = 4 π λ LED Δ z m ( x , y ) = 4 π λ LED z m ( x , y ) + z ds + z vib ,
with the center wavelength of the illumination source λ LED and the path length change Δ z m between the reference mirror and the surface caused by the surface structure z m ( x , y ) , the depth scan z ds and environmental vibrations z vib . Assuming vibrations with oscillation frequencies below 1 kHz these can be detected by the IDS. Its interference equation equals Equation (1) with | γ 12 | 1 and
Φ IDS = 4 π λ LD [ z ^ a cos ( 2 π f a t ) Δ z m ( x 0 , y 0 ) ] ,
where z ^ a and f a represent, respectively, the amplitude and the frequency of the oscillating reference mirror, leading to an OPLM. x 0 and y 0 describe a certain point on the surface under investigation. Such an interference signal (blue curve) for an OPLM resulting from the electrical actuator signal u ( t ) (green) and the related deflection of the reference mirror z ( t ) (brown) is depicted in Figure 3. Assuming a linear deflection regarding the rising and falling flank (see Figure 3) of the sinusoidal reference mirror movement a constant fringe frequency f e = 4 π z ^ a f a / λ LD of the interference signal can be assumed. Therefore, the phase values of the corresponding sections of the interference signal are determined using a so-called single-point-DFT also known as lock-in method:
Φ IDS = arg n = 0 N W 1 I ( n ) W ( n ) exp i 2 π n f e f s ,
with the window function W ( n ) to reduce leakage, the number N w of values covered by W ( n ) and the sampling frequency f s . Finally, the relationship between the phase and the distance value Δ z m is given by
Δ z m = λ LD 4 π Δ Φ IDS ,
where Δ Φ IDS represents the difference of consecutive phase values determined according to Equation (4). This finally results in two height values per actor period [14,16].
The correction of the CSI data occurs after the evaluation of the IDS signal is finished. For this purpose, the distance changes compared to the desired movement obtained from the IDS during a depth scan is used to rearrange the CSI data according to Figure 4. The rearranging process leads to non-equidistant sampling points of the low coherent interference signals. However, in the processing of CSI signals by commonly utilized algorithms we expect an equidistant sampling of the correlograms. Therefore, an interpolation of the data is performed to obtain sample points at equidistant intervals. A trigonometric interpolation [28] provides an appropriate method as reported in [14]. The correction described above does not change the initial signal envelope. Consequently, the 3D topography can be obtained from the corrected correlograms by using widespread CSI signal processing algorithms which use the interference contrast and phase of the signal [29,30,31,32]. In this work, the CSI signals are evaluated by a phase evaluation algorithm using the lock-in technique similar to Equation (4) and additionally, an envelope detection using the Hilbert transform in order to increase the unambiguous range of two adjacent height values. In this way, an axial repeatability in the subnanometer range is achieved. These algorithms and their combination is described in more detail in [24].

4. Results and Discussion

Multiple measurements of different surface topographies are performed to validate the performance of the custom-built MA. In the following, the investigations are divided into two parts. At first, measurements are performed to validate the function of the CSI with a focus on the MA. These measurements are performed on a vibration damped table without applying external vibrations during the measurement. In addition, the measurement process in the second part is disturbed by an externally stimulated vibration and carried out without vibration damping. This part two deals with the capability to correct disturbances in CSI data sets.

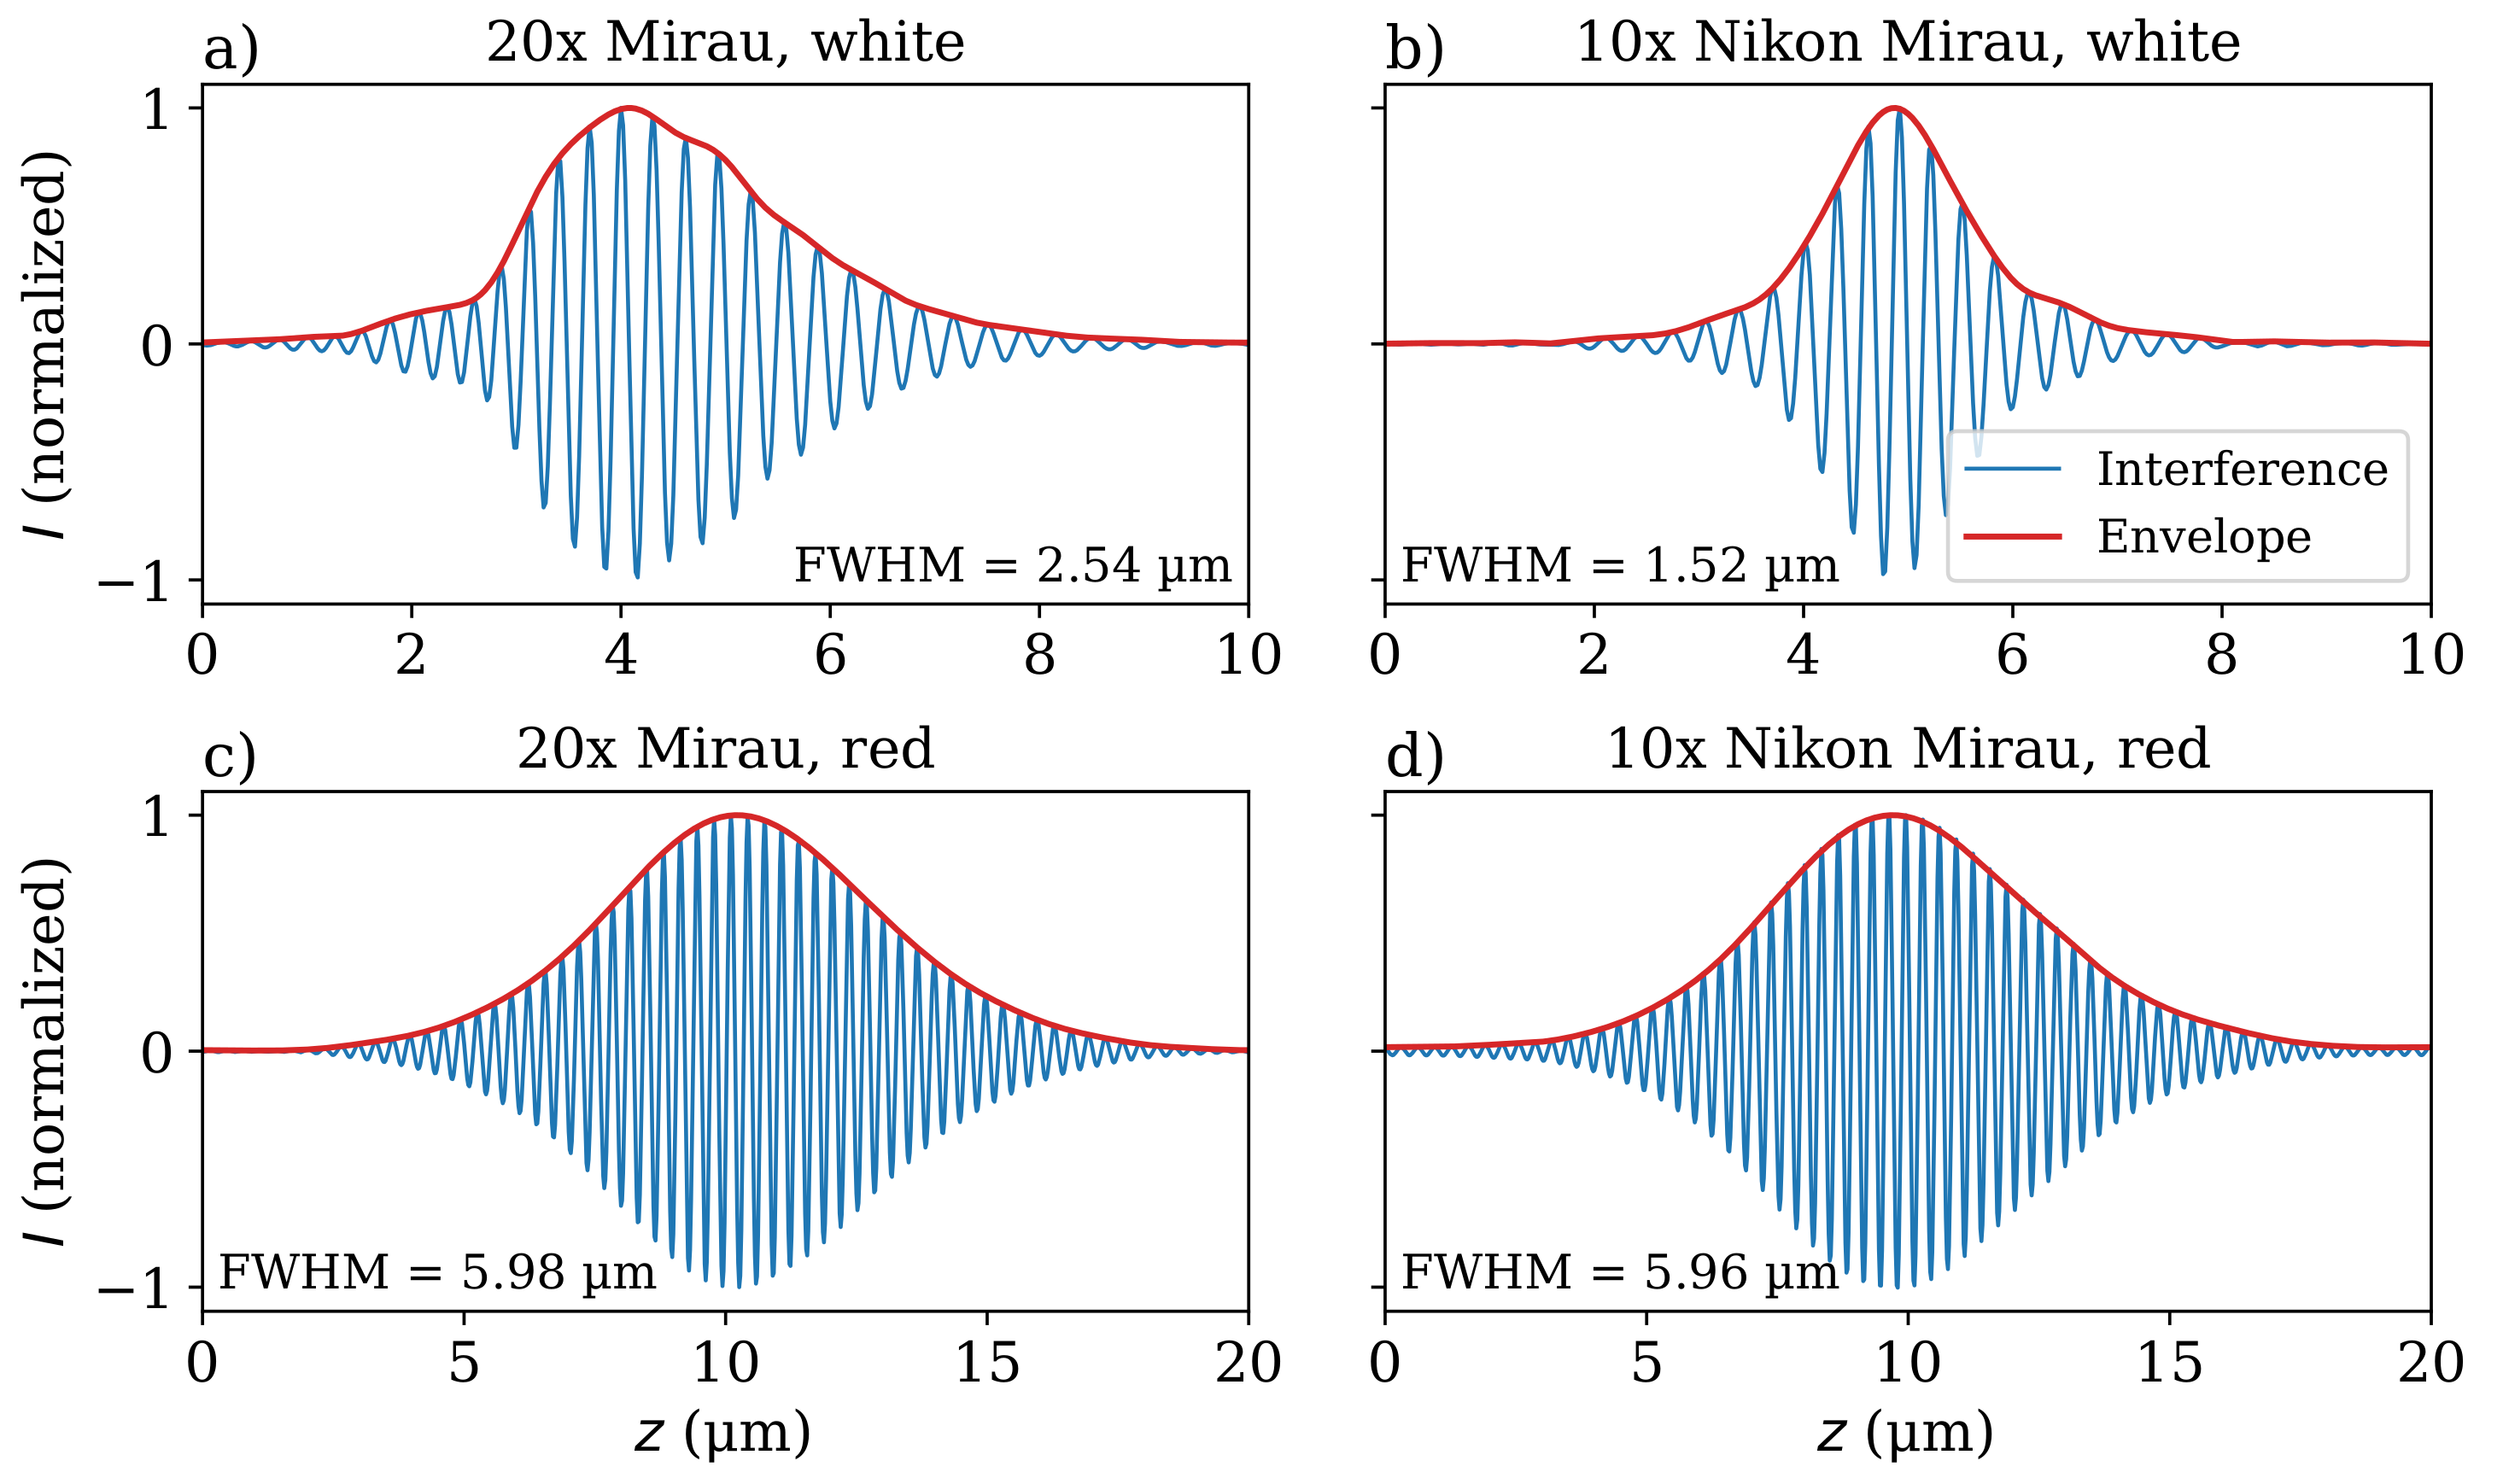
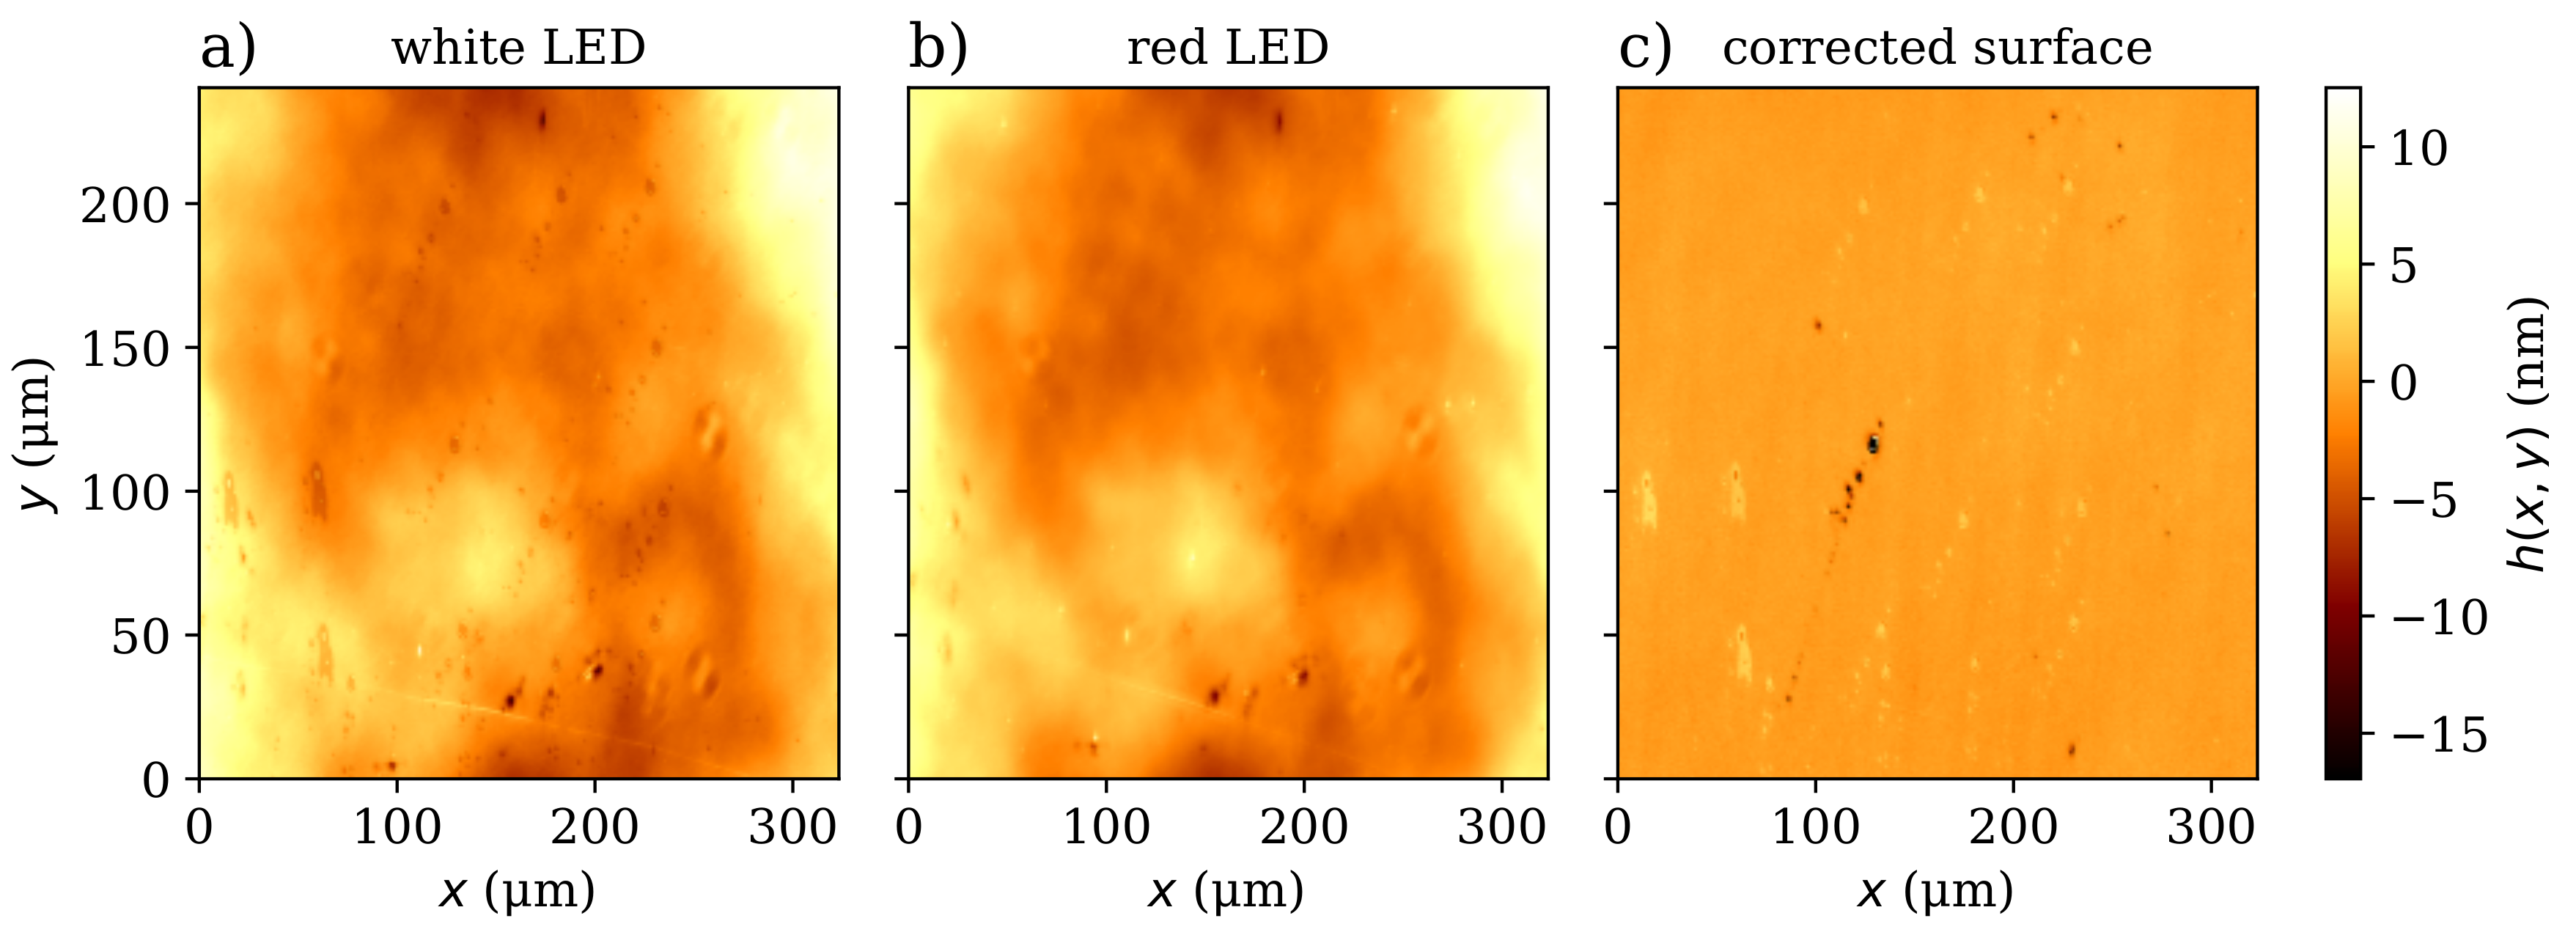
4.1. Functioning of the Mirau Configuration

Different measurements are performed to illustrate the functioning of the MA. First, an aluminum mirror with a surface flatness less than λ / 10 is used as a measuring object to investigate optical aberrations and systematic deviations. As mentioned before, a beam splitter plate and a compensation plate of high optical quality is used. Nevertheless, tilting of these optical elements with respect to the optical axis, e.g., due to installation tolerances that may occur during assembly, can cause dispersion. A possibility to determine dispersion effects is given by the investigation of the measured interference signals. Therefore, the envelopes of signals of the custom-built 20x Mirau objective are compared with those of a commercial Mirau objective (Nikon 10x CF IC EPI Plan DI). Both objectives are directly applied in the same optical setup to keep the results the comparable. The signal envelopes for both MOs are obtained from the aluminum mirror using a white as well as a red LED for illumination. As shown in Figure 5a, significant difference between the envelopes (red curves) of both MOs can be observed for white light illumination. While the course of the signals obtained by the commercial objective is symmetrical, the course corresponding to the MA is asymmetric. Furthermore, the interference signal is broadened compared to the signal of the commercial system, which is illustrated by a full width at half maximum (FWHM) of 2.54 µm for the MA and 1.52 µm for the Nikon Mirau objective. With reference to the investigations of de Groot and Colonna de Lega [33] and under the assumption that the Mitutoyo MO is corrected to a high degree and only minor optical aberrations are present, the broadening of the envelope probably is caused mainly by dispersion. This assumption is confirmed comparing Figure 5c,d, where the same measurements are performed but using a red LED. Here, as a consequence of a narrower bandwidth the envelopes for both MOs are broadened compared to the signals obtained for a white LED. However, no significant difference is visible between the interference signals of both MOs. This is also corroborated by the difference of FWHMs obtained from the respective envelopes of the interference signals, which decrease from 1.02 µm for the white LED to 0.02 µm using the red LED as illumination source.
The measurement of the aluminum mirror shows systematic deviations in the measured surface topography, which still remain when the measuring field is laterally shifted. In order to separate the systematic deviations from the topography of the measured object, nine measurements are performed on latterly shifted locations at the aluminum mirror used as measuring object. The pixel-wise averaging of the nine measured surface topographies leads to the systematic deviation of each pixel, similar to the procedure used in [34,35,36]. This deviation is also known as residual flatness and includes the systematic deviations due to the unevenness of the reference mirror. In Figure 6a, the illustrated residual flatness is measured using a white LED, whereas for the result depicted in Figure 6b, a red LED is used. Similarities in both topographies are apparent immediately. The topography in Figure 6a is slightly higher compared to that depicted in Figure 6b. This is also illustrated by calculating the standard deviations σ w = 3.47 nm for the surface obtained using the white LED and the red one with σ r = 3.25 nm. However, the specification of the standard deviation to represent the residual flatness is misleading, since the determined systematic deviations differ stronger at the edges compared to the center (see Figure 6). The standard deviation is reduced to 0.995 nm for a subtraction of the two topographies from each other and a predominantly uniform shape occurs. Consequently, deviations in flatness of the Mirau CSI are not mainly caused by dispersion and can be attributed to other influences such as flatness deviations or contaminations of the reference mirror or other system-related wavefront errors. The residual flatness can be used for the calibration of the system by pixel-wise subtracting the residual flatness from each performed topography measurement. An application is shown in Figure 6c, where an additional measurement of the aluminum mirror is calibrated by subtracting the residual flatness shown in Figure 6a from the measured topography. As depicted in the Figure 6c a nearly uniform topography occurs with a standard deviation of σ c o r r = 0.62 nm. Consequently, subtracting the residual flatness is a suitable approach for correcting the measured topography data. Therefore, this correction approach is considered in all following results in order to reduce systematic errors of the measured surface topographies.
In addition, a resolution standard (type RS-M from Simetrics GmbH) comprising several gratings of period lengths from 4 µm to 800 µm with a nominal step height of 90 nm is used [37]. The results are shown in Figure 7.
The gratings with a period length of 40 µm and 20 µm (blue profile) are well resolved with minor measurement deviations apart from rounded edges. The step height determined following the procedure described in DIN EN ISO 5436-1 is 85.9 nm for the 40 µm and 81.5 nm for the 20 µm structure. In the red profile an asymmetric constriction is observable for the grating of Λ = 8 µm leading to a measured step height of 50.3 nm. This asymmetry occurs due to a sharp-combed structure, where the width of the upper plateaus are smaller than those of the lower plateaus [37]. Consequently, a low pass filtering due to the NA of 0.28 for the MA setup has a stronger effect on the upper plateaus compared to the lower ones. According to the Rayleigh criterion, the lateral resolution of the Mirau objective is 1.36 µm for an evaluation wavelength of 625 nm and an NA of 0.28. Therefore, the smallest grid with a period length of 4 µm (green profile) is still well resolved as expected. However, the step height for the 4 µm grating is clearly decreased to 18.3 nm. Obviously, the low-pass filtering effect is strongest for the 4 µm structure. In addition, an asymmetric constriction similar to the grating of Λ = 8 µm appears, which is again a result of a sharp-combed structure.
In an industrial context, rough surfaces often are encountered in topography measurement applications. For this reason, roughness standards are frequently used for the realistic characterization of a measuring system. Accordingly, the system is also characterized using the superfine roughness standard KNT4070/03 by Halle GmbH [38]. According to DIN EN ISO 4288, the roughness parameters R a , R q , and R z are convenient to characterize surface roughness. However, these parameters are specified for a profile length of 1.25 mm, which is significantly longer than the maximum edge length of the measurement field of 324 µm. Therefore, these parameters are not used in this work to characterize the roughness of the measured profile. Taking into account, that reference values for such roughness standards are usually obtained by tactile stylus instruments, the profile measured by the custom-built 20x Mirau CSI is compared to the same profile section sampled by the tactile stylus instrument Marsurf GD26 from Mahr, which is integrated in a multisensor measuring system [39]. As shown in Figure 8, the profile resulting from the CSI measurment agrees quite well to the tactile measurment result.
However, a low-pass filtering of the profile obtained by the 20x Mirau occurs due to the relatively low NA of 0.28, resulting in slight deviations from the tactile reference profile.

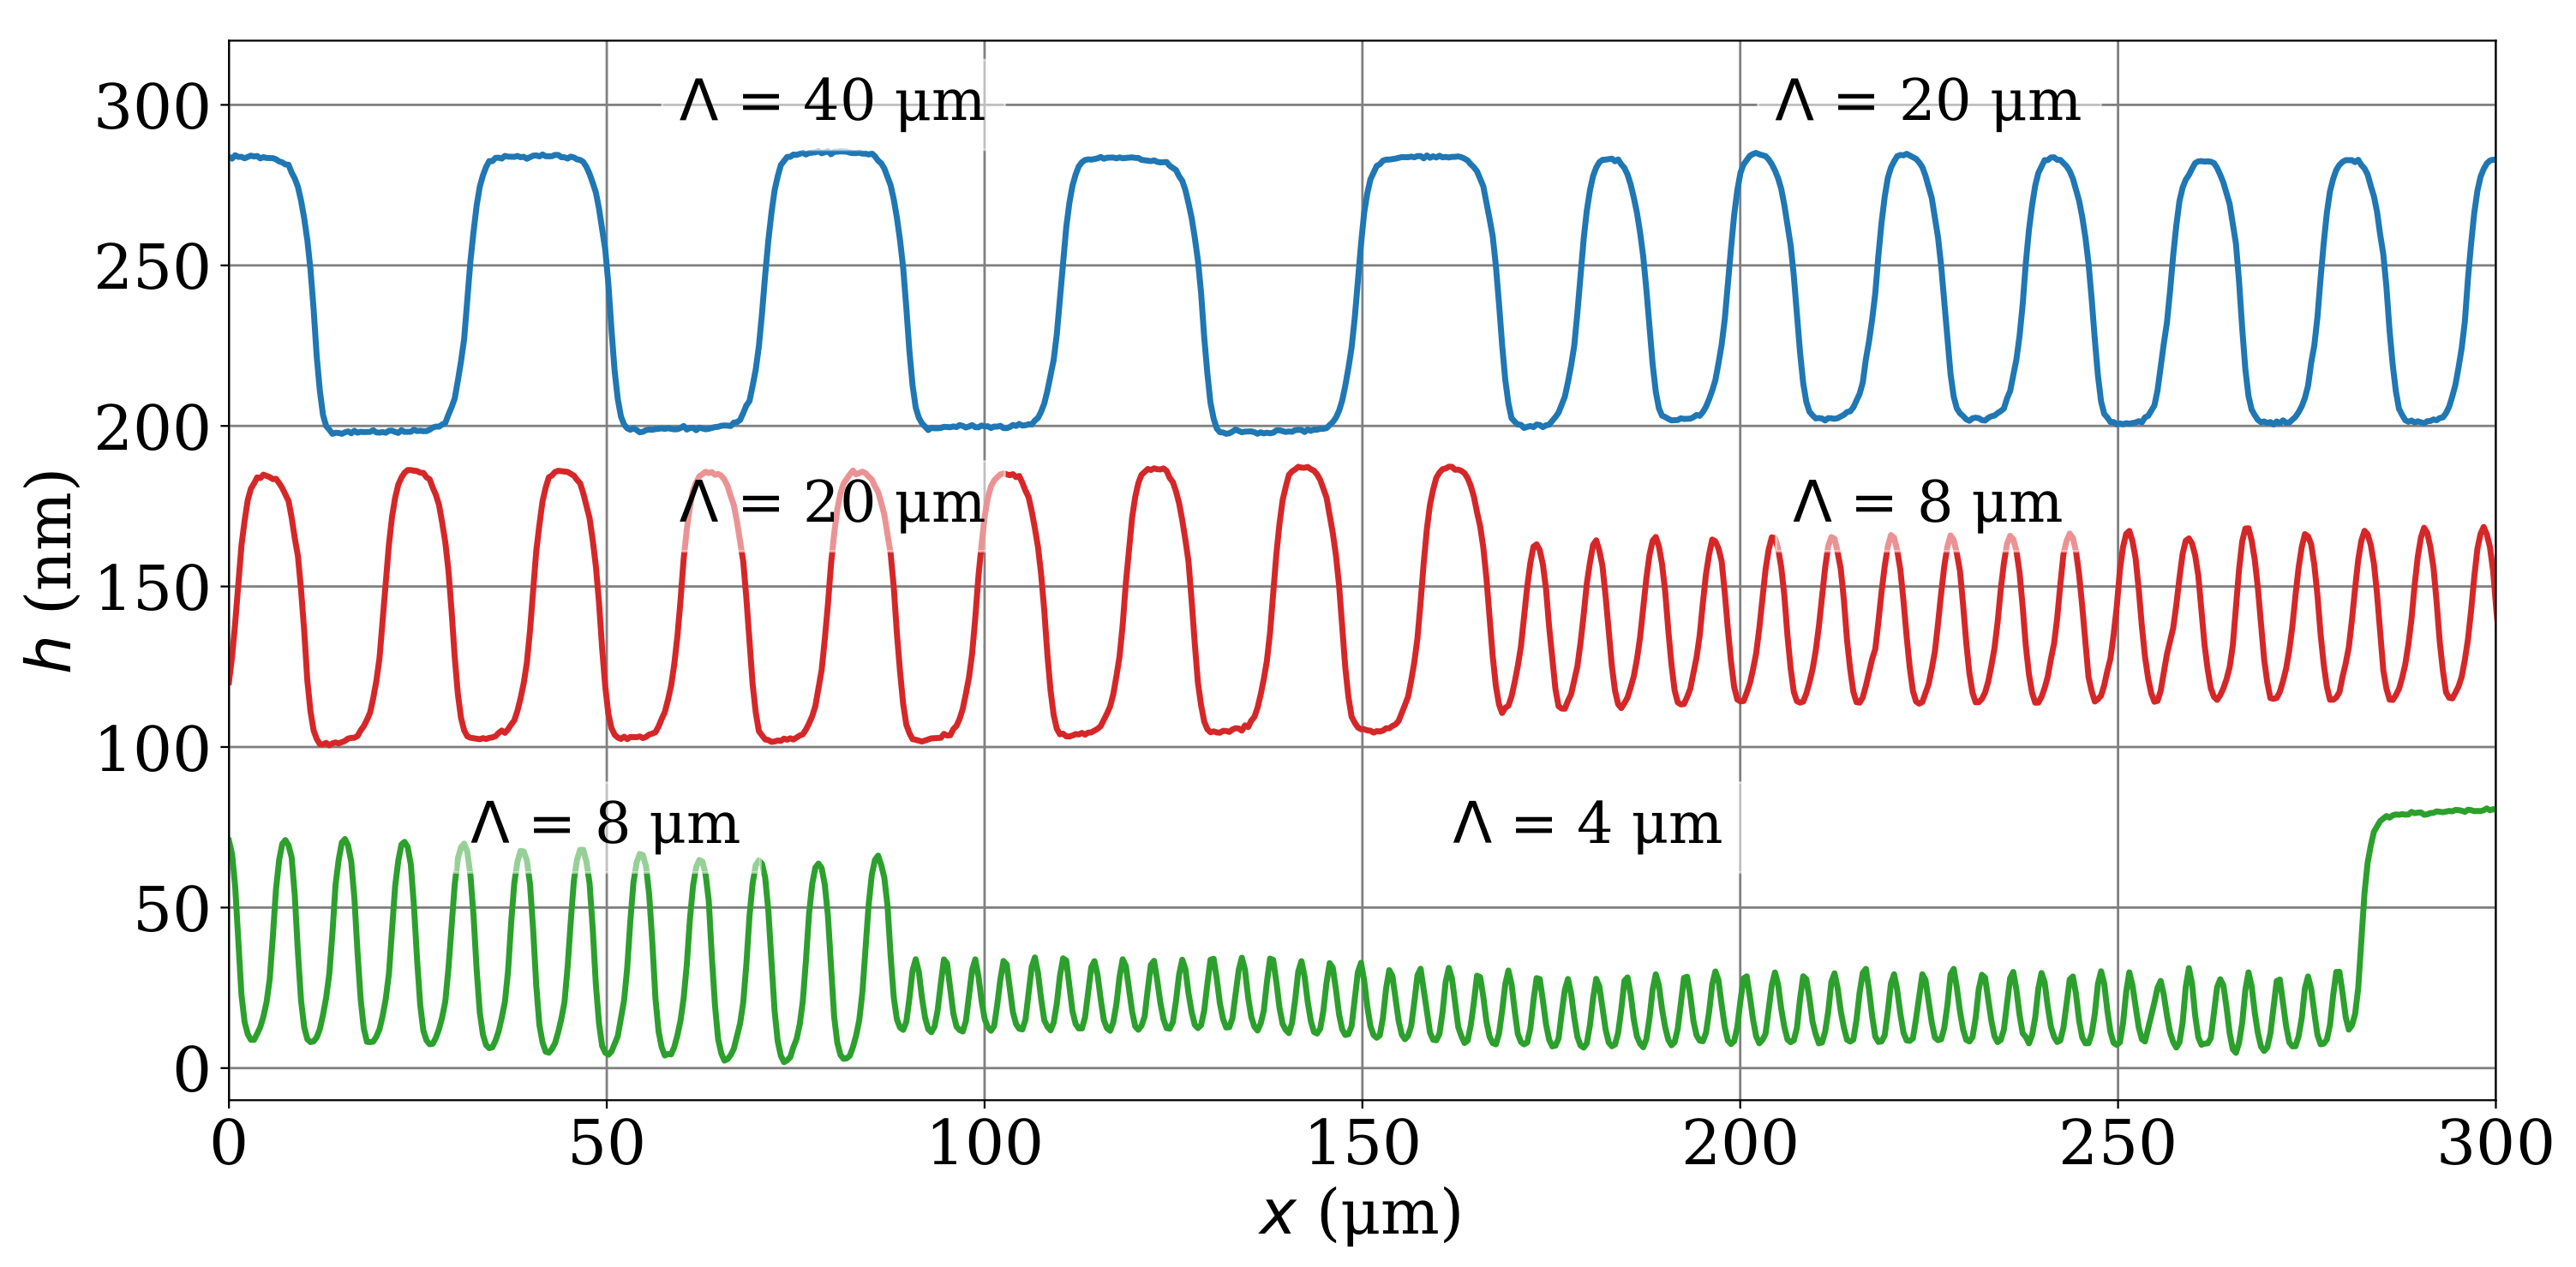
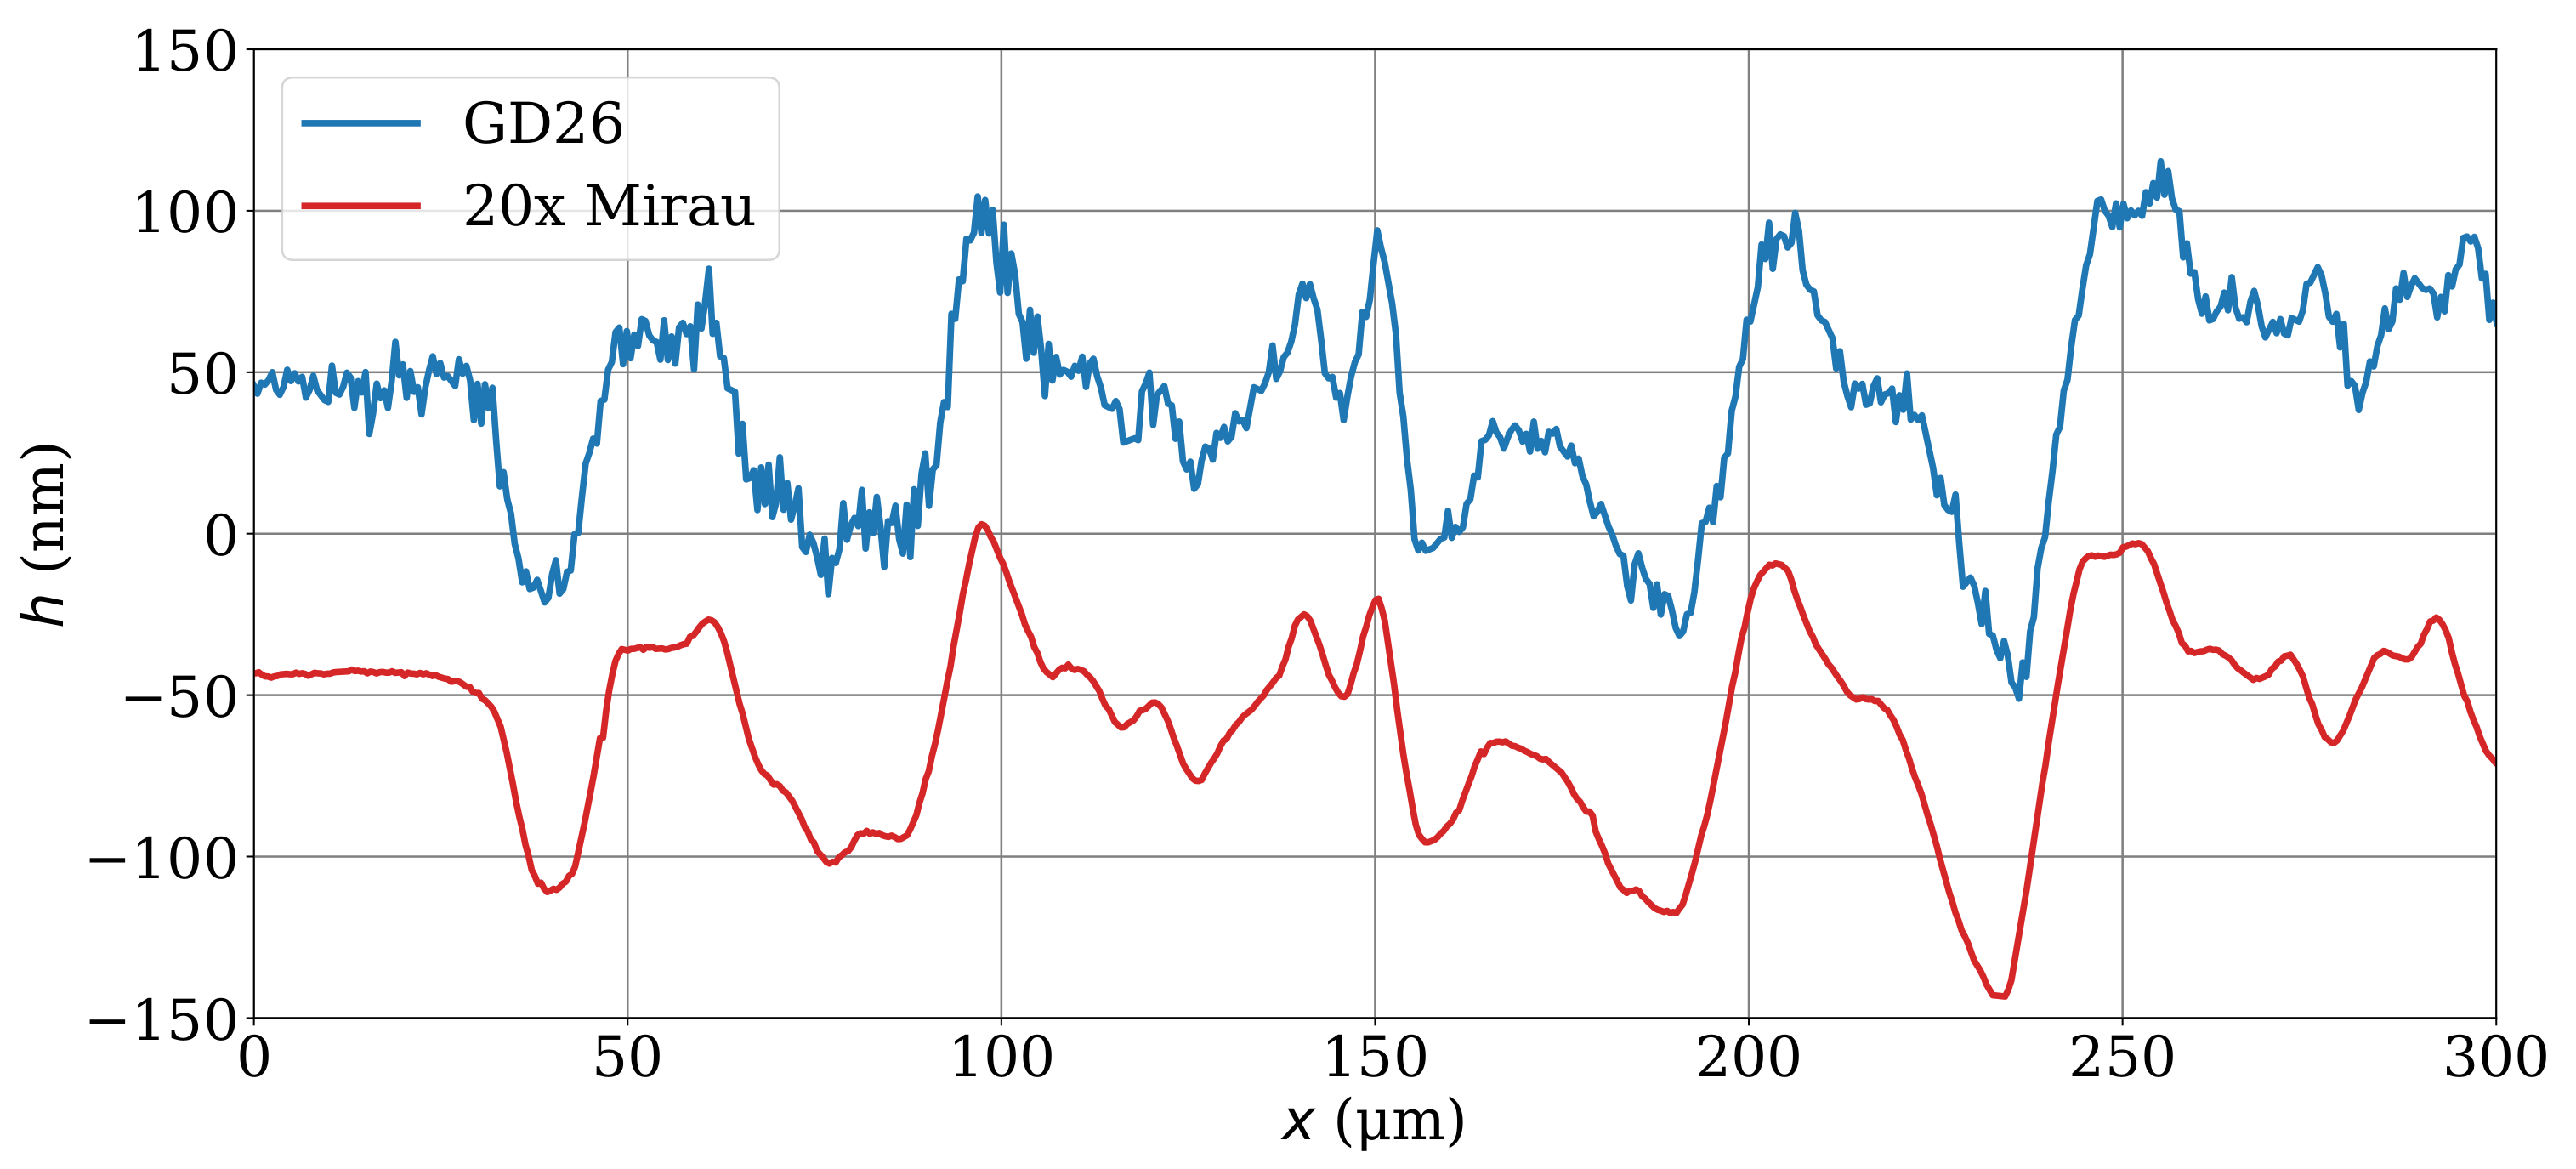
4.2. Validation of Vibration Compensation Capabilities of the MA

In the following, a measurement of a sine standard with 100 µm period length and 1 µm peak-to-valley amplitude is performed to illustrate the vibration compensation capabilities of the Mirau setup. For this purpose, two measurements are sequentially executed. First, the sinusoidal surface topography is measured in a disturbance-free environment. The result is depicted in Figure 9a.
Then, a well-defined vibration is applied. For this purpose, the object to be measured is sinusoidally deflected by a piezo-driven stage with an amplitude of 200 nm and an oscillation frequency of 8 Hz. Figure 9b shows the impact of the disturbance on the measured surface topography. There is a significant difference to the disturbance-free surface topography, and the sinusoidal structure can only be suspected. Besides, the CSI signal the laser interferometric signal of the IDS is detected during the depth scanning process, leading to the course of height values depicted in Figure 10. Due to the acquisition rate of 1000 height values per second, the changing height caused by the depth scan (linear part of the course) and the superimposed oscillation of the vibration could be detected by the IDS. Consequently, the frames captured by the CCD camera can be resorted according to the distance values measured by the IDS. The evaluation of the sorted and trigonometrically interpolated CSI signals using a phase analyzing algorithm leads to the surface topography depicted in Figure 9c. A comparison with the unaffected surface topography (see Figure 9a) shows hardly any deviation. The determined peak-to-valley amplitude of the surface obtained from the corrected data corresponds to 0.998 µm, while the measured amplitude of the surface topography measured without disturbance is 0.992 µm. In both measurements the period length results in 100 µm. Therefore, the influences of the disturbance on the measured surface is successfully corrected.

5. Conclusions and Outlook

In this contribution, a CSI comprising a Mirau objective is introduced, where a custom-built interference device is attached to a commercial microscope objective. An oscillating reference mirror inside the Mirau objective’s attachment enables the IDS measuring process in parallel to the conventional CSI depth scan. Thus, the changed distance between CSI and surface under investigation including influences caused by external vibrations are measurable by the IDS. This enables a correction of the disturbance as shown for a sinusoidal standard. Due to its advantages, the Mirau setup is the preferred and most frequently used interferometer type in industry. Thus, to the best of the authors knowledge, this is a novel combination, enabling the industrial application of the previously developed method for vibration compensation. Furthermore, the proper optical functioning of the custom-built Mirau objective is investigated by comparative measurements on various surface structures using different LEDs and reference instrumentation such as a tactile stylus instrument and a 10x Mirau objective lens from Nikon Inc. The measured surface structure of the superfine roughness standard and the gratings of the RSM standard are well resolved as expected for a CSI with an NA of 0.28. A comparison between interference signals obtained by the custom-built Mirau objective using different LEDs of different spectral bandwidth reveals that interference signals obtained for a white LED illumination suffer from dispersion. Moreover, low systematic deviations in the range of ±10 nm occur, which are basically independent from the dispersion effect. Since these systematic deviations are reproducible, it can be eliminated from the measured surface structure after calibration. These deviations and disturbances might be a result of misalignment in the custom-built objective. In further investigations, the alignment of the optical elements will be measured in a custom-built interferometric setup.
In this work, a disturbance affecting the interference signals of each camera pixel in the same way is assumed. However, the influence of external vibrations might be different across the surface to be measured. Therefore, multiple IDS can be applied to measure vibrations on laterally shifted locations on the surface under investigation. This is part of future developments. The laser beam of the IDS is currently tilted to be able to pass the reference mirror of the Mirau objective. Consequently, a decreased intensity of the reflected laser light occurs with increasing surface slope. This can probably be optimized using critical illumination for the IDS.

Author Contributions

Conceptualization, H.S.; investigation, H.S. methodology, H.S.; software, P.G.; validation, H.S., P.G. and S.H.; formal analysis, H.S. and S.H. writing—original draft preparation, H.S.; writing—review and editing, H.S., P.G., S.H. and P.L.; supervision, P.L.; funding acquisition, P.L. All authors have read and agreed to the published version of the manuscript.

Funding

The support of this project under the WIPANO program (grant number 03THW10K24) by the German Ministry of Economy and Energy is gratefully acknowledged.

Institutional Review Board Statement

Not applicable.

Informed Consent Statement

Not applicable.

Data Availability Statement

The data presented in this study are available on request from the corresponding author.

Conflicts of Interest

The authors declare no conflict of interest. The funders had no role in the design of the study; in the collection, analyses, or interpretation of data; in the writing of the manuscript; and in the decision to publish the results.

References

  1. Kino, G.S.; Corle, T.R. Confocal Scanning Optical Microscopy and Related Imaging Systems; Academic Press: Cambridge, MA, USA, 1996. [Google Scholar]
  2. Lehmann, P.; Tereschenko, S.; Xie, W. Fundamental aspects of resolution and precision in vertical scanning white-light interferometry. Surf. Topogr. Metrol. Prop. 2016, 4, 024004. [Google Scholar] [CrossRef] [Green Version]
  3. De Groot, P. Principles of interference microscopy for the measurement of surface topography. Adv. Opt. Photonics 2015, 7, 1–65. [Google Scholar] [CrossRef]
  4. Schake, M.; Lehmann, P. Quadrature-based interferometry using pulsed RGB illumination. Opt. Express 2019, 27, 16329–16343. [Google Scholar] [CrossRef] [PubMed]
  5. Gollor, P.; Schake, M.; Tereschenko, S.; Roetmann, K.; Mann, K.; Schäfer, B.; Uhlrich, G.; Haberland, M.; Lehmann, P. Kombination eines neuartigen Doppelpuls-RGB-Interferometers mit einem Hartmann-Shack-Wellenfrontsensor zur dynamischen flächenhaften Topographieerfassung. Tm-Tech. Mess. 2020, 87, 523–534. [Google Scholar] [CrossRef]
  6. Kühn, J.; Colomb, T.; Montfort, F.; Charrière, F.; Emery, Y.; Cuche, E.; Marquet, P.; Depeursinge, C. Real-time dual-wavelength digital holographic microscopy with a single hologram acquisition. Opt. Express 2007, 15, 7231–7242. [Google Scholar] [CrossRef]
  7. Wu, D.; Zhu, R.H.; Chen, L.; Li, J.Y. Transverse spatial phase-shifting method used in vibration-compensated interferometer. Optik 2004, 115, 343–346. [Google Scholar] [CrossRef]
  8. Jiang, X.; Wang, K.; Gao, F.; Muhamedsalih, H. Fast surface measurement using wavelength scanning interferometry with compensation of environmental noise. Appl. Opt. 2010, 49, 2903–2909. [Google Scholar] [CrossRef] [PubMed] [Green Version]
  9. Schäfer, P.; Broschart, D.; Seewig, J. Aktive Schwingungsdämpfung eines Weißlichtinterferometers. Tm-Tech. Mess. 2013, 80, 16–20. [Google Scholar] [CrossRef]
  10. Teale, C.; Barbastathis, G.; Schmidt, M.A. Vibration compensated, scanning white light interferometer for in situ depth measurements in a deep reactive ion etcher. J. Microelectromech. Syst. 2019, 28, 441–446. [Google Scholar] [CrossRef]
  11. Deck, L.L. Suppressing phase errors from vibration in phase-shifting interferometry. Appl. Opt. 2009, 48, 3948–3960. [Google Scholar] [CrossRef]
  12. Kiselev, I.; Kiselev, E.I.; Drexel, M.; Hauptmannl, M. Noise robustness of interferometric surface topography evaluation methods. Correlogram correlation. Surf. Topogr. Metrol. Prop. 2017, 5, 045008. [Google Scholar] [CrossRef] [Green Version]
  13. Tereschenko, S.; Lehmann, P.; Gollor, P.; Kuehnhold, P. Robust vertical scanning white-light interferometry in close-to-machine applications. In Optical Measurement Systems for Industrial Inspection IX; International Society for Optics and Photonics: Bellingham, WA, USA, 2015; Volume 9525, p. 95250Q. [Google Scholar]
  14. Tereschenko, S.; Lehmann, P.; Zellmer, L.; Brueckner-Foit, A. Passive vibration compensation in scanning white-light interferometry. Appl. Opt. 2016, 55, 6172–6182. [Google Scholar] [CrossRef]
  15. Tereschenko, S.; Lehmann, P.; Gollor, P.; Kuehnhold, P. Vibration compensated high-resolution scanning white-light Linnik-interferometer. In Optical Measurement Systems for Industrial Inspection X; International Society for Optics and Photonics: Bellingham, WA, USA, 2017; Volume 10329, p. 1032940. [Google Scholar]
  16. Hagemeier, S.; Tereschenko, S.; Lehmann, P. High-speed laser interferometric distance sensor with reference mirror oscillating at ultrasonic frequencies. Tm-Tech. Mess. 2019, 86, 164–174. [Google Scholar] [CrossRef]
  17. Sasaki, O.; Okazaki, H. Sinusoidal phase modulating interferometry for surface profile measurement. Appl. Opt. 1986, 25, 3137–3140. [Google Scholar] [CrossRef] [PubMed]
  18. Zhang, Q.; Pan, W.; Cross, L.E. Laser interferometer for the study of piezoelectric and electrostrictive strains. J. Appl. Phys. 1988, 63, 2492–2496. [Google Scholar] [CrossRef]
  19. Martini, G. Analysis of a single-mode optical fibre piezoceramic phase modulator. Opt. Quantum Electron. 1987, 19, 179–190. [Google Scholar] [CrossRef]
  20. De Groot, P. Design of error-compensating algorithms for sinusoidal phase shifting interferometry. Appl. Opt. 2009, 48, 6788–6796. [Google Scholar] [CrossRef]
  21. Schulz, M.; Lehmann, P. Measurement of distance changes using a fibre-coupled common-path interferometer with mechanical path length modulation. Meas. Sci. Technol. 2013, 24, 065202. [Google Scholar] [CrossRef]
  22. Knell, H.; Laubach, S.; Ehret, G.; Lehmann, P. Continuous measurement of optical surfaces using a line-scan interferometer with sinusoidal path length modulation. Opt. Express 2014, 22, 29787–29798. [Google Scholar] [CrossRef] [PubMed]
  23. Kino, G.S.; Chim, S.S. Mirau correlation microscope. Appl. Opt. 1990, 29, 3775–3783. [Google Scholar] [CrossRef] [PubMed]
  24. Tereschenko, S. Digitale Analyse Periodischer und Transienter Messsignale Anhand von Beispielen aus der Optischen Präzisionsmesstechnik. Ph.D. Thesis, University of Kassel, Kassel, Germany, 2018. [Google Scholar]
  25. Mitutoyo Corporation. Microscope Units and Objectives (UV, NUV, Visible and NIR Region). 2019. Available online: https://www.mitutoyo.com/wp-content/uploads/2020/12/E14020.pdf (accessed on 11 October 2021).
  26. CDGM Glass Company Ltd. Datasheet H-K9L. 2021. Available online: http://cdgmglass.com/Portals/0/CDGMSearch2/pdf/H-K9L.pdf (accessed on 11 October 2021).
  27. PI Ceramic GmbH. Datasheet PICMA Chip Actuator PL0xx. 2017. Available online: https://static.piceramic.com/fileadmin/user_upload/physik_instrumente/files/datasheets/PL0xx_Datasheet.pdf (accessed on 11 October 2021).
  28. Reichel, L.; Ammar, G.; Gragg, W. Discrete least squares approximation by trigonometric polynomials. Math. Comput. 1991, 57, 273–289. [Google Scholar] [CrossRef]
  29. De Groot, P.; Deck, L. Surface profiling by analysis of white-light interferograms in the spatial frequency domain. J. Mod. Opt. 1995, 42, 389–401. [Google Scholar] [CrossRef]
  30. Larkin, K.G. Efficient nonlinear algorithm for envelope detection in white light interferometry. JOSA A 1996, 13, 832–843. [Google Scholar] [CrossRef] [Green Version]
  31. Harasaki, A.; Schmit, J.; Wyant, J.C. Improved vertical-scanning interferometry. Appl. Opt. 2000, 39, 2107–2115. [Google Scholar] [CrossRef] [PubMed] [Green Version]
  32. Fleischer, M.; Windecker, R.; Tiziani, H.J. Fast algorithms for data reduction in modern optical three-dimensional profile measurement systems with MMX technology. Appl. Opt. 2000, 39, 1290–1297. [Google Scholar] [CrossRef]
  33. De Groot, P.; Colonna de Lega, X. Signal modeling for low-coherence height-scanning interference microscopy. Appl. Opt. 2004, 43, 4821–4830. [Google Scholar] [CrossRef]
  34. Hagemeier, S.; Lehmann, P. High resolution topography sensors in a multisenor measuring setup. In Optical Measurement Systems for Industrial Inspection XI; International Society for Optics and Photonics: Bellingham, WA, USA, 2019; Volume 11056, p. 110563I. [Google Scholar]
  35. De Groot, P.; DiSciacca, J. Surface-height measurement noise in interference microscopy. In Interferometry XIX; International Society for Optics and Photonics: Bellingham, WA, USA, 2018; Volume 10749, p. 107490Q. [Google Scholar]
  36. Giusca, C.L.; Leach, R.K.; Helary, F.; Gutauskas, T.; Nimishakavi, L. Calibration of the scales of areal surface topography-measuring instruments: Part 1. Measurement noise and residual flatness. Meas. Sci. Technol. 2012, 23, 035008. [Google Scholar] [CrossRef]
  37. Krüger-Sehm, R.; Frühauf, J.; Dziomba, T. Determination of the short wavelength cutoff of interferential and confocal microscopes. Wear 2008, 264, 439–443. [Google Scholar] [CrossRef]
  38. Halle GmbH. Calibration Standards for Contact Stylus Instruments, Line of Products KNT 4070/03. 2009. Available online: http://www.halle-normale.de/pdf/Prospektseiten/englisch/17%20Ps-KNT4070_03_Bl_6-6_GB.pdf (accessed on 11 October 2021).
  39. Hagemeier, S.; Schake, M.; Lehmann, P. Sensor characterization by comparative measurements using a multi-sensor measuring system. J. Sens. Sens. Syst. 2019, 8, 111–121. [Google Scholar] [CrossRef] [Green Version]
Figure 1. Schematic illustration (a) and photograph (b) of the Mirau CSI with a custom-built Mirau attachment comprising the oscillatable reference mirror in front of a commercial MO.
Applsci 11 09642 g001
Figure 2. Photograph of the custom-built MA with demounted adjustment head for better view of the used piezo actuator.
Applsci 11 09642 g002
Figure 3. Measured IDS signal (blue) sampled during a CSI depth scan and the corresponding actuator excitation (brown). The excitation is caused by the voltage curve (green). The evaluation windows are marked by the colored areas where the nearly linear mirror deflection leads to a constant frequency f e of the interference signal. u cam represents the camera trigger signal at the turning point of the mirror deflection.
Applsci 11 09642 g003
Figure 4. Schematic illustration of the correction algorithm. The CSI dataset is rearranged according to the real movement measured by the IDS (oriented to [24]).
Applsci 11 09642 g004
Figure 5. Interference signals obtained from an aluminum mirror using the custom-built (a,c) as well as the commercial Mirau objective (b,d).
Applsci 11 09642 g005
Figure 6. Residual flatness obtained by averaging nine slightly shifted measured topography data sets (a) acquired with a white and (b) with red light illumination and (c) corrected topography of an additionally measured mirror surface by subtracting the residual flatness.
Applsci 11 09642 g006
Figure 7. Profiles of RS-M standard obtained by 20x Mirau with different grating periods Λ of 40 µm and 20 µm (blue curve), 20 µm and 8 µm (red curve) and 8 µm and 4 µm (green curve).
Applsci 11 09642 g007
Figure 8. Profiles measured on the superfine roughness standard KNT4070/03. The blue profile is obtained by the tactile stylus instrument GD26 and the red one below by the custom-built 20x Mirau CSI.
Applsci 11 09642 g008
Figure 9. Measured sinusoidal standard with 1 µm peak-to-valley amplitude and 100 µm period length. (a) Topographies obtained without disturbances on a vibration-damping table, (b) disturbed by a sinusoidal vibration with an amplitude of 200 nm and an oscillation frequency of 8 Hz, (c) same topography as shown in panel (b) but corrected according to the described compensation method, (df) the corresponding profiles marked by the blue dashed line in the (ac) surface topographies.
Applsci 11 09642 g009
Figure 10. Measured IDS signal of a depth scan of 10 µm disturbed by a sinusoidal oscillation.
Applsci 11 09642 g010
Publisher’s Note: MDPI stays neutral with regard to jurisdictional claims in published maps and institutional affiliations.

