Article

Performance Improvement in a Wavy Twisted Rudder by Alignment of the Wave Peak

1
Samsung Heavy Industries Co., Ltd., Daejeon 34051, Korea
2
Department of Naval Architecture & Ocean Engineering, Pusan National University, Busan 46241, Korea
*
Author to whom correspondence should be addressed.
Appl. Sci. 2021, 11(20), 9634; https://doi.org/10.3390/app11209634
Submission received: 9 August 2021 / Revised: 13 October 2021 / Accepted: 13 October 2021 / Published: 15 October 2021
(This article belongs to the Special Issue Energy Saving Devices in Ship)

Abstract

:
An improved wavy twisted rudder (WTR) is proposed based on a previous study. The misalignment of the wavy and propeller centers and the computational work of the previous study are supplemented to determine the effectiveness of the developed wavy twisted rudder. The aligned wavy twisted rudder (AWTR) was also applied to a KRISO container ship (KCS). The resistance, self-propulsion performance, and rudder forces due to the angular variation in the WTR and AWTR were compared using computational fluid dynamics (CFD). The numerical results were compared with the experimental results. The self-propulsion performance of the AWTR was superior to that of the WTR, with an efficiency gain of approximately 0.3% in both the model test and numerical analyses. The effectiveness of the AWTR was demonstrated using CFD; the CFD improved for the WTR in comparison with a conventional twisted rudder, especially at large rudder angles. The stall point of the AWTR was approximately 5° greater than that of the WTR in both directions. The results confirm the superiority of the AWTR in terms of its delayed stall and high lift-to-drag ratio, which was investigated by visualizing the streamline around the rudder. The actual maneuverability, such as the turning circle, realized with AWTR shall be compared with that realized with a WTR and conventional TR in the near future.

1. Introduction

As environmental conditions have become highly unpredictable, the safety and reliability of ship operations have acquired unprecedented significance. For safer operation, research on the development of rudders with superior maneuverability is essential, especially in rough seas. Special rudders such as flaps and schilling rudders have been developed to improve performance by delaying the stall point and producing a high lift. Numerous studies have been conducted on their performance.
Olson [1] reported a 12–30% flap NACA 0018 profile using a 1.5 flap-to-linkage ratio that could generate a 50% greater lift than an all-moveable rudder of equal area. Kerwin et al. [2] and Oppenheim [3] demonstrated that a 20% flap NACA 66 profile could achieve a 59% greater lift than the original NACA 66 profile. Gim et al. [4] studied the distribution of velocity and energy behind a flap rudder based on variations in the flap angle. Kim et al. [5] studied the maneuvering performance and turning ability using a numerical method in shallow and deep-sea conditions based on the increase in the performance of the rudder. Bertram [6] proposed that flapped rudders could provide a considerably greater lift curve slope and a 60–70% greater maximum lift compared to a conventional rudder in the same area. Jun et al. [7] investigated the increase in turning ability with an increase in rudder force. A comparative study was conducted with a conventional (semi-spade) and special rudder (flap) for the same full-scale ships, as displayed in Figure 1 [8]. Maneuvering performances such as the zig-zag and stops were compared to determine the effectiveness of the special rudder. Liu et al. [9] analyzed the influences of the three major properties of a flapped rudder on its hydrodynamic coefficients using Reynolds-averaged Navier–Stokes simulations.
Although these special rudders offer superior maneuverability by delaying stall and generating high lift, the additional drag and risk of operational failure due to their complicated structure are a serious concern in actual operating conditions, which have not been addressed thus far.
The wavy twisted rudder was newly developed and introduced in a previous study to improve the performance of the existing twisted rudder [10,11]. Full-spade twisted rudders are extensively used in commercial ships instead of semi-spade and plain full-spade rudders because the flow-adapted twisting section of the rudder provides a more efficient hydrodynamic performance and has a lower cavitation risk under more favorable flow conditions.
The wavy twisted rudder is a biomimetic technology that was modeled after a humpback whale fin. The wavy twisted rudder was developed to remove the cavitation risk around the non-smoothing twisting leading-edge region, and to delay the stall point by making the flow more turbulent with a counter-rotating vortex pair from the wavy leading edge [12].
Numerous studies on humpback whale fin technology have been conducted. Fish et al. [13] presented a morphological study and suggested that the undulations act as vortex generators, re-energizing the boundary layer. They also suggested that the undulations could increase the effective span of a finite wing by diminishing the spanwise flow component, thus reducing the strength of the wing-tip vortex. Lin et al. [14] performed numerical studies on the aerodynamic characteristics of two modified NACA 0012 airfoils with different wavy surfaces using large-eddy simulations. Serson and Meneghini [15] numerically investigated the flow around the wings with spanwise waviness for Reynolds numbers Re = 1000, where several combinations of wavelength and amplitude were considered. Skillen et al. [16] presented wall-resolved large-eddy simulations for flow over an NACA 0021 wing with leading-edge undulations. When an undulation amplitude of 1.5% of the chord length possessing a wavelength of 21% of the chord length was applied, a 36% increase in mean lift and a 25% decrease in mean drag were observed.
Although the optimization of the wavy configuration was conducted in a previous study [10], there remains a need to improve the effectiveness of wave configuration, because the efficiency of the previous study was not sufficient in consideration of the other results [10]. Discrepancies exist in the alignment of the third peak point of the wave from the top of the rudder and the centerline of the propeller, as displayed in Figure 2a [10]. In the present study, the alignment was complete, as indicated in Figure 2b. The rudder in Figure 2a is called a wavy twisted rudder (WTR), whereas the rudder in Figure 2b is called an aligned wavy twisted rudder (AWTR).
Although the present alignment correction is not large, the improvement in rudder forces and propulsion efficiency is large compared to the case of the previous wavy rudder [10]. Further discussion is presented in the Results and Discussion and Conclusions sections.
For the application of the developed wavy rudder of an actual ship, one of the remaining issues is the difficulty in manufacturing a wavy configuration, which is complex when compared to a plain conventional rudder. As described in [10], the wavy surface can be represented by a mathematical formula; thus, accurate manufacturing is no longer difficult, and with the development of manufacturing technology, it is also no longer time consuming and expensive.

2. Materials and Methods

2.1. Target Ship and Propeller

A 3600 TEU KRISO container ship and propeller were used, as in a previous study [10]. The principal parameters of the target ship and propeller are listed in Table 1 and Table 2, respectively.

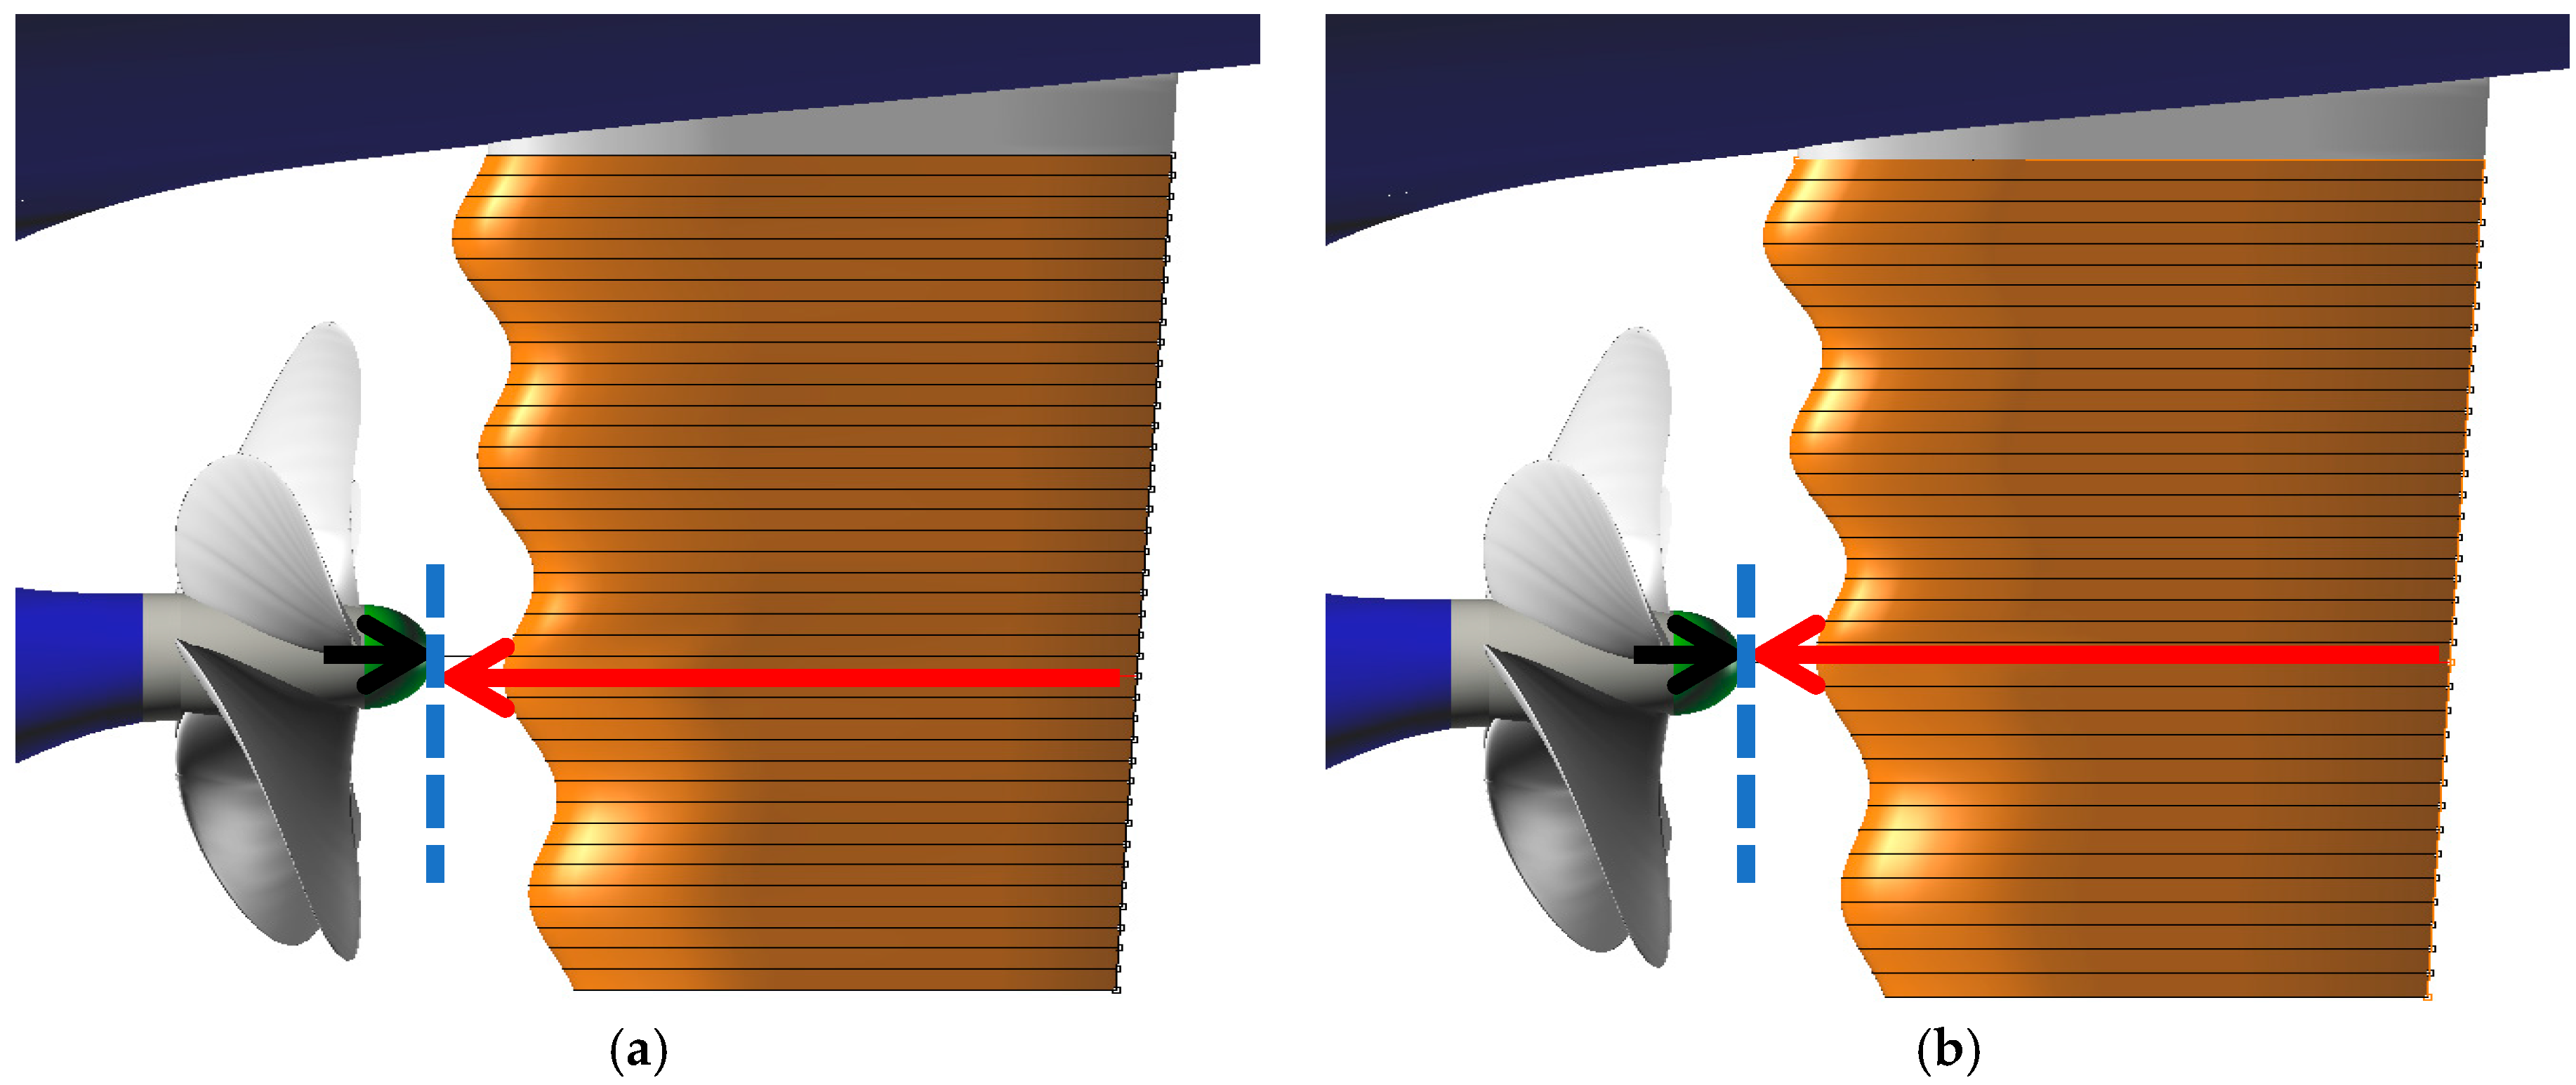
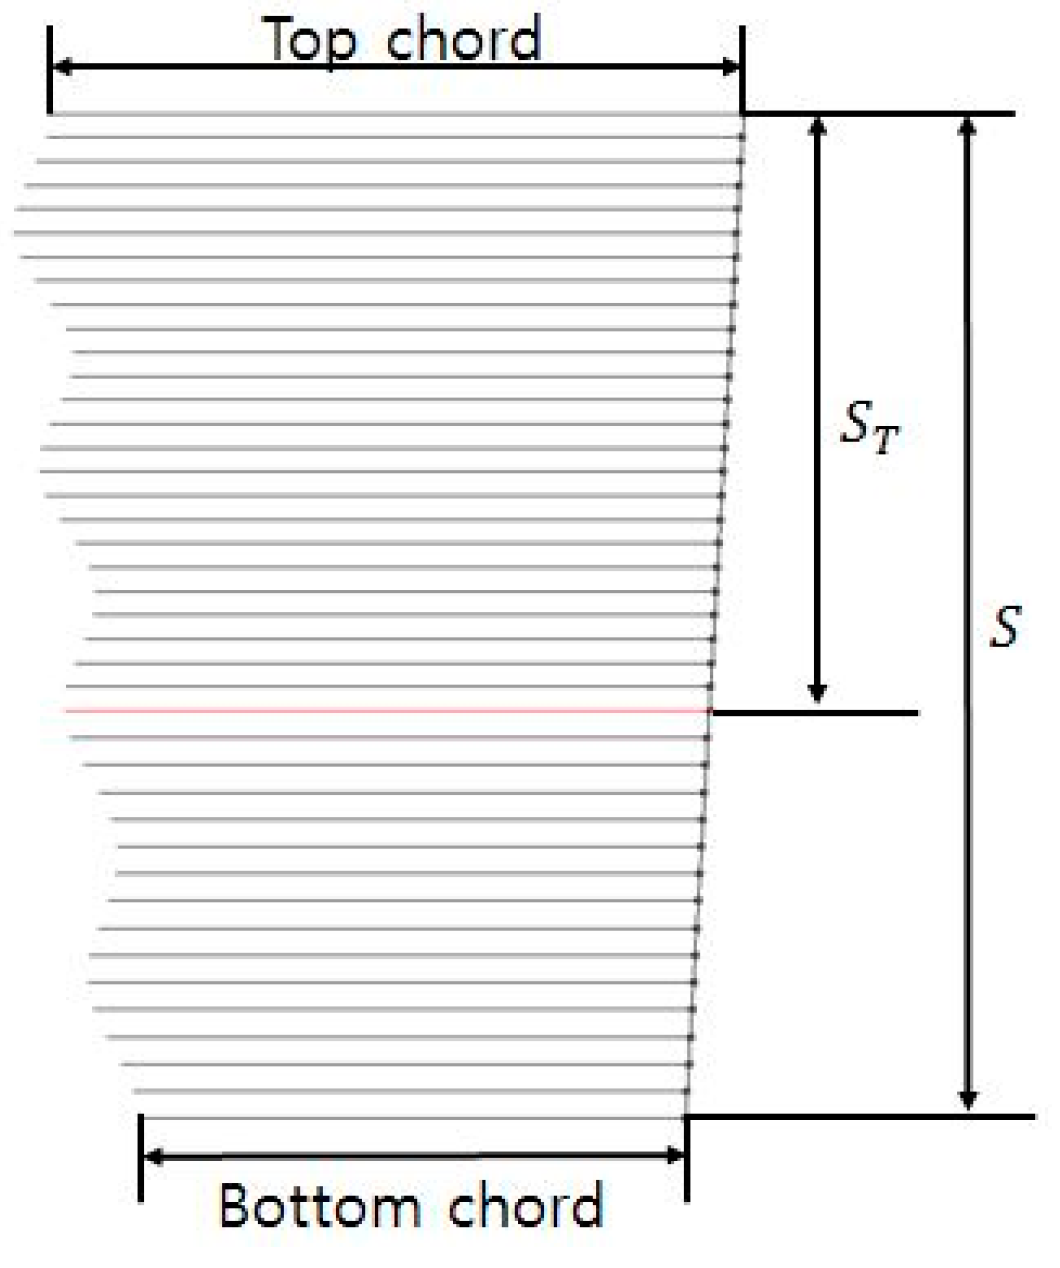
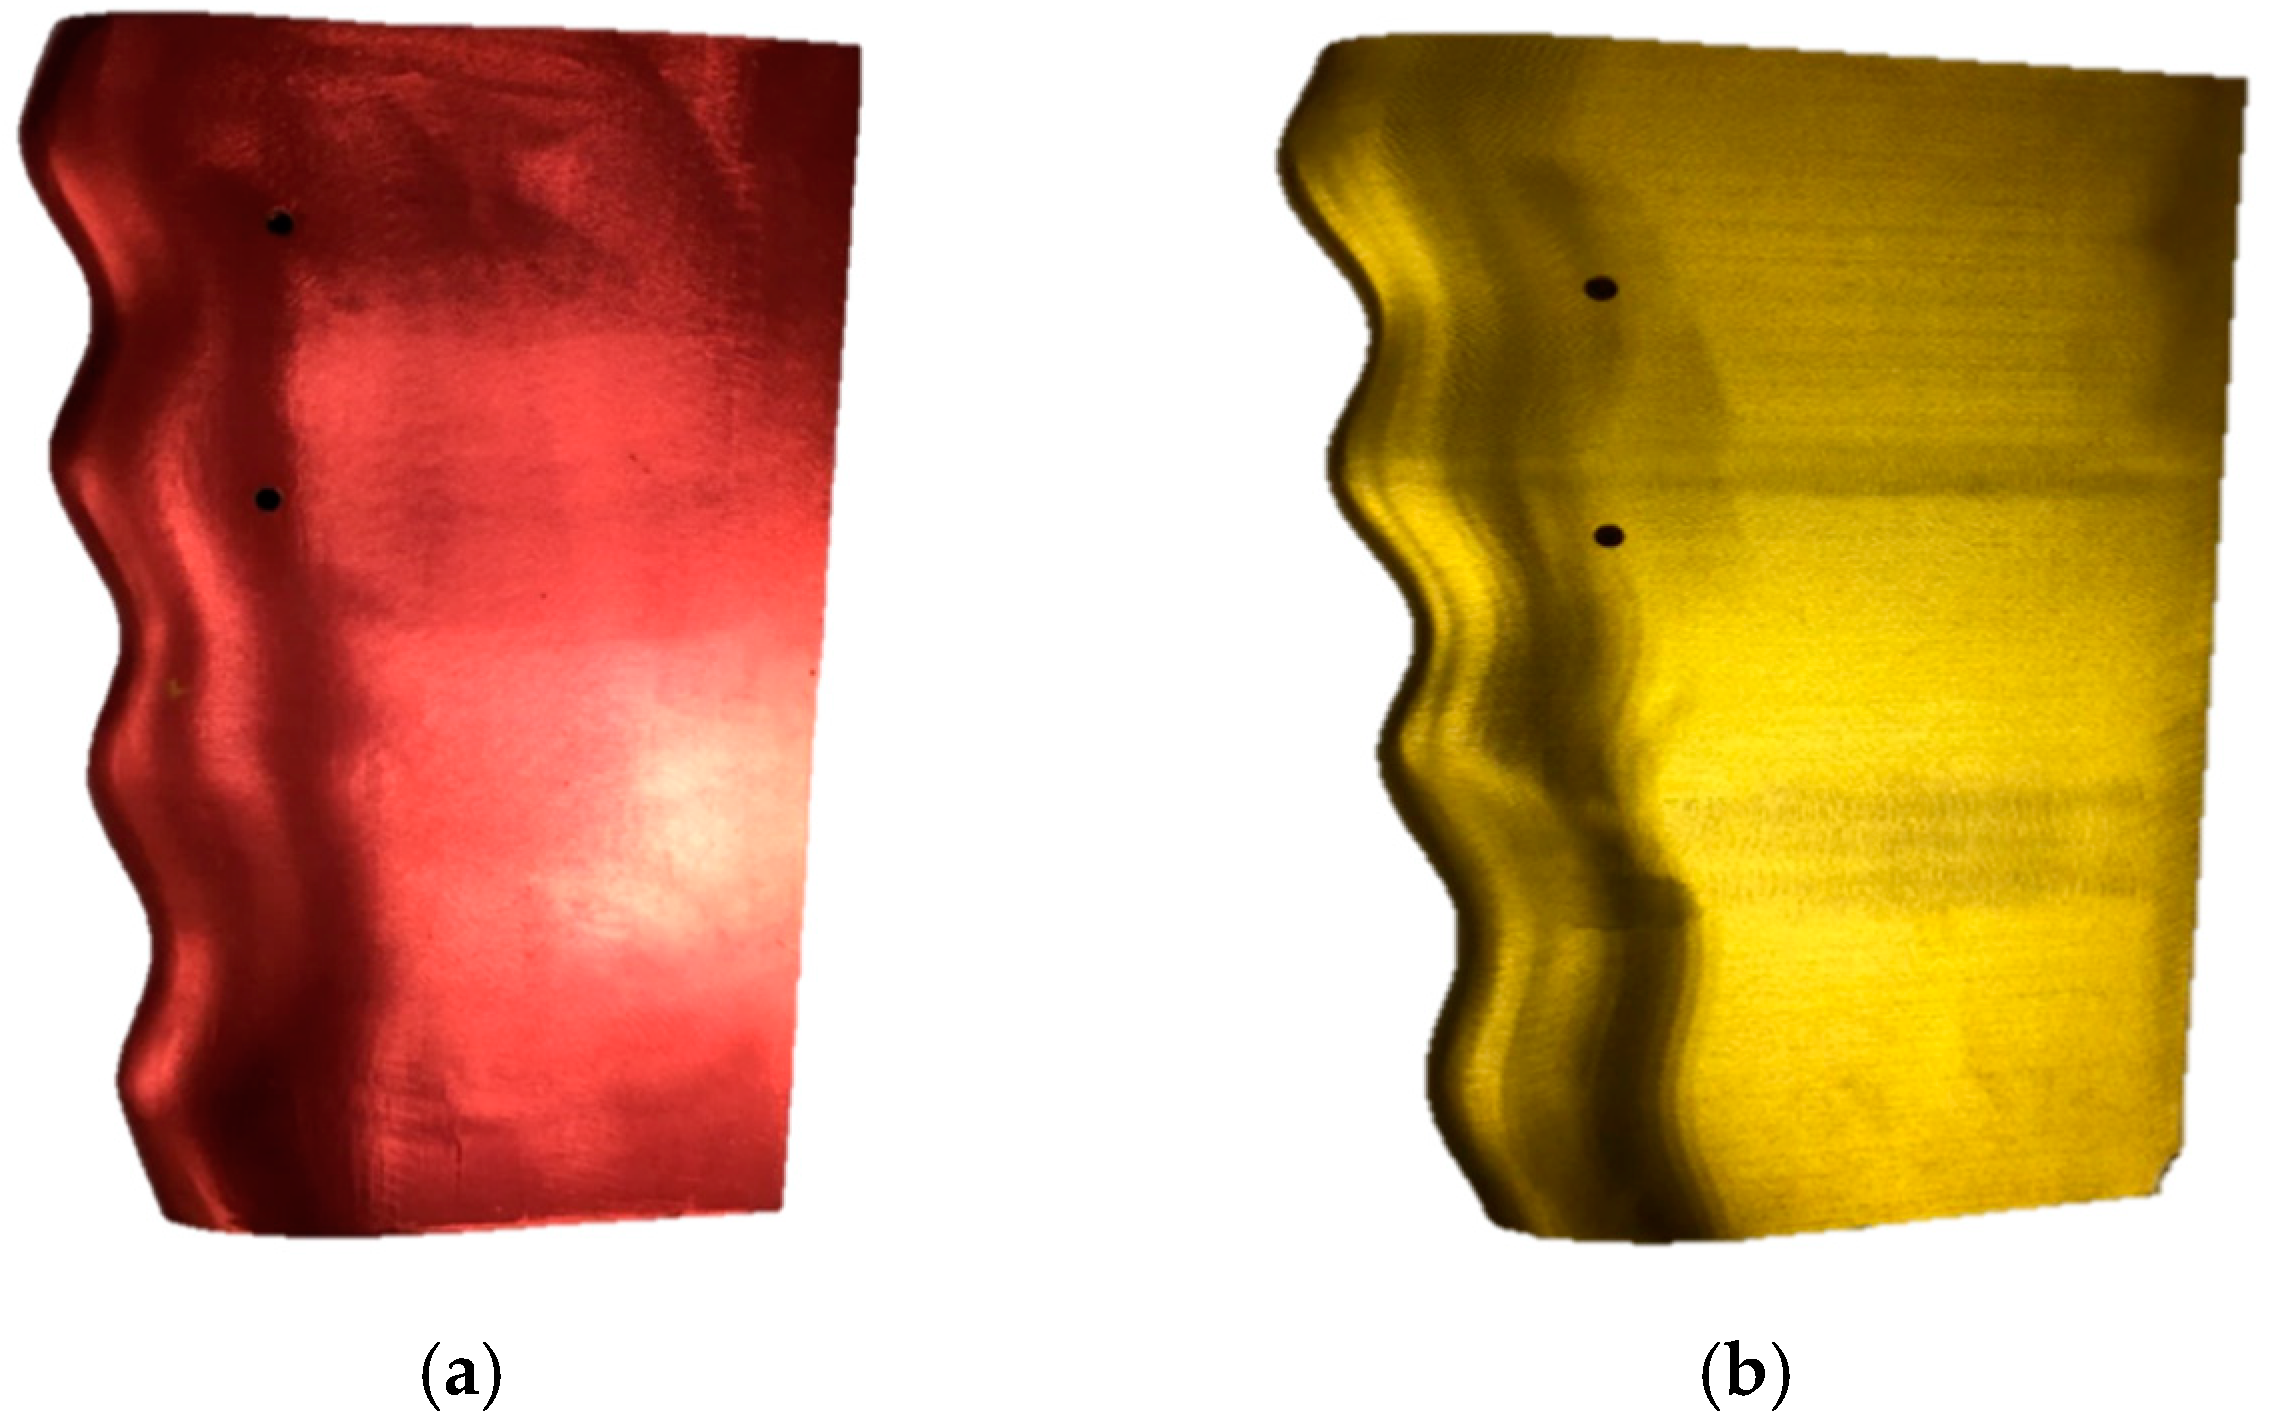
2.2. Design of Aligned Wavy Twisted Rudder

Twist angles of 5° to the portside and 5° to the starboard were formed based on the maximum thickness point for the NACA 0018 section. A wavy shape was applied to the leading-edge side profile, as indicated in Figure 3 [10].
The third peak point of the wave from the top was aligned with the centerline of the propeller to improve the bulb effect. As a method of design, the distance between the top and bottom stations was modified based on the centerline of the propeller, as shown in Figure 3; S is the span length of the rudder and ST is the distance from the top chord to the center of the propeller. Table 3 lists the main dimensions of the rudders. The number and size of the bulbs were chosen as described in a previous study [10].

2.3. Computation Setup

The performance analysis and flow visualization of the rudder were performed using computational fluid dynamics (CFD). The commercial program STAR CCM+ has been widely used in ship performance analysis programs. In the present computations, the resistance, self-propulsion, and rudder forces based on variations in the rudder angle were computed to compare the performances of the WTR and AWTR.

2.3.1. Governing Equations

Numerical analysis was performed using the commercial program STAR CCM+ (VER. 11. 02). The governing equation was applied as described in a previous study [10]. The continuous equation and Reynolds-averaged Navier–Stokes equations were used for the governing equations of a 3-D unsteady incompressible viscous turbulent flow, expressed as follows:
u i x i = 0
( ρ u i ) t + ( ρ u i u j ) x j = ρ x i + x i [ μ ( u i x j + u j x j ) ] + x i ( ρ u i u j ¯ ) ,
where u i , p, t, ρ , μ , and ρ u i u j ¯ are the velocity, pressure, time, density, viscosity coefficient, and Reynolds stress, respectively.

2.3.2. Numerical Method

The solution of the governing equation was obtained using the finite volume method, by applying the numerical method of the second order as a numerical discretization method for time and space integration. The SIMPLE algorithm was applied for the velocity–pressure coupling.
The turbulence model uses a two-layer realizable k-epsilon turbulent model that combines the realizable k-epsilon model with a two-layer approach. Unlike the standard k-epsilon model [17,18], the realizable k-epsilon model includes a new transport equation for the turbulence dissipation rate [19]. The computation of the two-layer approach is divided into two layers. The turbulent dissipation rate and turbulent viscosity in the layer next to the wall are specified as functions of the wall distance. The values of the turbulent dissipation rate specified in the near-wall layer are blended smoothly with the values computed by solving the transport equation far from the wall [20].
The transport equations for kinetic energy k and turbulent dissipation rate ε are as follows:
t ( ρ k ) + · ( ρ k v ¯ ) = · [ ( μ + μ t σ k ) k ] + P k ρ ( ε ε 0 ) + S k
t ( ρ ε ) + · ( ρ ε v ¯ ) = · [ ( μ + μ t σ ε ) ε ] + 1 T e C ϵ 1 P ε C ε 2 f 2 ρ ( ε T e ε 0 T 0 ) + S ε
where v ¯ , μ , and f 2 are the mean velocity, dynamic viscosity, and damping function, respectively; ε 0 is the ambient turbulence value in the source terms that counteracts the turbulence decay; σ k , σ ε ,   C ε 1 ,   and   C ε 2 are model coefficients, P k   and   P ε   are production terms, and S k   and   S ε are user-specified source terms. The possibility of imposing an ambient source term also leads to the definition of a specific time scale T 0 , which is defined as
T 0 = m a x ( k 0 ε 0 , C t v ε 0 )
where C t is a model coefficient. The turbulent eddy viscosity μ t is calculated as
μ t = ρ C μ f μ k T
where ρ , C μ , f μ , and T are the density, model coefficient, damping function, and turbulent time scale, respectively. The model coefficients of the transport equation use the default values in the STAR CCM+ V.15.02 manual [21].
The volume of fluid method was used to predict the distribution and movement of the interface of immiscible phases for free surface calculations. The high-resolution interface-capturing method was designed to track interfaces by mimicking the convective transport of immiscible fluid components [22,23]. The flow resulting from propeller rotation was calculated using the sliding mesh method, which directly rotates the grid around the propeller. The time step for the numerical calculation was set to the time corresponding to a 5° rotation of the propeller. Table 4 presents the computational analysis conditions for the CFD analysis.

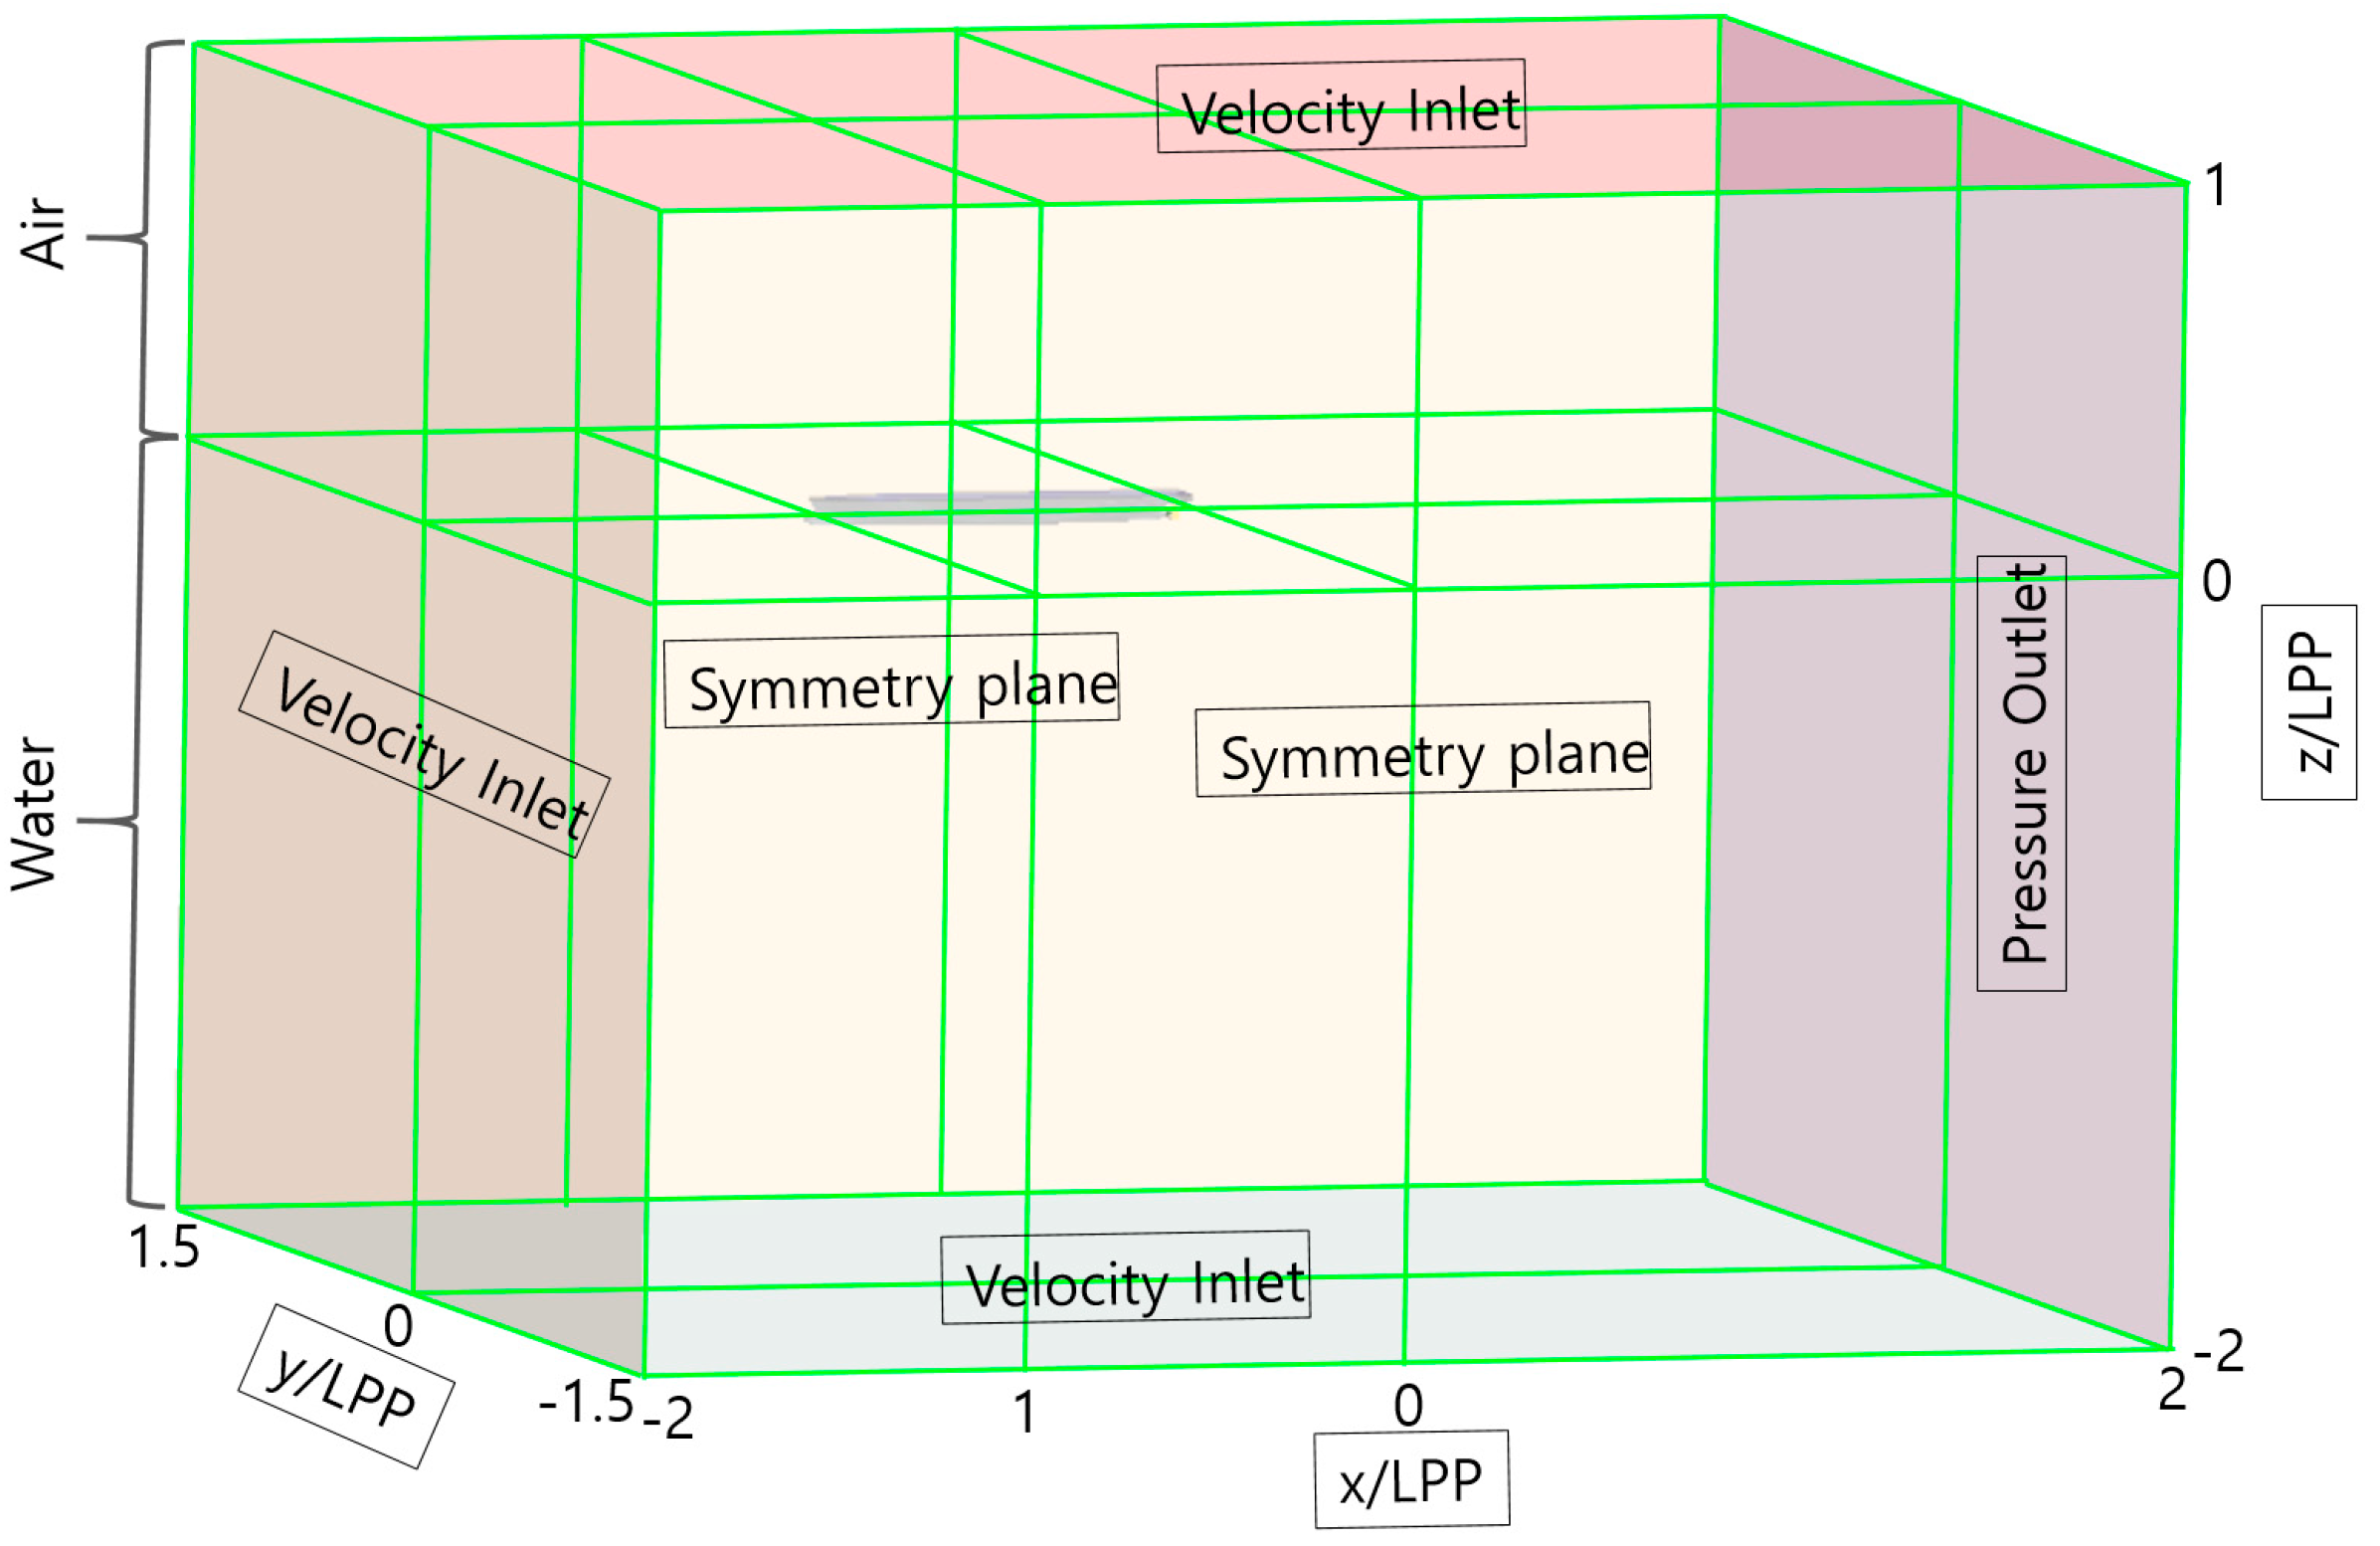
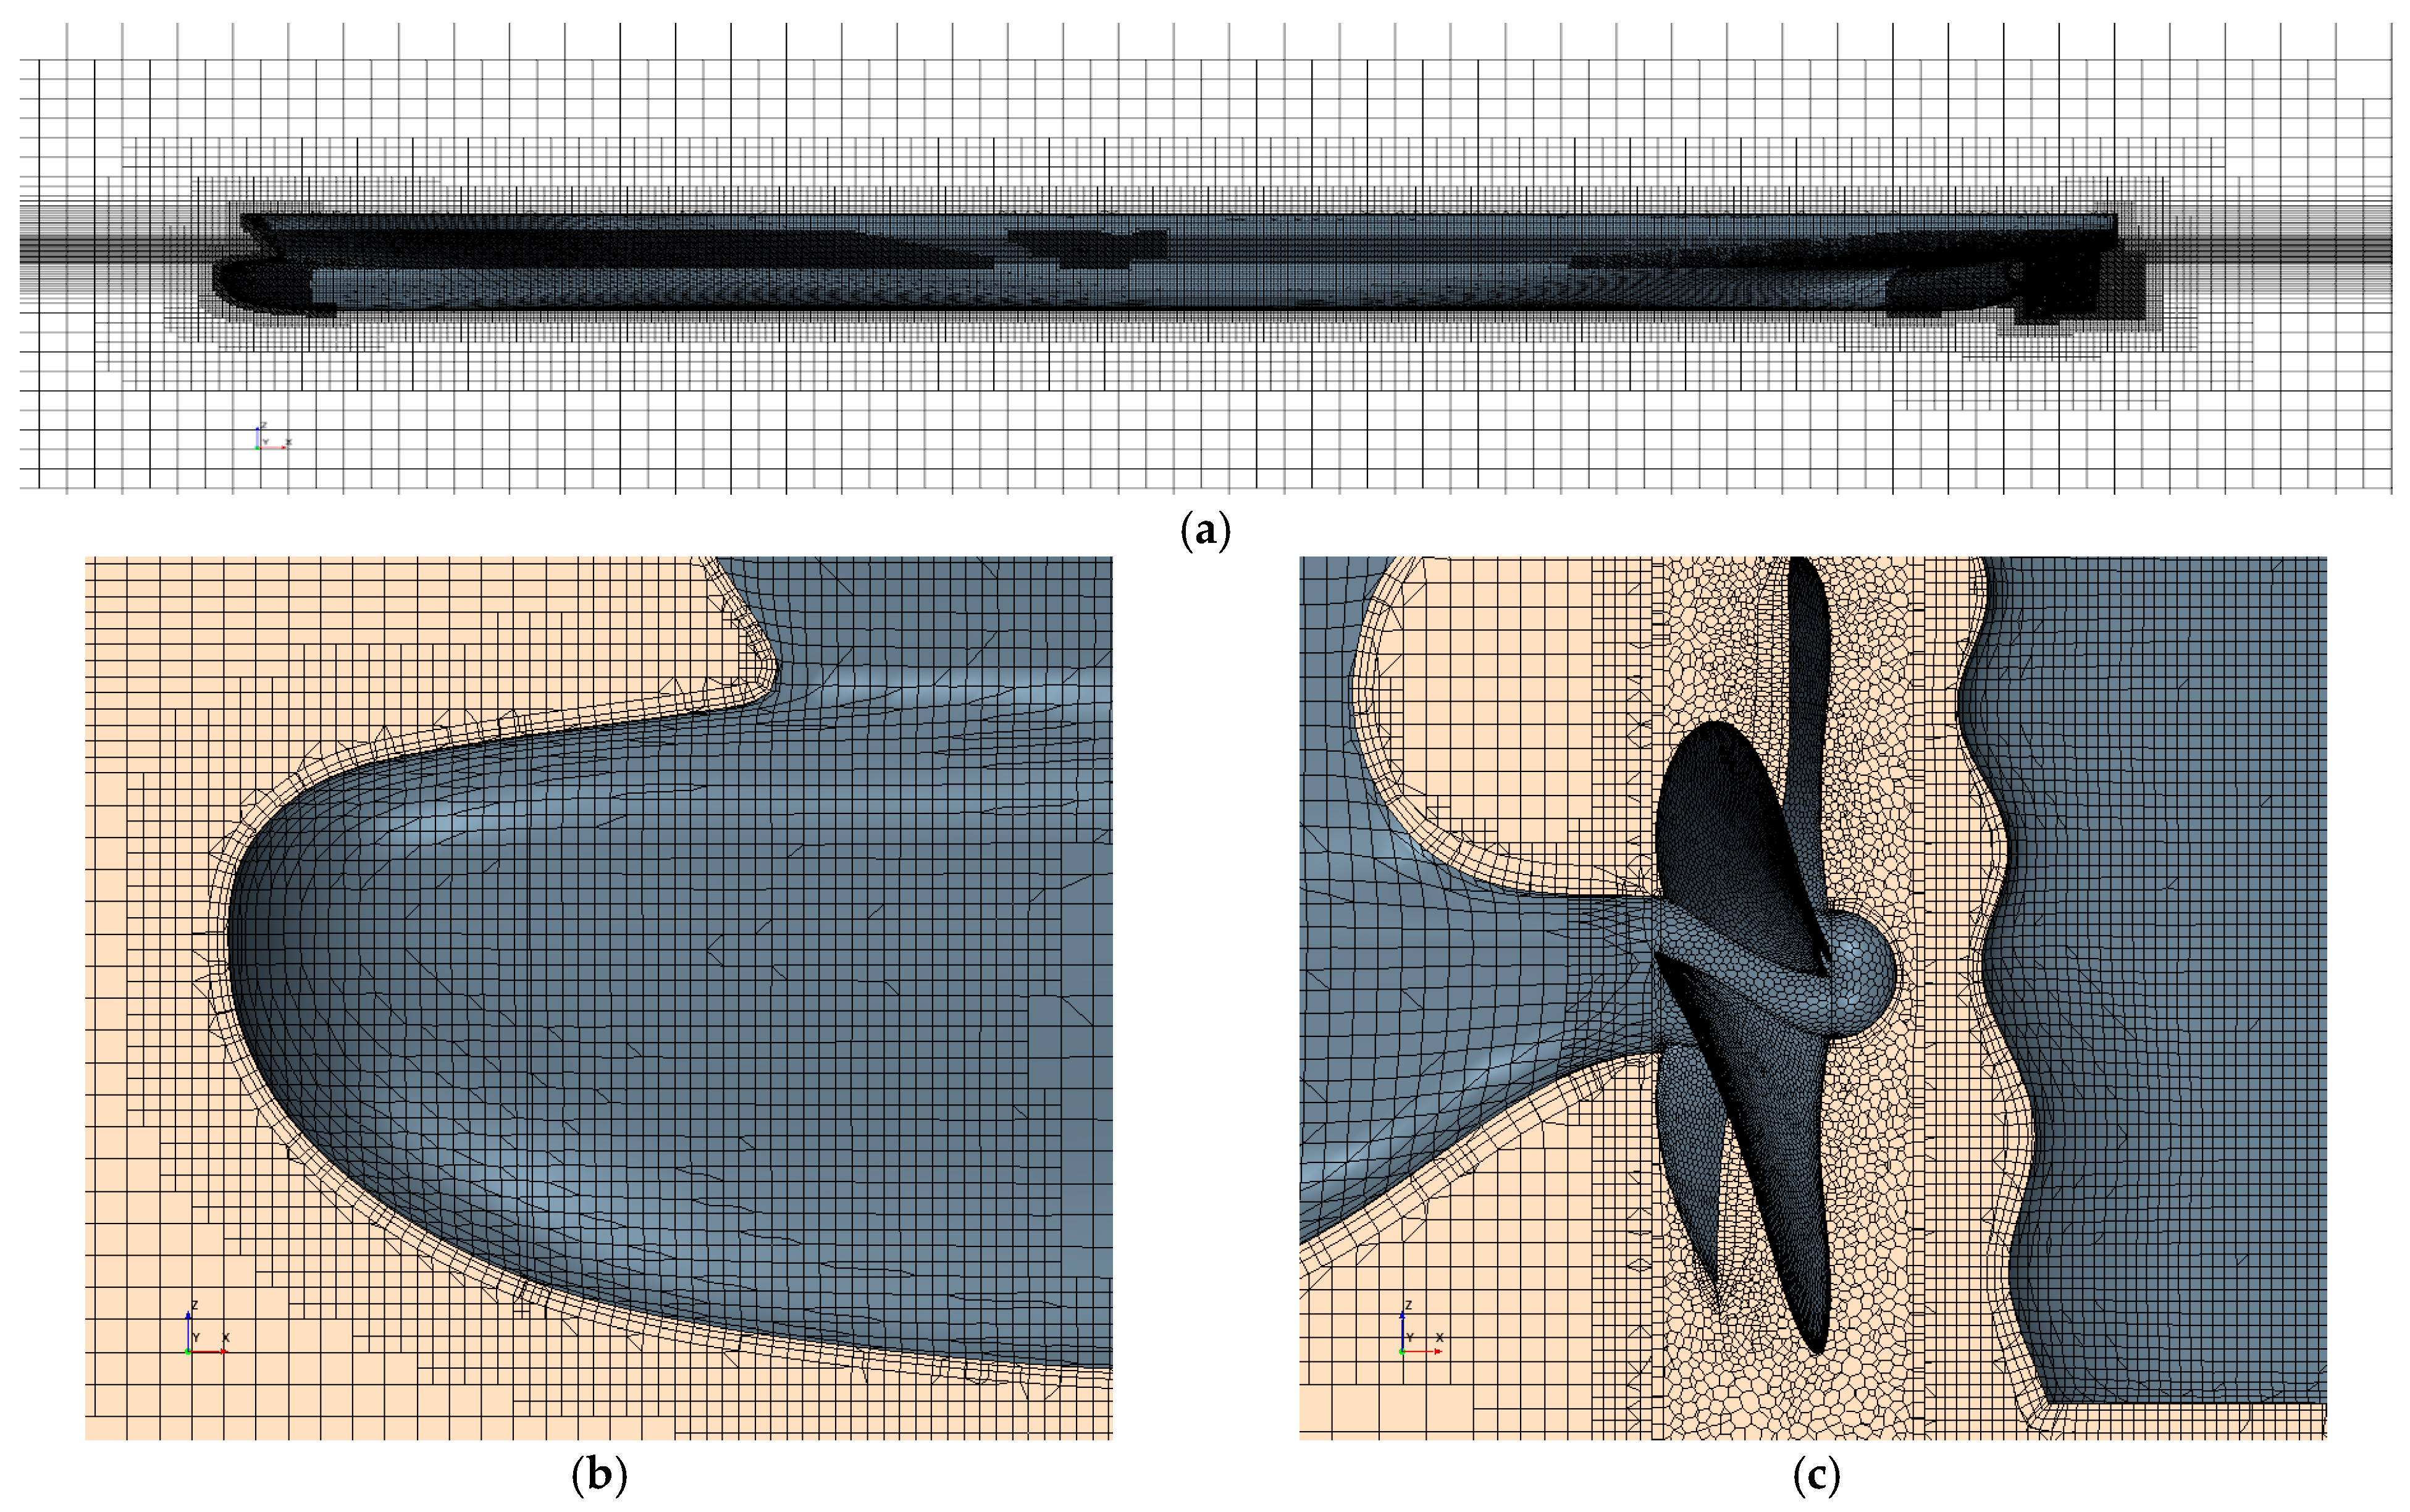
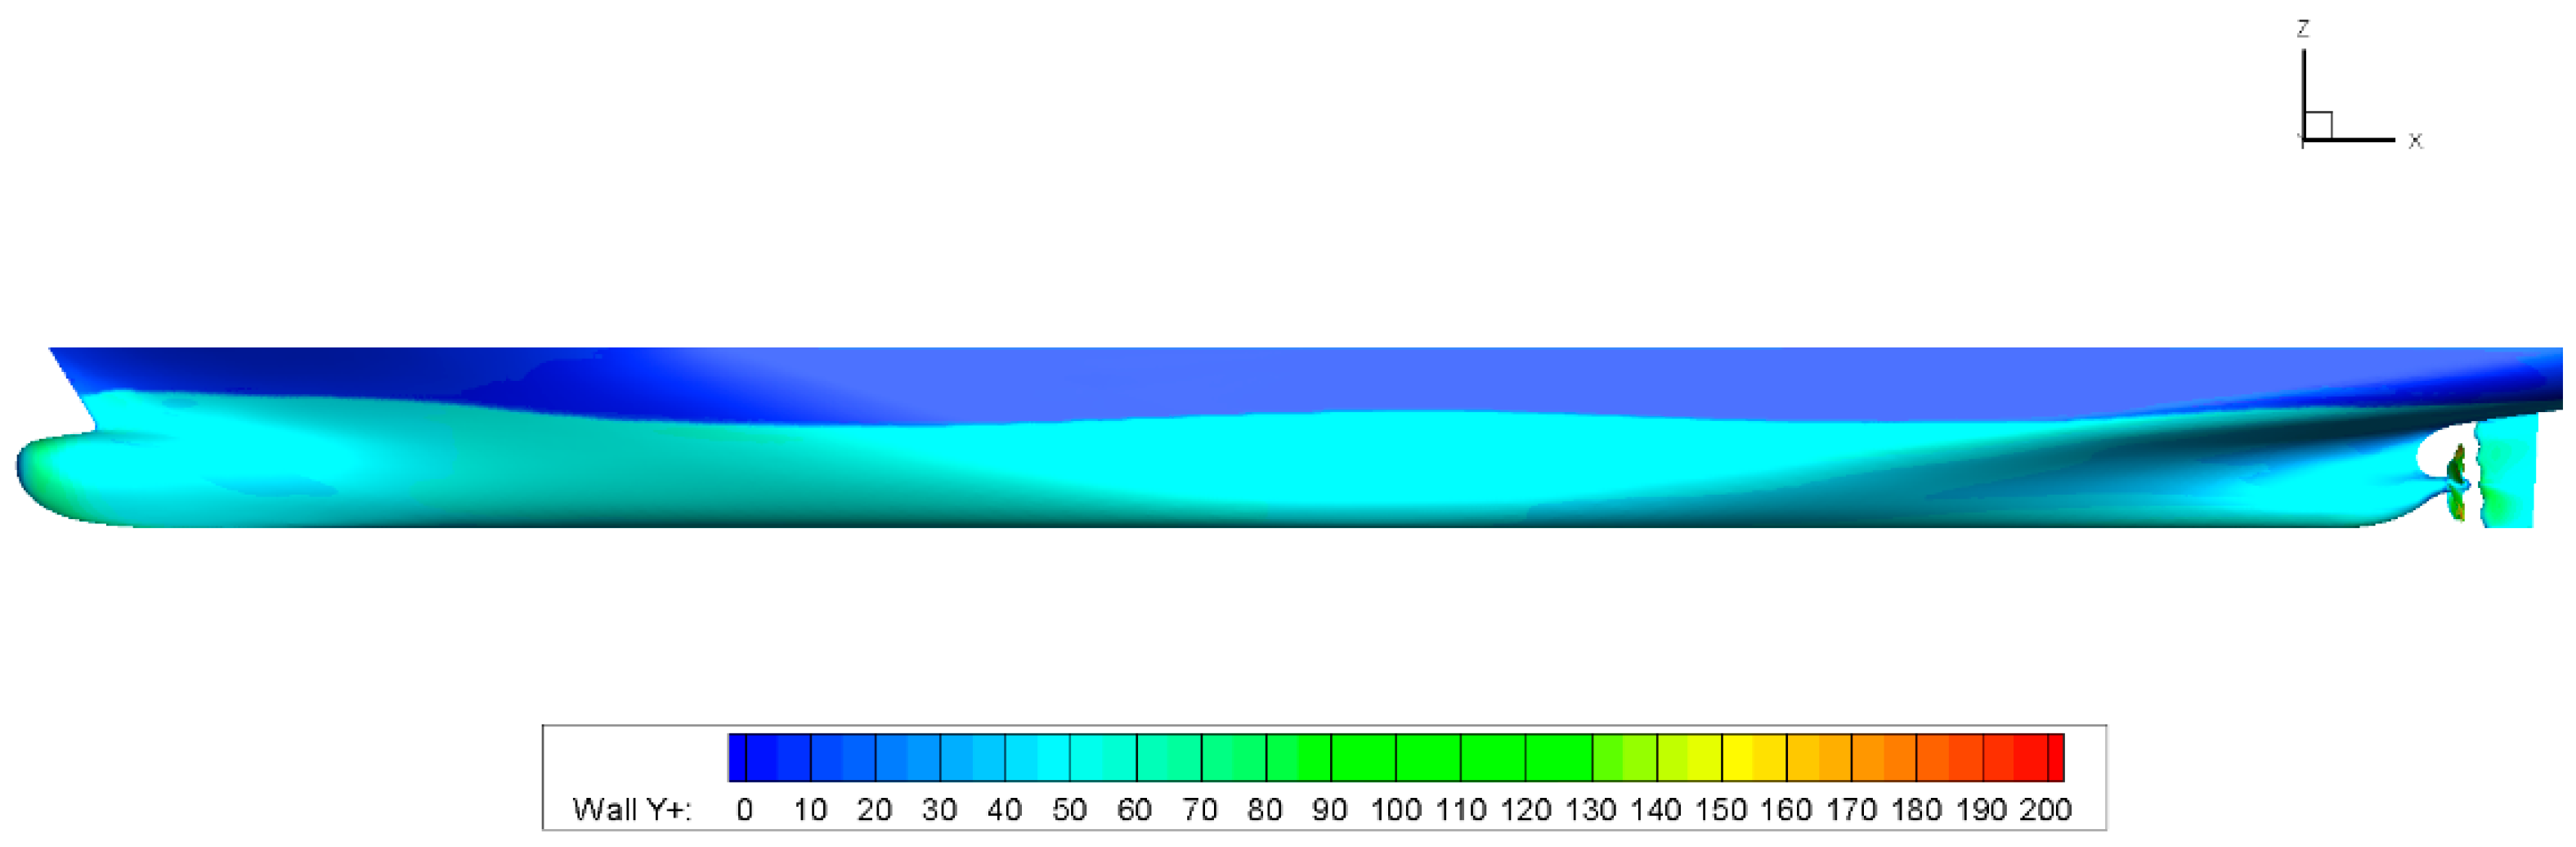
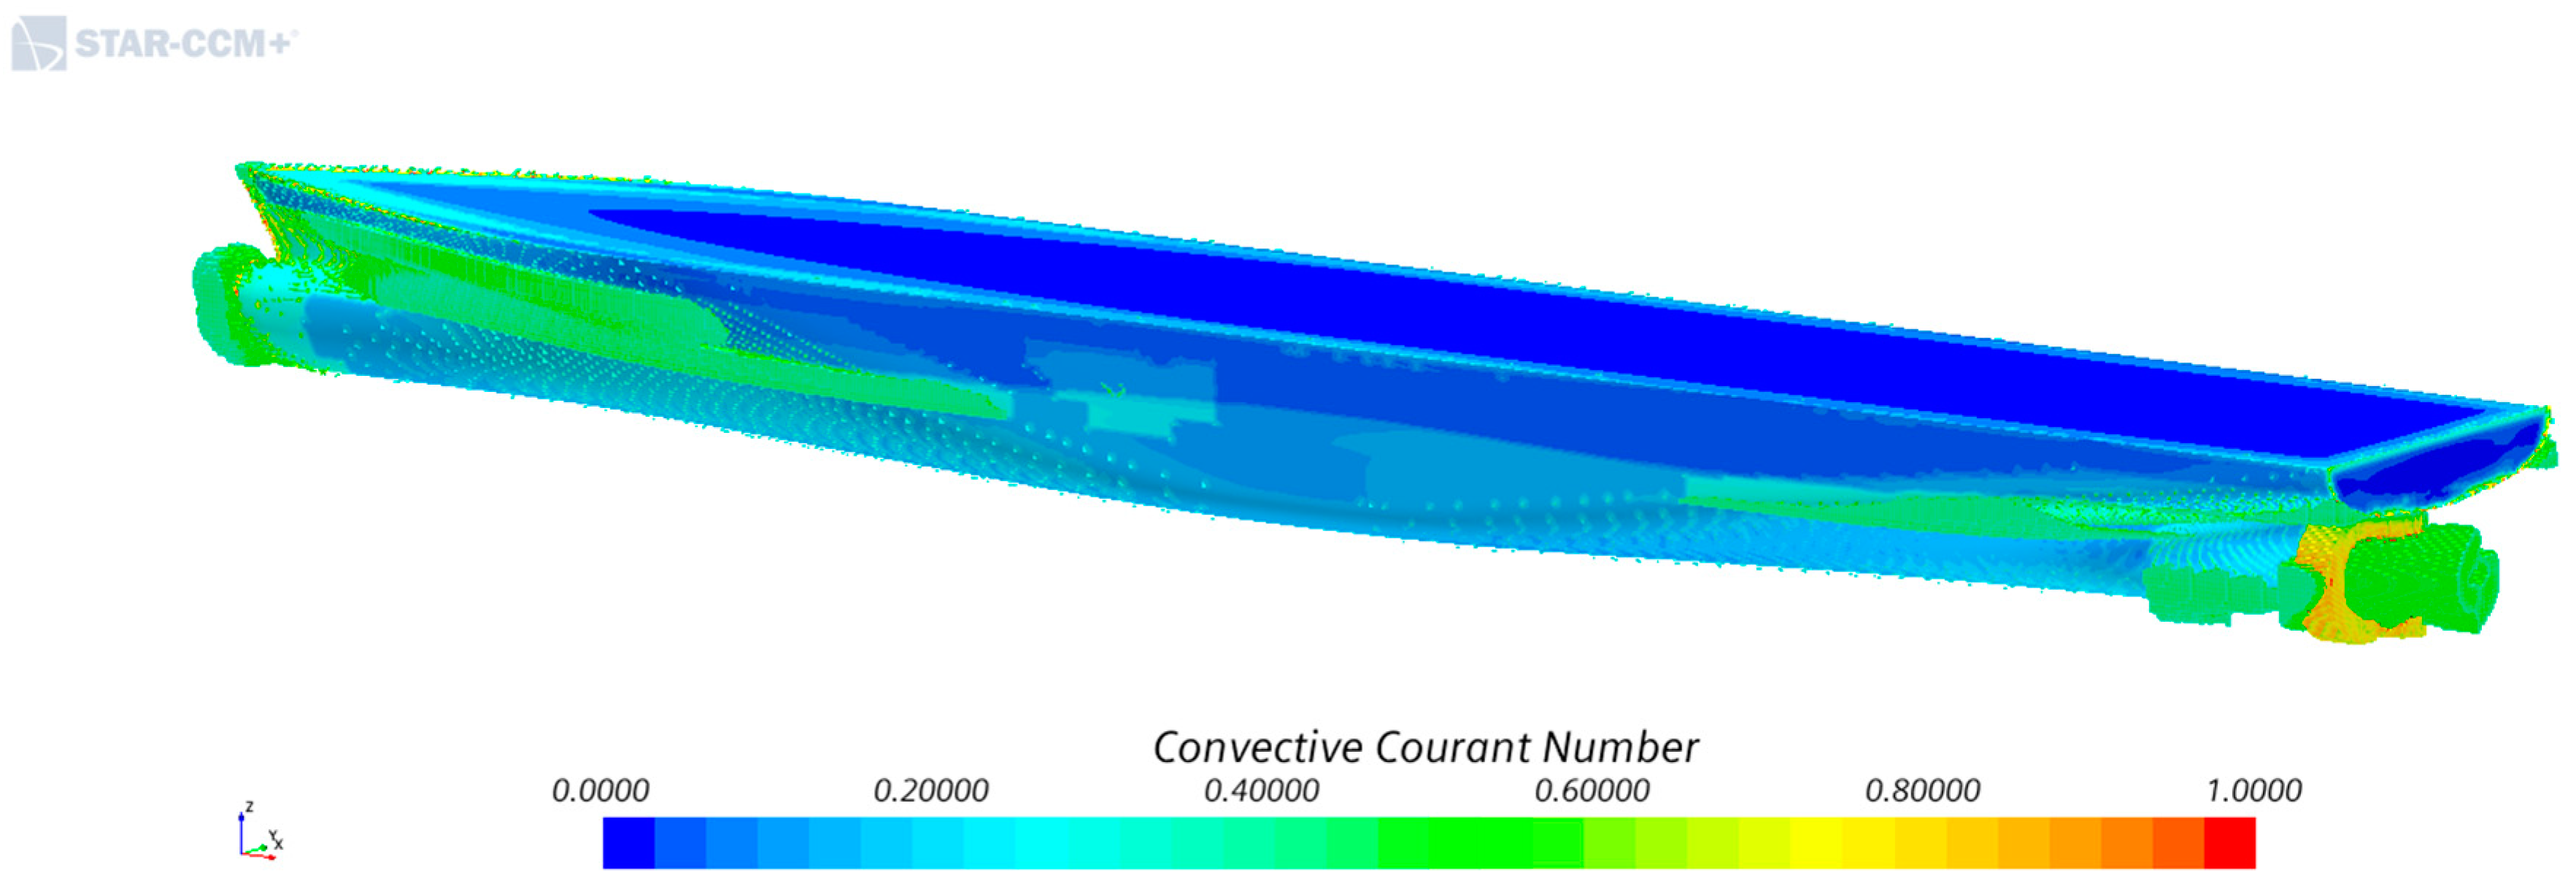
2.3.3. Boundary Conditions and Grid System

Figure 4 displays the domain, coordinate system, and boundary conditions used for the analysis. The origin of the domain is the intersection of the after-perpendicular and the waterline, and the symmetry condition is 1.5 y/LPP from the origin. The symmetry condition, which is the lateral boundary of the domain, was applied with zero-gradient extrapolation for both velocity and pressure. The dimensions (−2 ≤ x/LPP ≤ 2, −1.5 ≤ y/LPP ≤ 1.5, −2 ≤ z/LPP ≤ 1) concerning the origin were chosen in the streamwise (x), starboard (y), and upward (z) direction, respectively. Table 5 lists the boundary physics.
The numerical grid around the hull included a trimmer grid; the numerical grid around the propeller included a polyhedral grid. Figure 5 displays the grid configuration around the hull. The same grid system as in the previous study [10] was used because the reliability of the experimental results was verified [10]. Table 6 lists the detailed minimum mesh size and grid number. The first grid on the wall was composed of y+ = 60; Figure 6 displays the y+ value of the hull surface.
To ensure simulation stability, at the free surface the value of CFL must be limited to 1, and superior results with a sharp resolution of the two phases are obtained with a CFL around 0.5. In the present study, the courant number level range is reasonable, as shown in Figure 7.
However, such a limitation is overly restrictive, as other physics calculations with implicit solvers can run at a much higher CFL number. This reduces the computational efficiency of VOF free surface simulations [24]. In implicit unsteady simulations, the time step is determined by the flow properties, rather than the courant number. In this study, the implicit unsteady condition and a very small time step were used.

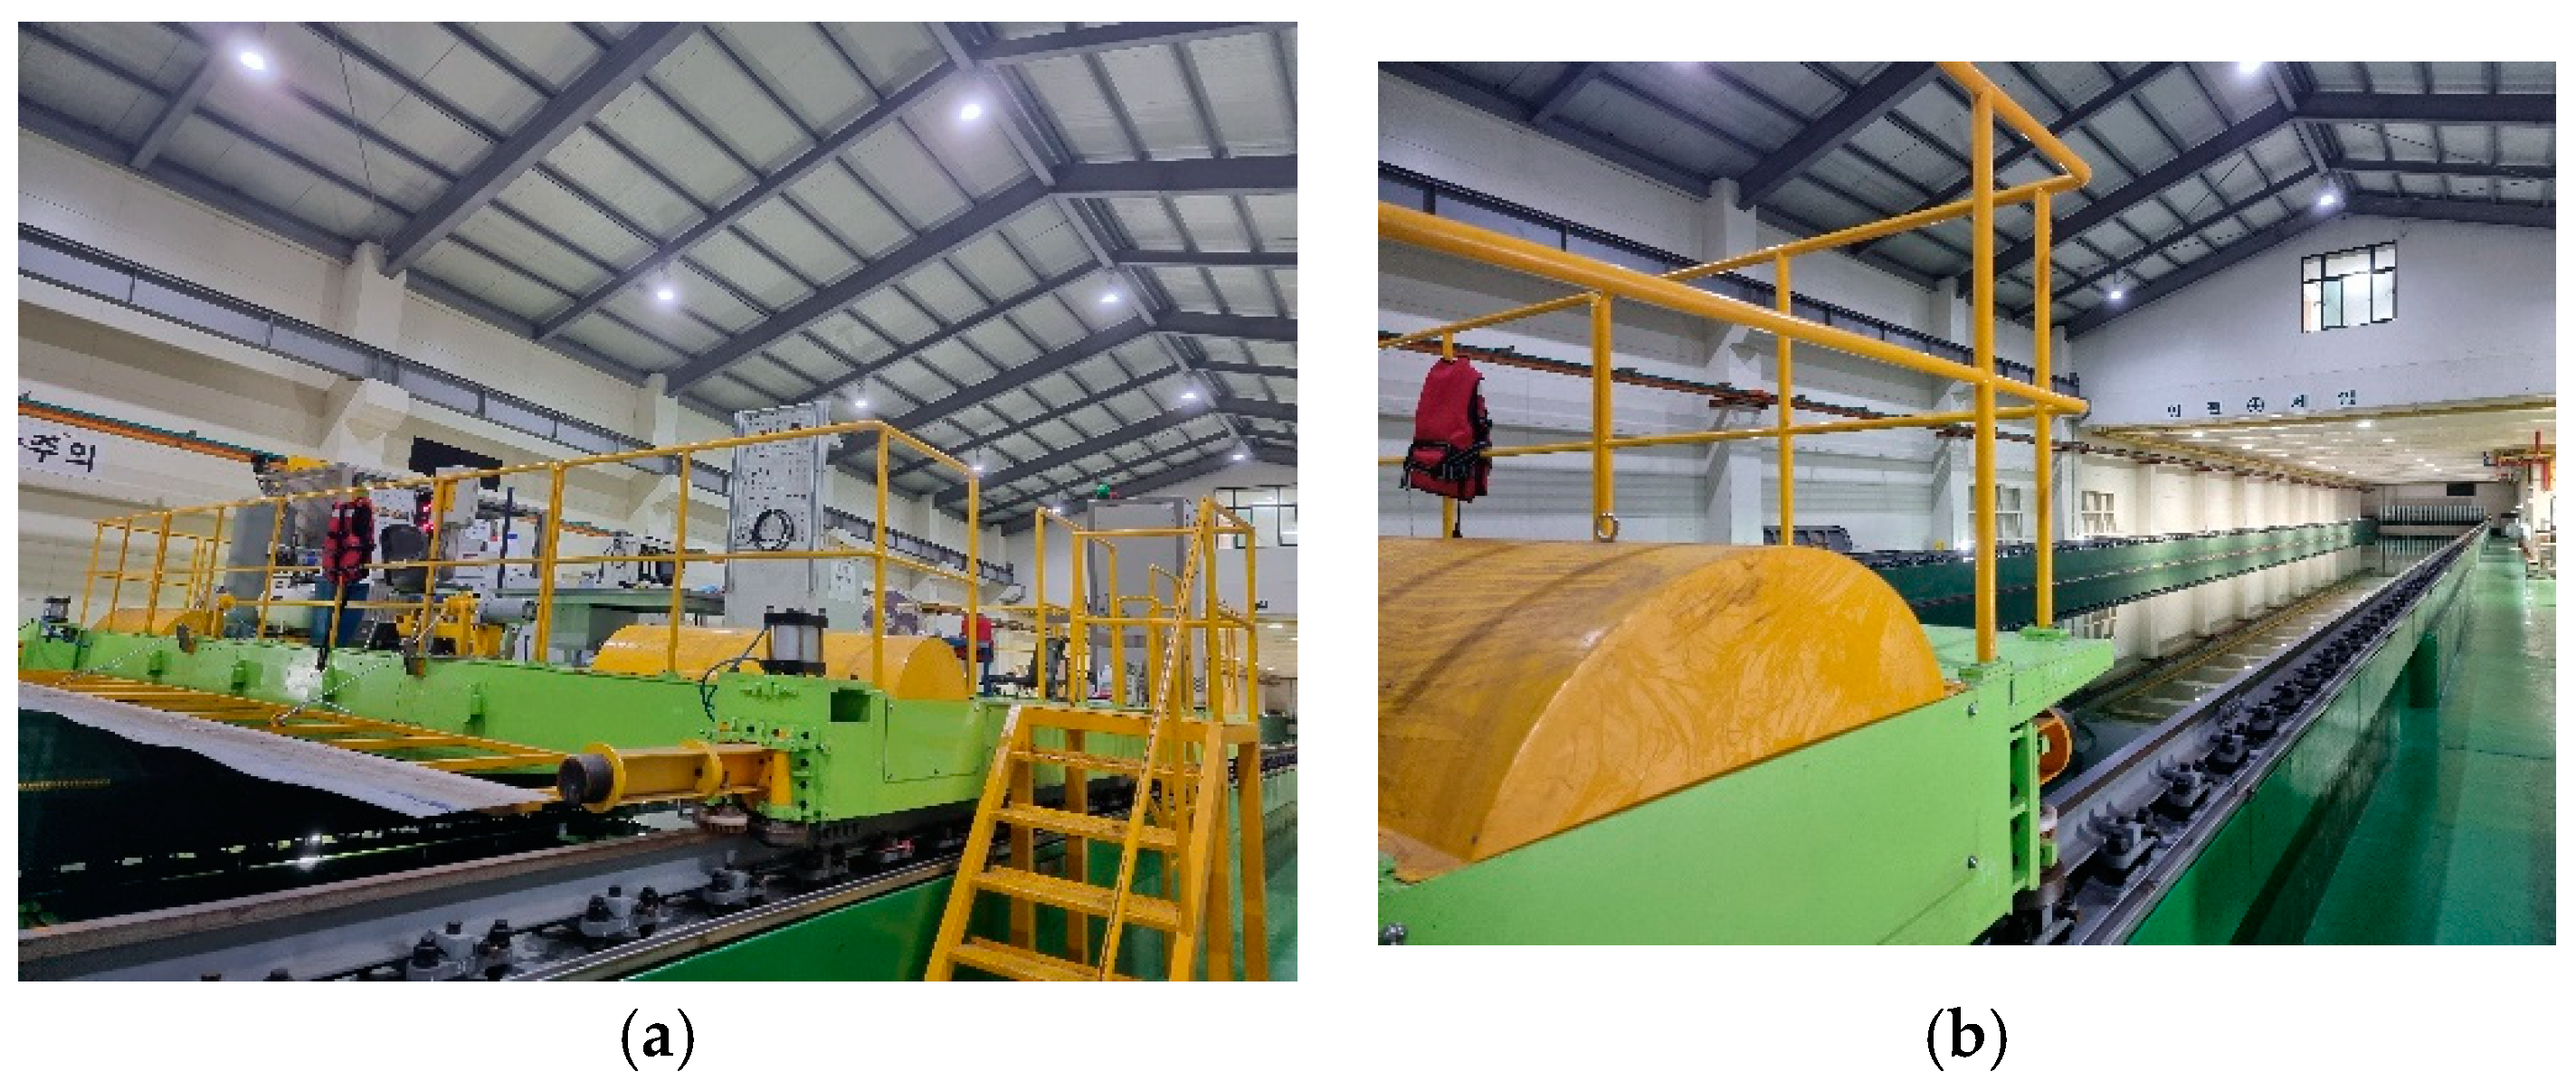
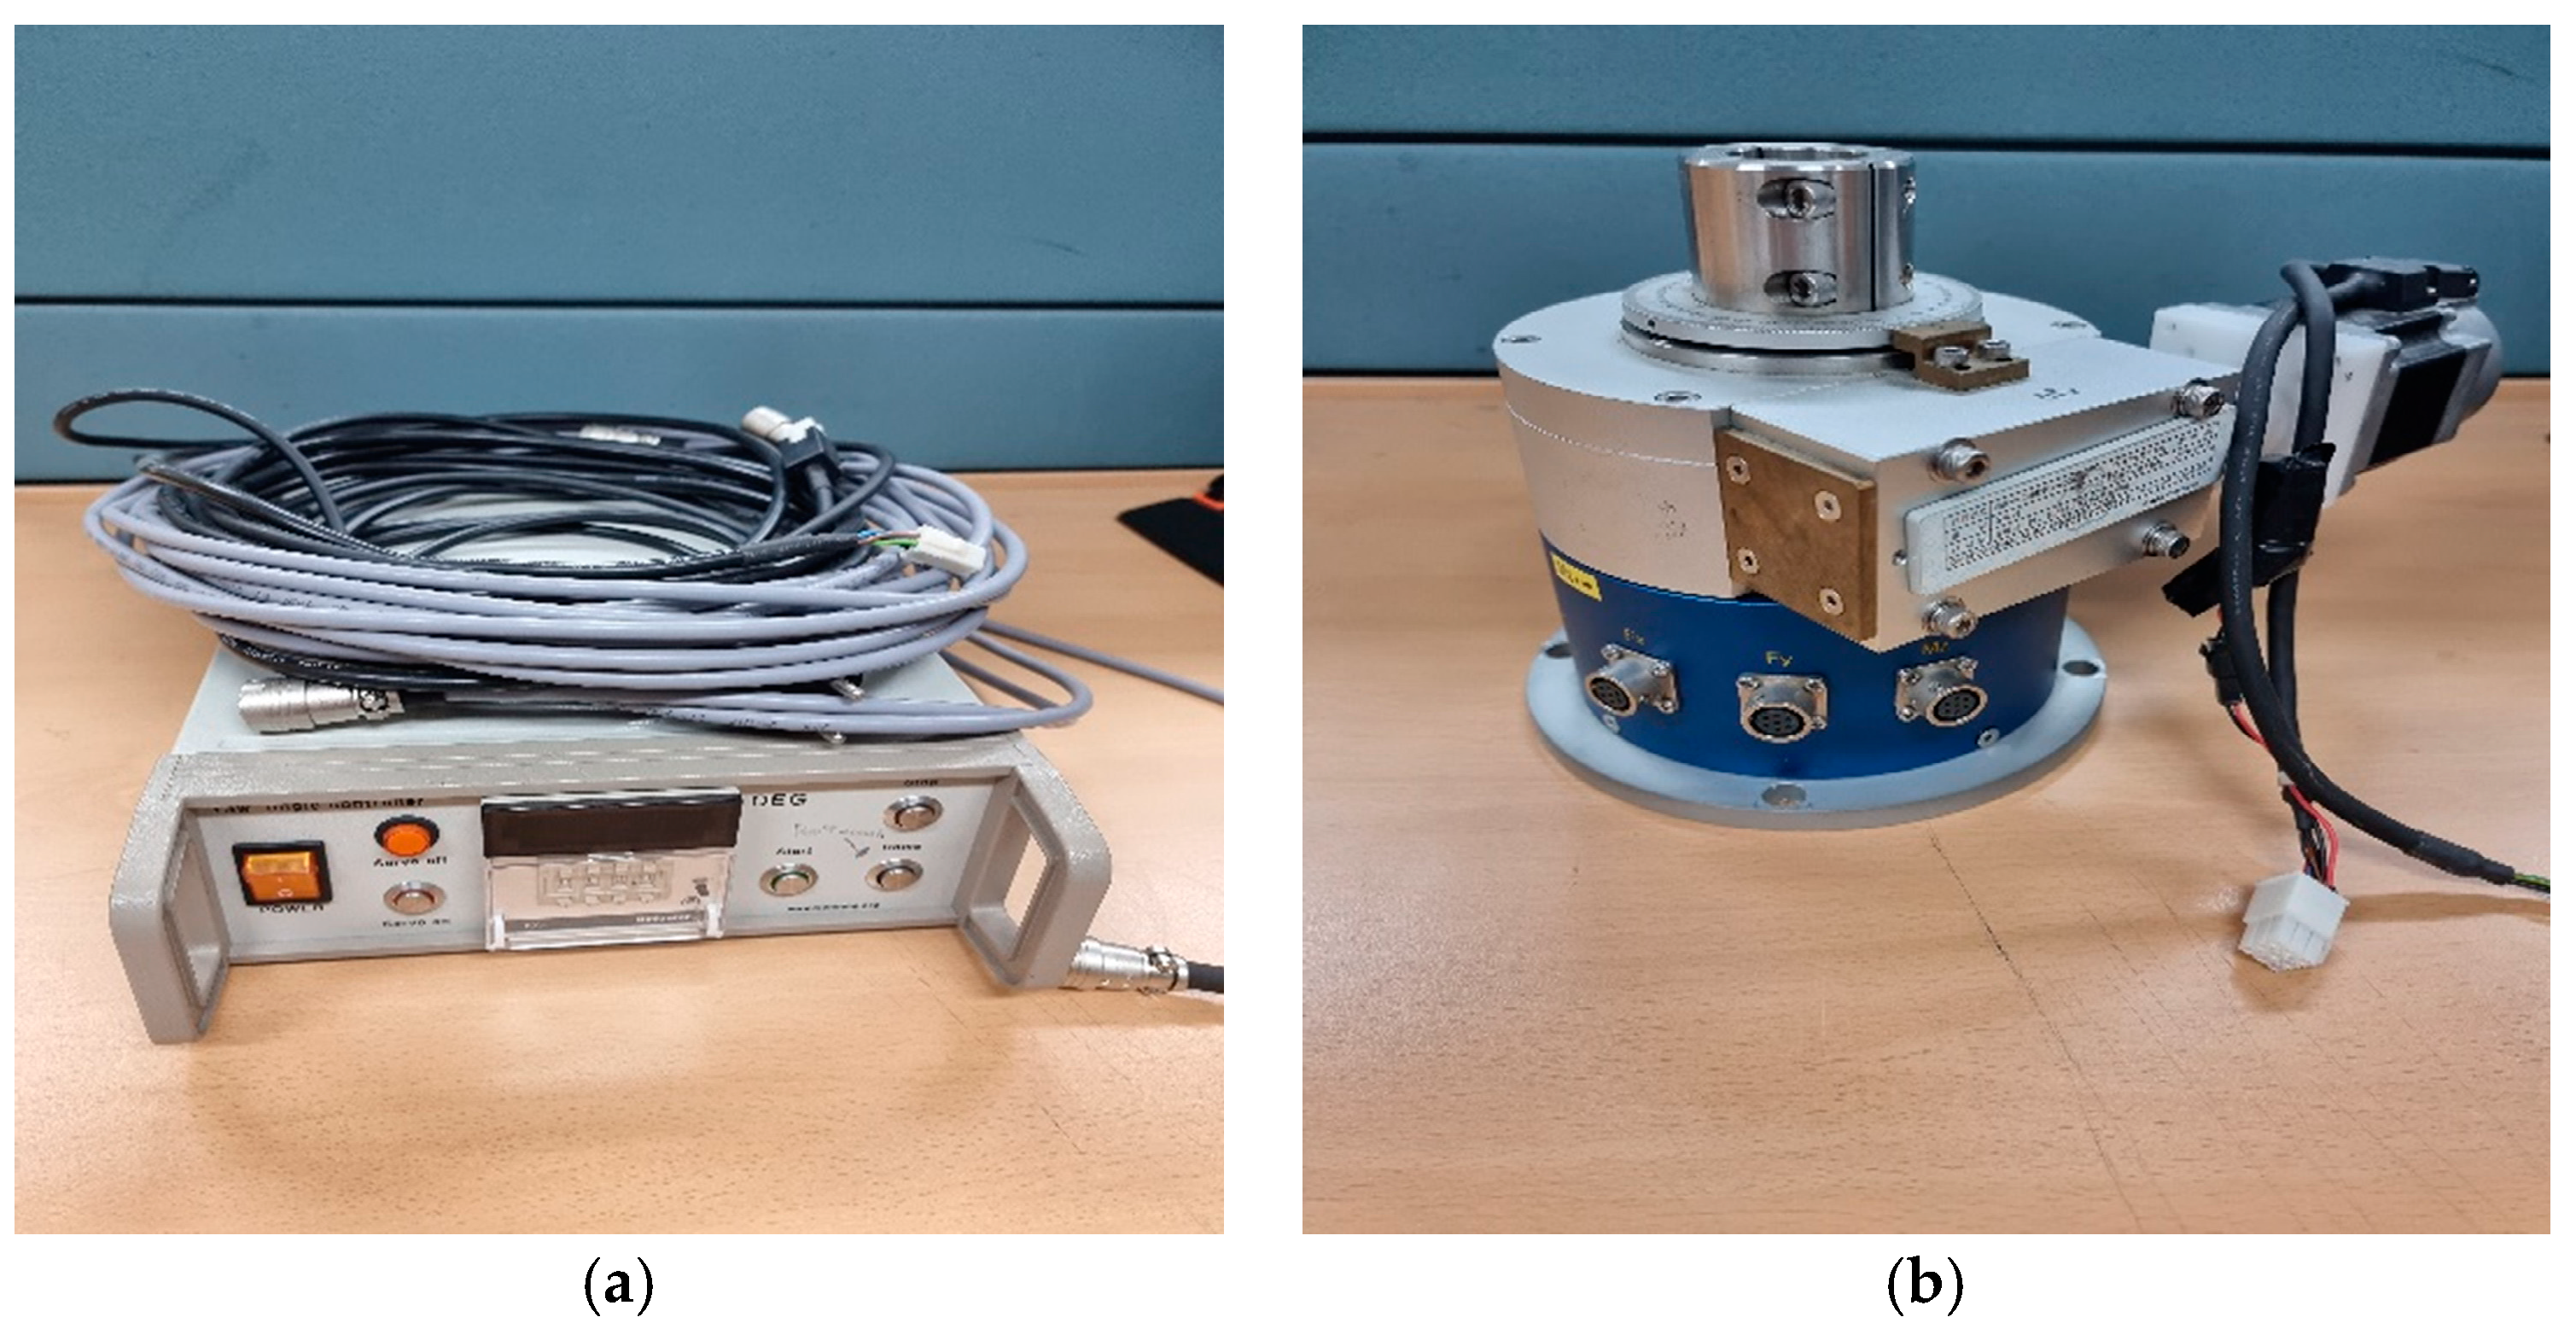
2.4. Experimental Setup

Model tests were conducted in the Pusan National University towing tank, which was 100 m long, 8 m wide, and 3.5 m in depth. The maximum carriage speed of the towing tank was 5 m/s. Figure 8 shows the towing carriage and tank. Figure 9 shows the manufactured WTR and AWTR models.
As in the numerical analysis, the test speeds in the resistance and self-propulsion tests were 23, 24, and 25 knots, whereas the rudder force test was conducted only at the design speed (24 knots). Table 7 summarizes the cases and conditions of the model tests.
Rudder forces were measured by rotating the rudder angle in the portside and starboard directions every 5° from 5° to 40°. The angular rotation was precisely controlled using an angle controller, and the lift, drag, and torque of the rudders were measured with a rudder force measurement instrument, as indicated in Figure 10.

3. Results and Discussion

3.1. Resistance Results

The ITTC 1957 (2-D) performance prediction method was used to evaluate the resistance tests. Comparisons of the model test and the numerical analysis of the resistance performance of the WTR and AWTR are presented in Table 8. No significant difference was noted in the resistance performance between the two rudders, and the numerical and experimental results differed quantitatively by less than 1%.

3.2. Self-Propulsion Results

In the self-propulsion test, the performance of the rudders was assessed by comparing the speed of revolutions n M , torque Q M , and delivery power of each model at model scale 2 π n M Q M . A comparison of the model test and the numerical analysis of the self-propulsion performance of the WTR and AWTR is presented in Table 9.
Although no significant difference in efficiency between the WTR and AWTR existed, a marginal efficiency gain of 0.3% with the AWTR was indicated in comparison with WTR at the design speed from the point of view of delivery power, resulting from the decrease in the speed of revolution. The phenomena of the previous gain flow field were analyzed using CFD at the 1.017 LPP location (immediately behind the propeller) of each rudder, as indicated in Figure 11.
It can be said that the AWTR demonstrated an improved flow field, especially around the hub where the tangential velocity was recovered more strongly than in the case of the WTR, as indicated in Figure 11.

3.3. Rudder Force Results

In this section, the rudder performances of the WTR and AWTR are compared through model tests and numerical computations. The important characteristics of the stall and lift-to-drag ratio can be derived from the principal induced forces on the rudder, such as lift, drag, and torque, as displayed in Figure 12.

3.3.1. Model Test Results

A model test was conducted to evaluate components of rudder performance, such as lift, drag, and torque, based on variations in the rudder angle at a design speed of 24 knots (equivalent model speed: 1.964 m/s). To determine the stall point, a model test was conducted with a large rudder angle. The results from the conventional twisted rudder (TR) [25] are also indicated in the present comparison with the results from the WTR and AWTR. Table 10 lists the measurement range of the rudder angle.
Figure 13 displays the experimental results of the lift based on the rudder angles in the portside and starboard directions. No significant difference existed between the WTR and TR, except for the earliest stall point in the portside turn of the TR, compared to the WTR in a previous study [18]. Although the alignment quantity was not large in the AWTR, the lift of the AWTR and the stall point were greater than those of the other rudders. This discrepancy increased at large angles, which is discussed in the comparison of streamlines at the end of this section. The values of the lift and stall point differed between the starboard and portside in all cases because the portion of the wavy area from the bottom to the center and from the center to the top differed. If this is a problem in an actual scenario, the design should be improved in terms of maneuverability, which could be an area of focus for future study [10].
Figure 14 and Figure 15 display the drag and torque values, where a greater discrepancy is found between the TR and the other rudders (AWTR and WTR). The AWTR had the lowest torque and drag values. The drag and torque of the twisted rudder increased owing to the top and bottom twisted sections. In particular, there was a significant difference in the stall point in both directions. The drag is an essential parameter in resistance; that is, the energy-saving point and torque are important to the capacity of the steering system, which is closely related to the initial investment. The smooth fairing of the twisting central part of the rudder [10], shown in Figure 8, could reduce the torque and drag to less than those of the conventional twisted rudder.
Figure 16 displays the lift-to-drag ratios of the two rudders obtained from the model tests on the portside and starboard turns, respectively. The AWTR had a superior lift-to-drag ratio because of the bulb effect of the third wave peak. As shown in Figure 16, the lift-to-drag ratio of the AWTR was greater than that of both the TR and WTR, which means that the presently developed AWTR has superior performance compared to the other rudders, because the lift-to-drag ratio is equivalent to the efficiency.

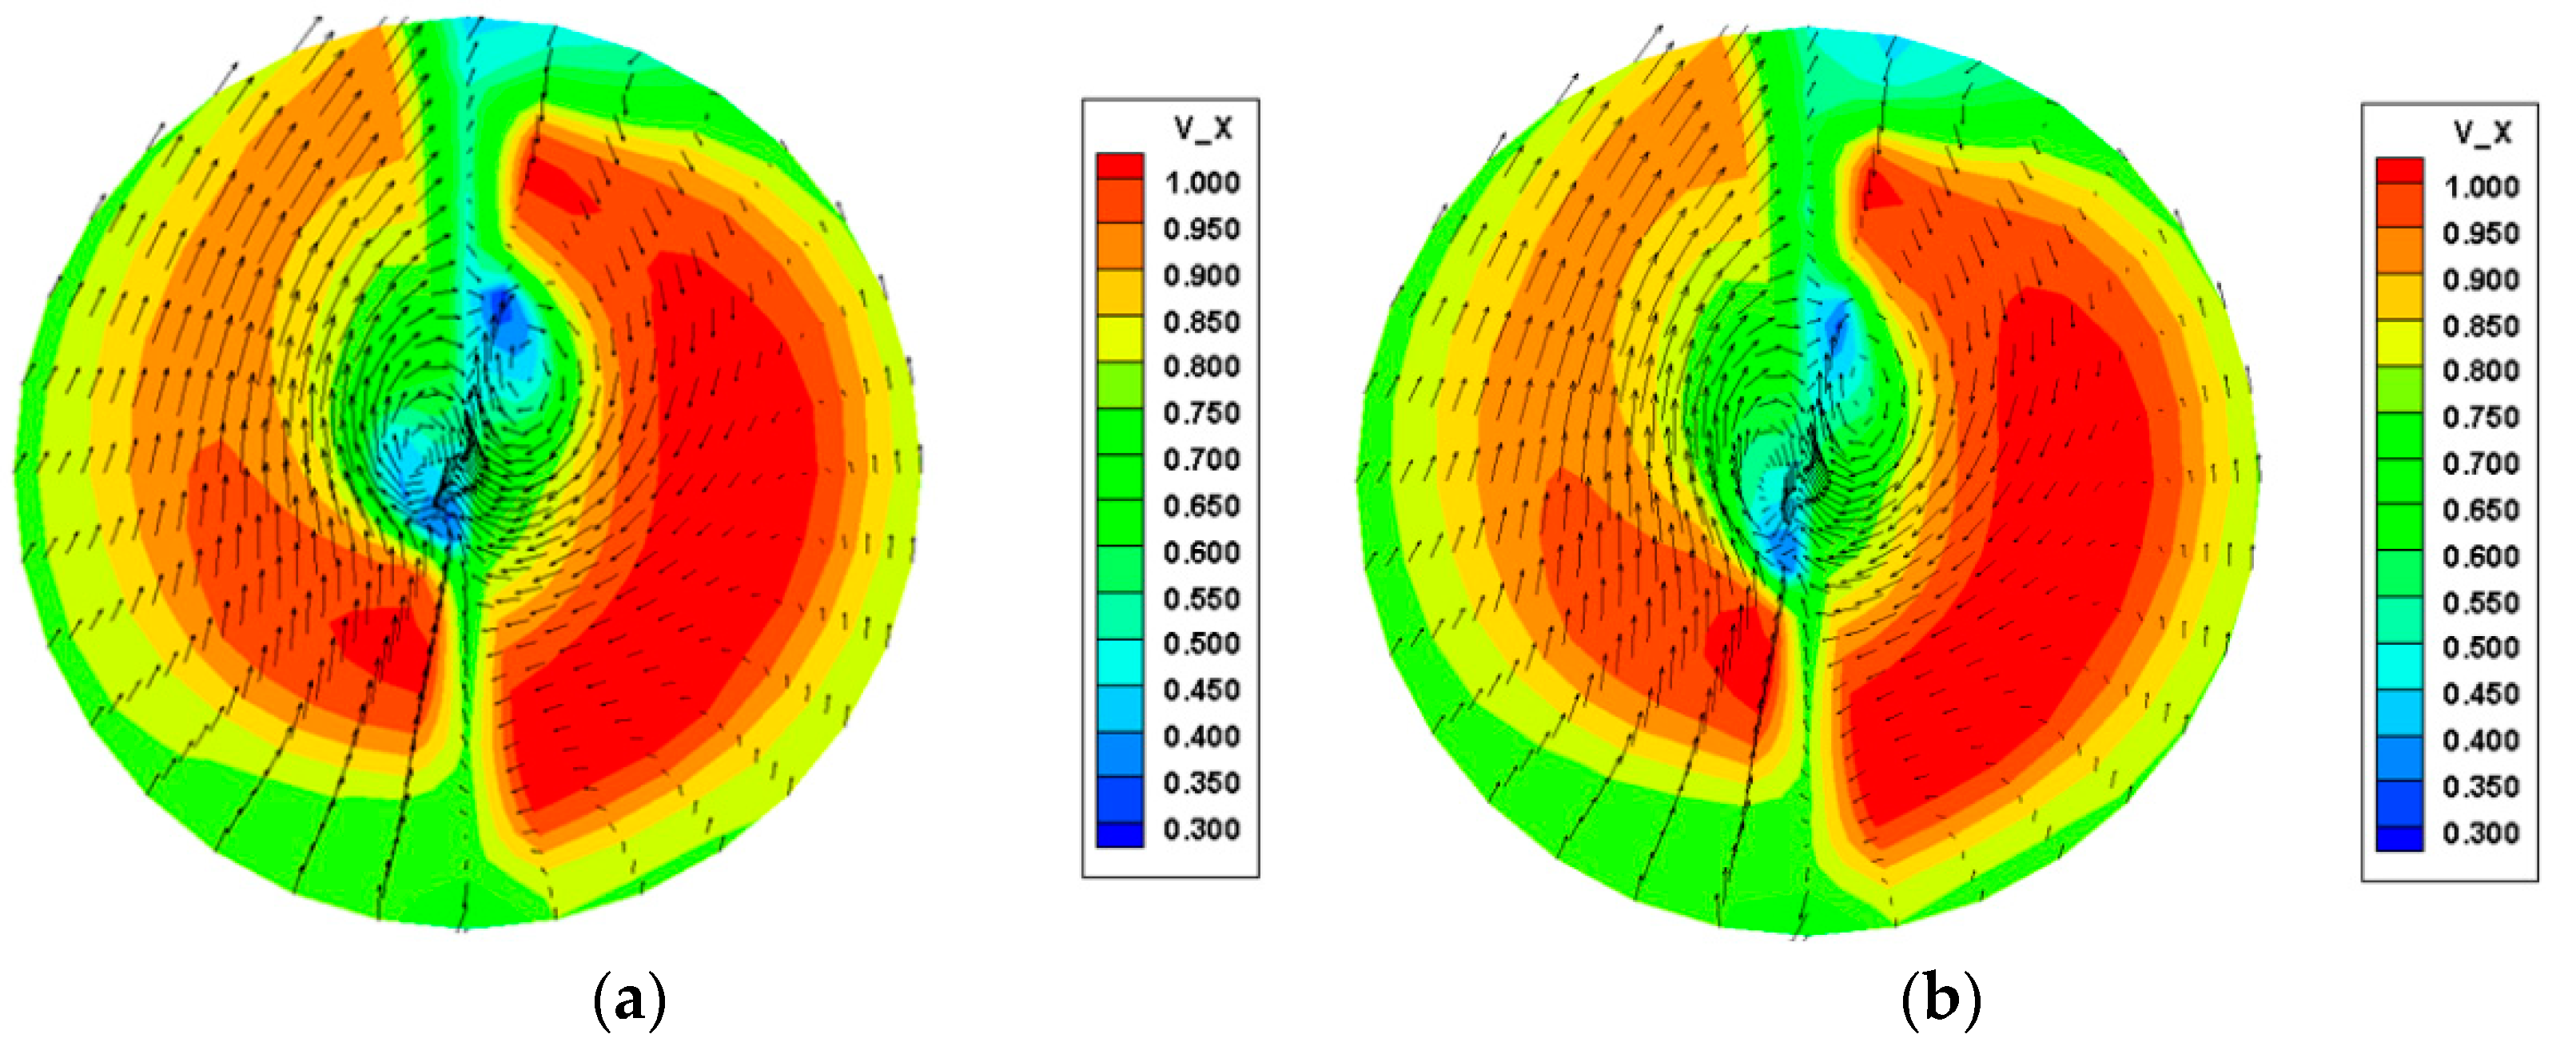
3.3.2. Comparison of Numerical and Experimental Rudder Force Results

Figure 17 displays the lift obtained from the numerical analyses and model tests. On both the portside and starboard turns, the lift distributions for the AWTR were greater than those for the WTR in both the model test and the numerical analyses.
The stall point of the AWTR was approximately 5° greater than that of the WTR in both directions, and the CFD numerical result of the stall point was approximately 5° greater than the experimental result in both directions. Although quantitative discrepancies exist between the experimental and numerical results, the results are qualitatively consistent.
Figure 18 and Figure 19 display a comparison of the drag and torque of the AWTR and WTR obtained from the numerical analyses and the model tests based on the rudder angles. At a low rudder angle, the difference in drag and torque between the WTR and AWTR was insignificant, whereas the drag and torque of the AWTR were somewhat less than those of the WTR owing to the increase in the rudder angle in both directions.
The lift-to-drag ratios of the two rudders (AWTR and WTR) are displayed in Figure 20. The results demonstrate a similar trend. There could be a difference between the model test and the CFD computation because there was a laminar region in the model, whereas the turbulent model was applied to the entire region in CFD. Although there was a difference in the quantitative value between the experiment and CFD, the comparison of performance between the WTR and AWTR was qualitatively consistent in the experiment and in the CFD.
With a wavy configuration of the rudder, a streamwise vortex was generated using the pressure and speed differences at the location of the vortex. Energy was continuously supplied such that the flow could overcome the frictional force on the surface. The numerical results demonstrate an acceptable overall agreement with the experimental results, qualitatively. In the case of a special rudder-like flap rudder, the section of the rudder is larger than that of a merchant ship, whereas the present aligned twisted rudder has virtually the same rudder section as a merchant ship, which leads to high efficiency. Another important merit is the high lift due to the delay of the stall compared with a conventional rudder, as shown in Figure 16. In addition, there are no complicated moving parts as in a flap rudder, implying easy installation, maintenance, and handling; accordingly, cavitation performance is another advantage of an aligned twisted rudder.

4. Conclusions

In the present study, an improved wavy twisted rudder was proposed based on a previous study [10]. The third wave peak of the WTR was aligned with the centerline of the propeller for the bulb effect. The performance of the AWTR was verified through model tests and numerical analyses. The conclusions are as follows:
(1)
In terms of the self-propulsion performance, the efficiency of the AWTR was superior to that of the WTR, although the gain was not large (+0.3%).
(2)
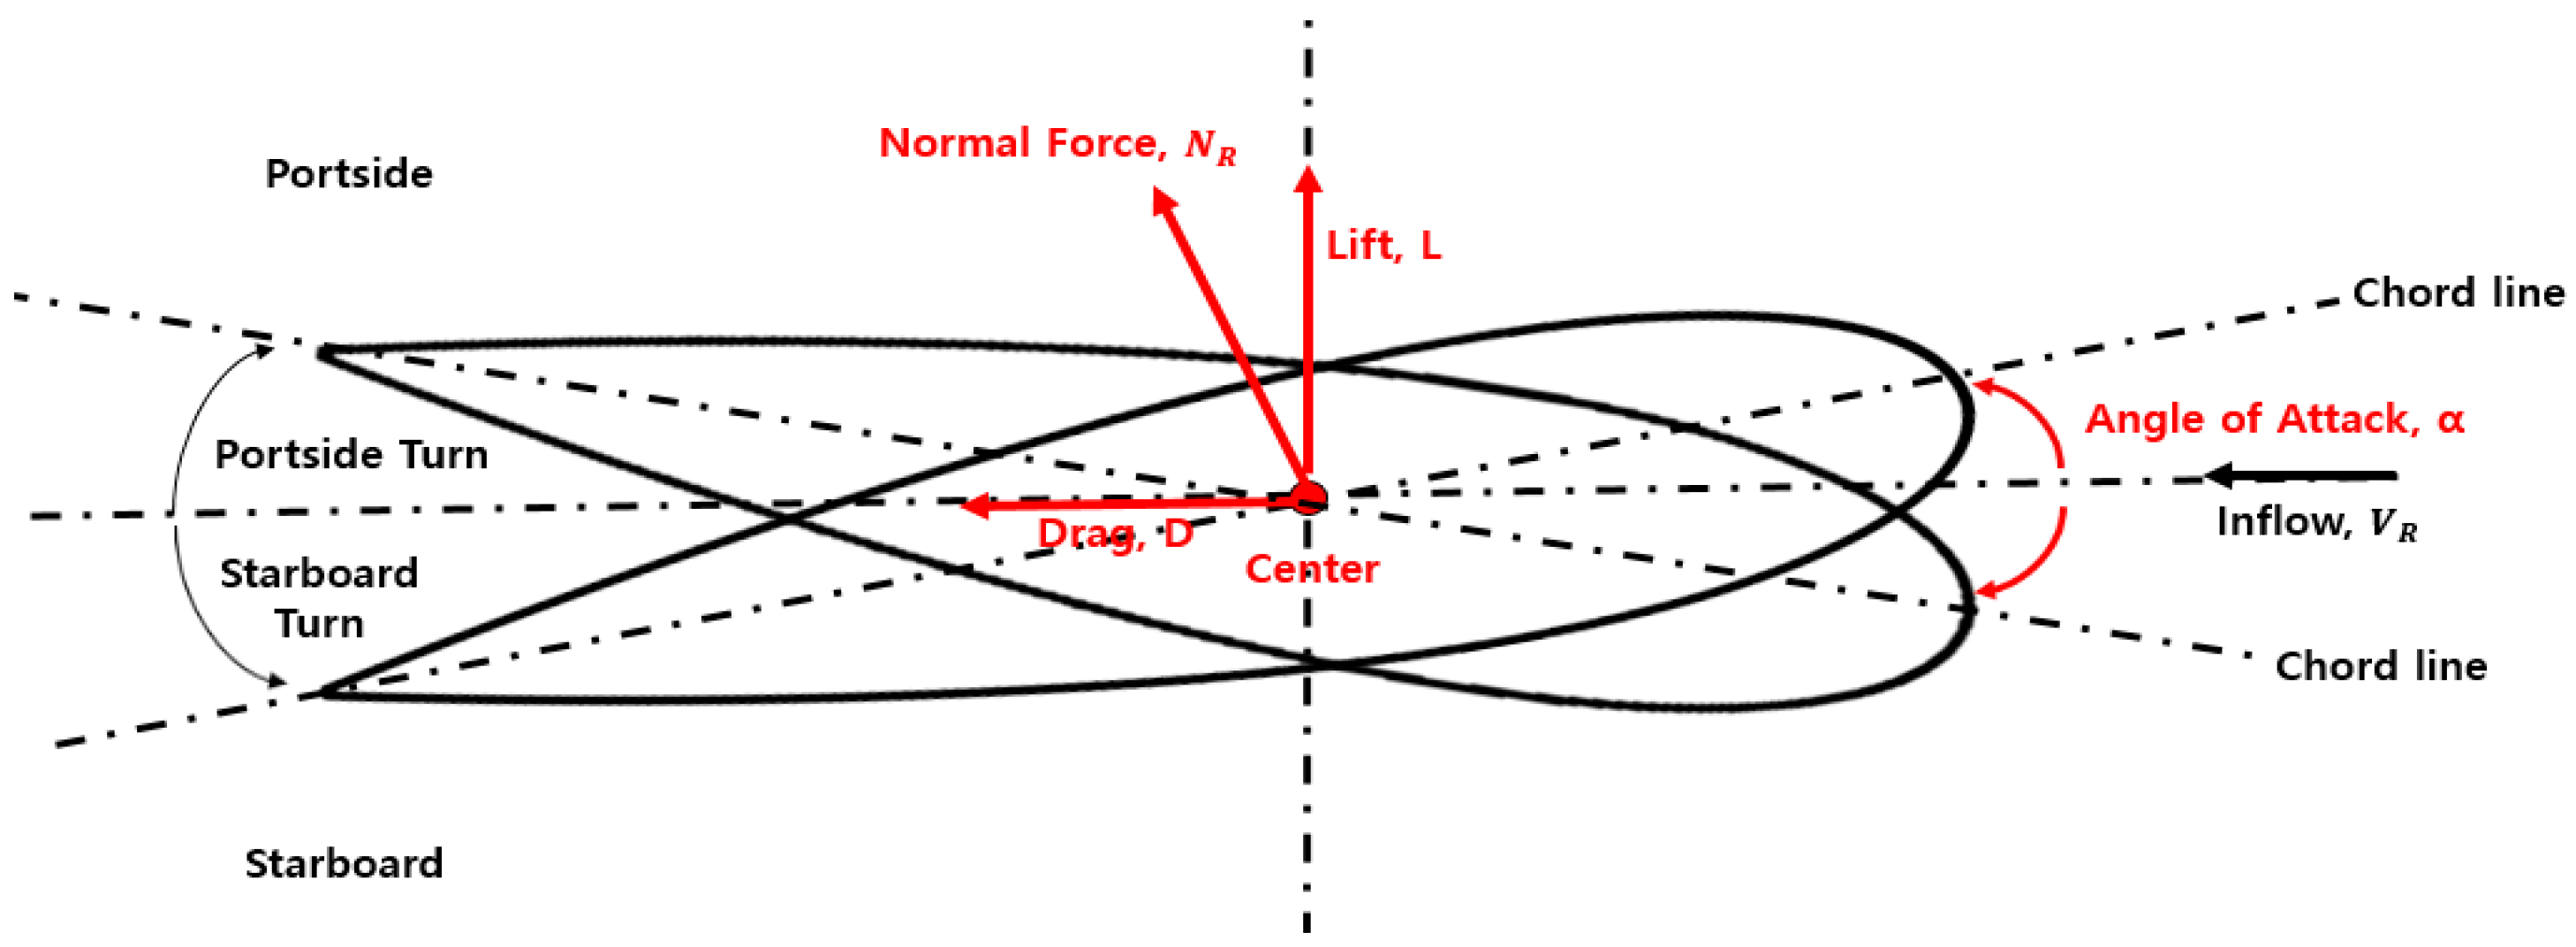
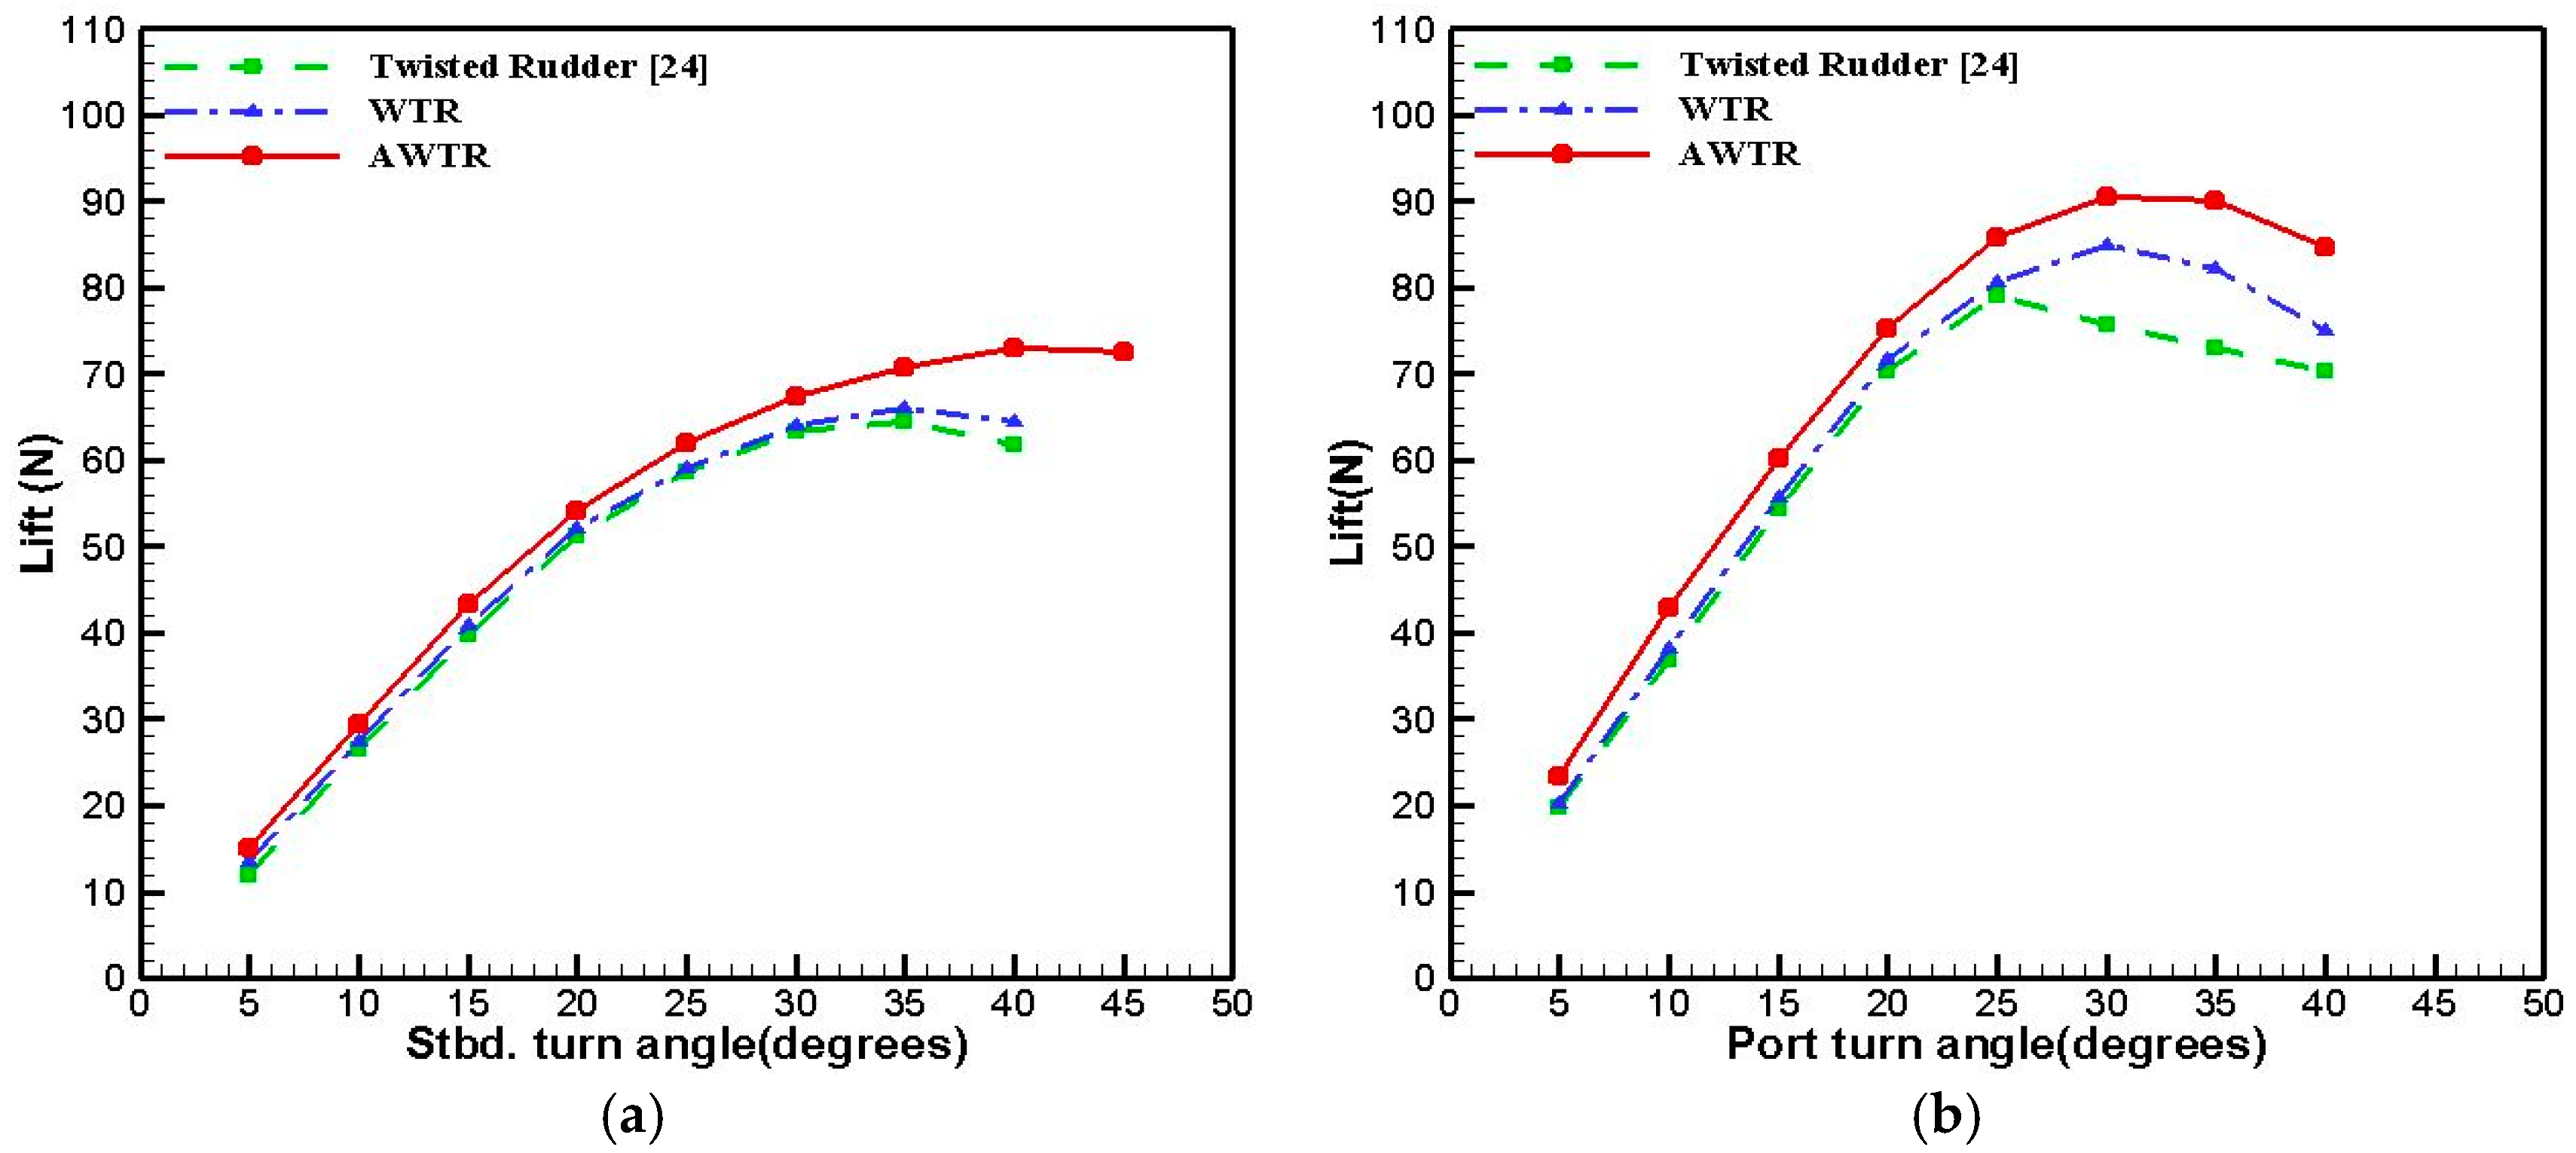
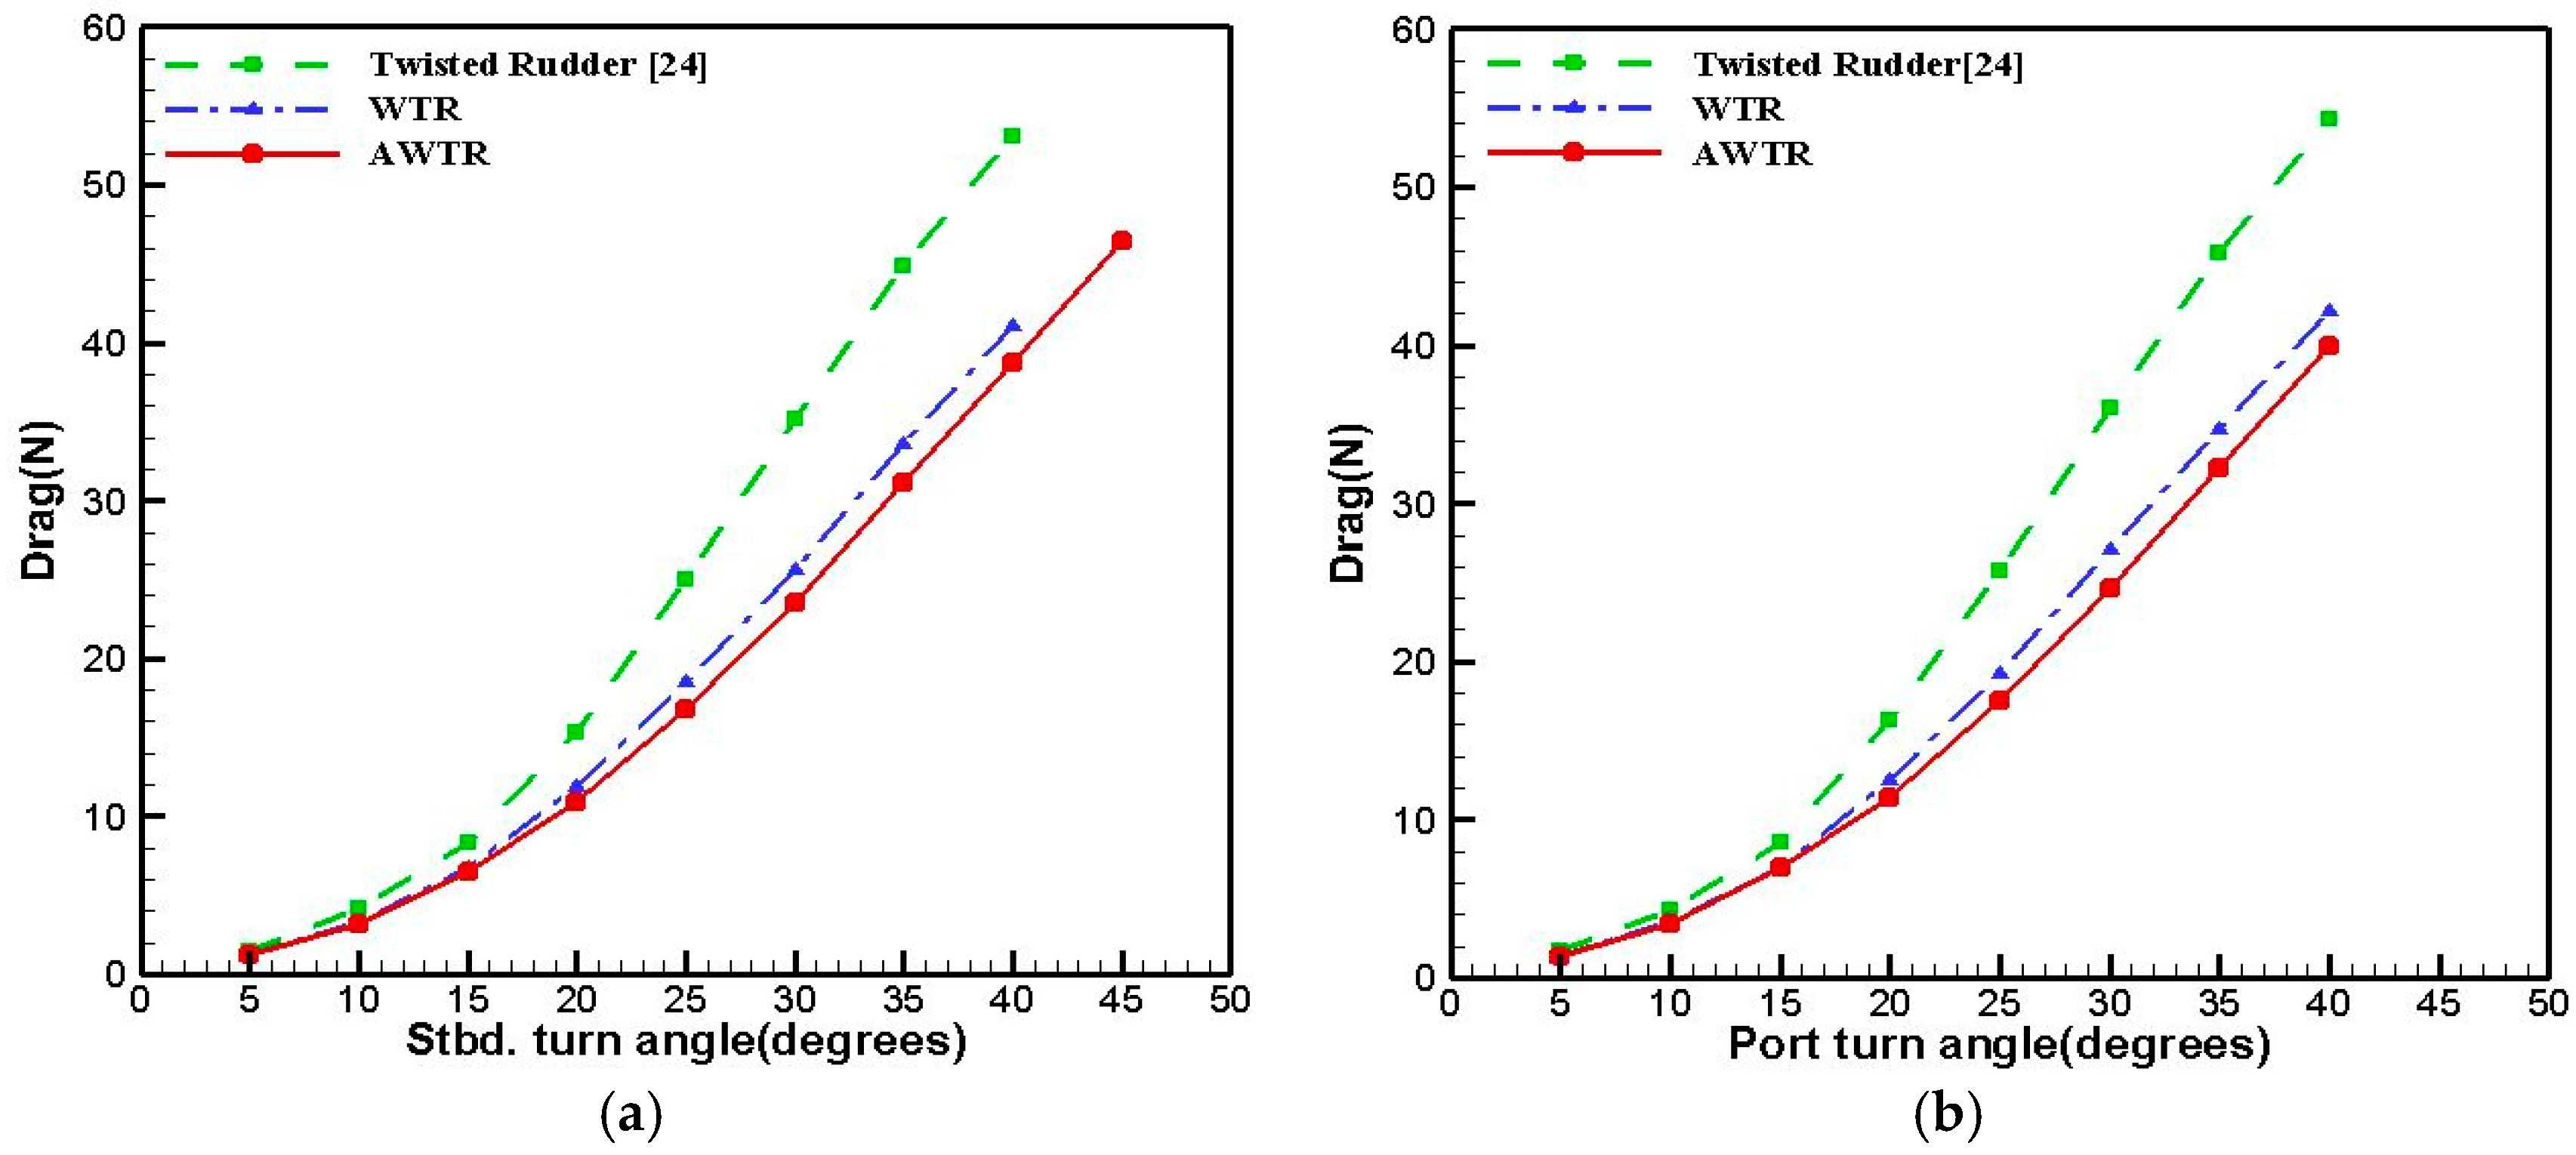
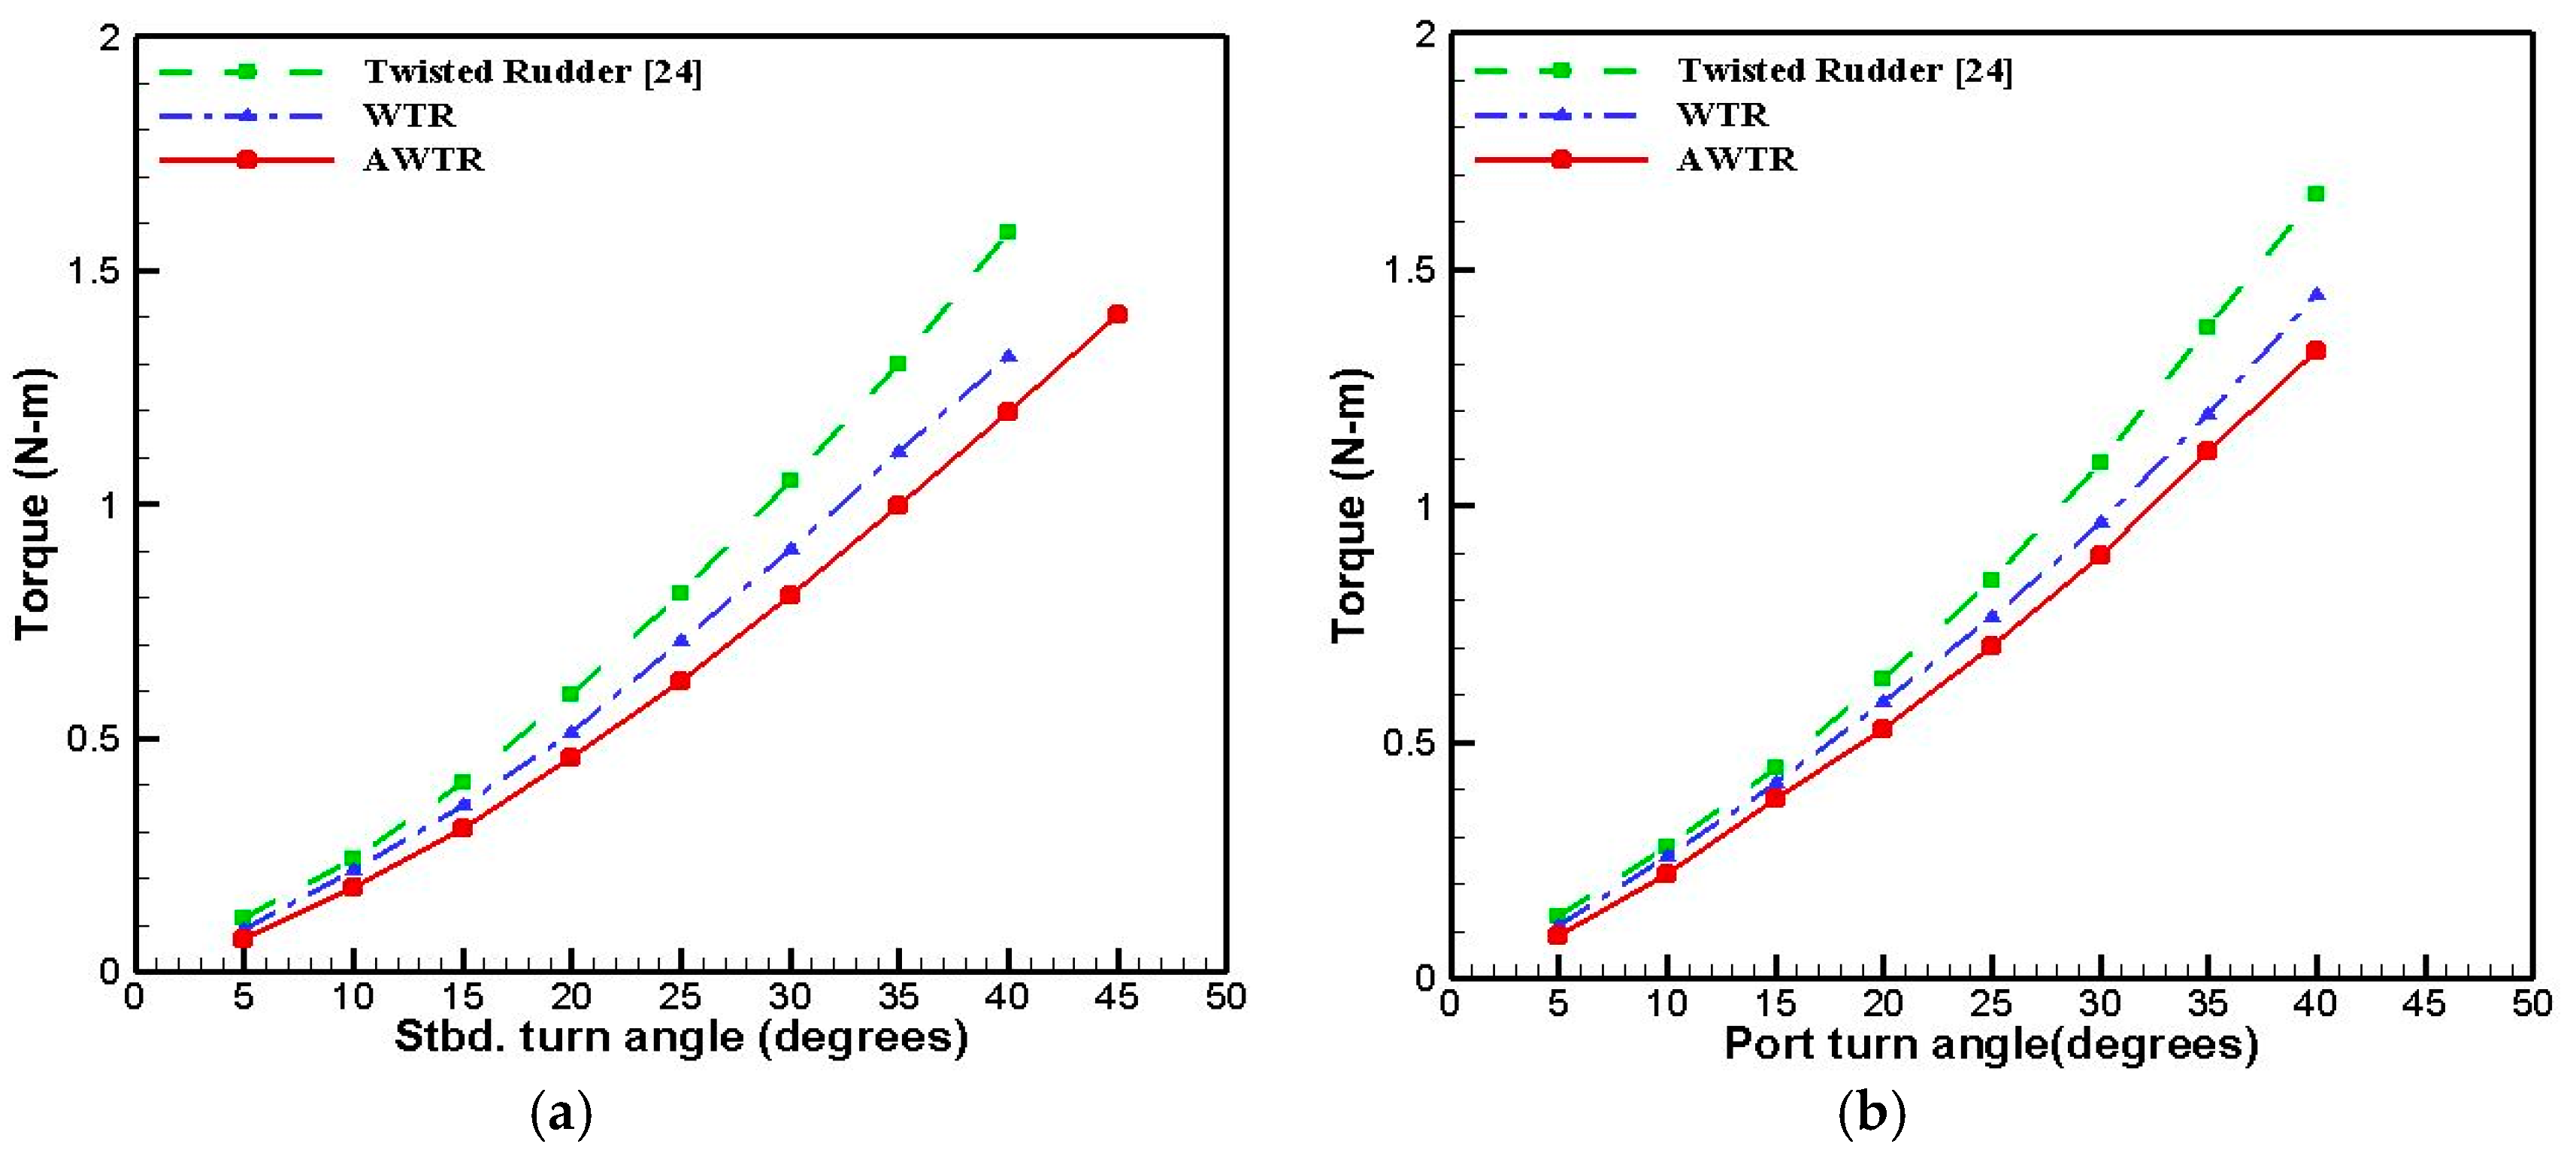
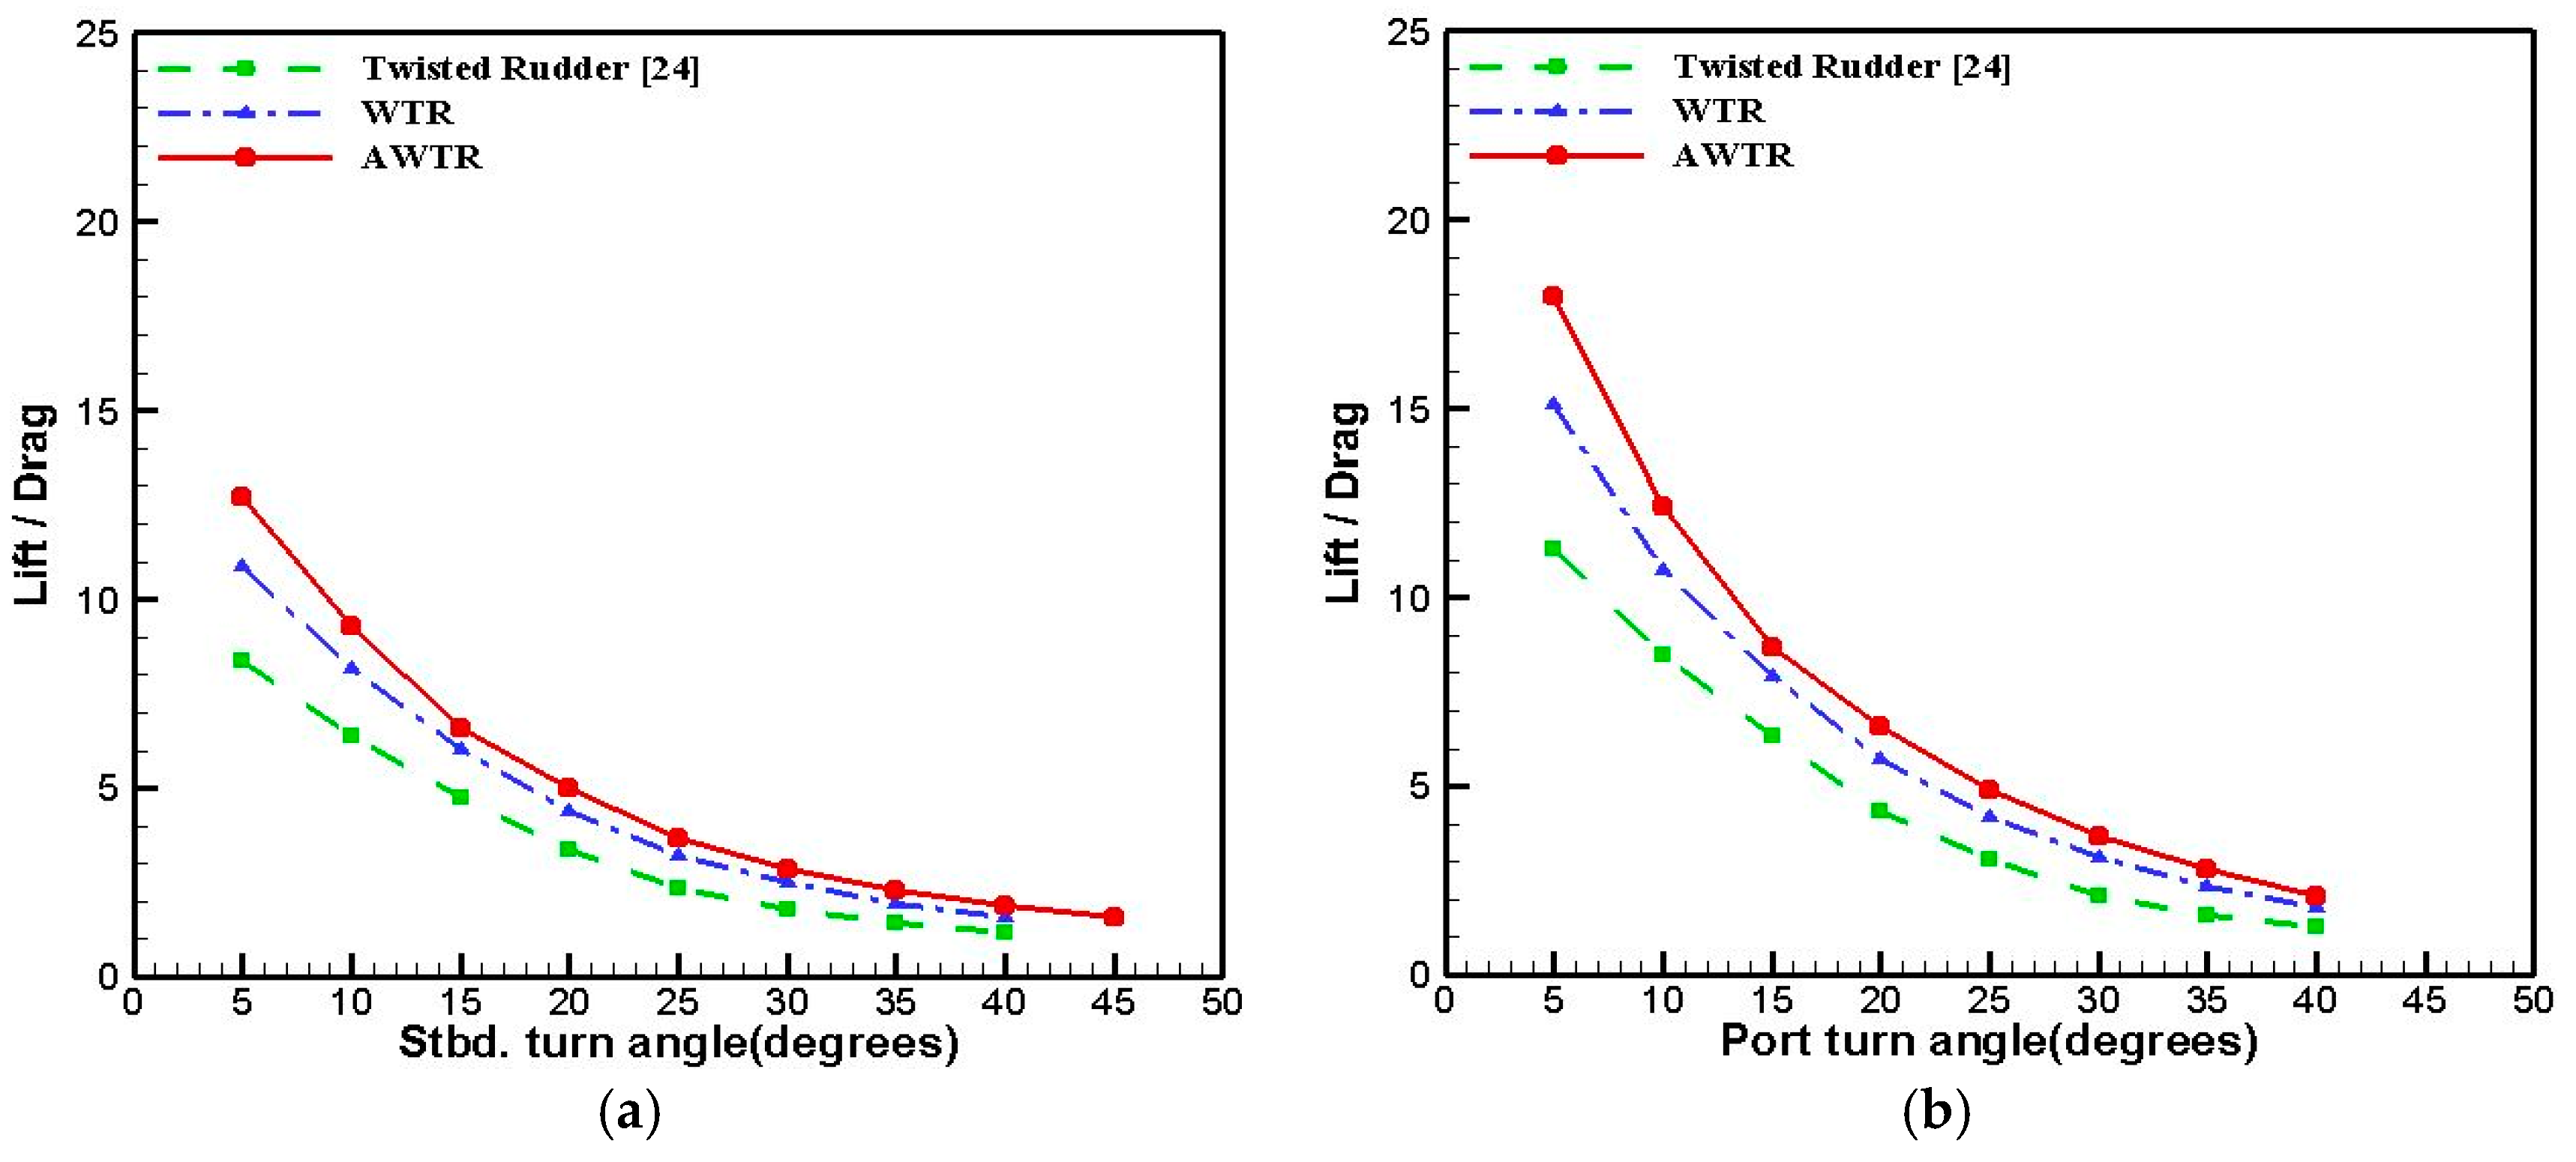
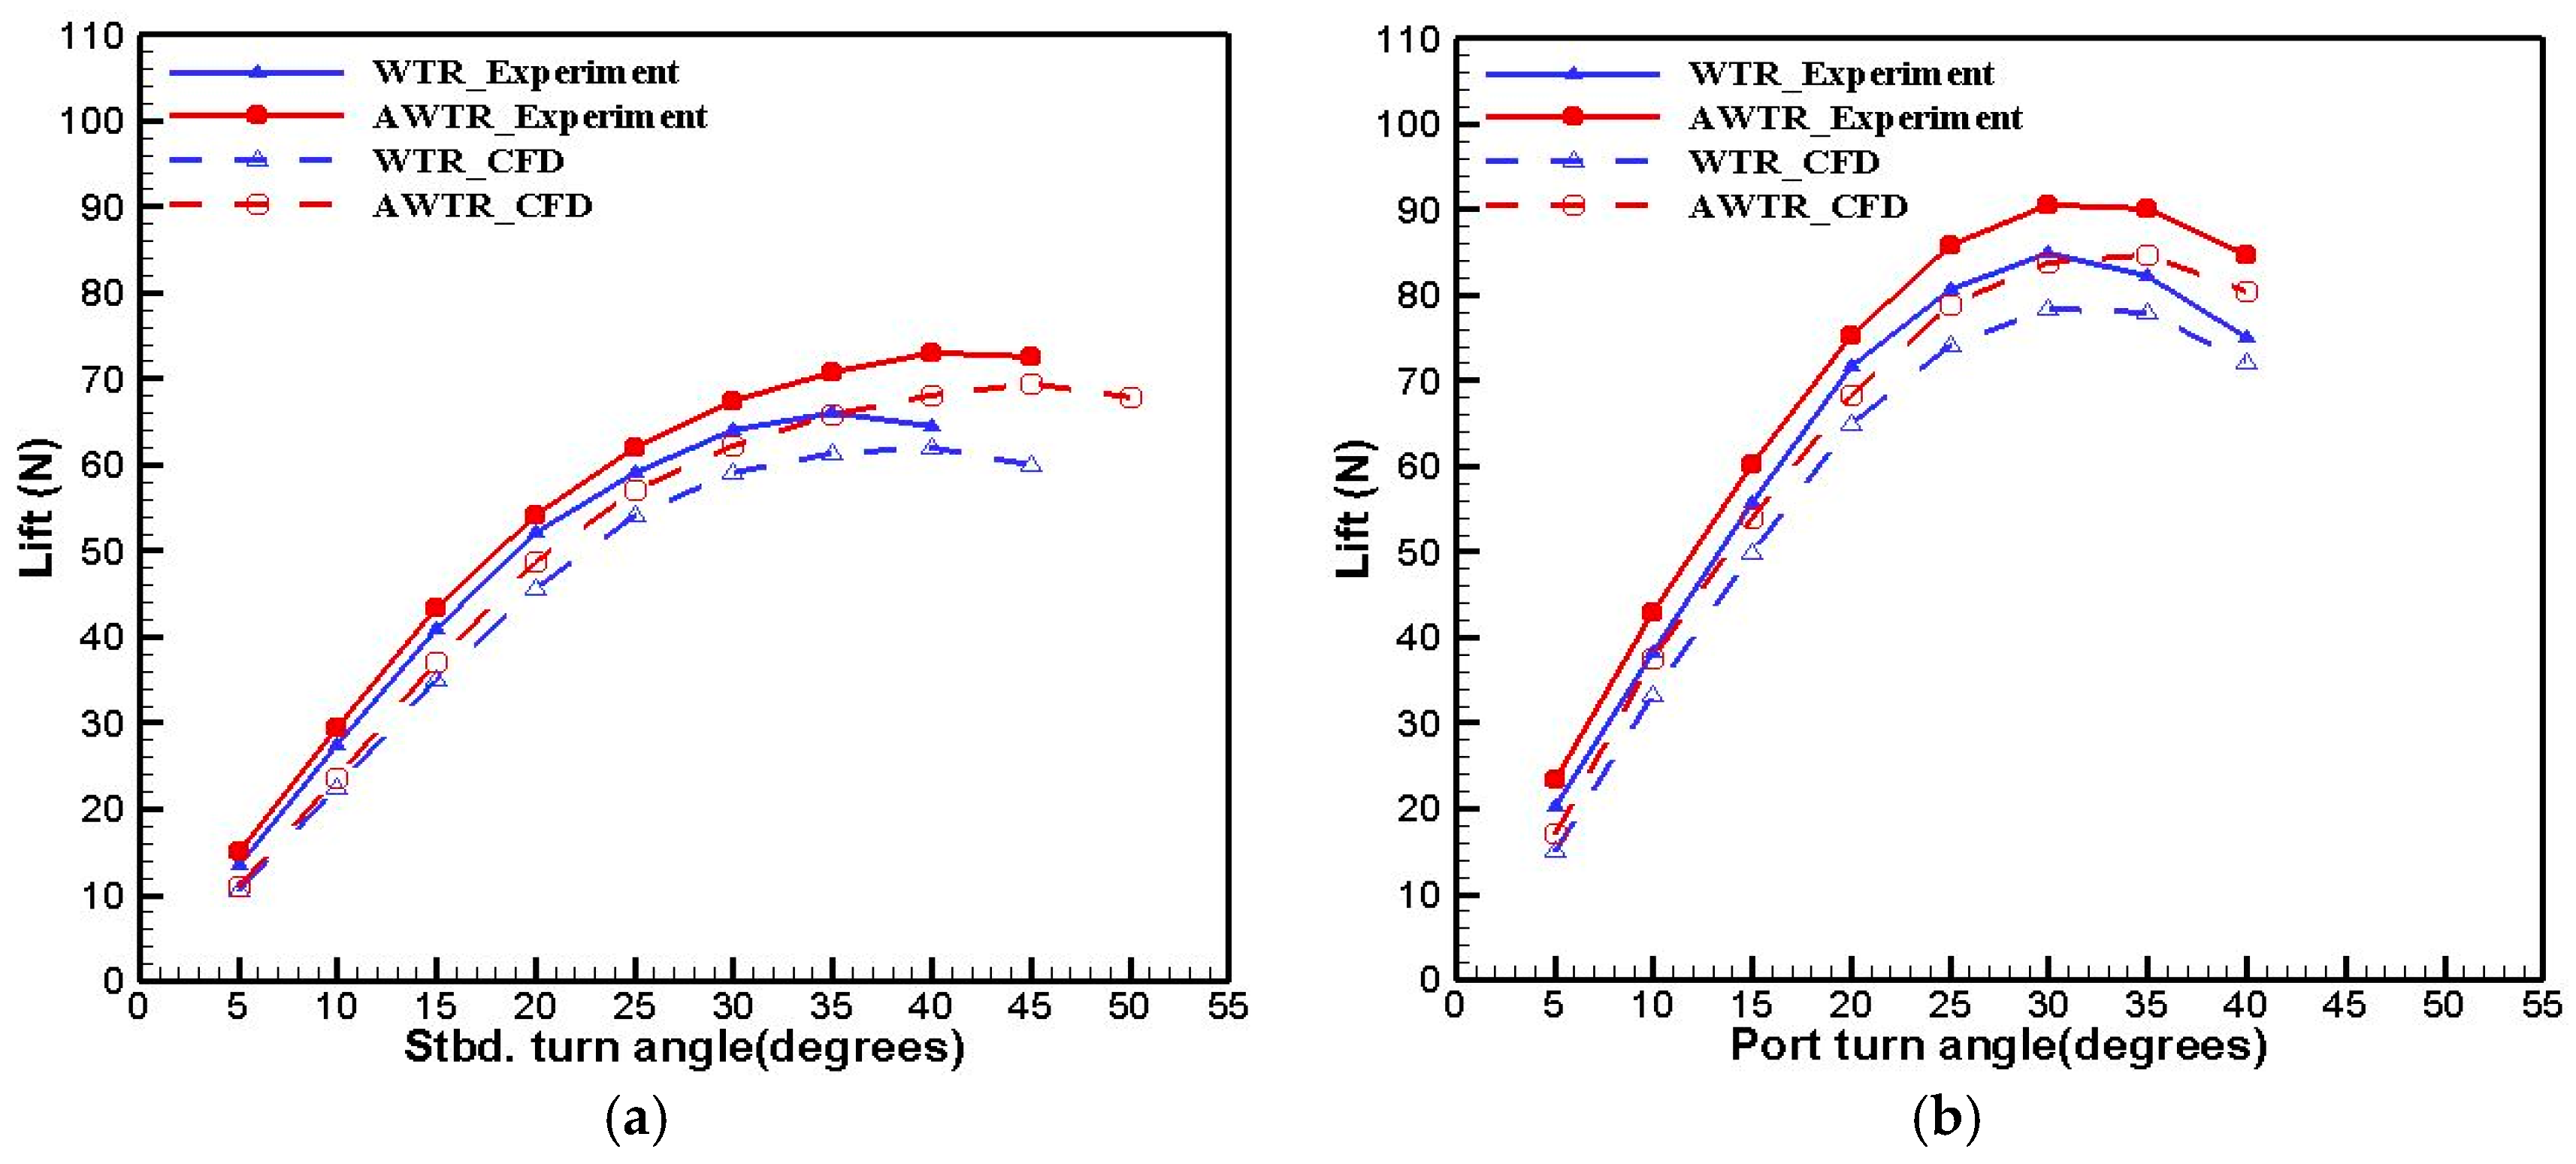
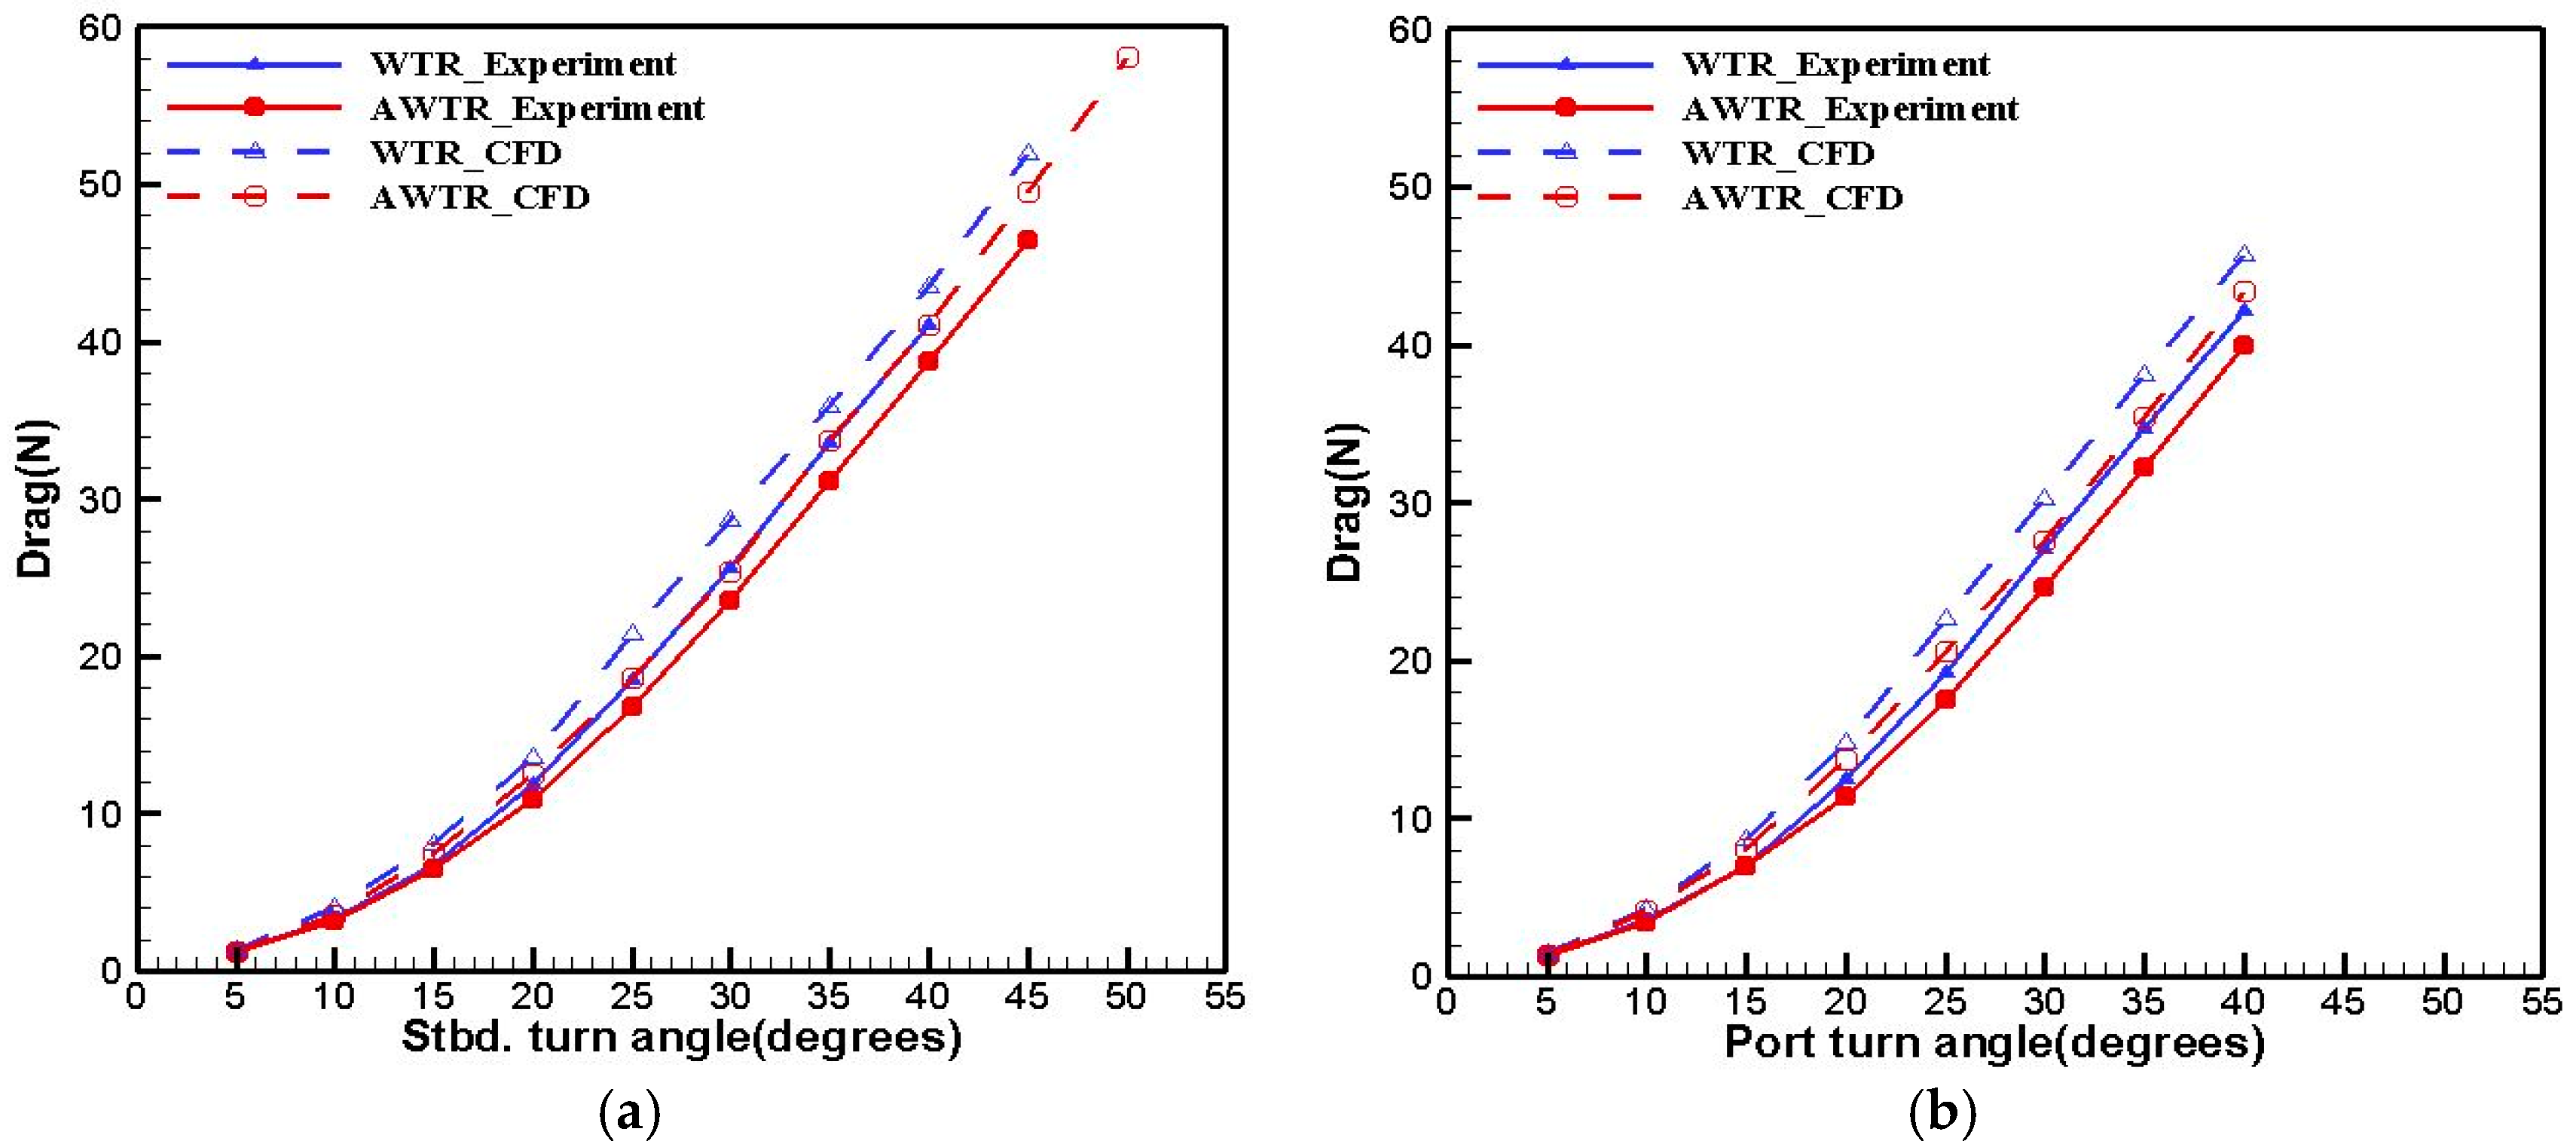
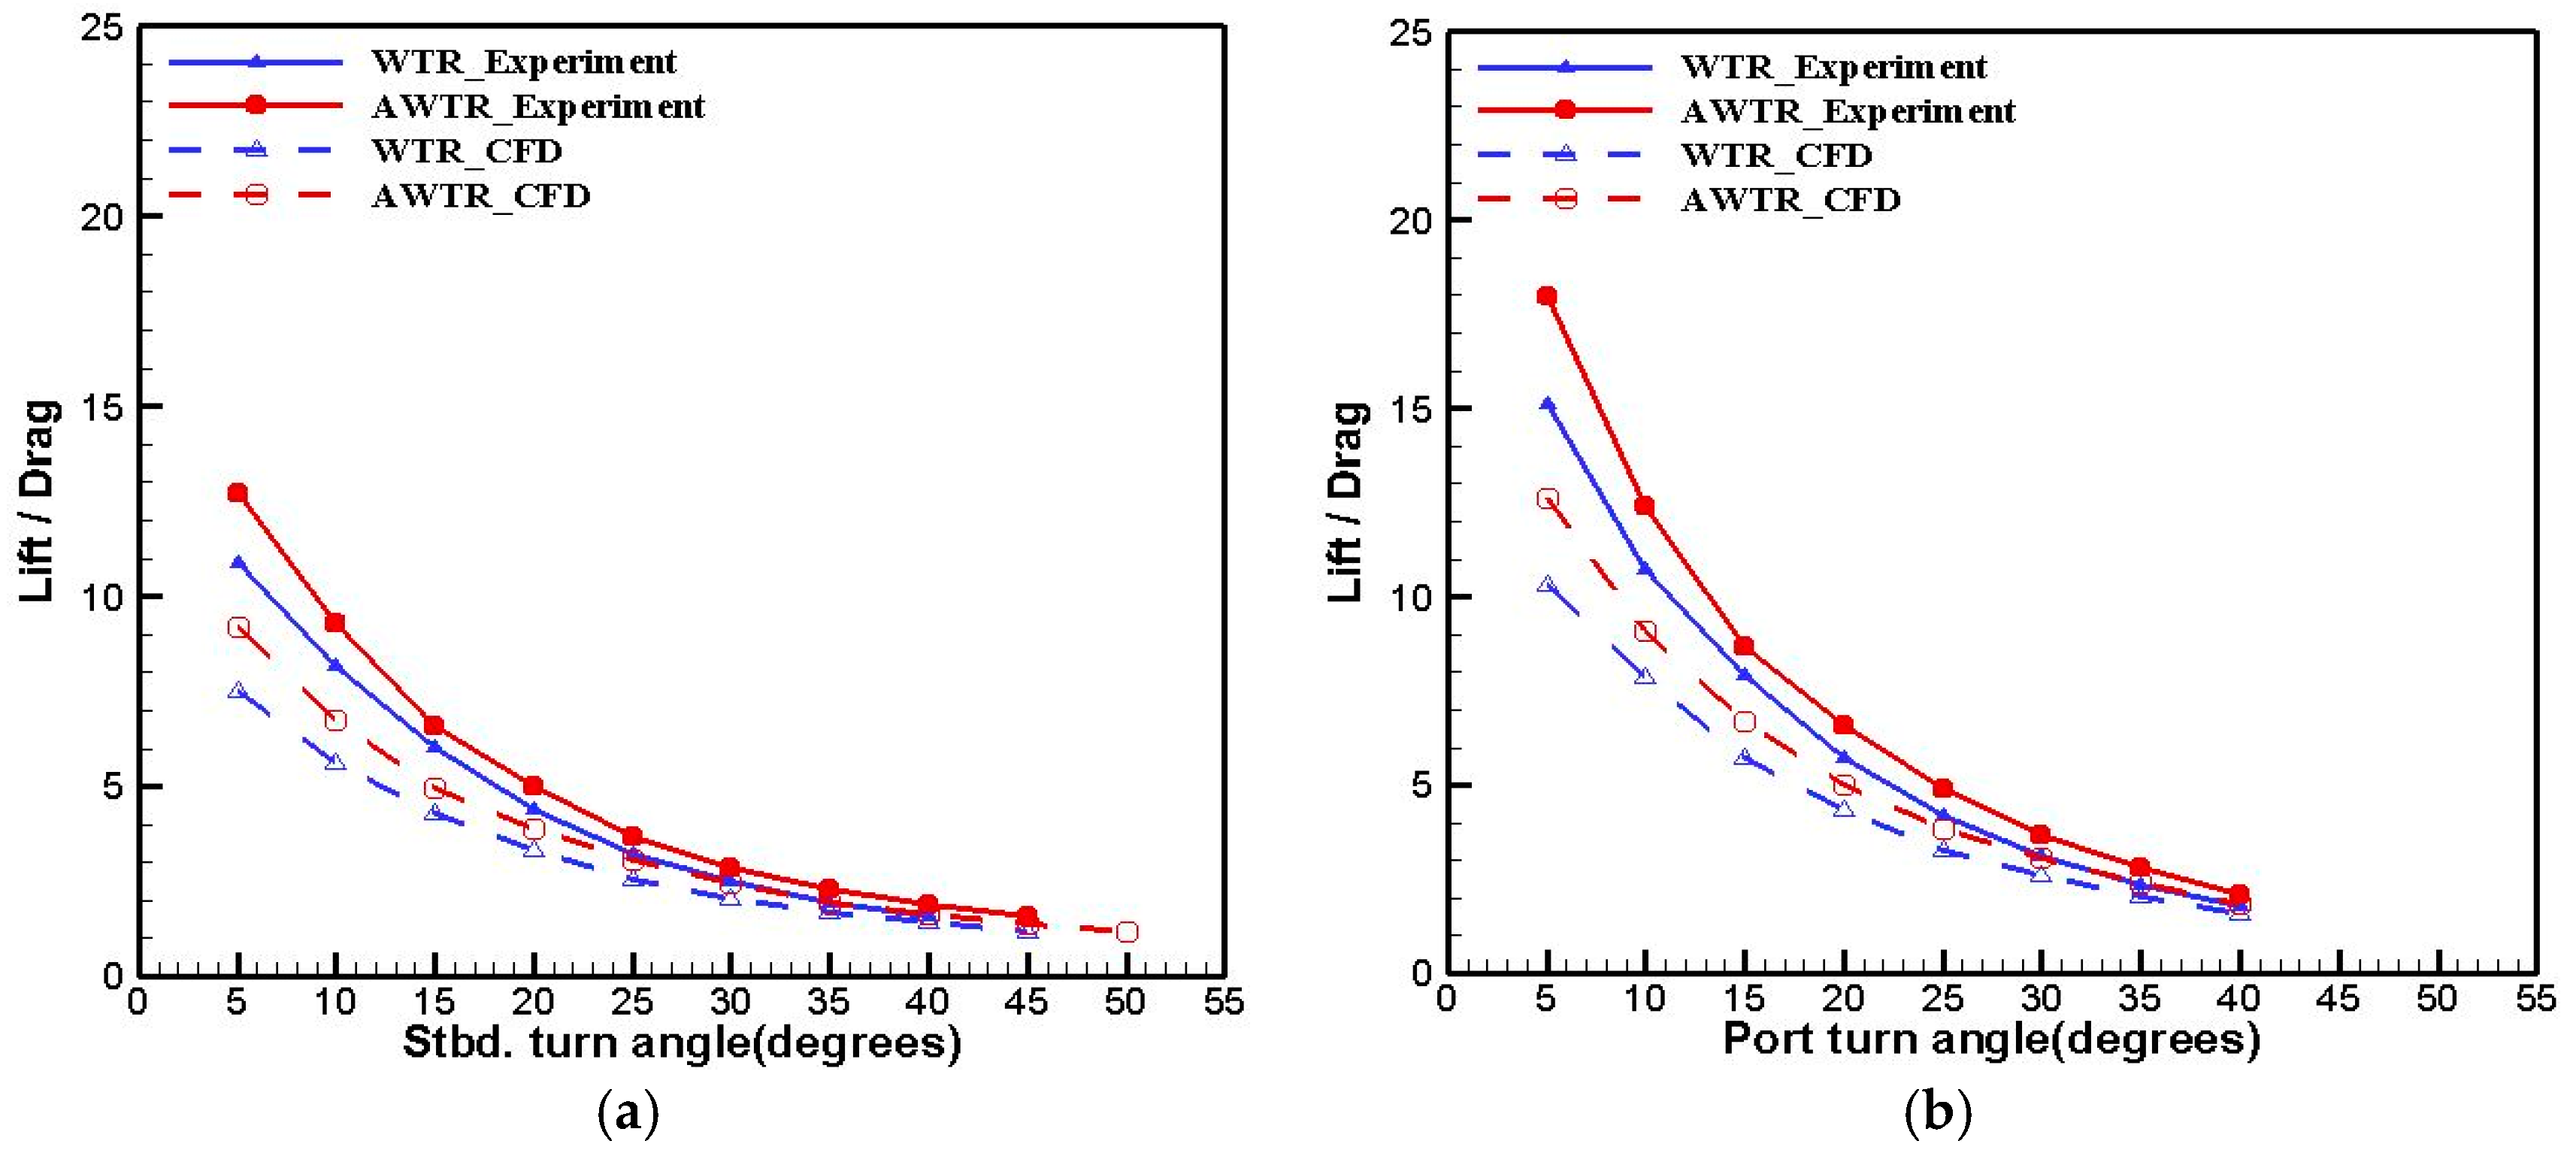
Regarding the performance of the rudder force, the lift, drag, and torque of each rudder were computed and measured for rotation angles from 5° to 40° in increments of 5°, to both the portside and starboard. On the portside and starboard turns, the lift coefficient distribution of the AWTR was greater than that of the WTR in both the model test and the numerical analyses. The stall point of the AWTR was delayed by approximately 5° compared with the WTR on both turns.
(3)
The proposed AWTR was superior to the WTR and had the advantages of a high lift-to-drag ratio and normal force and drag, especially in the high-rudder-angle range.
(4)
The numerical computations were compared with the experimental results. Although discrepancies did exist between them, the trends in both methods were qualitatively consistent.
(5)
A simulation of the actual maneuverability of the ship (zig-zag, turning circle, stopping) equipped with the developed AWTR will be conducted in the near future.

Author Contributions

This study is the result of collaborative teamwork. Project administration, validation, writing—original draft, Y.-J.S.; conceptualization, supervision, M.-C.K.; investigation, writing—review and editing, J.-G.K.; visualization, J.-W.K. All authors have read and agreed to the published version of the manuscript.

Funding

This research was supported by the Basic Science Research Program through the National Research Foundation of Korea (NRF), funded by the Ministry of Science, ICT and Future Planning (NRF-2019R1F1A105808013).

Institutional Review Board Statement

Not applicable.

Informed Consent Statement

The study did not involve humans.

Data Availability Statement

The data presented in this study are available on request from the corresponding author.

Conflicts of Interest

The authors declare no conflict of interest.

Nomenclature

SymbolTitleDefinitionUnit
AWTRAligned wavy twisted rudder
WTRWavy twisted rudder
TRTwisted rudder
LPPLength between perpendiculars m
LWLLength of waterline m
TDraught m
AE/AOExpanded area ratio of propeller
CChord length of propeller m
DPropeller diameter of propeller m
RPropeller radius m
P/DPitch-to-diameter ratio of propeller
SSpan length of rudder mm
S T Distance from top chord to center of propeller mm
LRudder lift
DRudder drag
N R Normal force of rudder
n m Revolutions per seconds
V R Inflow
α Angle of attack
subscript M, mValue for model ship or model propeller
subscript S, sValue for full-scale ship or full-scale propellerDs/Dm

References

  1. Olson, C.R. Effects of Various Linkage Ratios on the Free-Stream Hydrodynamic Characteristics of an All-Movable Flapped Rudder; David, W. Taylor Model Basin: Washington, DC, USA, 1995. [Google Scholar]
  2. Kerwin, J.E.; Lewis, S.D.; Oppenheim, B.W. Experiments on Rudders with Small Flaps in Free-Stream and Behind a Propeller; Massachusetts Institute of Technology: Cambridge, MA, USA, 1974. [Google Scholar]
  3. Oppenheim, B.W. A Theoretical and Experimental Investigation of the Performance of Flapped Rudders. Ph.D. Thesis, Massachusetts Institute of Technology, Cambridge, MA, USA, 1974. [Google Scholar]
  4. Gim, O.S.; Lee, G.W.; Ahn, Y.K. Control Effect of Hydro-Kinetic Force of a Special Rudder Attached Flap. J. Navig. Port Res. 2008, 32, 771–776. [Google Scholar] [CrossRef] [Green Version]
  5. Kim, H.J.; Kim, S.H.; Kim, D.Y.; Kim, I.T.; Han, J.S. A Numerical Study on the Effects of Maneuverability of Ship with Low Forward Speed by Increasing Rudder Force. J. Soc. Nav. Archit. Korea 2016, 53, 217–227. [Google Scholar] [CrossRef] [Green Version]
  6. Bertram, V. Practical Ship Hydrodynamic, 2nd ed.; Elsevier Butterworth-Heinemann: Oxford, UK, 2012; p. 284. [Google Scholar]
  7. Jun, H.C.; Kim, S.H.; Kim, H.J.; Park, H.P. Experimental Study on the Effect of Increasing Rudder Force on Turning Ability of Short Sea Shipping Ship. J. Korean Soc. Mar. Environ. Saf. 2012, 18, 591–596. [Google Scholar] [CrossRef]
  8. An, Y.S.; Lee, H.G.; Park, B.S.; Jang, C.S. Maneuverability of a DWT 8,000-Ton Oil/Chemical Tanker by Real Sea Trials-A Comparison between the Semi-Balanced Rudder and the Flap Rudder. J. Korean Soc. Fish. Ocean. Technol. 2015, 51, 257–264. [Google Scholar] [CrossRef]
  9. Liu, J.; Hekkenberg, R.; Zhao, B. RANS Study on Hydrodynamic Characteristics of Flapped Rudders. In International Conference on Offshore Mechanics and Arctic Engineering; American Society of Mechanical Engineers: New York, NY, USA, 2018; Volume 51333, p. V11BT12A002. [Google Scholar]
  10. Shin, Y.J.; Kim, M.C.; Lee, J.H.; Song, M.S. A Numerical and Experimental Study on the Performance of a Twisted Rudder with Wavy Configuration. Int. J. Nav. Archit. Ocean. Eng. 2019, 11, 131–142. [Google Scholar] [CrossRef]
  11. Tae, H.J.; Shin, Y.J.; Kim, B.J.; Kim, M.C. A Numerical Performance Study on Rudder with Wavy Configuration at High Angles of Attack. J. Soc. Nav. Archit. Korea 2017, 54, 18–25. [Google Scholar] [CrossRef] [Green Version]
  12. Wei, Z.; New, T.H.; Cui, Y.D. An Experimental Study on Flow Separation Control of Hydrofoils with Leading-Edge Tubercles at Low Reynolds Number. Ocean Eng. 2015, 108, 336–349. [Google Scholar] [CrossRef]
  13. Fish, F.E.; Weber, P.W.; Murray, M.M.; Howle, L.E. The Tubercles on Humpback Whales' Flippers: Application of Bio-Inspired Technology. Integr. Comp. Biol. 2011, 51, 203–213. [Google Scholar] [CrossRef] [PubMed] [Green Version]
  14. Lin, Y.F.; Lam, K.; Zou, L.; Liu, Y. Numerical Study of Flows Past Airfoils with Wavy Surfaces. J. Fluids Struct. 2013, 36, 136–148. [Google Scholar] [CrossRef]
  15. Serson, D.; Meneghini, J.R. Numerical Study of Wings with Wavy Leading and Trailing Edges. Procedia Iutam 2015, 14, 563–569. [Google Scholar] [CrossRef] [Green Version]
  16. Skillen, A.; Revell, A.; Pinelli, A.; Piomelli, U.; Favier, J. Flow Over a Wing with Leading-Edge Undulations. AIAA J. 2015, 53, 464–472. [Google Scholar] [CrossRef]
  17. Jones, W.P.; Launder, B.E. The Prediction of Laminarization with a Two-Equation Model of Turbulence. Int. J. Heat Mass Transf. 1972, 15, 301–314. [Google Scholar] [CrossRef]
  18. Launder, B.E.; Sharma, B.I. Application of the Energy-Dissipation Model of Turbulence to the Calculation of Flow Near a Spinning Disc. Lett. Heat Mass Transf. 1974, 1, 131–137. [Google Scholar] [CrossRef]
  19. Shih, T.H.; Liou, W.W.; Shabbir, A.; Yang, Z.; Zhu, J. A New k-ϵ Eddy Viscosity Model for High Reynolds Number Turbulent Flows-Model Development and Validation. Comput. Fluids 1995, 24, 227–238. [Google Scholar] [CrossRef]
  20. Rodi, W. Experience with Two-Layer Models Combining the k-Epsilon Model with a One-Equation Model Near the Wall. In 29th Aerospace Sciences Meeting; AIAA ARC: Reston, VA, USA, 1991; p. 216. [Google Scholar]
  21. Simens. STAR CCM+ User Guide, Version 15.02.
  22. Muzaferija, S.; Peric, M. Computation of Free Surface Flows using Interface Tracking and Interface Capturing Methods. In Nonlinear Water Wave Interaction; Mahrenholtz, O., Markewicz, M., Eds.; WIT Press: Southampton, UK, 1999. [Google Scholar]
  23. Park, I.R.; Kim, K.S.; Kim, J.; Van, S.H. Numerical Simulation of Free Surface Flow Using a Refined HRIC VOF Method. J. Soc. Nav. Archit. Korea 2010, 47, 279–290. [Google Scholar] [CrossRef] [Green Version]
  24. Casalone, P.; Dell’Edera, O.; Fenu, B.; Giorgi, G.; Sirigu, S.A.; Mattiazzo, G. Unsteady RANS CFD Simulations of Sailboat’s Hull and Comparison with Full-Scale Test. J. Mar. Sci. Eng. 2020, 8, 394. [Google Scholar] [CrossRef]
  25. Shin, Y.J. A Study on the Analysis of Interactions and Optimal Design of Energy Saving Devices by Ship Types. Ph.D. Thesis, Pusan National University, Busan, Korea, 2019. [Google Scholar]
Figure 1. Profiles of a conventional and a flap rudder installed for a DWT 8000-ton vessel in dock [8]: (a) semi-balanced rudder; (b) flap rudder.
Applsci 11 09634 g001
Figure 2. Comparison of the alignment and misalignment of the peak point of the wave and centerline of the propeller: (a) Shin et al. [10]; (b) present study.
Applsci 11 09634 g002
Figure 3. Modification of the wavy central axis.
Applsci 11 09634 g003
Figure 4. Computational domain.
Applsci 11 09634 g004
Figure 5. Grid configuration for CFD analysis: (a) hull; (b) bow; (c) stern.
Applsci 11 09634 g005
Figure 6. Y+ of the hull surface.
Applsci 11 09634 g006
Figure 7. Convective courant number.
Applsci 11 09634 g007
Figure 8. Model test facilities at Pusan National University: (a) towing carriage; (b) towing tank.
Applsci 11 09634 g008
Figure 9. Manufactured models of WTR and AWTR: (a) WTR; (b) AWTR.
Applsci 11 09634 g009
Figure 10. Rudder force and moment calibrator: (a) rudder angle controller; (b) rudder force dynamometer.
Applsci 11 09634 g010
Figure 11. Wake distribution of the WTR and AWTR: (a) WTR; (b) AWTR.
Applsci 11 09634 g011
Figure 12. Rudder-induced forces and the definition of rudder direction.
Applsci 11 09634 g012
Figure 13. Experimental results for lift: (a) starboard turn; (b) portside turn.
Applsci 11 09634 g013
Figure 14. Experimental results for drag: (a) starboard turn; (b) portside turn.
Applsci 11 09634 g014
Figure 15. Experimental results for torque: (a) starboard turn; (b) portside turn.
Applsci 11 09634 g015
Figure 16. Experimental results of lift-to-drag ratio: (a) starboard turn; (b) portside turn.
Applsci 11 09634 g016
Figure 17. Comparison of numerical and experimental results for lift: (a) starboard turn; (b) portside turn.
Applsci 11 09634 g017
Figure 18. Comparison of numerical and experimental results for drag: (a) starboard turn; (b) portside turn.
Applsci 11 09634 g018
Figure 19. Comparison of numerical and experimental results for torque: (a) starboard turn; (b) portside turn.
Applsci 11 09634 g019
Figure 20. Comparison of numerical and experimental results for lift to drag ratio: (a) starboard turn; (b) portside turn.
Applsci 11 09634 g020
Table 1. Principal parameters of the 3600 TEU KRISO container ship.
Real ShipModel Ship
Length PP (m)230.005.82
Length WL (m)232.505.89
Breadth (m)32.200.82
Depth (m)19.000.48
Design draught (m)10.800.27
Block coefficient0.6510.651
Design speed (m/s)12.346 m/s1.964 m/s
Froude number0.259
Scale ratio39.5
Table 2. Principal parameters of the 3600 TEU KRISO container ship propeller.
Real ShipModel Ship
Diameter (m)7.900.2
Number of blades5
(P/D) mean0.950
A E / A o 0.800
Skew (°)32
Hub ratio0.180
Section profileNACA66 (a = 0.8 mean line camber)
Scale ratio39.5
Table 3. Main dimensions of the rudders.
Wavy Twisted RudderAligned Wavy Twisted Rudder
Profile typeNACA 0018
Top chord (mm)152.32154.59
Bottom chord (mm)120.10122.43
Mean chord (mm)136.21138.51
Span (mm)248.50251.71
Aspect ratio1.821.82
Table 4. Computation analysis conditions.
ResistanceSelf-PropulsionRudder Force
Governing equationRANS
Velocity–pressure couplingSIMPLE method
Turbulence modelK-ε turbulence model
FlowUnsteady
Body motionDFBI (Dynamic Fluid–Body Interaction motion)n/a
Rotating motionn/aRBM method (sliding mesh)
Time step0.002 s5° rotation of propeller
Total physical time30 s200 revolutions of the propeller (approximately 19 s)
Table 5. Boundary physics.
Inlet/Bottom/TopVelocity inlet with defined volume fraction, flow speed = 1.964 m/s, turbulence intensity 0.01, viscosity ratio 10
OutletPressure outlet with relative pressure = hydrostatic pressure
SideWall with slip condition
HullWall with no slip condition
Table 6. Number of grids and grid size used in CFD analysis.
ResistanceSelf-PropulsionRudder Force
Fluid region minimum mesh size0.005625 m
Propeller region minimum mesh sizen/a0.0014062 5 m
Fluid region no. of grids2.50 × 1062.85 × 106
Propeller region no. of gridsn/a3.20 × 105
Total no. of grids2.50 × 1063.17 × 106
Table 7. Model test cases and conditions.
Test CaseMeasurement Speed Range (Knots)Draught ConditionAppendage
Resistance23, 24, 25Design draughtWTR, AWTR
Self-propulsion23, 24, 25Design draughtWTR, AWTR
Rudder force24Design draughtWTR, AWTR
Table 8. Comparison of resistance at model scale.
KnotsCase WTR   C TM × 10 3 AWTR   C TM × 10 3 Diff. (%)
23Model test3.6103.6160.16
24Model test3.8943.9000.15
CFD3.8573.8640.18
Diff. (%)0.960.85-
25Model test4.2574.2640.16
Table 9. Comparison of delivered horsepower at model scale.
KnotsCasenM (RPS)QM (Nm)2πnMQM (W)
WTRAWTRDiff. (%)WTRAWTRDiff. (%)WTRAWTRDiff. (%)
23Model test10.33410.314−0.191.0481.047−0.1068.04767.851−0.29
24Model test10.88210.875−0.091.1661.163−0.2679.72479.445−0.35
CFD10.86610.831−0.321.1821.1820.0080.69980.439−0.32
Diff. (%)0.1470.379-−1.354−1.607-−1.235−1.235-
25Model test11.48011.453−0.241.2901.289−0.0893.04992.758−0.31
Table 10. Measurement range of the rudder angle.
RudderStarboard Turn Angle RangePortside Turn Angle RangeModel Ship Speed (m/s)
Twisted rudder5–40°, every 5°5–40°, every 5°1.964
Wavy twisted rudder (WTR)5–40°, every 5°5–40°, every 5°
Aligned wavy twisted rudder (AWTR)5–45°, every 5°5–40°, every 5°
Publisher’s Note: MDPI stays neutral with regard to jurisdictional claims in published maps and institutional affiliations.

