1. Introduction
The flow interaction with the sediment in a river might cause bed aggradation and degradation processes, which are essential in river control engineering. One of the most important characteristics of a fluvial bed is the movement of the water through the soil in terms of downward seepage because of soil permeability. The channel bed distortions and the turbulent flow features are altered in the presence of downward seepage flow (seepage through the channel in the downward direction) [
1].The seepage and related turbulent dynamics play an important role in the solute transport across the hyporheic area in rivers [
2].This aspect could have important implications for groundwater quality. Further, Sharma et al. [
3] emphasized the seepage influence on the morphodynamic nature of a sediment bed channel, with the deformation of bed materials and an exacerbation of the sediment transport rate. Hence, seepage processes might be crucial for the sustainability of the hydraulic structures because of their interaction with groundwater. McKie et al. [
4] argued that sediment transport rates can be modulated by the seepage processes. Consequently, seepage might have an impact on river channels and bed morphology, particularly at local scales [
4]. Moreover, downward seepage would reduce the conveyance efficiency of a channel [
5]. Field studies [
6,
7] evaluated the amount of downward seepage in natural rivers and detected that the seepage flow may vary from 10% to 45% of the main flow discharge delivered at the canal head. Downward seepage increases the bed shear stresses as well as the rate of sediment transport [
1,
4]. Moreover, the turbulence intensities are decreased in flows over seepage beds [
8]. Many previous studies [
9,
10] investigated the nature of the velocity distribution under the existence of downward seepage. A tendency towards uniform velocity profiles in the near-bed flow and a higher level of anisotropy in turbulent flow were observed [
10].
In addition, the sediment particles that form the riverbeds are mostly non-uniform (i.e., sediment mixtures) and the finer grains are usually transported on the bed surface [
11]. Turbulent flows causing the erosion and deposition of riverbeds are important to fluvial hydraulics. The relation between flow velocity and suspended sediment was studied by Bennett and Best [
12] and they pointed out that the flow velocity and the turbulence intensities in near-bed flow are directly related to the suspension of sediment. Best et al. [
13] considered the sediment movement in a channel with coarse sand and they detected low values of mean longitudinal velocities and turbulence intensity because of sediment transport. Moreover, the mean streamwise velocity is inversely proportional to the friction factor connected to the apparent roughness in the reflection of bed material movement [
14]. The flow turbulence in an alluvial channel for the discharge corresponding to incipient motion was inspected by numerous investigators [
15,
16]. Moreover, previous studies [
17,
18,
19] examined the flow turbulence in sandy bed channels for the mobile bed condition. Devi et al. [
20] analyzed the turbulent flow characteristics at high Reynolds number in a vegetated channel and compared them to the turbulent coherent structure in an alluvial channel without vegetation. Recently, Sharma and Kumar [
21] analyzed the flow turbulence at high Reynolds number in a rough bed channel and correlated the sediment transport with flow turbulence.
From the literature review, it emerges that most of the studies focus on the flow characteristics in sand/gravel bed channels at high Reynolds number. Moreover, riverbeds are typically composed of non-uniform sediments, and seepage is an explicit parameter, which influences the turbulent parameters and initiates the sediment movement. The resulting sediment movement alters the channel morphology [
1,
2], which might have an effect on turbulent parameters along with seepage. In order to decipher the consequences of seepage on turbulent parameters in the alluvial channel, the present work aims to simulate the experimental channel at moderate discharge, where sediment movement is minimal or has a negligible effect on channel morphology. Keeping this aspect for alluvial channels, this study investigates the turbulent flow characteristics in the near-bed flow of a bed with seepage. Experiments were carried out allowing downward seepage flow from the channel bed. The three-dimensional instantaneous velocity components of flow were measured by using an Acoustic Doppler Velocimeter (ADV).
2. Experimental Setup and Methodology
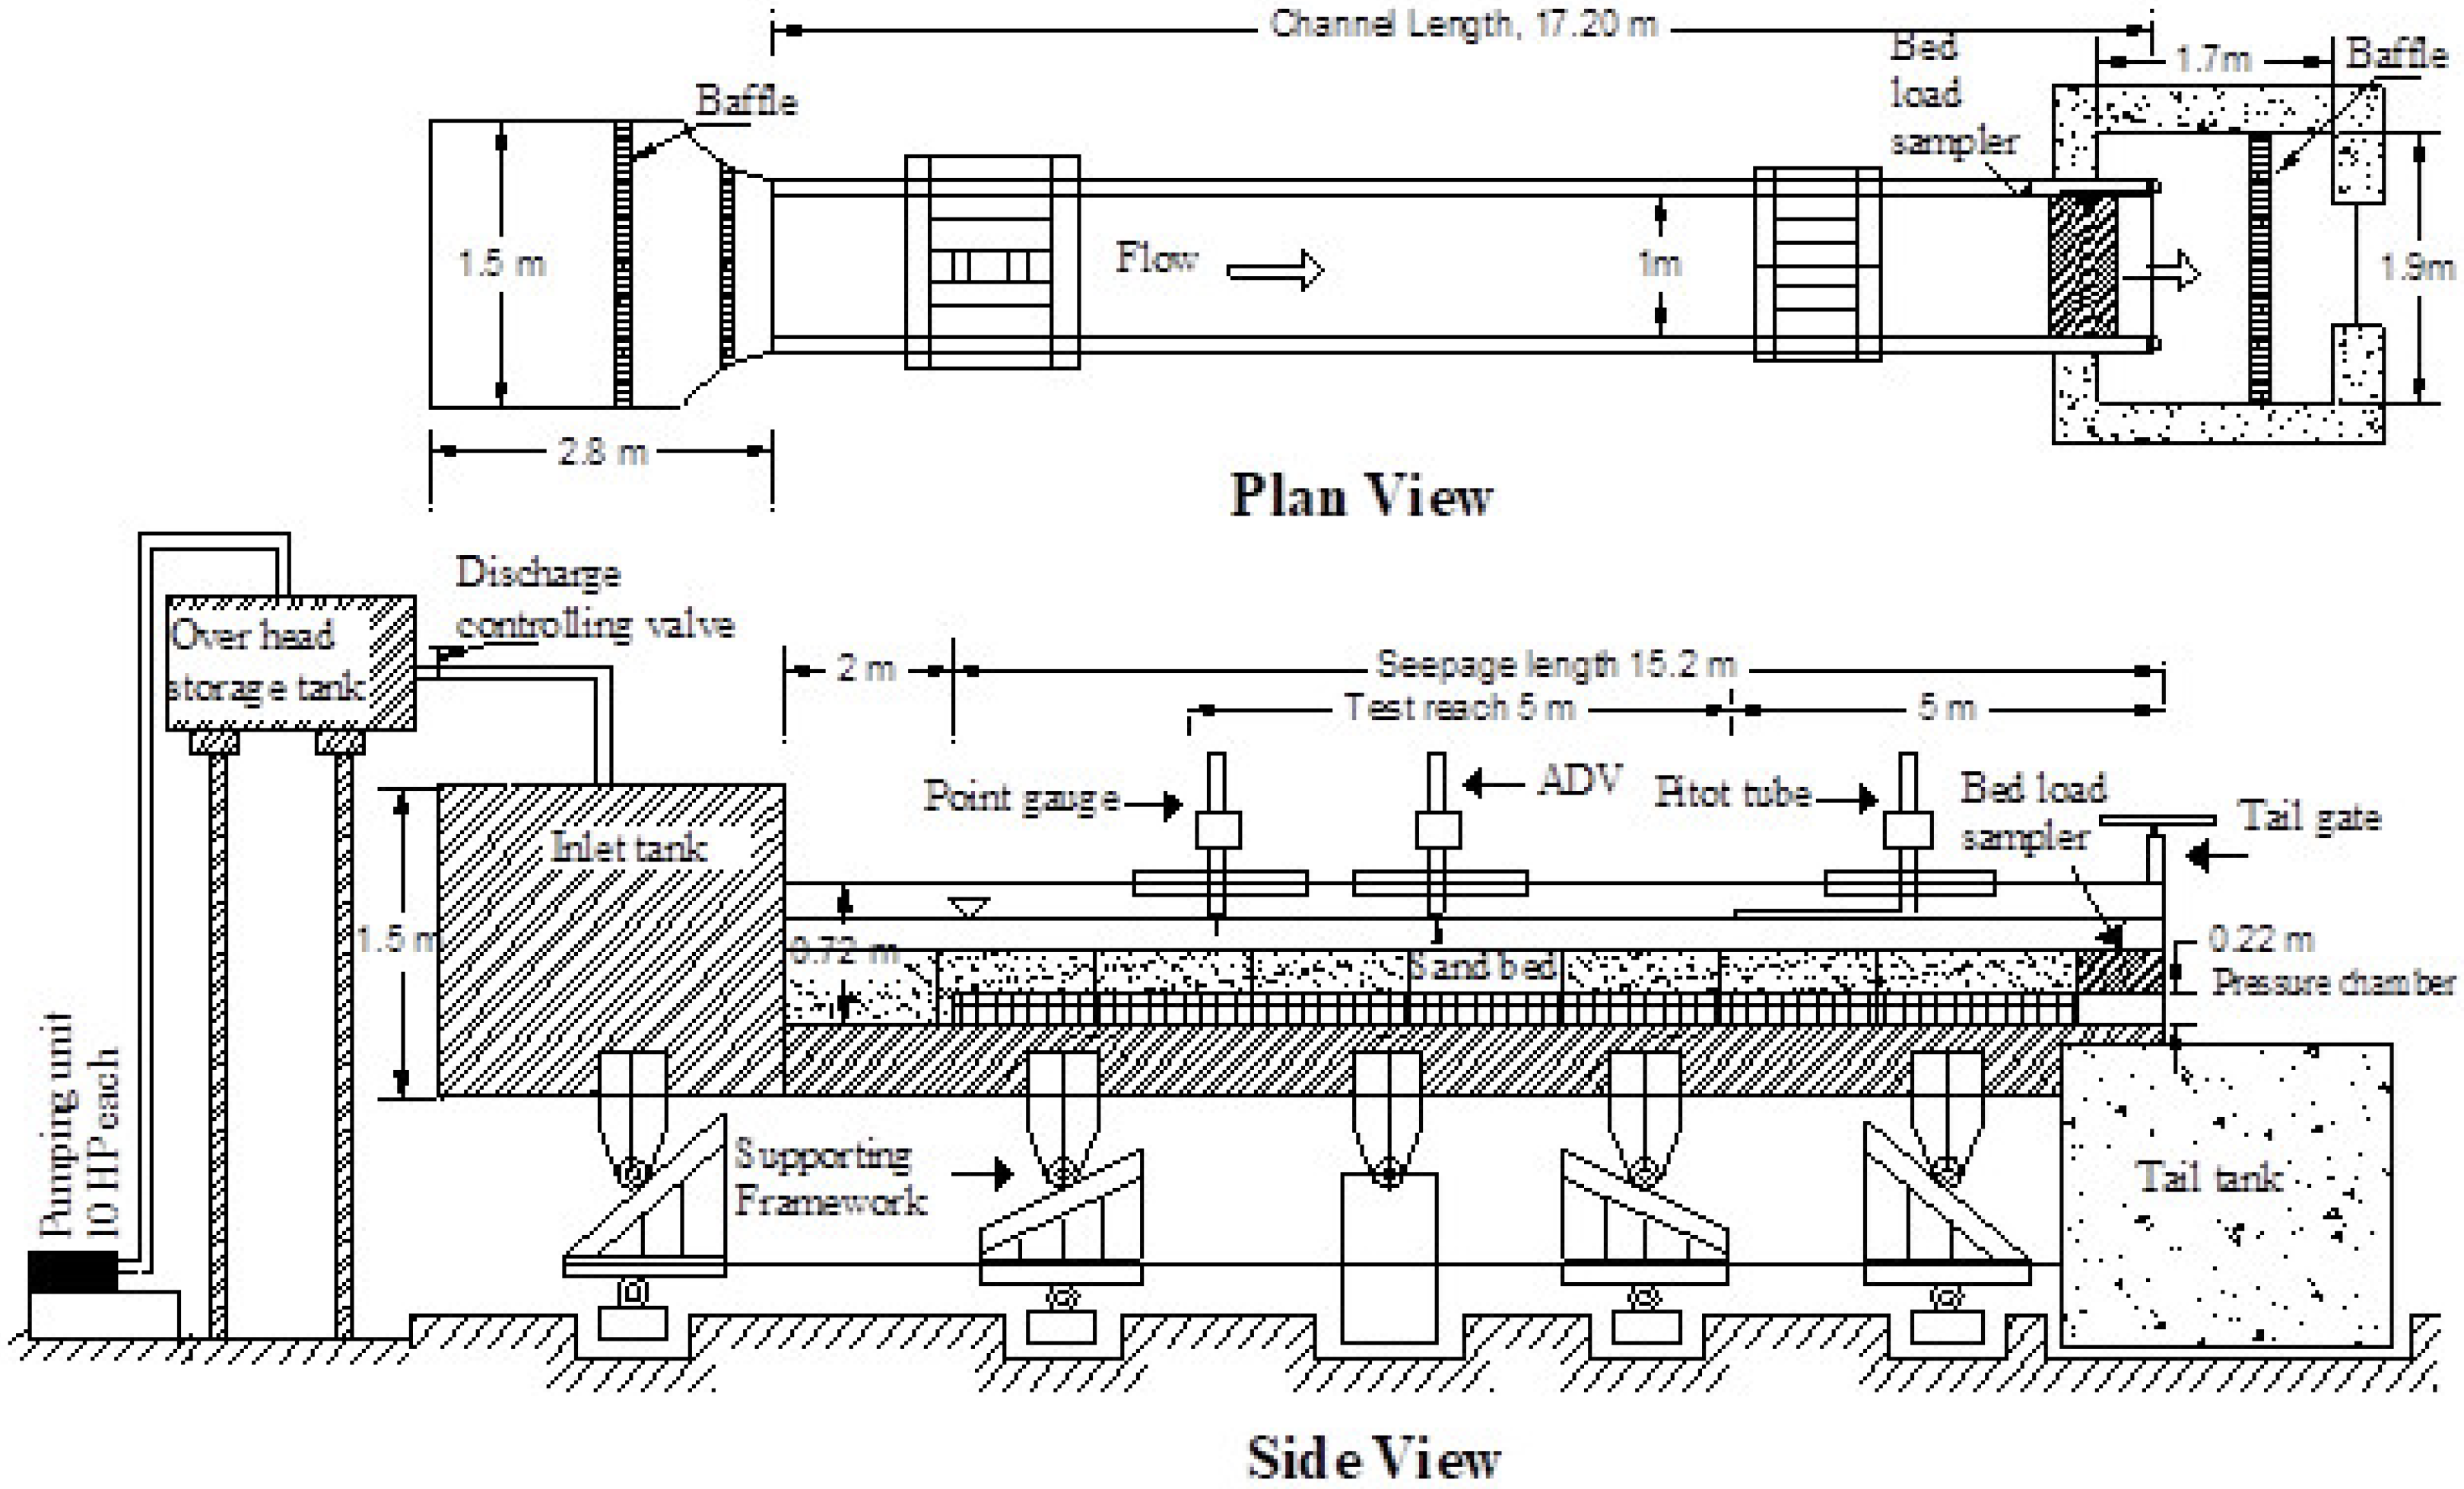
The laboratory experiments were carried out in a 17.20 m long, 1.00 m wide, and 0.72 m deep channel (
Figure 1) to analyze the flow characteristics at moderate Reynolds number in a seepage bed. The length of the channel was sufficient to attain fully developed flow conditions in the test section. The flow depth over a rectangular notch was used to measure the flow discharge. It was controlled by a tailgate fixed at the outlet end of the channel. The test section was 5 m long and started 5 m downstream of the channel entrance to avoid any influence of the inflow and outflow of the channel. A digital point gauge attached to a moving trolley measured the flow depth in the test section. The water surface slope in the channel was calculated by using a pitot-static tube, connected to a digital manometer, and also attached on a moving trolley in the channel. Further experimental details and a thorough description of the procedure are available in Sharma et al. [
3]. The longitudinal slope of the channel bed was maintained as 0.001 for all the experimental runs. The aspect ratio (channel width/flow depth) in the present experiments was greater than 6; thus, the influence of secondary currents on the main flow was negligible in the current work [
22], and, eventually, the flow features in the channel bed were not affected by the three-dimensional effects. The downward seepage was allowed by forming a seepage chamber(i.e., the pressure chamber in
Figure 1) that was 15.20 m long, 1.0 m wide, and 0.22 m deep. The seepage chamber was employed just below the channel bed, which extracted the water from the channel in the form of downward seepage. The seepage discharge was measured by a pair of electromagnetic flow meters, which were connected through pipes to the seepage chamber [
3].
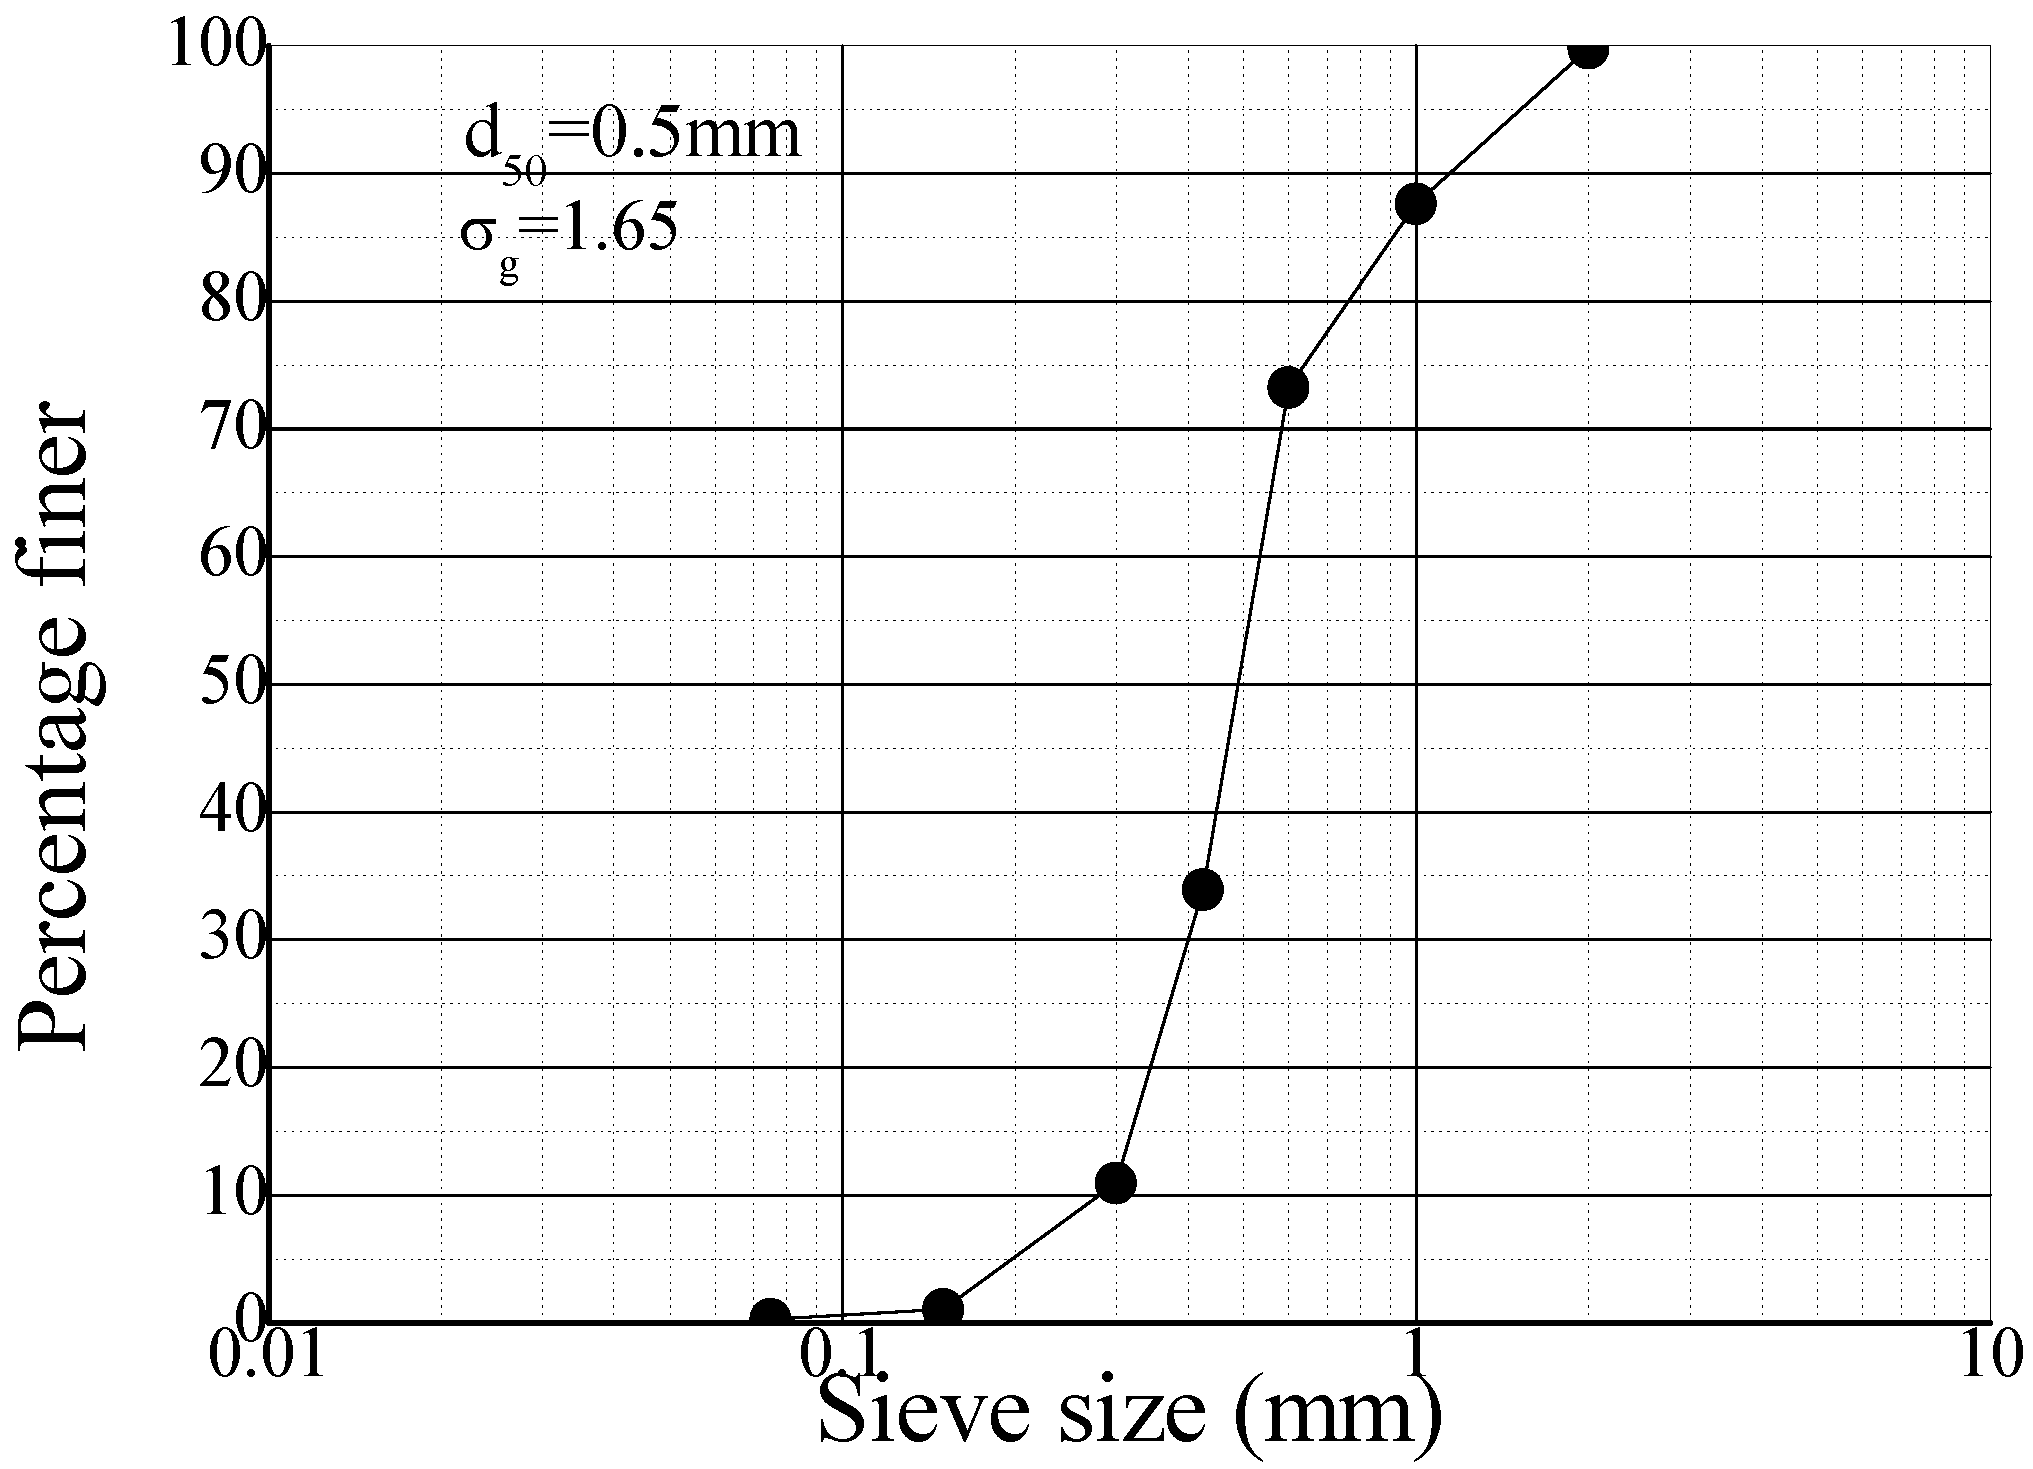
The present experiments used a non-uniform sand as the bed material. The sieve analysis to determine the grain size distribution was performed according to the Indian Standard Code IS: 2386 (Part I) [
23] (
Figure 2). The geometric standard deviation
of the used sand material was 1.65, where
d84.1,
d15.9, and
d50 represent the size of the particles, for which the percentages of finer particles are 84.1, 15.9, and 50, respectively. Therefore, the sand used in this study was non-uniform (though slightly) because
σg > 1.4 [
24]. Details on the bed material and flow conditions are provided in
Table 1. The sand bed was 17.2 m long, 1.0 m wide, and 0.22 m deep. The experiments were carried out always with the same approaching discharge
Q = 0.0242 m
3/s but under three different conditions: no seepage, seepage discharge equal to 10% of
Q, and seepage discharge equal to 15% of
Q. In the no-seepage experiment, the valve, installed at the inlet tank, was regulated slowly in order to supply the water flow into the channel until the required no-seepage discharge and flow depth were attained. The sediment bed channel was prepared again on subsequent completion of the no-seepage run, and, thereafter, seepage experiments were carried out by considering the seepage through the channel bed, which was 10% and 15% of the no-seepage discharge, as stated above. The flow depth
h was kept constant to allow the comparison of turbulence quantities between no-seepage and seepage runs. Laboratory environments provide the opportunity to detect and measure comprehensive procedures from reach to grain scale, with the abilities of the measurement equipment being the only limiting factor. In this study, the Reynolds number, though moderate (around 20,000), was such as to preserve the conditions of fully rough flow, as typically happens in rivers. Then, the Froude number (around 0.20) becomes the main criterion for the up-scaling from the model to the prototype [
25]. In the field, the effect of sediment size,
d50, was not considered to be important to the turbulent flow characteristics because of the very large values of the ratio
b/
d50 (where
b is the channel width) [
26].
A four-beam down-looking Acoustic Doppler Velocimeter (ADV) probe, named Nortek
®Vectrino, was used to measure the instantaneous water velocities at the centerline of the test section. Data were collected with a sampling frequency of 200 Hz. The ADV worked with an acoustic frequency of 10 MHz, having an adjustable cylindrical sampling volume of 6 mm diameter and 1–4 mm high. The sampling volume was 5 cm below the central transmitter; therefore, it was impossible to measure the velocity data at a distance less than 5 cm from the water surface. A time duration of 180 sec was set to collect the instantaneous velocity data. The uncertainty of the ADV data was calculated by collecting 12 samples of instantaneous velocities in the vicinity of the bed region. The uncertainty of the ADV data is given in
Figure 2, where,
u,
v, and
w are the mean velocities in the longitudinal, widthwise, and vertical directions, respectively;
u′,
v′, and
w′ are the corresponding components of velocity fluctuations, and
,
, and
are the turbulence intensities. The time-averaged (mean) streamwise velocity (
u) and vertical velocity (
w) were computed as
where
Ui,
Wi, and
n represent the streamwise instantaneous velocity, the vertical instantaneous velocity, and the sample number, respectively.
In particular, the Reynolds shear stress (RSS) specifies the exchange of mass and momentum from the flow to the sediment bed. The RSS is measured as
One can also write
where
τuw is the Reynolds shear stress.
Moreover, the turbulence intensity is the root mean square (rms) of the velocity fluctuation. Therefore, the turbulence intensities in the streamwise direction,
σ(
u), and vertical direction,
σ(
w), are expressed by
Finally, the third-order correlation (skewness) is directly linked to the flow coherent features, which would provide essential evidence on the time-based appearances of the velocity fluctuations. The skewness of velocity fluctuations is given by Equation (6):
where
signifies the flux of
in the flow direction and
characterizes the flux of
in the vertical direction.
Table 2 shows the uncertainty associated with the ADV data collected in this study. The standard uncertainty is calculated by the standard deviation of the mean of various numbers of instantaneous velocity samples. It can be noted that the uncertainty of the time-averaged velocities and turbulence intensities is less than ±5%, which implies the accuracy of the ADV data [
3].
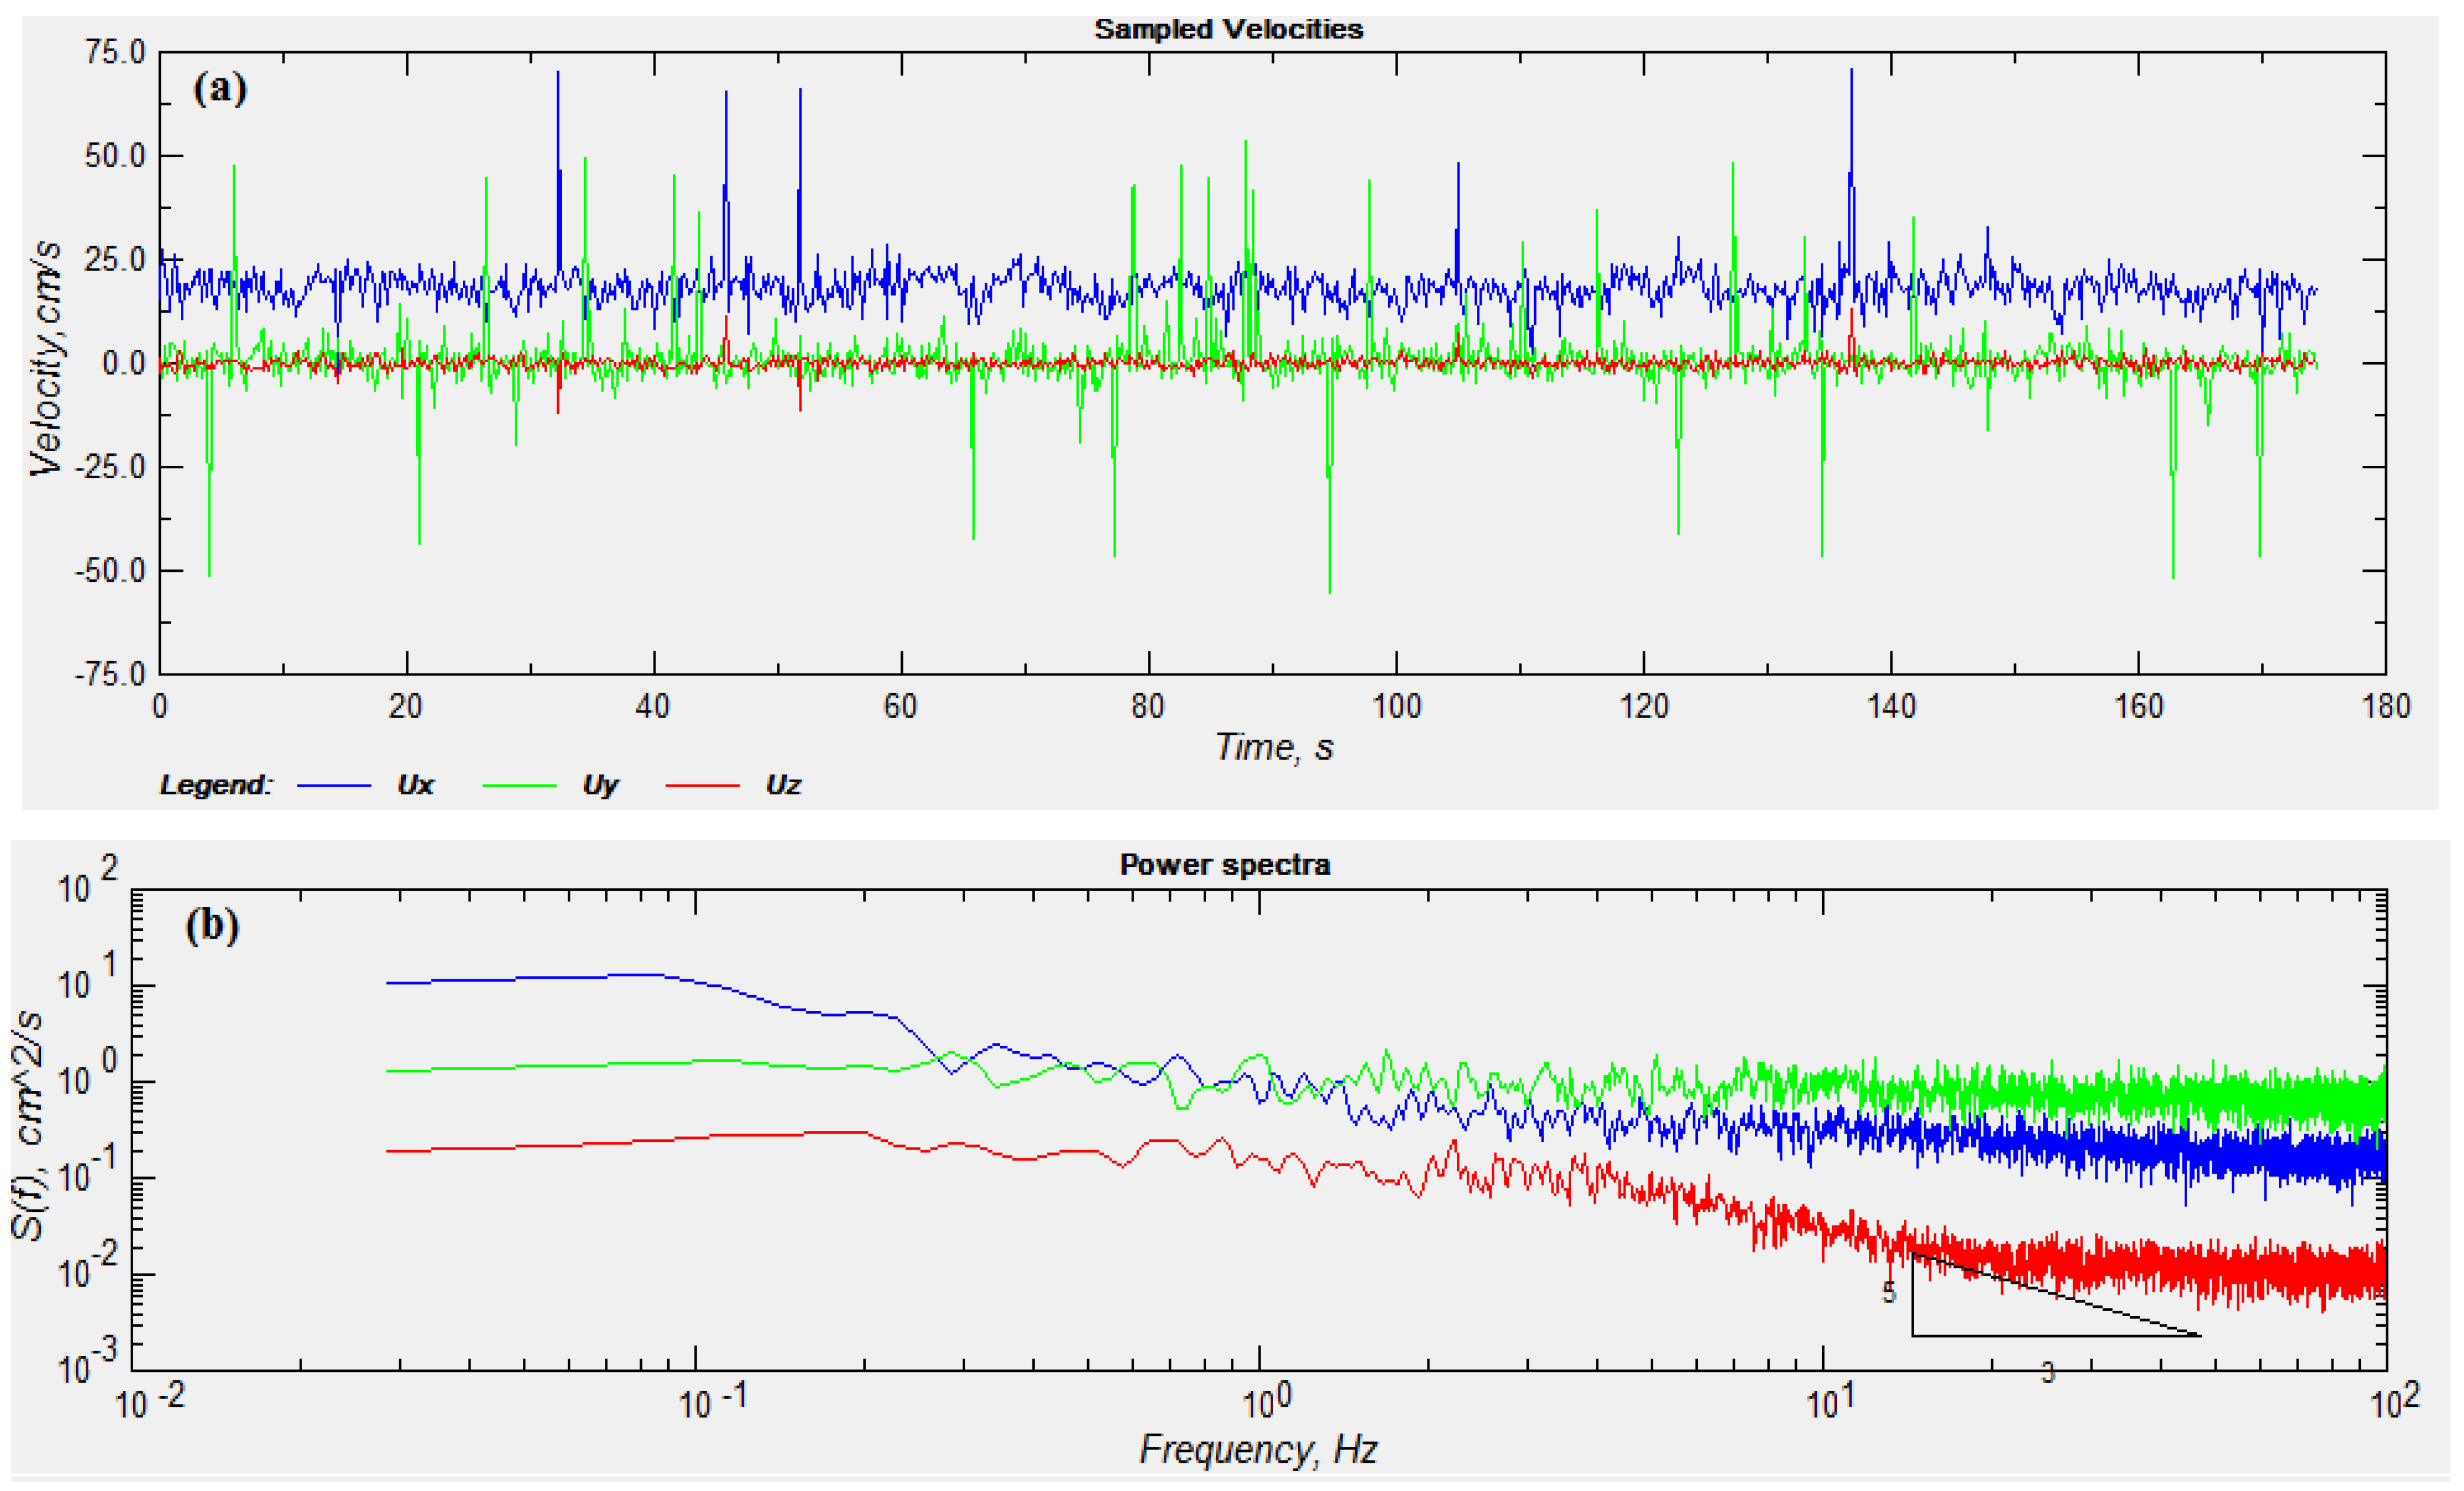
Figure 3a shows the trends of the instantaneous velocities measured by the ADV and demonstrates that ADV data have spikes due to the interference between the reflected and transmitted pulses. The velocity power spectra
Fuu(f) at a vertical distance of 10 mm from the channel boundary (
z = 10 mm) were calculated using the discrete fast Fourier transform method, and the profiles of
Fuu(f) against frequency
f are displayed in
Figure 3b. From
Figure 3b, it can be inferred that the velocity power spectra of contaminated (spike) data in the inertial sub-range do not agree with Kolmogorov’s −5/3 law. Therefore, an acceleration threshold method was applied to eliminate the spikes from the measured data [
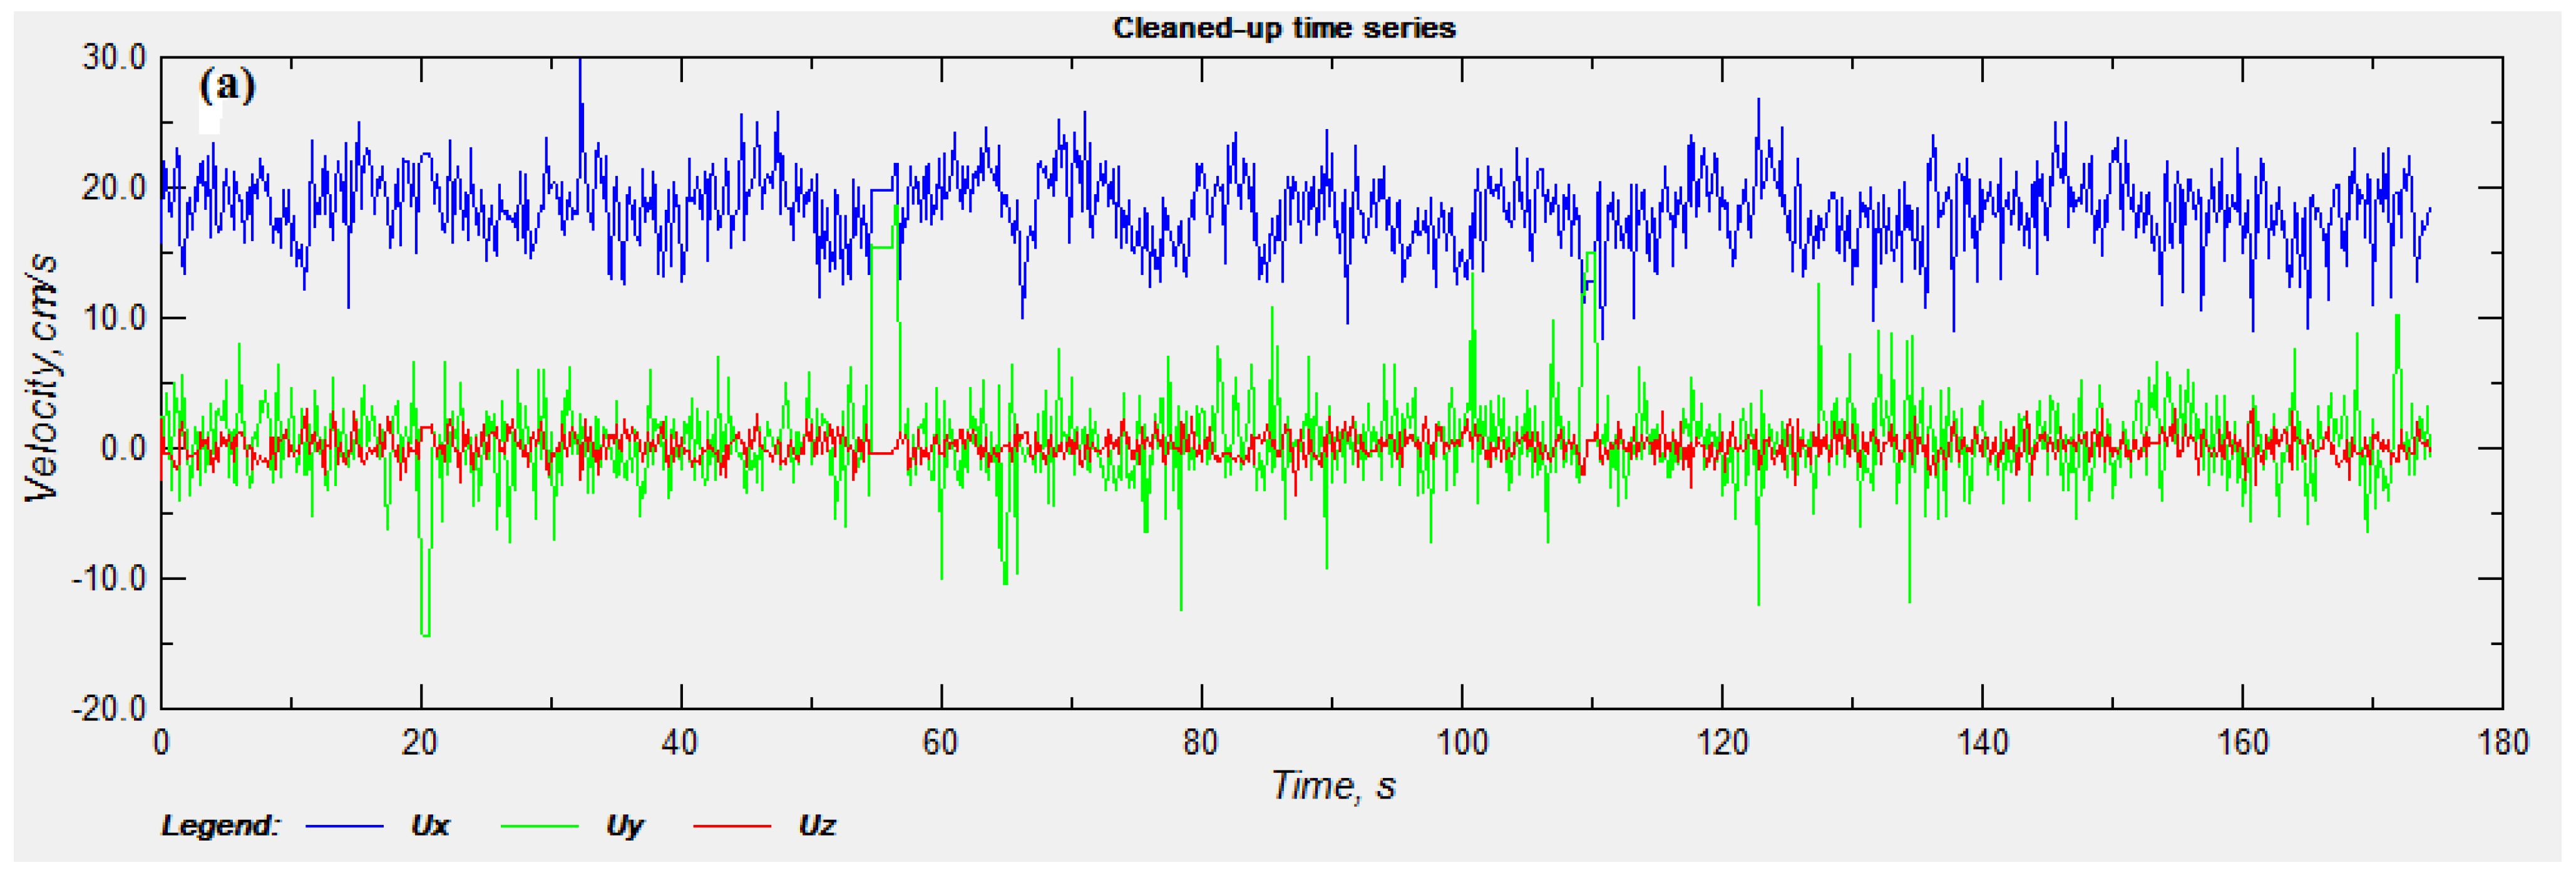
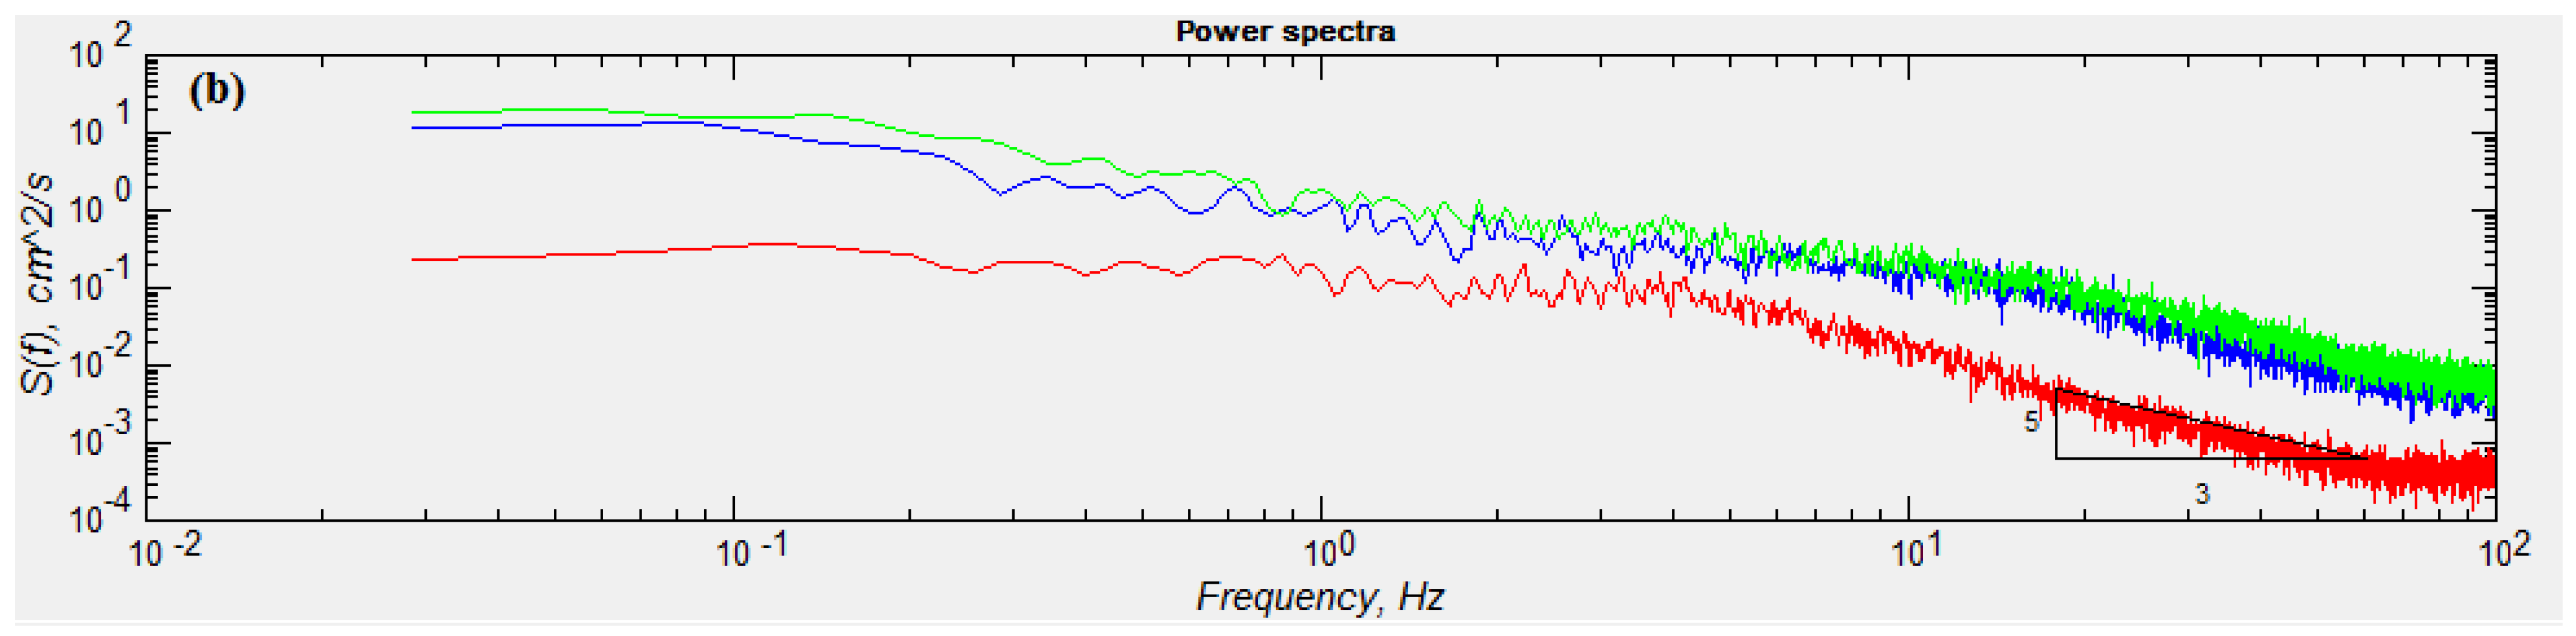
27]. In this method, the signal to noise ratio (SNR) and the correlation value were maintained as 15 and 70, respectively. Moreover, particular effort was made to provide the precise power spectral density in flow subjected to high velocity fluctuation. The results show that the cleaned-up velocity data trends are free from spikes and noise components (
Figure 4a). Additionally, the velocity power spectra of the cleaned AVD datasets fulfil the Kolmogorov −5/3 law in the inertial sub-range of frequency that occurs for frequencies
f > 1 Hz (
Figure 4b). These features corroborate the adequacy of the ADV measurements in no-seepage and seepage flows.
3. Results and Discussion
In order to detect the flow characteristics when downward seepage occurs and at moderate Reynolds number, turbulent flow parameters, including the time-averaged velocity, Reynolds shear stresses (RSS), turbulence intensity, and the skewness and kurtosis of velocity fluctuations, were measured at the centerline of the channel. The structure of turbulence was achieved based on the ADV data.
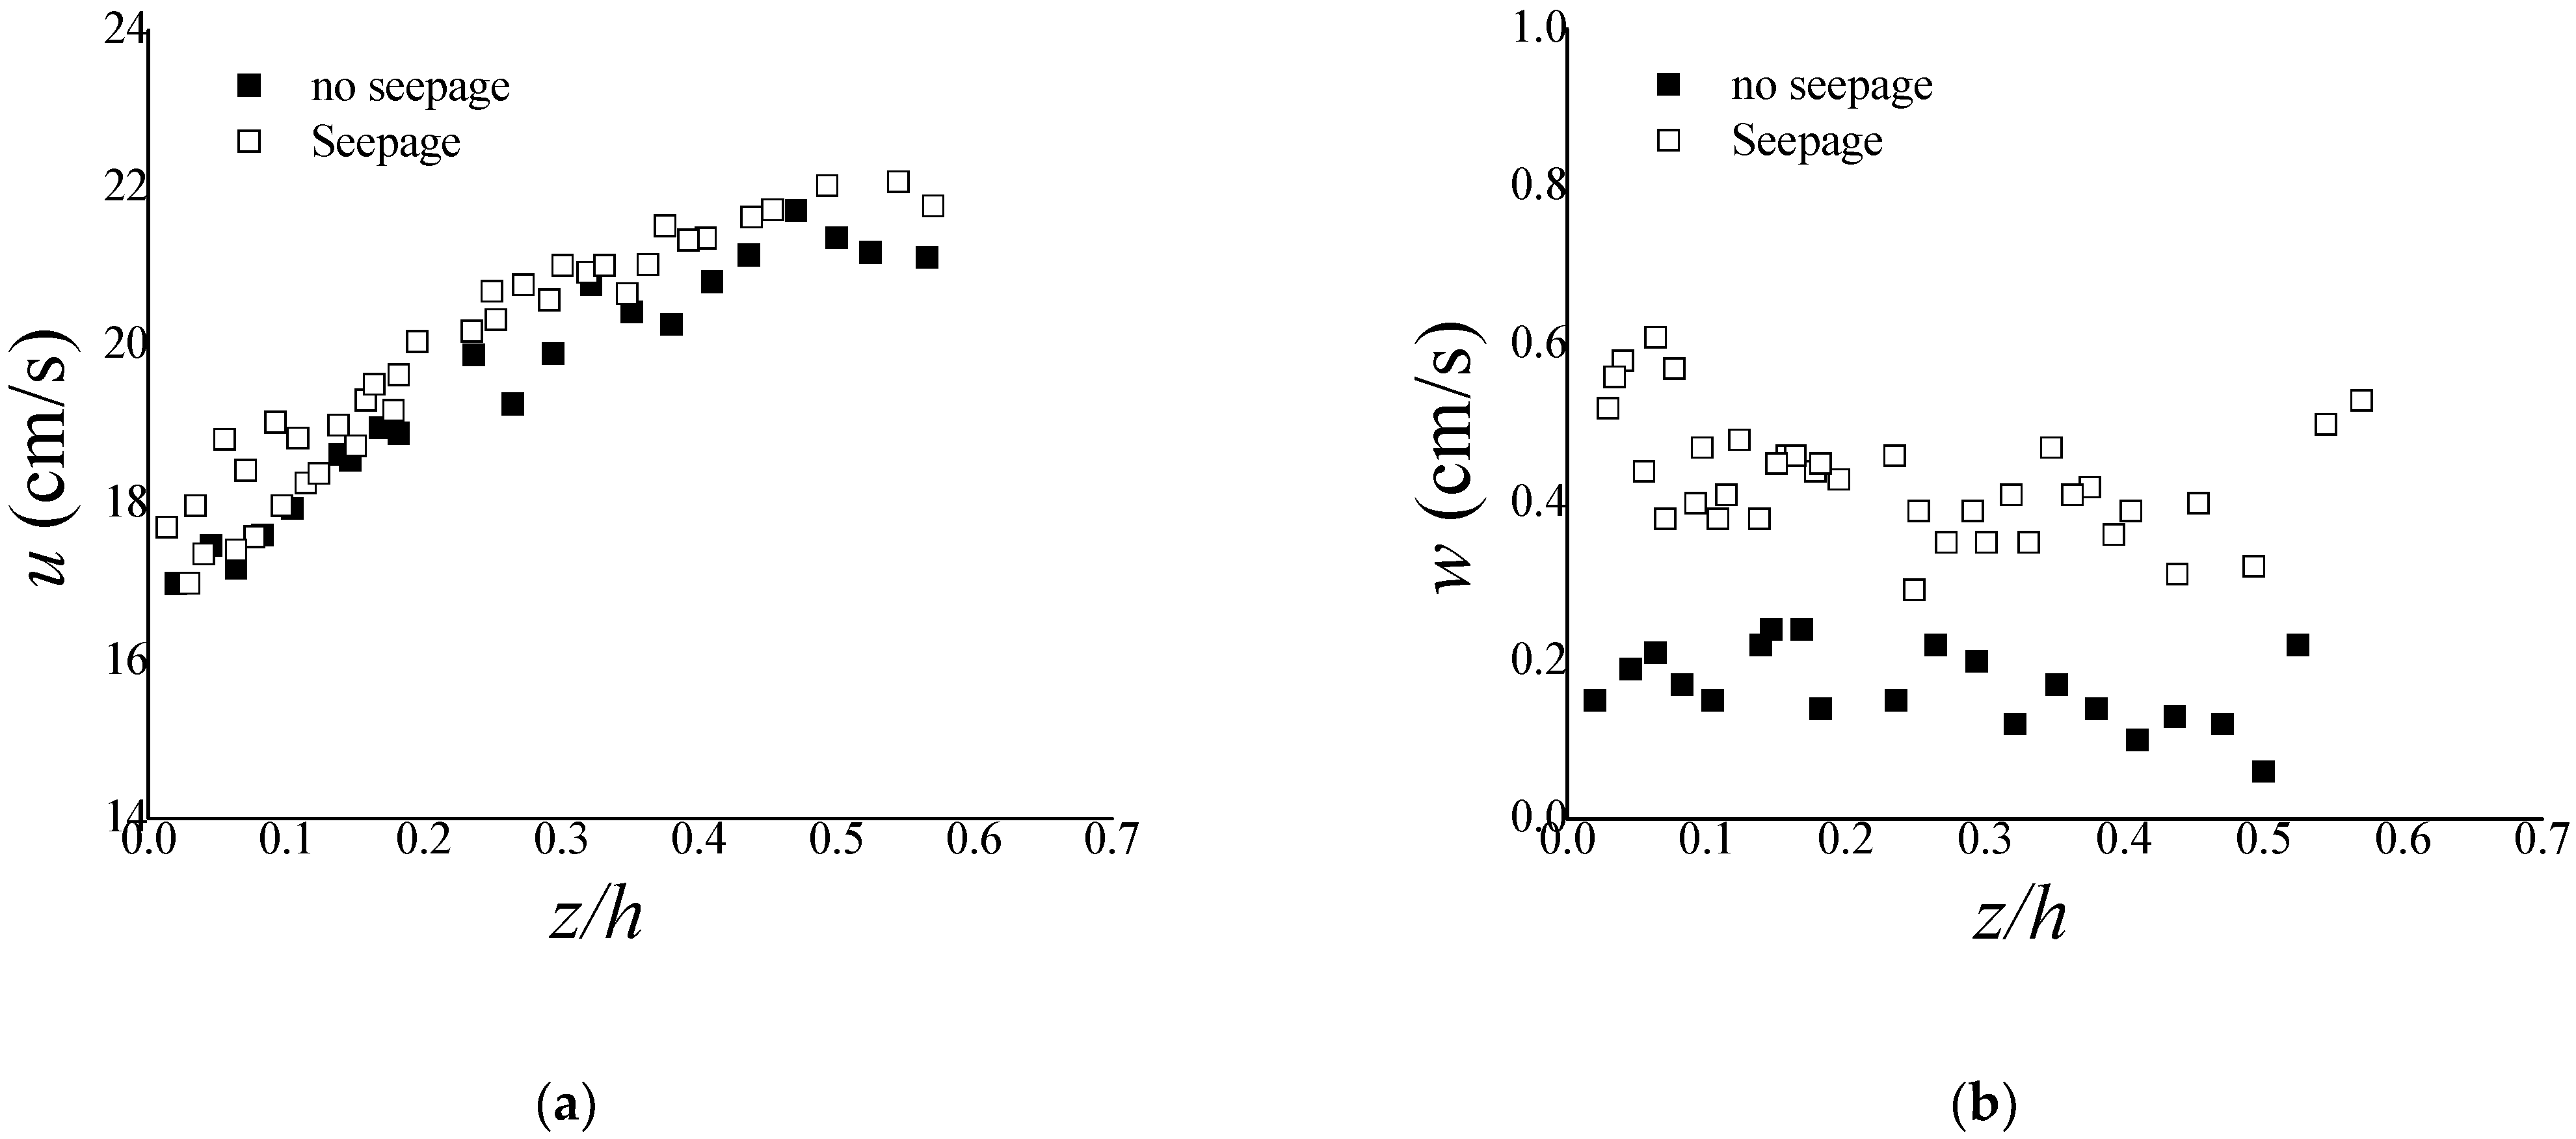
Figure 5 presents the outlines of the time-averaged velocities with the non-dimensional flow depth,
z/
h (where
z is the distance from the bed surface and
h is the flow depth), for all the experiments. The solid and open squares relate to no seepage and downward seepage, respectively. It can be seen that the vertical velocities (
w) were more affected by seepage than the streamwise velocities (
u). The experimental data almost overlap in the case of
u, while they are far apart in the case of
w, denoting an increase in turbulence level. Previous investigations on the downward seepage, although in different contexts from the one under consideration, have also shown that the velocity profile moves downward and, hence, a higher velocity is achieved in the near-bed region [
8,
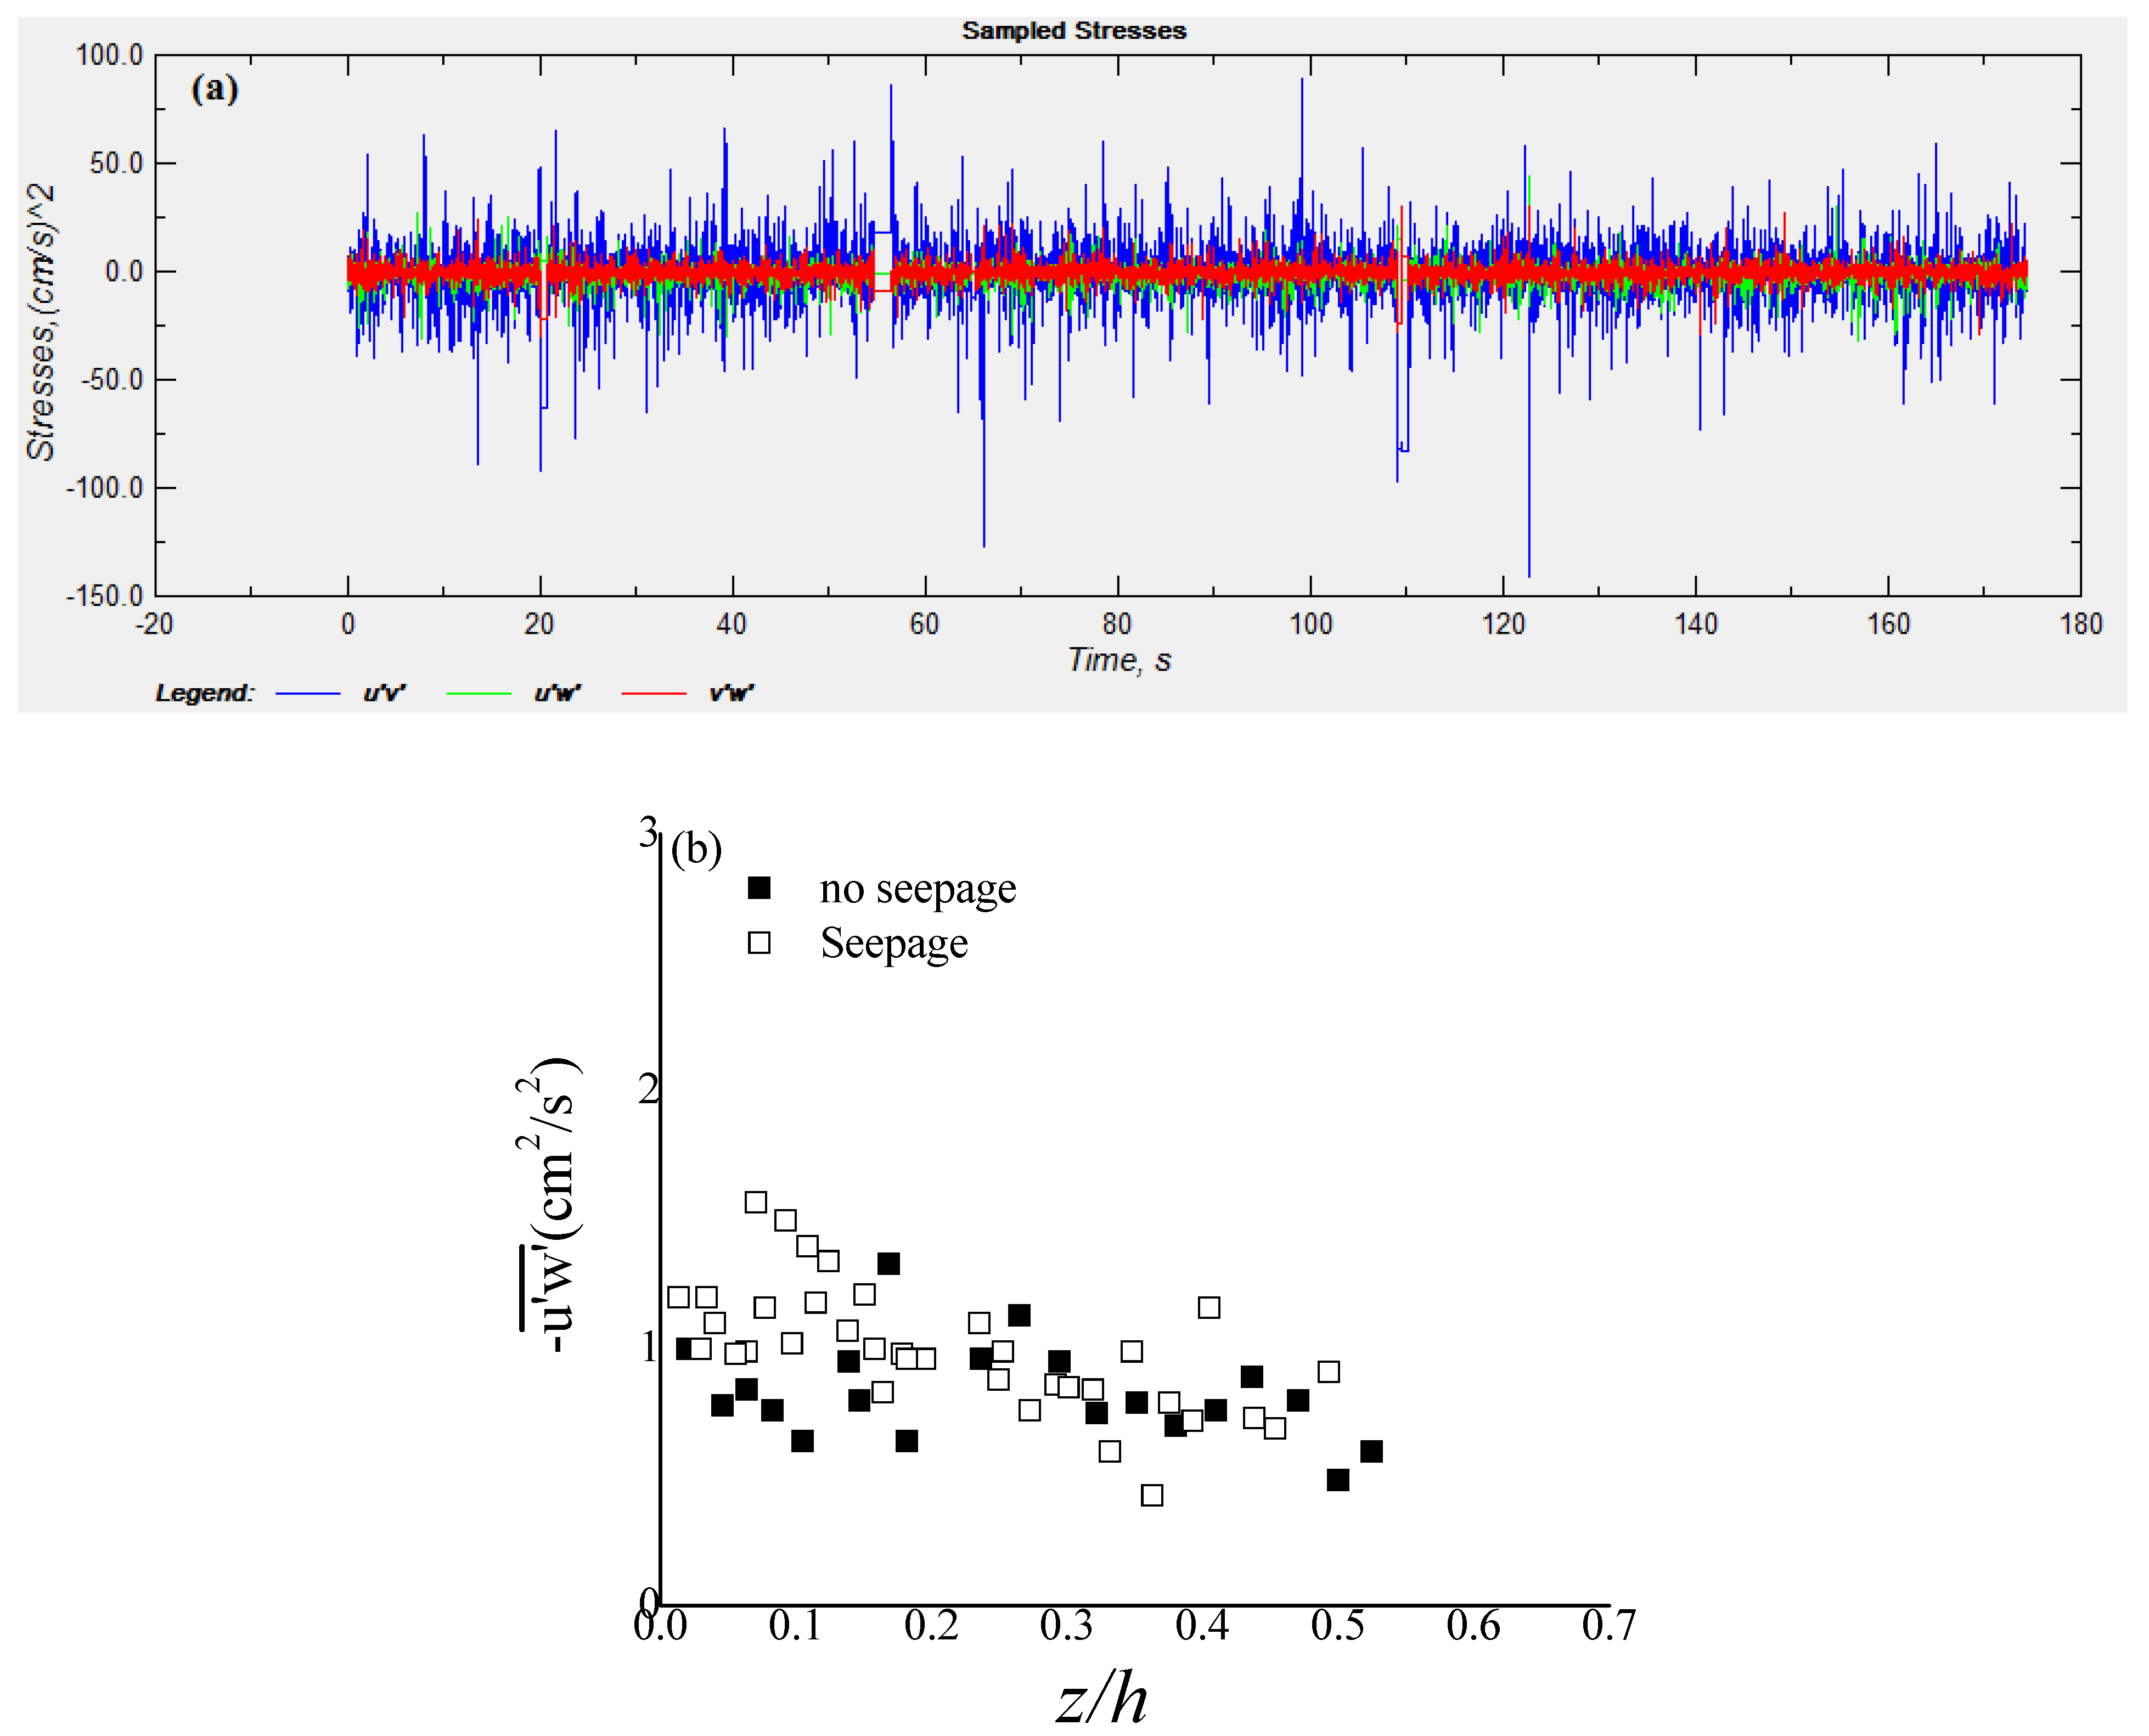
16]. RSS values were achieved for both no-seepage and downward seepage runs. Specifically, the trends for the values of RSS with time at
z = 0.05
h and the vertical profiles of RSS for the non-dimensional flow depth
z/
h are presented in
Figure 6. Data for no seepage and downward seepage are represented by solid and open squares, respectively. In general, it was found that RSS increases towards the channel boundary, which specifies the transfer of greater momentum between the flow and the sediment bed. The RSS attains its peak magnitude in the vicinity of the inner layer and then it reduces in the direction of the channel bed because of the presence of viscous force or a roughness sub-layer. The vertical profiles of RSS are similar for no seepage and downward seepage, though with different magnitude. In particular, the magnitude of near-bed (
z/
h < 0.15) RSS is amplified in the case of seepage, indicating greater momentum transfer between the flow and the sediment bed. As a result, the turbulence increases when downward seepage occurs. It can also be observed in the literature [
1,
8] that downward seepage increases the RSS, which leads to the mobility of sediment particles, in contrast to the case of no seepage.
The vertical distributions of
σ(
u) and
σ(
w) for no seepage and downward seepage are presented in
Figure 7. Data for no seepage and downward seepage are signified by solid and open squares, respectively. The peak values of
σ(
u) and
σ(
w) were observed close to the channel boundary while the least values were found near the liquid free surface owing to the decreasing trend of RSS. At the near-bed (
z/
h < 0.15)
σ(
u) and
σ(
w) increase when seepage occurs, indicating that seepage would amplify the velocity fluctuations in the vicinity of bed surface. This observation is in agreement with previous researches [
20,
28], although carried out in different environments. The outlines of turbulence intensities are substantial in the inner zone of the flow and the degree of near-bed (
z/
h < 0.15) streamwise and vertical turbulence intensity was found increased approximately up to 20% and up to 12%, respectively, when downward seepage occurs.
Figure 8 displays the individual profiles of the skewness for no seepage and downward seepage. In this case, a clear distinction between no seepage and downward seepage is not evident, especially in
Figure 8b. However, the following comments could be made.
S(
u) and
S(
w) start with small positive and negative values in the vicinity of the bed surface for both flows subjected to no seepage and seepage. However, the positive value of
S(
u) at near-bed flow is (slightly) higher in the case of downward seepage, signifying the increasing trends of the streamwise flux of Reynolds normal stress, which increases turbulence in the seepage bed. The influence of the downward seepage also increases the magnitude of the negative values of
S(
w) within the near-boundary zone. This would indicate the surge in vertical flux of the vertical Reynolds normal stress. The skewness likewise highlights the real characteristics of the bursting events [
28], which can significantly change the existing hydrodynamic conditions. In this regard, Bialik [
29] discussed the effects of turbulent events on the initiation of salting grain movement at the near-bed, and observed that the sweeps and outward interactions had a key influence on the particle’s entrainment. As already remarked above, it is clear from
Figure 8 that
S(
u) and
S(
w) are, respectively, positive and negative in the vicinity of the bed surface, suggesting the dominance of sweep events in this region. Away from the bed, the governance of ejection events causes
S(
u) to be negative and
S(
w) to be positive for the rest of the flow depth. Hence, the current results would provide an indication that a streamwise acceleration is linked with a downward flux producing sweep events, whereas a streamwise acceleration is linked with a flux in the upstream direction causing ejection events.
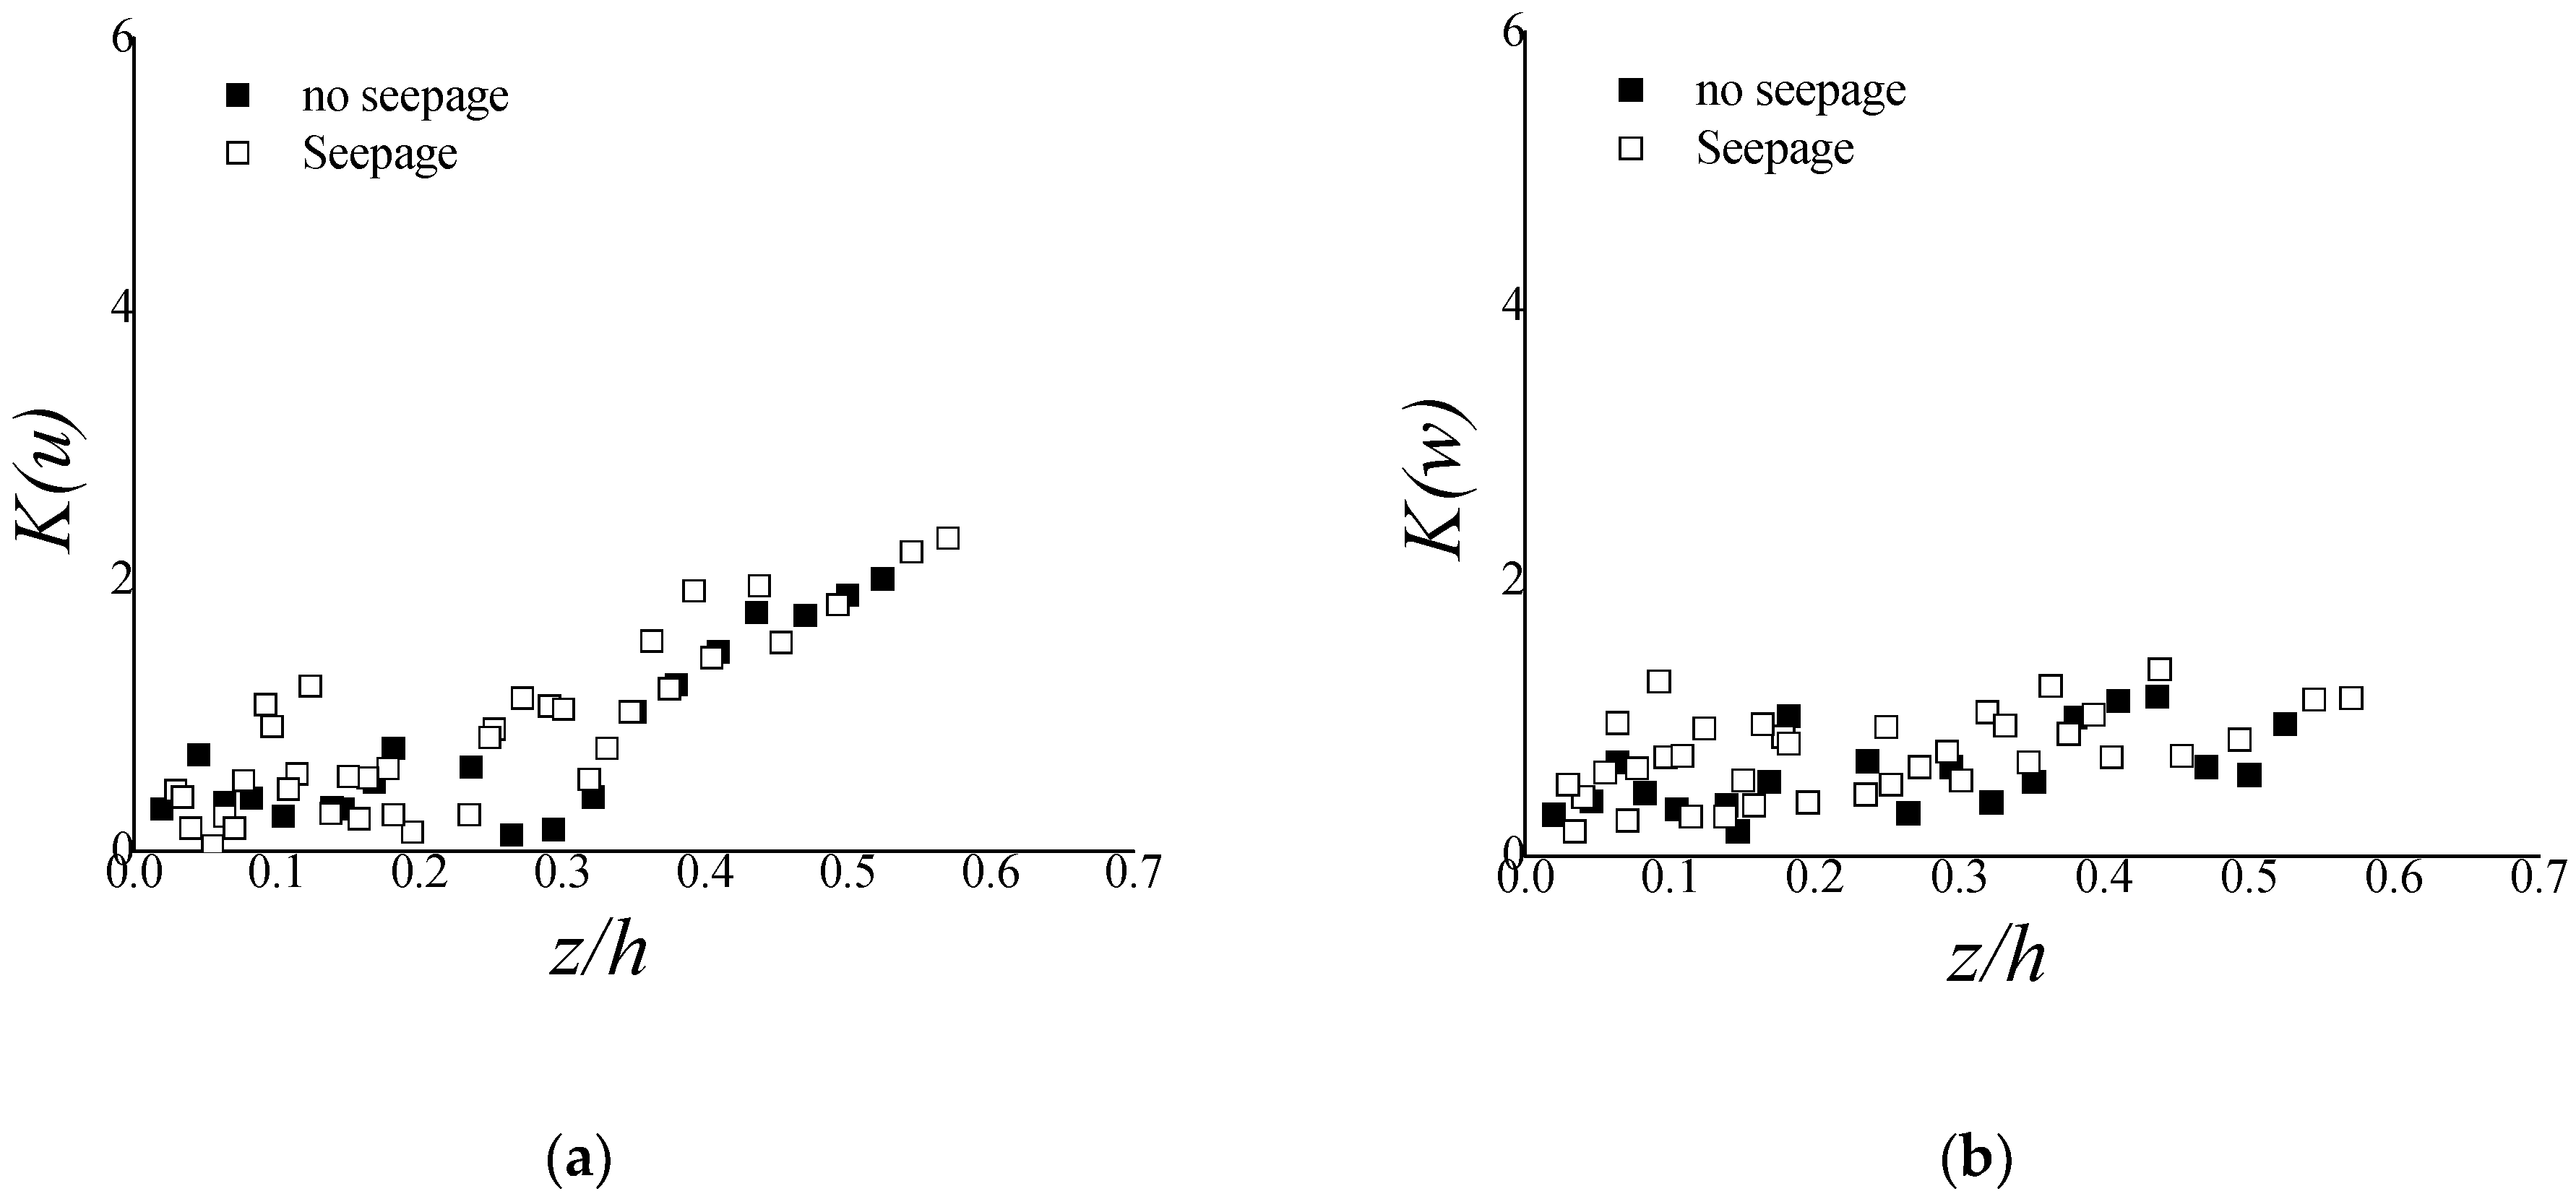
The fourth-order correlation, termed kurtosis, characterizes the intermittency of turbulence. The variations in the kurtosis [
,
] for no seepage and in the presence of downward seepage are presented in
Figure 9 with respect to
z/
h, where
K(
u) and
K(
w) indicate the kurtosis in the streamwise and vertical direction, respectively. The magnitude of
K(
u) and
K(
w) should be three in the case of isotropic turbulence with Gaussian distribution. However, on the basis of normal distribution, Batchelor [
30] and Jiménez [
31] suggested that the magnitude of
K(
u) should be 2.86 and 2.85, respectively.
Figure 9 shows that the values of the kurtosis
K(
u) are inclined to increase beyond
z/
h = 0.2–0.3, in the main flow region. Therefore, the obtained values indicate a certain deviation from the normal distribution and a higher level of turbulence intermittency was observed in the main flow region, which confirmed that sweep and ejection are the responsible bursting events that play a strong intermittent role in turbulence production. These results appear consistent with those of Nikora et al. [
32] and Bialik et al. [
33] in their modeling of saltating particles’ diffusion in turbulent water flow; the high values of the skewness and kurtosis reflected high levels of intermittency in the particle trajectories. Remarkably,
K(
u)
> 3 implies a profile with a peaky signal pattern of intermittent turbulence events, whereas
K(
u)
< 3 would imply a flat pattern. The experimental values of
K(
u) lie between 0 and 2.4 in the near-bed flow, which suggests that the signal inclines to yield a flatter pattern for the flow interacting with the bed surface. Within the near-boundary region, the averaged values of
K(
u) and
K(
w) are larger in the presence of downward seepage than in the case of the no-seepage bed. This indicates that the downward seepage process exacerbates the degree of turbulence intermittency at the near-bed flow.
In the present study, the experimental results conforming to the seepage are matched with the results obtained in previous studies [
1,
3] that (a) the time-averaged velocity distribution is inclined by the seepage, as displayed in
Figure 5; (b) the downward seepage improves the turbulent intensity; (c) the Reynolds shear stress close to the channel bed increases with seepage. The novel aspect of the present study compared to the previous studies is the use of a low seepage velocity, which is practically observed in a stream, canal, or river where the fluid flows with a low flow velocity. If the seepage velocity is small, it may affect the hydrodynamic part only. The underlying mechanisms of flows in clear-water conditions and a mobile bed are reasonably dissimilar in view of the relations of sediment transport with the liquid and those with the bed. At high Reynolds number (mobile bed condition), bed load transport is significantly high, while it is almost negligible in the present case.


