Abstract
A common problem in cold regions is the influence of freeze–thaw damage on the stability of rock engineering. Therefore, a series of uniaxial compression tests of sandstone after freeze–thaw treatment was carried out in this study. The purpose was to express the initial damage of rock after freezing and thawing treatment more quantitatively and to study the influence of freeze–thaw damage on the rock crack growth process to provide some reference for the stability evaluation of rock engineering in cold regions. The results showed that the number of freeze–thaw cycles and the lowest freeze–thaw temperature had a significant effect on the rock damage and characteristic stress value, and the number of cycles had a more obvious effect: with an increase in the number of freeze–thaw cycles and a decrease in the freeze–thaw temperature, the initial damage DNT had an increasing trend. In addition, the intrinsic mechanism of the freeze–thaw effect on the rock characteristic stress was explained from the perspective of a meso-mechanical mechanism. From the inversion results of the acoustic emission (AE) moment tensor, it was found that the proportion of tensile cracks gradually increased with the increase in the initial damage of the rock in the stable and unsteady stages of the rock crack propagation.
1. Introduction
With the expansion of economic activities around the world, rock stability problems in projects such as railway construction, tunnel excavation, resource extraction, and slope treatment in cold regions have become an urgent problem to be solved [1,2,3,4]. For this reason, many scholars have carried out a series of studies on the deformation and failure characteristics of rocks under freezing and thawing conditions in cold regions.
A general law is that the strength and mechanical properties of rocks will be significantly degraded under freezing and thawing conditions [5,6,7]. The main factors that affect the process of rock damage under freeze–thaw conditions include saturation, porosity, pH value, and the number of freeze–thaw cycles [8,9,10,11]. Among these factors, freeze–thaw cycles have the greatest impact on the mechanical properties of rocks [12,13,14]. Therefore, most scholars focus their studies on the influence of the number of freeze–thaw cycles on the strength and mechanical properties of rocks. The main conclusion is that, with an increase in the number of freeze–thaw cycles, the uniaxial compressive strength and elastic modulus of rock decrease significantly [15,16,17,18]. Fu et al. [19] carried out a series of triaxial experiments by using red sandstone samples and obtained the influence of freeze–thaw cycles and confining pressure on rock strength and mechanical properties. The dynamic mechanical properties of rocks after freeze–thaw cycles also change significantly, including the dynamic compressive strength, tensile strength, and elastic modulus [20,21,22].
The deterioration mechanism of freeze–thaw cycles on rock mechanical properties is as follows. When the rock material in the saturated state is frozen, the volume of water stored in the fracture expands by 9%. This expansion effect causes a large tensile stress and makes the original cracks propagate further. After thawing, the water will flow through the fractured cracks, further promoting the damage of the rock [23,24,25]. Therefore, the effect of the freeze–thaw cycles can be understood as the formation of initial damage to the rock. The mechanical response of the rock during the loading process can be regarded as the coupling effect of the initial damage caused by freeze–thaw cycles and the damage caused by the increased stress. The initial damage caused by freeze–thaw cycles can be observed in a variety of ways, including P-wave velocity, X-ray CT, SEM, and NRM [26,27,28]. By assuming that the strengths of the micro-elements inside the rock obeys the Weibull distribution, many researchers have established the stress–strain constitutive relationship of rocks after freeze–thaw cycles [9,26]. Although these studies have considered the D0 caused by the effect of freeze–thaw cycles and can be in good agreement with experimental results, the determination of D0 often relies on empirical formulas and cannot truly reflect the physical process of rock damage that is caused by freeze–thaw cycles. Therefore, it is necessary to select an appropriate physical parameter to quantitatively characterize the initial damage of rocks after freeze–thaw cycles.
During the loading process of rocks, the crack propagation stage can be mainly divided into three stages, that is, the microcrack nucleation stage, stable crack propagation stage, and accelerated crack propagation stage [29,30]. Accurately identifying the initial crack stress (σci), crack damage stress (σcd), and peak stress (σp) is of great engineering significance for judging the stability of rocks and predicting the failure of rocks. However, studies on the crack propagation stage of rocks are mainly focused on the conventional loading conditions, and there are relatively few studies on the rock crack propagation stage and the characteristic stress under the conditions of freeze–thaw cycles [31,32]. Microseismic monitoring technology has been widely used in actual rock engineering to ensure that engineering activities are carried out safely and effectively. AE monitoring technology is basically the same as the principle of microseismic monitoring and is used to monitor the damage and failure of rocks in indoor laboratories [33,34,35]. AE is a kind of elastic waveform that is emitted when the internal elements of the rock rupture, which is closely related to the damage process of rocks [36]. Therefore, conducting indoor experiments to study the AE characteristics during the process of rock damage and fracture under freezing and thawing environments is also of great significance for the stability prediction of rock engineering in cold regions.
In this study, we quantitatively investigated the relationship between the initial damage DNT caused by freeze–thaw cycles and the number of freeze–thaw cycles by measuring the P-wave velocity. At the same time, the influence of the lowest freeze–thaw temperature on DNT was also obtained. According to the stress–strain curve of rocks after freeze–thaw treatment, the change law of the characteristic stress of rocks with the number of freeze–thaw cycles and freeze–thaw temperature was determined. Meanwhile, AE technology was used to monitor the rock fracture information for each sandstone sample after the freeze–thaw treatment to provide a theoretical basis for judging the damage and fracture of the rock in an actual engineering application.
2. Samples Descriptions and Test Setup
2.1. Sandstone Samples
Coarse yellow sandstone was selected for the research in this experiment, which was then processed into several standard cylindrical samples with a diameter of 50 mm and a height of 100 mm, as can be seen in Figure 1. The samples were mainly composed of granular mineral particles, showing obvious heterogeneity, but the differences between the samples were relatively small. The samples were polished at both ends within an error of 0.02 mm and there were no obvious natural cracks on the surfaces of the samples. Through the ultrasonic measurement method, the P-wave velocity difference between the samples was within 5%, thus ensuring the stability of the experimental results.
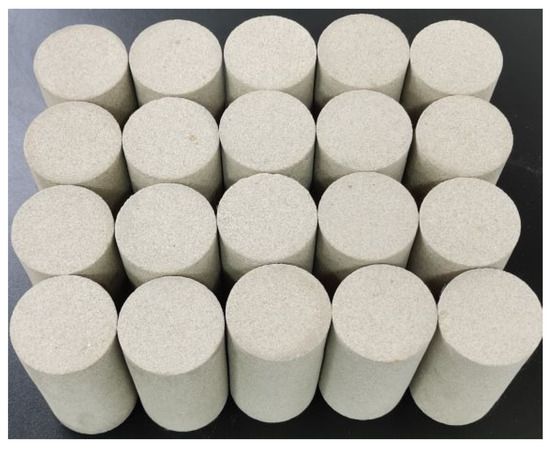
Figure 1.
Coarse sandstone samples.
The mineral composition of the sandstone in this experiment was measured using the XRD method. Through the measurement results, the main mineral composition of sandstone was found to consist of quartz, albite, and calcite, where their content percentages were 57, 20, and 14%, respectively. In addition, the sandstone also contained a small amount of microcline maximum minerals, muscovite minerals, and clinochlore minerals. As another important parameter of rock physical properties, the porosity of the rock was measured using mercury intrusion experiments. The porosity distribution of the sandstone is shown in Figure 2, where the porosity of the sandstone was about 11.64%.
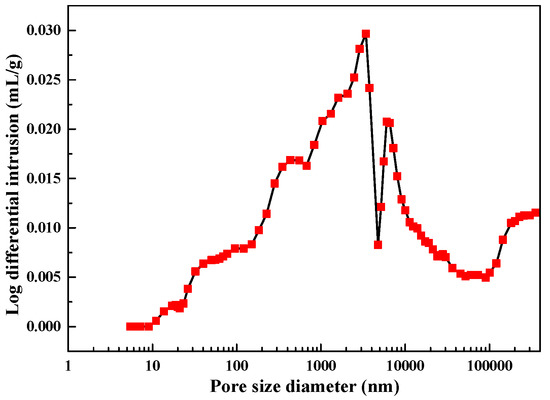
Figure 2.
Distribution diagram of the sandstone porosity.
2.2. Test Setup and Instruments Descriptions
In order to study the influence of the number of freeze–thaw cycles and the minimum freeze–thaw temperature on the initial damage of sandstone samples, as well as the law of crack propagation during the loading process under the influence of freeze–thaw action, a series of experimental steps were implemented:
- (1)
- The saturated sandstone samples were placed in a temperature- and humidity-controlled (THC) container; the temperature was set to −20 °C; and 0, 5, 10, 15, 20, 25, and 30 freeze–thaw cycles were performed. In addition, the minimum freeze–thaw temperature was set to −5, −10, −15, −20, −25, or −30 °C (Table 1), and the number of freeze–thaw cycles was 20 to study the influence of the minimum freeze–thaw temperature on the rock properties. The freeze–thaw cycle process is shown in Figure 3. The P-wave velocity was measured every five freeze–thaw cycles for each sandstone sample.
 Table 1. Freeze–thaw cycles and temperature setup.
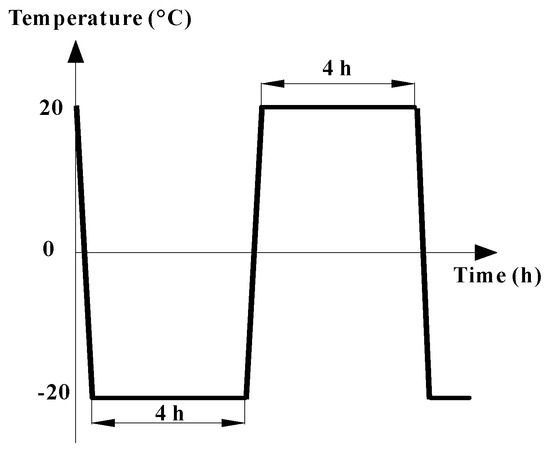 Figure 3. Temperature curve of one freeze–thaw cycle.
 - (2)
- The electronic universal testing machine that was used for the uniaxial compression experiments was a CMT5105 produced by MTS Corporation, with a maximum test force of 100 kN and a control accuracy within 0.01 kN. A loading rate of 0.02%/min under axial strain control was continually applied until the sandstone samples experienced failure in the uniaxial compression tests, where the axial strain and the lateral strain were measured by strain gauges.
- (3)
- A DS5-8B AE instrument with eight channels was used for the acquisition of AE signals during the rock-loading process. When the AE threshold was set as 40 dB, almost no interference signal appeared, which indicated that 40 dB was an appropriate threshold for the acquisition of rock fracture signals. Therefore, the AE threshold of these experiments was set to 40 dB. The AE signals obtained from the AE transducer were amplified by 40 dB to enhance the signal. Each data set that was used for signal processing contained 4096 data points with a sampling frequency of 500 kHz. The peak definition time (PDT), hit definition time (HDT), and hit locking time (HLT) were set to 50, 100, and 500 μs, respectively. The test instrument is shown in Figure 4.
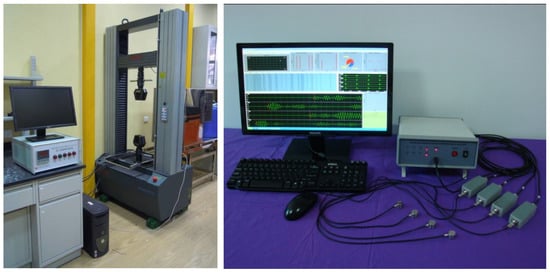 Figure 4. Electronic universal testing machine and AE instrument.
3. Experimental Results and Discussions
3.1. Evolution Law of DNT
DNT is defined as the initial damage before the loading process with a minimum freezing temperature T after N freeze–thaw cycles. If it is assumed that the rock is an isotropic material that is composed of a rock matrix and microcracks, the ultrasonic velocity can be used to define the damage variable [37,38]:
where V0 is the initial P-wave velocity of the rock, VNT is the P-wave velocity of the rock at the lowest freezing temperature T after N freeze–thaw cycles, and DNT is the damage variable of the rock. In order to study the effect of the number of cycles and the lowest freeze–thaw temperature on the P-wave velocity and damage after freezing and thawing, the P-wave velocity was measured after every 5 cycles, and the P-wave velocity at each freeze–thaw temperature was measured after 20 freeze–thaw cycles. The measurement results are shown in Table 2 and Table 3.
Table 2.
P-wave velocity after different numbers of freeze–thaw cycles with a freeze–thaw temperature of −20 °C.
Table 3.
P-wave velocity after 20 freeze–thaw cycles with different freeze–thaw temperatures.
Due to the heterogeneity of the rock, in order to ensure the reliability of the experimental results, when the number of freeze–thaw cycles was N and the freeze–thaw temperature was T during the freezing and thawing process of the rock samples, the P-wave velocity values of at least three samples needed to be measured. Taking the freezing and thawing temperature of −20 °C and 10 cycles as an example, using the average P-wave velocity of samples S-T1-10, S-T1-15, S-T1-20, S-T1-25, and S-T1-30 at the 10th cycle as the P-wave velocity under this condition produced a relatively stable result. As for the condition of a freeze–thaw temperature of −20 °C and 30 cycles, it was also necessary to measure the average of the P-wave velocity of three samples; therefore, samples S-T1-30-1 and S-T1-30-2 were added, and the sample with the P-wave velocity at the middle value was named S-T1-30. The measurement results are shown in Table 2 and Table 3. In the subsequent uniaxial compression experiments, the samples that had the middle P-wave velocities were selected for the experiments.
In order to further study the relationship between the damage variables and the number of freeze–thaw cycles and the freeze–thaw temperature, the results were obtained using Equation (1) and Table 2 and Table 3, and are displayed in Figure 5 and Figure 6.
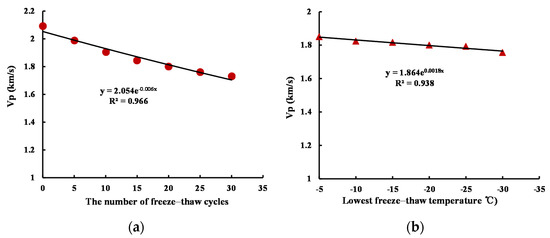
Figure 5.
Freeze–thaw cycles and lowest freeze–thaw temperature versus P-wave velocity: (a) with different freeze–thaw cycles (T = −20 °C); (b) with different lowest freeze–thaw temperatures (N = 20).
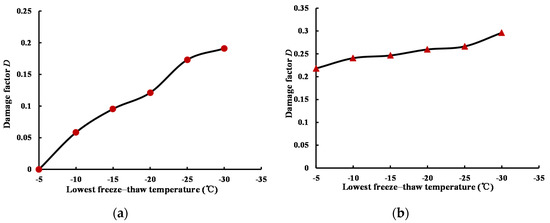
Figure 6.
Freeze–thaw cycles and lowest freeze–thaw temperature versus damage DNT: (a) with different freeze–thaw cycles (T = −20 °C); (b) with different lowest freeze–thaw temperatures (N = 20).
According to Figure 4, the relationship between the P-wave velocity and the number of freeze–thaw cycles under the condition of the lowest freeze–thaw temperature of −20 °C was found to be
According to Figure 5, the relationship between the P-wave velocity and the lowest freeze–thaw temperature when the number of freeze–thaw cycles was set to 20 was found to be
Based on Equations (2) and (3), it can be roughly concluded that the P-wave velocity at any number of cycles and freeze–thaw temperature was
Equation (5) shows that with the increase in the number of freezing and thawing cycles, the P-wave velocity of the rock gradually decreases, which was also shown by many research results. In the study of Takarli [39], the P-wave velocity of granite gradually decreased with the increase in the number of freeze–thaw cycles. From the results, this attenuation trend roughly conformed to the exponential attenuation trend, but it did not give a specific fitting relationship. In the study of Altindag et al. [26], the relationship between the P-wave velocity of ignimbrite and the number of freeze–thaw cycles was studied through the exponential fitting relationship, which was expressed as
From Equation (5), it can be seen that when the initial P-wave velocity was similar, the results obtained in this study were basically consistent with those found by Altindag et al. However, for other types of rocks that differ greatly from the initial P-wave velocities of this sandstone, this relationship needs to be further studied. Although it was mentioned in many studies that temperature is also one of the factors that affect the freezing and thawing process of rocks, there is still a lack of relevant quantitative characterization so far.
Then, after substituting Equation (4) into Equation (1), it was obtained that
In addition, it was obtained from the above analysis that the rock P-wave velocity and initial damage DNT were affected by the number of freeze–thaw cycles and the freeze–thaw temperature. As the number of cycles increased and the freeze–thaw temperature decreased, the initial damage DNT of the rock gradually increased. At the same time, the effect of the number of cycles on DNT was significantly greater than the freeze–thaw temperature.
3.2. Variation Law of Characteristic Stress
A large number of studies on the failure mechanism of rock samples showed that the rock samples experienced four stages during the loading process before reaching the peak stress, that is:
- (1)
- The crack closure stage, in which the original existing microcracks in the rock are closed and the stress–strain curve shows a concave shape. The crack closure stress is σcc, which can be determined from the point where the crack volumetric strain starts to be zero.
- (2)
- The elastic deformation stage, in which the stress increases linearly with strain and there are no new cracks generated until the stress increases to the initial crack stress σci. σci can be determined according to the point where the crack volumetric strain deviates from zero.
- (3)
- The stable crack growth stage in which crack propagation begins to appear inside the rock and σci is taken as the characteristic stress at the beginning of rock damage. The nonlinear increase of lateral strain is the main characteristic of the rock in this stage, which indicates that the cracks produced in this stage are mainly tensile cracks.
- (4)
- When the stress exceeds σcd, the rock reaches its unstable crack growth stage in which the crack propagation speed is obviously accelerated, accompanied by the interaction between multiple cracks. In many studies, σcd is seen as the long-term strength of rocks and its value can be determined from the point where maximum volumetric strain appears [29,39]. In practical engineering, σci and σcd are two important characteristic stresses, which are used to predict the short-term and long-term strength of a rock mass.
The crack propagation process of rock and the characterization method of characteristic stress are shown in Figure 7.
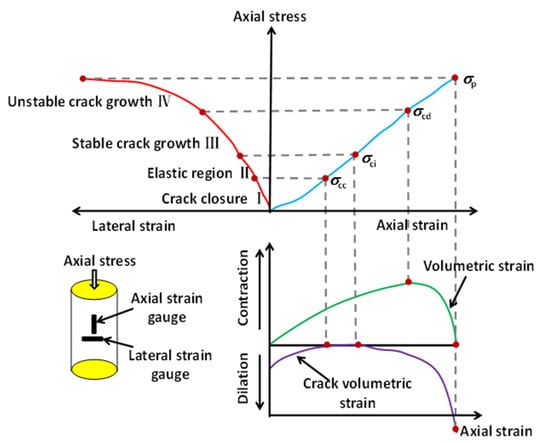
Figure 7.
Schematic diagram of a rock stress–strain curve and corresponding stress threshold [29,40,41,42].
Figure 6 shows the specific method to determine the characteristic stress. It was demonstrated that using characteristic stress is a reliable method to judge the damage and stability of rocks. To determine the characteristic stress of rocks, it is first necessary to calculate the volumetric strain and crack volumetric strain during the loading process. For rock under uniaxial compression, the volume strain and crack volume strain can be calculated using Equation (7):
where σ1 is the axial stress, εaxial is the axial strain, εlateral is the lateral strain, εV is the volumetric strain, is the crack volumetric strain, is the elastic volumetric strain, E is the elastic modulus, and μ is Poisson’s ratio.
After a series of uniaxial tests, the stress–strain curve of each sandstone sample was obtained, as can be seen from Figure 8.
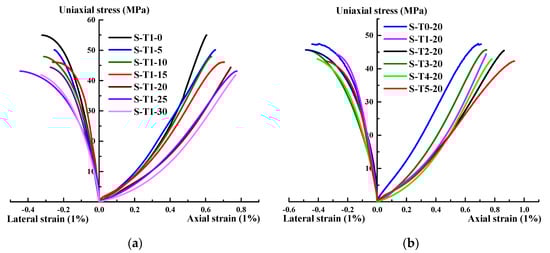
Figure 8.
Stress–strain curves of sandstone samples: (a) with different freeze–thaw cycles (T = −20 °C); (b) with different freeze–thaw temperatures (N = 20).
According to the method of determining the characteristic stress of the rock shown in Figure 7, using Equation (7) and the stress–strain curves of the sandstone samples, the characteristic stress of the sandstone samples after the treatment of different freeze–thaw cycles and the lowest freeze–thaw temperature was obtained, as shown in Figure 9.
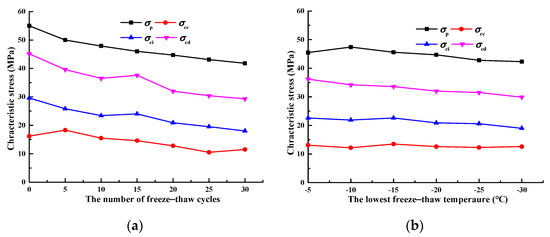
Figure 9.
Characteristic stress of the sandstone samples: (a) with different freeze–thaw cycles (T = −20 °C); (b) with different freeze–thaw temperatures (N = 20).
It can be seen from Figure 9 that the initial crack stress (σci), crack damage stress (σcd), and peak strength (σp) of sandstone samples gradually decreased with the increase in the number of freeze–thaw cycles and the decrease in the freeze–thaw temperature. In addition, there was no obvious variation law of crack closure stress (σcc). In order to further study the variation law of characteristic stress of the sandstone samples, the variation trend of the characteristic stress with the damage variable DNT was analyzed, where the results can be seen in Figure 10.
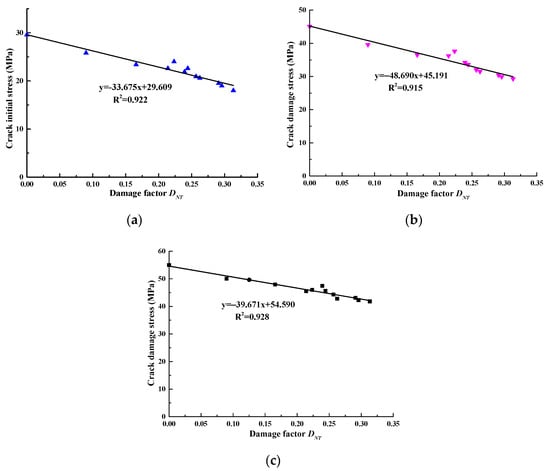
Figure 10.
The relationship between the characteristic stress of the sandstone samples and DNT: (a) initial crack stress σci; (b) crack closure stress σcd; (c) peak strength σp.
It can be seen from Figure 10 that the initial crack stress (σci), crack damage stress (σcd), and peak strength (σp) of the sandstone samples decreased significantly with the increase in the damage factor DNT. The law of characteristic stress of the sandstone samples as a function of DNT can be described as follows:
Combining the Equations (6) and (8), we obtained the characteristic stresses of the sandstone samples as a function of the number of freeze–thaw cycles N and the lowest freeze–thaw temperature T, which can be seen as follows:
From the experimental results of Tan [4], the uniaxial compression strength of granite samples with freeze–thaw cycles can be expressed by
It can be seen that Equations (9) and (10) have similar expressions, which shows the validity of using the initial damage to fit the rock strength formula. In addition, the influence of the freeze–thaw temperature is incorporated into Equation (9).
Figure 11 describes the mechanism of crack damage in the rock after the freeze–thaw treatment, from which we can see that the length and volume of internal microcracks of rock gradually increases. σcc is related to the closure of microcracks in the rock. It seems that the crack closure stress must gradually increase as the damage intensifies. However, the crack closure stress is also related to the shape of the crack. For example, for an elliptical crack, if the increase in crack volume is mainly along the long axis, and the increase in crack volume increases the ratio of the long axis to the short axis of the crack, then the increase in crack volume does not necessarily lead to an increase in crack closure stress.
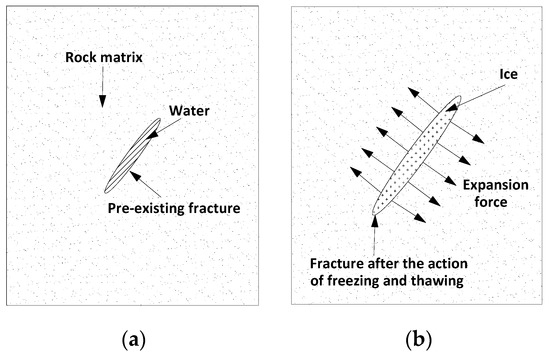
Figure 11.
Schematic diagram of the freeze–thaw influence on microcrack propagation inside the rock: (a) initial crack inside the rock; (b) crack growth under the freeze–thaw influence.
Studies on the initial crack stress σci have been widely discussed. Based on experimental observations, Lajtai et al. [43] obtained that in the middle stage of the compression test, only the lateral nonlinear strain of the rock changes rapidly, and the axial deformation of the cylindrical sample still maintains a linear change, indicating that the initial damage in the process of rock failure is caused by the extension of tensile cracks. Diederichs et al. [30] pointed out that the initial damage of rock during tunnel excavation is caused by the propagation of a tensile wing crack. Ashby and Hallam [44] introduced in detail the propagation process of wing cracks in a rock under compression stress in their research and deduced the theoretical model of initial crack stress σci under triaxial compression. The theory of Ashby and Hallam, which can be seen in Figure 12, has been adopted by many subsequent studies [29,30,45].
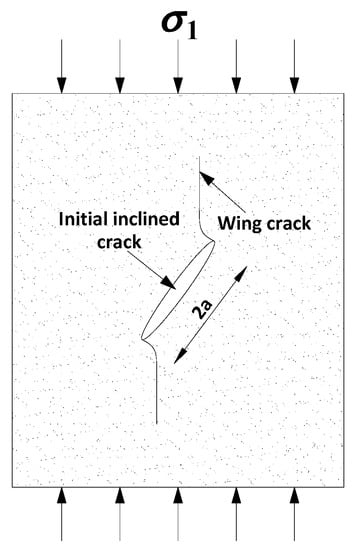
Figure 12.
Wing crack initiation under uniaxial compression.
According to the theoretical model of Ashby and Hallam, the initial crack stress σci under uniaxial compression can be expressed as follows:
where KIC is the fracture toughness of the rock, a is the half-length of the inclined crack, and μ is Poisson’s ratio. All the parameters, except for the half-length of the crack a, in Equation (11) are material constants. Therefore, the initial crack stress σci is mainly controlled by the inclined crack length. As the number of freeze–thaw cycles increases and the freezing temperature decreases, a gradually increases. Therefore, the initial crack stress σci decreases with the increasing value of DNT. Wing crack propagation process when multiple cracks interact each other can be seen as Figure 13.
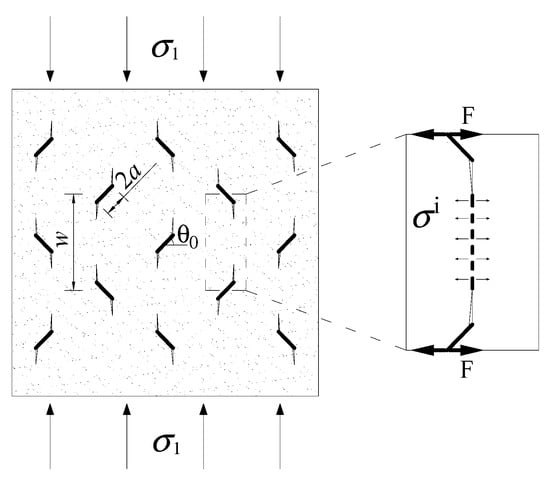
Figure 13.
Diagram of the interaction of multiple cracks.
In addition, from the point of numerical simulation, Song et al. [46] also found that multiple oblique cracks in the rock under uniaxial compression propagate through wing cracks. According to the models of Ashby and Sammis [47], the stress intensity factor at the tip of the wing crack under uniaxial compression is
where KI is the stress intensity factor at the tip of the wing crack, L is the length of the wing crack, θ0 is the angle of the oblique crack, and NA is the number of cracks per unit area. When KI equals the fracture toughness KIC, the wing crack continues to propagate. In Equation (11), the parameters are constants, except for L and σaxial, thus the wing crack length L can be determined via the axial stress σaxial. From the results of Ashby and Sammis and Equation (12), the general variation trend of the axial stress σaxial along with wing crack length L is shown in Figure 14.
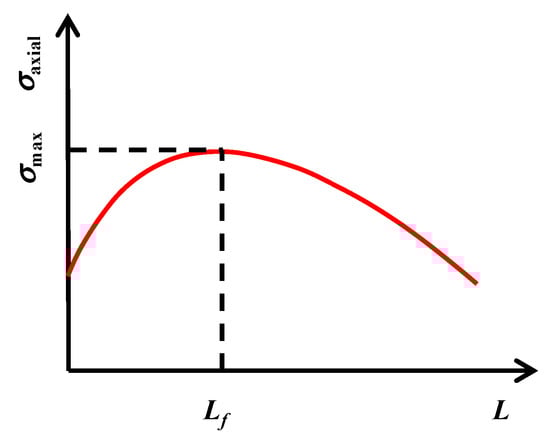
Figure 14.
Diagram of the axial stress σaxial as a function of the wing crack length L.
From Figure 14, it can be seen that before L reaches Lf, the axial stress σaxial must be increased to maintain the wing crack propagation. Furthermore, the wing crack propagation can be continued even if the stress σaxial no longer increases after L reaches Lf. Therefore, when the axial stress increases to σmax, the crack is unstable and propagates and σmax can be seen as the peak strength σp of the rock sample. From Equation (12), we can find that the σmax decreases with the increase of the initial inclined crack length a. Combining the result stating that a will increase with the increase of DNT, it can be concluded that σp will decrease with the increase of DNT.
In addition, from the research results of Kim et al. [48], it was found that the crack damage stress is about 0.70–0.82 of the peak strength, indicating that crack damage stress σcd will gradually decrease with the increase in DNT.
Therefore, it can be concluded that the essential reason for the effect of freezing and thawing on the change of the characteristic stress of the rock is that the length of the microcrack in the rock increases, thereby the initial crack stress σci, the crack damage stress σcd, and the peak strength σp gradually decrease with the increase in the number of freeze–thaw cycles and the decrease in the freezing temperature.
3.3. Analysis of the AE Source Mechanism
The crack model identification is determined based on the moment tensor analysis theory proposed by Ohtsu [49]. When the seismic source is a synchronous source, the body force in each direction of the unit body can be expressed using the moment tensor, which is expressed in Equation (13):
The various components of the Mij can be obtained using Equation (14):
where CS is the sensor coupling coefficient (determined before the test); Re(t,r) is the reflection coefficient of the seismic source wave; R is the distance vector between the seismic source and the sensor; r1, r2, and r3 are the components in the directional cosine matrix. Due to the symmetry, there are six unknown quantities in Equation (13) to be determined; therefore, at least six sensors are required during the test. According to the method suggested by Ohtsu, the classification of AE sources can be determined using
λ1, λ2, and λ3 are the three standardized eigenvalues of the moment tensor. The AE source is shear fracture when A ≥ 60%, the AE source is tensile fracture when A ≤ 40%, and it is mixed type when 40% < A < 60%. Taking samples S-T1-0 and S-T1-20 as examples, the results can be seen in Figure 15 and Figure 16.
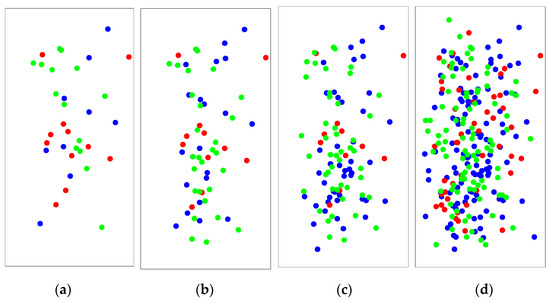
Figure 15.
AE spatial location and crack source identification of sample S-T1-0. A blue AE denotes a tensile crack, a red AE denotes a mixed type, and a green AE denotes a shear crack. (a) The results when σcc was reached; (b) the results when σci was reached; (c) the results when σcd was reached; (d) the results when σp was reached.
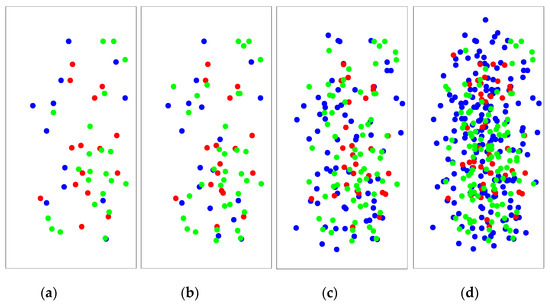
Figure 16.
AE spatial location and crack source identification of sample S-T1-20. A blue AE denotes a tensile crack, a red AE denotes a mixed type, and a green AE denotes a shear crack. (a) The results when σcc was reached; (b) the results when σci was reached; (c) the results when σcd was reached; (d) the results when σp was reached.
From Figure 15 and Figure 16, the tensile, shear and mixed AE percentages of sandstone samples at different crack propagation can be obtained, as shown in Table 4 and Table 5.
Table 4.
Different crack types in the process of rock failure of sample S-T1-0.
Table 5.
Different crack types in the process of rock failure of sample S-T1-20.
From the Table 4 and Table 5, it can be seen that the proportion of tensile cracks in the rock during the loading process gradually increased. In addition, the tension-type AE gradually increased with the increase in the freeze–thaw damage during the stable and unstable growth stages of the cracks, which indicated that the rock that experienced freeze–thaw damage for a long time was more prone to tensile failure.
4. Conclusions
In this study, by changing the number of freeze–thaw cycles and temperature, we carried out a series of experiments on coarse sandstone samples under uniaxial compression. The initial damage DNT and the crack propagation characteristics of sandstone samples after freeze–thaw treatment were obtained, which may have a certain significance for understanding rock mechanics properties in cold regions. From this research, the following conclusions were drawn:
- The increase in the number of freeze–thaw cycles and the decrease in temperature aggravated the initial damage of the rock. DNT increased exponentially with the increase in the number of freeze–thaw cycles and the decrease in freeze–thaw temperature, where the quantitative relationship between them is reflected by Equation (4).
- The characteristic stress of the rock had a good corresponding relationship with the initial damage DNT. The initial crack stress (σci), crack damage stress (σcd), and peak stress (σp) of the rock after the freeze–thaw treatment decreased linearly with the increase in DNT. The reason for this phenomenon was that as the initial damage DNT increased, the length of the original microcracks in the rock increased.
- In cold regions, such as tunnel excavation and other projects, rocks that have been damaged by freezing and thawing conditions for a long time are more prone to produce tensile cracks. Because the tensile strength of rocks is much smaller than the shear strength, the stability of such engineering rock masses needs to be paid more attention and certain measures should be taken to prevent potential disasters.
Author Contributions
Conceptualization, K.S. and Z.C.; methodology, Z.C.; software, K.S.; validation, K.S., Z.C. and R.P.; formal analysis, Z.C.; investigation, Z.C.; resources, R.P.; data curation, Z.C.; writing—original draft preparation, K.S.; writing—review and editing, Z.C.; visualization, R.P.; supervision, L.Z.; project administration, Y.Z.; funding acquisition, Z.C. All authors have read and agreed to the published version of the manuscript.
Funding
This work was supported by the Second Tibetan Plateau Scientific Expedition and Research Program (STEP) (grant no. 2019QZKK0904), the National Natural Science Foundation of China (grant no. 51727807), and the Fundamental Research Funds for the Central Universities (grant no. 2020YJSMT06).
Institutional Review Board Statement
Not applicable.
Informed Consent Statement
Not applicable.
Conflicts of Interest
The authors declare no conflict of interest.
References
- Zhang, X.; Lai, Y.; Yu, W.; Zhang, S. Non-linear analysis for the freezing-thawing situation of the rock surrounding the tunnel in cold regions under the conditions of different construction seasons, initial temperatures and insulations. Tunn. Undergr. Space Technol. 2002, 17, 315–325. [Google Scholar] [CrossRef]
- Grossi, C.M.; Brimblecombe, P.; Harris, I. Predicting long term freeze-thaw risks on Europe built heritage and archaeological sites in a changing climate. Sci. Total Environ. 2007, 377, 273–281. [Google Scholar] [CrossRef]
- Eslami, J.; Walbert, C.; Beaucour, A.L.; Bourges, A.; Noumowe, A. Influence of physical and mechanical properties on the durability of limestone subjected to freeze-thaw cycles. Constr. Build. Mater. 2018, 162, 420–429. [Google Scholar] [CrossRef]
- Tan, X.; Chen, W.; Yang, D.; Dai, Y.; Wu, G.; Yang, J.; Yu, H.; Tian, H.; Zhao, W. Study on the influence of airflow on the temperature of the surrounding rock in a cold region tunnel and its application to insulation layer design. Appl. Therm. Eng. 2014, 67, 320–334. [Google Scholar] [CrossRef]
- Ince, I.; Fener, M. A prediction model for uniaxial compressive strength of deteriorated pyroclastic rocks due to freeze–thaw cycle. J. Afr. Earth Sci. 2016, 120, 134–140. [Google Scholar] [CrossRef]
- Viklander, P. Laboratory study of stone heave in till exposed to freezing and thawing. Cold Reg. Sci. Technol. 1998, 27, 141–152. [Google Scholar] [CrossRef]
- Park, E.S.; Jung, Y.B.; Song, W.K.; Lee, D.H.; Chung, S.K. Pilot study on the underground lined rock cavern for LNG storage. Eng. Geol. 2010, 116, 44–52. [Google Scholar] [CrossRef]
- Chen, T.H.; Yeung, M.R.; Mori, N. Effect of water saturation on deterioration of welded tuff due to freeze-thaw action. Cold Reg. Sci. Technol. 2004, 38, 127–136. [Google Scholar] [CrossRef]
- Qu, D.; Li, D.; Li, X.; Luo, Y.; Kun, X. Damage evolution mechanism and constitutive model of freeze- thaw yellow sandstone in acidic environment. Cold Reg. Sci. Technol. 2018, 155, 174–183. [Google Scholar] [CrossRef]
- Bellanger, M.; Homand, F.; Remy, J.M. Water behavior in limestones as a function of pores structure: Application to frost resistance of some Lorraine limestones. Eng. Geol. 1993, 36, 99–108. [Google Scholar] [CrossRef]
- Mutlutürk, M.; Altindag, R.; Türk, G. A decay function model for the integrity loss of rock when subjected to recurrent cycles of freezing-thawing and heating-cooling. Int. J. Rock Mech. Min. Sci. 2004, 41, 237–244. [Google Scholar] [CrossRef]
- Hale, P.A.; Shakoor, A. A laboratory investigation of the effects of cyclic heating and cooling, wetting and drying, and freezing and thawing on the compressive strength of selected sandstones. Environ. Eng. Geosci. 2003, 9, 117–130. [Google Scholar] [CrossRef]
- Karaca, Z.; Deliormanli, A.H.; Elci, H.; Pamukcu, C. Effect of freeze-thaw process on the abrasion loss value of stones. Int. J. Rock Mech. Min. Sci. 2010, 47, 1207–1211. [Google Scholar] [CrossRef]
- Ruiz de Argandoña, V.G.; Rey, A.R.; Celorio, C.; Suárez del Río, L.M.; Calleja, L.; Llavona, J. Characterization by computed X-ray tomography of the evolution of the pore structure of a dolomite rock during freeze-thaw cyclic tests. Phys. Chem. Earth Ptart A Solid Earth Geodesy 1999, 7, 633–637. [Google Scholar] [CrossRef]
- Jamshidi, A.; Nikudel, M.R.; Khamehchiyan, M. Evaluation of the durability of Gerdoee travertine after freeze-thaw cycles in fresh water and sodium sulfate solution by decay function models. Eng. Geol. 2016, 202, 36–43. [Google Scholar] [CrossRef]
- Nicholson, D.T.; Nicholson, F.H. Physical deterioration of sedimentary rocks subjected to experimental freeze-thaw weathering. Earth Surf. Process. Landf. 2015, 25, 1295–1307. [Google Scholar] [CrossRef]
- Ruedrich, J.; Kirchner, D.; Siegesmund, S. Physical weathering of building stones induced by freeze-thaw action: A laboratory long-term study. Environ. Earth Sci. 2011, 63, 1573–1586. [Google Scholar] [CrossRef] [Green Version]
- Tan, X.; Chen, W.; Yang, J.; Cao, J. Laboratory investigations on the mechanical properties degradation of granite under freeze-thaw cycles. Cold Reg. Sci. Technol. 2011, 68, 130–138. [Google Scholar] [CrossRef]
- Fu, H.; Zhang, J.; Huang, Z.; Shi, Y.; Chen, W. A statistical model for predicting the triaxial compressive strength of transversely isotropic rocks subjected to freeze-thaw cycling. Cold Reg. Sci. Technol. 2018, 145, 237–248. [Google Scholar] [CrossRef]
- Liu, C.; Deng, H.; Zhao, H.; Zhang, J. Effects of freeze-thaw treatment on the dynamic tensile strength of granite using the Brazilian test. Cold Reg. Sci. Technol. 2018, 155, 327–332. [Google Scholar] [CrossRef]
- Wang, P.; Xu, J.; Liu, S.; Liu, S.; Wang, H. A prediction model for the dynamic mechanical degradation of sedimentary rock after a long-term freeze-thaw weathering: Considering the strain-rate effect. Cold Reg. Sci. Technol. 2016, 131, 16–23. [Google Scholar] [CrossRef] [Green Version]
- Zhou, K.; Li, B.; Li, J.; Deng, H.; Bin, F. Microscopic damage and dynamic mechanical properties of rock under freeze thaw environment. Trans. Nonferr. Metal. Soc. 2015, 25, 1254–1261. [Google Scholar] [CrossRef]
- Bayram, F. Predicting mechanical strength loss of natural stones after freeze-thaw in cold regions. Cold Reg. Sci. Technol. 2012, 83-84, 98–102. [Google Scholar] [CrossRef]
- Huang, S.; Liu, Q.; Cheng, A.; Liu, Y. A statistical damage constitutive model under freeze-thaw and loading for rock and its engineering application. Cold Reg. Sci. Technol. 2018, 145, 142–150. [Google Scholar] [CrossRef]
- Hori, M.; Morihiro, H. Micromechanical analysis on deterioration due to freezing and thawing in porous brittle materials. Int. J. Eng. Sci. 1998, 36, 511–522. [Google Scholar] [CrossRef]
- Altindag, R.; Alyildiz, I.S.; Onargan, T. Mechanical property degradation of ignimbrite subjected to recurrent freeze-thaw cycles. Int. J. Rock Mech. Min. Sci. 2004, 41, 1023–1028. [Google Scholar] [CrossRef]
- Li, J.; Kaunda, R.B.; Zhou, K. Experimental investigations on the effects of ambient freeze-thaw cycling on dynamic properties and rock pore structure deterioration of sandstone. Cold Reg. Sci. Technol. 2018, 154, 133–141. [Google Scholar] [CrossRef]
- Si, L.; Cao, Y.; Fan, G.; Wang, S. Study on fracture shape distribution characteristics and micromechanical properties of middling coal. AIP Adv. 2020, 10, 075324. [Google Scholar] [CrossRef]
- Cai, M.; Kaiser, P.K.; Tasaka, Y.; Maejima, T.; Morioka, H.; Minami, M. Generalized crack initiation and crack damage stress thresholds of brittle rock masses near underground excavations. Int. J. Rock Mech. Min. Sci. 2004, 41, 833–847. [Google Scholar] [CrossRef]
- Diederichs, M.S.; Kaiser, P.K.; Eberhardt, E. Damage initiation and propagation in hard rock during tunnelling and the influence of near-face stress rotation. Int. J. Rock Mech. Min. Sci. 2004, 41, 785–812. [Google Scholar] [CrossRef]
- Liu, B.; Ma, Y.; Zhang, G.; Xu, W. Acoustic emission investigation of hydraulic and mechanical characteristics of muddy sandstone experienced one freeze-thaw cycle. Cold Reg. Sci. Technol. 2018, 151, 335–344. [Google Scholar] [CrossRef]
- Takarli, M.; Prince, W.; Siddique, R. Damage in granite under heating/cooling cycles and water freeze-thaw condition. Int. J. Rock Mech. Min. Sci. 2008, 45, 1164–1175. [Google Scholar] [CrossRef]
- Agioutantis, Z.; Kaklis, K.; Mavrigiannakis, S.; Verigakis, M.; Vallianatos, F.; Saltas, V. Potential of acoustic emissions from three point bending tests as rock failure precursors. Int. J. Min. Sci. Technol. 2016, 26, 155–160. [Google Scholar] [CrossRef]
- Lavrov, A.; Vervoort, A.; Filimonov, Y.; Wevers, M.; Mertens, J. Acoustic emission in host-rock material for radioactive waste disposal: Comparison between clay and rock salt. Bull. Eng. Geol. Environ. 2002, 61, 379–387. [Google Scholar] [CrossRef]
- Prikryl, R.; Lokajícek, T.; Li, C.; Rudajev, V. Acoustic emission characteristics and failure of uniaxially stressed granitic rocks: The effect of rock fabric. Rock Mech. Rock Eng. Géoméch. Abstr. 2003, 36, 255–270. [Google Scholar] [CrossRef]
- Lockner, D.A. The role of acoustic emission in the study of rock fracture. Int. J. Rock Mech. Min. Sci. 1993, 30, 883–899. [Google Scholar] [CrossRef]
- Kawamoto, T.; Ichikawa, Y.; Kyoya, T. Deformation and Fracturing Behavior of Discontinuous Rock Mass and Damage Mechanics Theory. Int. J. Numer. Anal. Met. 1988, 12, 321–327. [Google Scholar] [CrossRef]
- Wu, Y.; Li, X.; Huang, Z.; Xue, S. Effect of temperature on physical, mechanical and acoustic emission properties of Beishan granite, Gansu Province, China. Nat. Hazards 2021, 107, 1577–1592. [Google Scholar] [CrossRef]
- Martin, C.D. The strength of Massive Lac du Bonnet Granite around Underground Opening. PhD Thesis, University of Manitoba, Winnipeg, MB, Canada, 1993. [Google Scholar]
- Brace, W.F.; Paulding, B.W.; Scholz, C.H. Dilatancy in the fracture of crystalline rocks. J. Geophys. Res. 1966, 71, 3939–3953. [Google Scholar] [CrossRef]
- Eberhardt, E.; Stead, D.; Stimpson, B.; Read, R.S. Identifying crack initiation and propagation thresholds in brittle rock. Can. Geotech. J. 1998, 35, 222–233. [Google Scholar] [CrossRef]
- Martin, C.D.; Chandler, N.A. The progressive fracture of Lac du Bonnet granite. Int. J. Rock Mech. Min. Sci. Géoméch. Abstr. 1994, 31, 643–659. [Google Scholar] [CrossRef]
- Lajtai, E.Z.; Carter, B.J.; Ayari, M.L. Criteria for brittle fracture in compression. Eng. Fract. Mech. 1990, 37, 59–74. [Google Scholar] [CrossRef]
- Ashby, M.F.; Hallam, S.D. The failure of brittle solids containing small cracks under compressive stress states. Acta Metall. 1986, 34, 497–510. [Google Scholar] [CrossRef]
- Li, X.; Shao, Z. Investigation of macroscopic brittle creep failure caused by microcrack growth under step loading and unloading in rocks. Rock Mech. Rock Eng. 2016, 49, 2581–2593. [Google Scholar] [CrossRef]
- Song, Y.; Li, X.; Zhou, T.; Li, M. Experimental and finite element analysis of marble with double pre-existing flaws under loading-unloading conditions. Arab. J. Geosci. 2020, 13, 392. [Google Scholar] [CrossRef]
- Ashby, M.F.; Sammis, C.G. The damage mechanics of brittle solids in compression. Pure Appl. Geophys. 1990, 133, 489–521. [Google Scholar] [CrossRef]
- Kim, J.S.; Lee, K.S.; Cho, W.J.; Choi, H.J.; Cho, G.C. A Comparative Evaluation of Stress–Strain and Acoustic Emission Methods for Quantitative Damage Assessments of Brittle Rock. Rock Mech. Rock Eng. 2012, 48, 495–508. [Google Scholar] [CrossRef]
- Ohtsu, M. Simplified moment tensor analysis and unified decomposition of acoustic emission source: Application to in situ hydrofracturing test. J. Geophys. Res. 1991, 96, 6211–6221. [Google Scholar] [CrossRef]
Publisher’s Note: MDPI stays neutral with regard to jurisdictional claims in published maps and institutional affiliations. |
© 2021 by the authors. Licensee MDPI, Basel, Switzerland. This article is an open access article distributed under the terms and conditions of the Creative Commons Attribution (CC BY) license (https://creativecommons.org/licenses/by/4.0/).