Abstract
The use of renewable energy and hydrogen technology is a sustainable solution for the intermittent feature of renewable energies. Hence, the aim of the present work is to design a self-sufficient system for a one-family house by coupling a solar photovoltaic array and an anion exchange membrane water electrolyzer (AEMWE). The first step is the selection of the photovoltaic panel by using PV-SYST 7.0 software. Then, the hydrogen production system is calculated by coupling the electrolyzer and photovoltaic panel current–potential curves. A fuel cell is selected to use the hydrogen produced when solar energy is not available. Finally, the hydrogen storage tank is also estimated to store hydrogen for a design basis of four consecutive cloudy days according to the hydrogen consumption of the fuel cell. The whole system is designed by a simple procedure for a specific location in Ciudad Real (Spain) for January, which is known as the coldest month of the year. The simple procedure described in this work could be used elsewhere and demonstrated that the hydrogen production at low scale is a suitable technology to use renewable energy for self-energy supporting in a residential application without any connection to the grid.
1. Introduction
Renewable energy sources are the solution for the negative environmental impact of fossil fuel combustion and the dependence on oil-producing countries. However, the dependence of renewable energy on weather conditions makes it intermittent [1,2]. Hydrogen is an energy vector that can be coupled to renewable energy sources with many applications in residential, transportation, and industries as an energy storage. However, its efficient production and the storage persist as a problem that is necessary to solve [3].
Water electrolysis is a way to obtain pure hydrogen in combination with renewable energy such as photovoltaic or wind energy. Anion exchange membrane water electrolyzers (AEMWE) is a technology that starts to be available in the electrolyzer market. Recently, AEMWE has attracted much attention due to its advantages in comparison to other traditional electrolyzers, e.g., alkaline water electrolyzers (AWE), solid oxide electrolyzer cell (SOEC), and proton exchange membrane water electrolyzers (PEMWE) [4,5,6]. AEMWE combines the advantage of conventional alkaline electrolysis (in terms of cost) and PEM (in terms of production capacity and purity of hydrogen), so it can become the key electrolysis technology for the future. These new designs aim at reducing ohmic overpotentials. In this way, higher current densities are achieved, thus improving electrolysis efficiency [7].
On the other hand, photovoltaic (PV) energy is an excellent and clean renewable energy source [8]. Any photovoltaic unit depends on the solar irradiation and temperature. However, due to this variation, the solar energy needs to be coupled with an energy storage unit. Nowadays, this coupling is typically performed by using a battery [9], which stores renewable energy in the form of chemical energy but with important limitations in terms of capacity and lifetime. It is useful when the solar energy is not enough for covering the electrical demand of a house, since an amount of energy is kept in the battery [10].
One interesting alternative to these conventional systems could be the use of the electrolysis–fuel cell technology so-called “hybrid alternative energy system” [11], which uses the excess of energy produced in a water electrolyzer to generate hydrogen. Later, hydrogen, which can be easily stored, is transformed into electricity by using a fuel cell when photovoltaic renewable energy is not available [12,13,14,15]. In order to get a maximum global efficiency, the coupling between the photovoltaic panel and the electrolyzer must be performed at the maximum power point (MPP) of the photovoltaic system [16,17]. Different strategies can be found in the available literature for the design of combined PV, electrolyzer, and fuel cell systems. A combination of empirical electrochemical relationships, thermodynamics, and heat transfer theory is used in many reports of a hybrid wind–PV system performance investigation [2,9]. Other reports use energy–exergy and economic analyses of the hybrid solar–hydrogen renewable energy system [12,13]. The optimization of a stand-alone photovoltaic–hydrogen supply system by a remote-telecom application has also been studied [14]. A comprehensive methodology to size, analyze, and assess PV-H2 systems concerns many researchers that have written different works on the energy balance and the efficacy of the system in terms of the levels of energy stored and the loading requirements [18,19].
The current manuscript examines the direct coupling between a PV panel and an AEMWE using the tools available in the market—for instance, the use of the commercial PV-SYST software. Nowadays, the proposed coupling (PV panel and AEMWE) is a novelty, since it is mostly carried out with PEMWE or AWE. The stack lifetime, the degradation, and the energy consumption are some advantages of AEMWE. The idea is to design a self-sufficient system for a residential application, i.e., for one-family house by a general and simple procedure that could be used elsewhere for other similar applications. The whole system is calculated and designed for a specific location in Ciudad Real (Spain) in January, which is the coldest month of the year with the lowest radiation level.
2. Methodology
2.1. General Design Considerations
The first design basis considers the typical electrical energy charges for a one-family house as shown in Figure 1, where energy and hour daily operation are included for a day [17]. As can be observed from the figure, the peak hour is at 8 p.m., when the total electrical energy requirement increases up to 1015 Wh, being the period with the higher electrical energy consumption from 8 p.m. to 11 p.m. This is a daily typical profile of electrical energy charges for a Spanish house, which may widely vary depending on the country. Hence, the total amount of electrical demand per day for this case of study is 7.635 kWh/day.
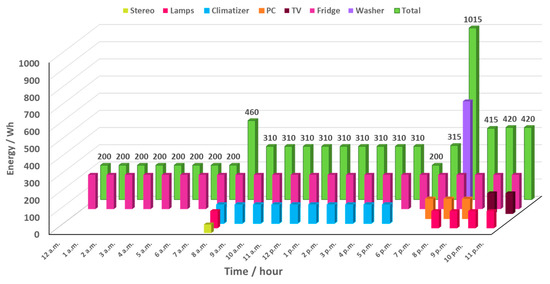
Figure 1.
Electrical demand of a one-family house.
The second design consideration is the temporal horizon of the full month of January. Considering that this month is characterized by the lowest radiation level, and it is known to be the coldest one, if the electrical demand is supplied by the proposed, designed system, it could be generally considered that those requirements for any other month will be fulfilled, too. Hence, our specific case study considers the weather data of Ciudad Real, which is a city located in Spain. As a design basis, the electrical demand is the same for all days.
The third design basis considers that the amount of energy to be stored in form of hydrogen should be enough for self-supplying the house for four consecutive days without any PV energy production, since it is based on the meteorological data from this city supplied by the PV-SYST software, and January is the most restrictive month with four consecutive days without any radiation at all. Thus, if there is a cloudy day or not enough solar radiation is available, the house can receive the stored energy in form of hydrogen via a fuel cell. The electrical demand of the house for four days is 30.54 kWh. Hence, considering the hydrogen consumption of the fuel cell for supplying this electrical demand, the amount of hydrogen to consider is 1.8 kg, which is the design basis for the hydrogen storage tank. Another base design is the efficiency of both the fuel cell and electrolyzer, i.e., 73.5% and 45%, respectively.
2.2. Design Path
The design path is shown in Figure 2. Firstly, the PV module is selected with PV-SYST 7.0, which is a powerful and commercially available software for designing photovoltaic systems [20]. The electrical energy charges (previously analyzed), geographic location, and period of time (month) are the input variables to the software for the PV calculation [21]. Furthermore, a universal regulator is added to the system. Note that although a battery is required by the software in order to perform the calculations, it will be lately replaced by the electrolyzer–fuel cell system for the electrical energy storage. Hence, the aim of this first step is to calculate a preliminary solar PV array for self-electrical energy consumption and battery storage by direct coupling without any converter and an MPP tracker as a coupling system [22,23,24,25]. However, in other configurations, it is possible to include a battery with the electrolyzer to store rapid power fluctuations or in those situations where the AEM electrolyzer is not worth turning on.
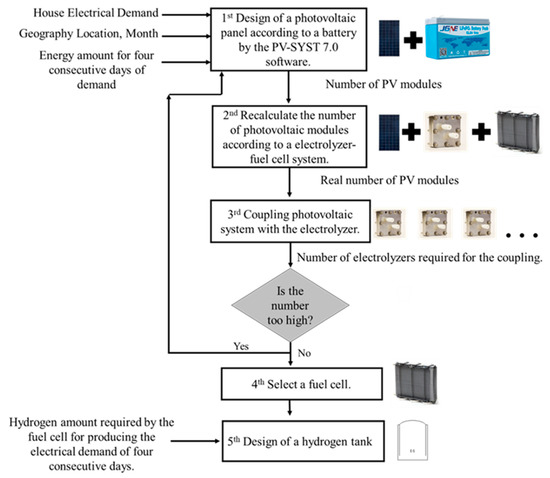
Figure 2.
Flowchart of design.
In the second step, the preliminary number of PV modules estimated by the software will be recalculated by replacing the battery by the experimental electrolyzer curve obtained in our lab (that will be described below) and a commercial fuel cell [26]. Considering that the overall efficiency of the electrolyzer–fuel cell used for energy storage is much lower than that of the battery (90–95%) [27], the final number of PV modules would be recalculated according to an energy balance. Once the PVP is designed, the coupling of PV-EL is the next step. It is based on the coupling of the current–potential curves of the experimental electrolyzer cell and the PV module at the maximum power point of the latter. By this way, the final number and area of the electrolysis cells can be obtained. It is a practical strategy that can be used by the electrolyzer manufacturers.
Then, the fuel cell is selected according to the highest hourly energy consumption value of the house (1015 Wh). Finally, the hydrogen storage tank is designed considering that hydrogen should be stored for four consecutive days without any further production. The complete system is shown in Figure S1 in Supplementary Materials.
3. Results and Discussions
In this section, the most relevant results and calculations will be shown for the four main components of the whole system: the solar PV array, the electrolyzer, the hydrogen tank, and the fuel cell.
3.1. Photovoltaic Panel
The preliminary design of the solar PV array is based on PV-SYST 7.0, which is one useful software for the design of photovoltaic system anywhere in the market [20]. It allows defining an independent system or a general electric grid. In this work, the system is independent, since it is a one-family house, which must be electrically isolated. The electrical charge (shown in Figure 1) was introduced in the software for the initial calculation of the number of PV modules and the energy storage system in chemical form with a battery.
The type of PV module is chosen from a list provided by the software, considering the maximum current of the module and the electrolyzer [26]. Hence, taking into account that the maximum current point of the electrolyzer is 4 A, according to the experimental polarization curve obtained in our group, the selected PV is the model Solartec SST72 110 24 106W module with a maximum current of 3.3 A. In agreement with this, the PV module to choose would have a maximum current point (IMPP) lower than 4 A. This PV selected module is based on mono-crystalline silicon (c-Si), which is the most common ones with standard dimensions of 1303 × 666 mm [24,25]. The I-V characteristic curves for the selected module at different solar radiation levels are also displayed by the software as shown in Figure S2 of the Supplementary Materials.
On the other hand, the battery system should also be considered at this time. According to the design basis of 4 consecutive days without any PV production and the electrical energy charges of our case of study, a battery with a power capacity higher than 30.54 kWh must be selected. In this case, from the list provided by the software, the selected battery is one with 32.3 kWh of power capacity. The model is Cell HTCFR26650-3800mAh-3.2V. The capacity is 749 Ah, and the voltage is 48 V. Note that the software warns if the battery is appropriate or not for the application.
Once the specific types of PV module and battery are chosen, the number of PV modules displayed in series in the solar PV array is introduced in the PV-SYST 7.0 software following an optimization procedure, as described below. In this case, the aim is to find the minimum number of PV modules that allows providing enough electrical energy for all the days of January to avoid the energy running out with the combined photovoltaic–battery system. This optimization procedure is performed according to the curves displayed by the software, which shows the electrical power demand covered by the system and the loss of energy associated with the fully charged battery (Figure 3). In this case, special attention should be paid to find the lowest number of PV modules, which avoids the loss of power demand (green line, secondary axis of Figure 3) for different temporal horizons. This optimization has started with sixteen PV modules in series (Figure 3a). In this case, it can be observed that for the temporal horizon of one day (1st January), the system can self-supply the house, and the battery is not full, since a loss of energy is not shown in the graph. On the other hand, as can be observed from Figure 3b, keeping this number of PV modules, the electrical energy demand of the house for a whole week is not covered (the first week of January). Hence, on the seventh day, the house does not receive any electricity, since the battery has not received enough energy to be used later. Therefore, the number of PV modules should be increased to completely charge the battery for its further use. In this sense, the optimization continues with twenty-two PV modules. In this case (as can be observed in Figure 3c), the electrical demand is fully covered for self- supporting the house for the first week, but it seems not to be enough for the second one, since the power demands fall to zero after the ninth day (as shown in the Figure 3d). Then, the procedure is repeated for twenty-eight (Figure 3e) and thirty PV modules (Figure 3f), the latter being the minimum number of PV modules required for covering the whole month of January. According to this analysis, thirty PV modules and a battery with 32.3 kWh of power capacity fulfill the preliminary design of the energy-production and storage system.
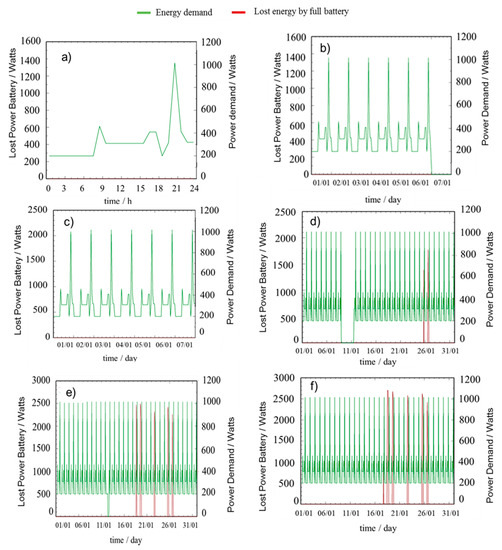
Figure 3.
January supplied electrical demand by (a) sixteen PV modules for the 1st day, (b) sixteen PV modules for the first week, (c) twenty-two PV modules for the first week, (d) twenty-two PV modules for the full month, (e) twenty-eight PV modules for the full month, (f) thirty PV modules for the full month.
The next step deals with the recalculation of the number of PV modules according to our new proposed energy storage system, which replaces the battery by an EL-FC. At this point, it should be noted that the software provides the output energy of the photovoltaic system (Eo,PV30m), which has thirty PV modules—the optimal number for supplying the electrical demand. Part of this energy is directly used by the one-family house (D), and the excess energy (Ee,PV30m) is introduced to the battery. Both provided values of energy are shown in Table 1, along with the electrical demand per day. With the efficiency of the battery (90%), its output energy (Eo,BA) is calculated, which is also shown in Table 1. This value should be equal to the output energy of the fuel cell (Eo,EL-FC), considering the efficiency of the electrolyzer and fuel cell [28,29,30,31,32,33]. For that purpose, an energy balance is now performed (as shown in Figure 4) to finally calculate the value of the input energy of the electrolyzer (Ei,EL). Furthermore, there is an important consideration about the state of charge of the battery, since the software considers that the battery has the previous year´s surpluses. However, it can continue to charge because it is not totally full.

Table 1.
Photovoltaic panel energy, battery energy, and electrolyzer energy.
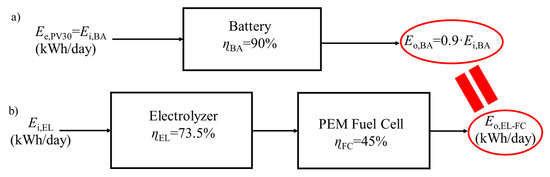
Figure 4.
The energy balance of two systems: (a) battery system, (b) electrolyzer–fuel cell system.
The calculation of Ei,EL value for each specific day is performed by using Equation (1), obtained from the energy balance schematically shown in Figure 4b, which requires the efficiency of the electrolyzer (ηEL) and fuel cell (ηFC).
The obtained values are summarized in Table 1, along with the values of the following reported parameters: energy of the back-up battery (Ei,Bae) and excess of solar energy (Ee,PVn). At this point, it should be noted that an oversizing is performed in order to keep 10% of the energy as a back-up battery (Ei,BAe), since most of the strategies found in the literature use a battery as an additional storage notwithstanding the hydrogen tank [34,35,36,37,38].
Taking into account the extra energy that the solar PV array must produce using the EL-FC instead of the battery, an oversizing factor can be calculated by Equation (2) considering the relation between the solar PV array energy of the proposed system and that of the preliminary solar PV array of thirty PV modules. The obtained sizing factor is 3, which means that the final number of PV modules required with our new storage system is ninety. The proposed system requires more PV modules because the efficiency of a battery (90%) is higher than the efficiency of the EL-FC system (33%) as known. However, the charge/discharge cycles that spoil a battery lead to a short lifetime, and the efficiency is reduced by up to 40% at the end of the year of use. In addition, the ratio of electrical energy returned by the system EL-FC over its lifetime to the electrical equivalent energy required to build this system is also affected. Furthermore, the components of the battery are less environment friendly with a high amount of pollutants. The lifetime estimation of our system is about 20 years, as many referees have reported [39,40,41,42].
Our system contains in total ninety PV modules, and considering that one PV module area is 0.868 m2, the total area of the solar PV array is 78.12 m2, which perfectly fits the standard dimensions of the roof of the house. This final value agrees well with those of the solar PV array areas found in other studies for similar applications, whose calculation approaches were 65.2 m2 for a PV system integrated into a one-family house at Zollbrück, Switzerland [43] and 65 m2 as the optimal area for direct coupling between a solar PV array and a proton exchange membrane water electrolyzer [26].
3.2. AEMWE Electrolyzer
In this work, we have used for the coupling, as shown in Figure 5, the current–potential curves experimentally obtained in our lab with a self-prepared membrane electrode assembly (MEA). It is based on two electrodes, an anode and cathode, made of metallic Ni-Fe sputtered by the magnetron sputtering technique [26,44,45,46] on Carbon Gas Diffusion Layers (GDL) and a Fumapem FAA-3-50 membrane [4], which is located in the middle of both electrodes [47]. The electrolysis unit also includes a corrosion-resistant 5 cm2 anode and cathode nickel flow fields. For this work, a polarization curve of this experimental electrolyzer is used for the coupling, as shown in Figure 5. The experimentation to obtain the sweep voltammetry was carried out in a potassium hydroxide solution (1 M) at 40 °C temperature.
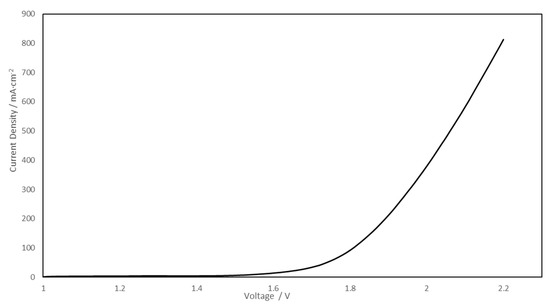
Figure 5.
Polarization curve of the experimental AEMWE.
According to previous studies [18,26], the most efficient coupling of the PV module with the experimental electrolyzer occurs at the maximum power point of the PV module at the highest radiation level, 1000 W/m2. However, the maximum power point of the experimental electrolyzer is much lower than that of the PV module. In terms of current, the maximum current of the PV module is close to the maximum value of the experimental electrolyzer. However, it is not possible in terms of voltage, since the electric potential of the electrolyzer is much lower. For this reason, the number of cells in series in the electrolyzer must be modified until reaching the maximum power point of the PV module, whose coupling is shown in Figure 6.
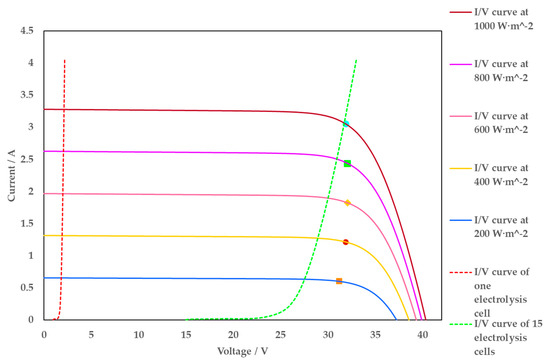
Figure 6.
Coupling Solartec SST72 110 24 106W PV module −5 cm2 electrolyzer.
As can be observed from Figure 6, fifteen AEMWE cells are required per PV module for reaching the maximum power point of the PV module. It means that a high number of cells will be required for the ninety PV modules. This is due to the low geometric area of the electrodes (5 cm2) of the experimental lab-scale electrolyzer used. Hence, considering that the electrode area of a commercial AEM electrolyzer is typically between 50 and 200 cm2, selecting the area of the electrolyzer is a good approach for obtaining a system of large scale and reduces the number of electrolyzer cells into the stack. According to the polarization curve, as shown in Figure 5, the I-V curve for an electrolyzer with an area of 50 cm2 is obtained through it (Figure S3). Hence, considering that the maximum current point of the electrolyzer (IMPP) is 40 A, the last PV module is not a good approach for this new coupling. For this reason, a new PV module with more current than the last one must be chosen. The selected PV model is a Solartec SSW72 08 108 Wp module, with a maximum current per module of 8 A. For this reason, a PV string with five PV modules in parallel is required to reach 40 A of current. It was not necessary with the 5 cm2 electrolyzer, since the maximum current point was 4 A as the PV module point, and the coupling in terms of the current was fixed. The I-V curve of the selected module is shown in Supplementary Materials; see Figure S4.
Following the same procedure explained for the electrolyzer of 5 cm2 (Figure 3), the number of PV strings required by the electrolyzer of 50 cm2 was found to be five. This optimization of the number of PV strings in series is shown in Supplementary Materials; see Figure S5. Applying the sizing factor obtained in Section 3.1 by Equation (2), fifteen PV strings are required by the system EL-FC, and seventy-five PV modules are contained in the solar PV array for the coupling with EL-FC system. The area of solar PV array is 65.325 m2, considering that the photovoltaic module area is 0.871 m2, which are close to the values reported in the available literature [26,43].
As can be observed from the coupling shown in Figure 7, six electrolyzer cells are required per PV string for reaching the maximum power point. According to this, the total number of electrolyzer cells is really lower than before; thirty electrolyzer cells are required by the solar PV array.
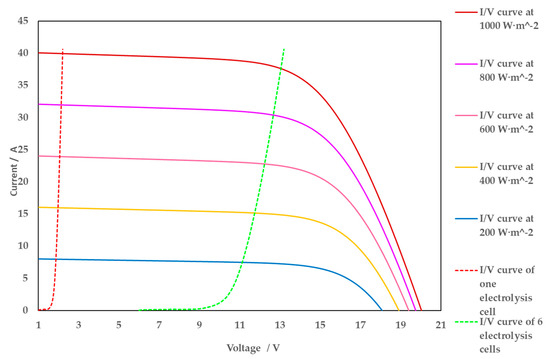
Figure 7.
Coupling Solartec SSW72 08 108Wp PV module −50 cm2 AEMWE developed in our lab.
3.3. Fuel Cell
In this section, the aim is the selection of an appropriate fuel cell. On the daily demand per hour of the one-family house (see Figure 1), the peak maximum of electrical power is achieved at 8 pm, 1.015 kW. The selected fuel cell must be available for supplying this power demand when the solar energy is null. Considering this, the maximum power per hour that the fuel cell must supply is 1.218 kW according to a 20% of oversizing. A possible commercially available option among different manufacturers is the model Fcgen-1020ACS, which is a proton exchange membrane (PEMFC) that can be scaled up to meet power requirements from 450 W to 3 kW. The physical characteristics per stack of fifty-six fuel cells is 363 × 103 × 351 mm; the fuel flow rate per fuel cell is 0.5 standard liters per minute (slpm), and the rated power is 41.1 W/cell. It is an air-cooled fuel cell stack with an open-cathode and a self-humidifying MEA, which allows eliminating the humidifier, coolant pump, and radiator. Therefore, to cover the power of 1.218 kW, thirty fuel cells are necessary in the FC stack. For more information of the fuel cell, see Figure S6 in Supplementary Materials.
An estimation of the hydrogen consumption is taken into account, since the Ballard manufacturer provides the consumption of hydrogen, 0.5 L/min per cell. In terms of mass, it is 0.059 kg/day per cell. This hydrogen consumption is for a production of 30 kWh per day. As in our system, the maximum electrical demand per day is 7.635 kWh, and the fuel cell consumes 0.45 kg for obtaining this energy. For this reason, considering the design basis of four consecutive days without solar energy, the amount of hydrogen that must be stored in the tank is 1.8 kg.
3.4. Hydrogen Tank
Different methods have been reported for hydrogen storage as hydrogen hydrates, which have been compared in the bibliography with existing hydrogen storage technologies [47,48]. This type of storage is useful when a large distance transport is required [49,50]. However, for low-scale application and for single-entry production–consumption, the compressed hydrogen storage (CGH2) is the best choice. In this study, a typical mathematic method for the design of pressurized tanks has been used [51]. The main design basis is the conditions and amount of hydrogen to be stored (1.8 kg, as already mentioned). A commercial AEMWE, such as the ones commercialized, achieved the maximum hydrogen pressure conditions of 35 bars [52]. Hence, for the current study, the pressure and temperature conditions are fixed in 30 bars and 298 K. Due to this outlet pressure, a compressor is not required for this residential application. The tank volume is calculated by the equation of Mench [19,51], which is defined as follows:
where P is the pressure (3 × 10⁶ Pa), V is the tank volume (m3), n is the number of moles (900), Ru is the universal gas constant (8.314 J/mol K), T is the temperature (298 K), and a and b are constant calculated by Equations (4) and (5), respectively.
where Tc is the critical temperature and Pc is the critical pressure of the hydrogen gas. The initial hydrogen conditions are collected in Table S2. All this allows calculating the tank volume achieving a theoretical value of 0.758 m3. Considering an oversizing of 20%, a final volume of 0.91 m3 is obtained for the hydrogen tank. Concerning the recipient material, carbon steel is the preferred one for indoor pressure equipment according to the ASME BPVC Section VIII code [53]. Future developments of new composite materials would increase the tensile strength above that of steel, although most of the reports use a wide range of steel types, e.g., stainless steel [54]. Then, the specific dimensions of the hydrogen tank are calculated using the Mijalev monogram (see Figure S7 in Supplementary Materials) [55], which shows two axes, reduced pressure (MPa) and tank volume (m3). Reduced pressure is estimated with Equation (6):
where Pred is the reduced pressure (MPa), Pcal is the calculation pressure (3.6 MPa), [σ] is the permissible tension of carbon steel (107.1 MPa), and C is the overthickness by corrosion (0.002 m). These parameters are according to carbon steel material [52].
Once the tank volume (0.91 m3) and reduced pressure (1.6807 MPa) are calculated, the Mijalev monogram is used to know the optimal diameter, 0.7 m. As the tank is cylindrical, the height is calculated with the diameter and volume. The optimal dimensions are 2.4 m × 0.7 m.
As it is an indoor pressure tank, the shell is indispensable for the safety of the system [51]. The thickness of the shell is calculated according to Equation (7):
where Scal is the shell thickness (m), Pdesign is the indoor pressure tank (3 × 10⁶ Pa), D is the diameter (0.7 m), is the welding factor (1), [σ] is the permissible tension of carbon steel (107.1 × 10⁶ Pa), Ptest is the test pressure (4.5 × 10⁶ Pa), and []test is the test permissible tension (97.364 × 10⁶ Pa) [56,57,58].
To sum up, the shell thickness obtained is 0.0166 m. An overthickness by corrosion of 0.002 m is taken into account following the ASME code [53]. Then, the total thickness of the shell is 0.0186 m. The final dimensions are graphically shown in Supplementary Materials; see Figure S8. This design method considers the design criteria in which the amount of material is minimum. For this reason, an optimization of material is automatically made.
4. Economic Evaluation
In this section, the EL-FC system is economically analyzed for comparing the usefulness of this from a different point of view, which is followed by the economic comparison with the conventional system with a battery. Some parameters have been considered such as the Levelized Cost of Energy (LCOE), which is used for evaluating the cost of the system; the LCOE value can be calculated through the Nizetic et al., equation [59,60]:
where IC is the installation cost, OM is the operation and maintenance cost, CRF is the capital recovery factor, and EO is the average annual overall energy output from the system. The CRF factor is calculated according to the next equation:
where p is the interest rate and n is the amortization period. In this case, the interest rate is 10% and the amortization period is twenty years.
Furthermore, two economic parameters have been calculated for clarifying the financial part. On the one hand, the Net Present Value (NPV) is an economic tool used to equate the total cost of a project over a specified period to the total cost today, taking into account the time value of money. On the other hand, the Internal Rate of Return (IRR) is a financial parameter to estimate the profitability of potential investments [27,61].
where C is the net cash flow; i and n were previously defined.
The technical specification of the photovoltaic panel, electrolyzer, fuel cell, and battery were mentioned in the corresponding section of each equipment, and the economic specifications are summarized in Table 2. The hydrogen tank investment was calculated in order to measure the amount of carbon steel required (see Equation (11)). The equipment investment is shown in Table 3, and the total investment of the system is similar to other reports [18,62].
where m is the amount of carbon steel, is the carbon steel density, S is the thickness, V is the volume, and D is the diameter of the tank.
Table 2.
Economic and technical specification for the components of EL-FC/conventional system.
Table 3.
Equipment investment and economic parameters for both systems: the electrolyzer–fuel cell system without a battery and the conventional system (photovoltaic panel with battery).
Once the equipment investment is known, the rest of the investments are calculated by the Vian Method (see Table S3 in Supplementary Materials); following it, the total investment is 15803 € and 13348 € for the EL-FC system and conventional system, respectively. The datasheet of the battery indicates that the efficiency of 90% is only maintained for a year of use. According to this design, a new battery has to be bought every year because the design was carried out with this efficiency. The rest of the equipment has roughly a life of 20 years of use, as many researchers have supported [63,64]. For this reason, the investment period is 20 years, as has been shown in Table 2.
The aim of the economic evaluation is obtaining the value of the above-mentioned parameters for comparing the systems (NPV, IRR, CRF, LCOE); the results are shown in Table 3. For this, a series of parameters is required including fixed capital investment, working capital investment (10% of the fixed capital investment), invested funds, benefits, amortization, and cash flow (see Table S4 in Supplementary Materials). Currently, the conventional system presented a more sympathetic economic part, since the NPV and IRR is higher, 2164 and 12.31%, respectively. The main barrier for the El-FC system is their high initial investment cost and the reliability of novel energy technologies. According to the economic results, the LCOE value of our system is higher than the conventional system due to the novelty of our system, which involves an anion exchange membrane water electrolyzer that has been little developed so far, corresponding to a high cost (see Table 3). However, the values of LCOE are coming up between both and are similar to other reports (see Figure 8) [62,65].
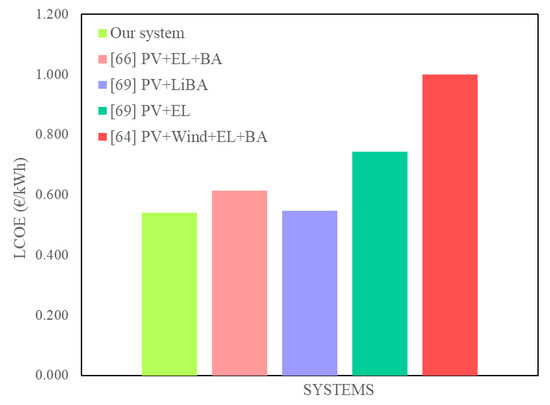
Figure 8.
LCOE comparative with other reports [65,66,67].
5. Conclusions
The obtained results demonstrate that the introduction of a hydrogen and photovoltaic system into a domestic application is a viable option to supply energy without any connection to the grid. For isolated locations from the electricity grid, this method of coupling is a good approach to produce energy.
The design takes place in Spain, but the procedure developed in this work can be generally used elsewhere, since it implies the use of a commercial PV software and available general information.
The present study is based on a novel and simple procedure to design a photovoltaic–hydrogen system, but the obtained sizing results of the different components are in good agreement with previous studies, which typically used more complex models or experimental procedures, which supports the information reported here.
An initial solar PV array is calculated by using the commercial software PV-SYST 7.0, which considers the energy storage within a battery. However, in the next steps, the battery is replaced by the electrolyzer–fuel cell system because the battery has a short lifetime and charge/discharge cycles. Furthermore, the battery components are less friendly with the environment. In this way, the study obtains the most sustainable way of producing energy in an isolated location. These results demonstrate that it is possible to use hydrogen for a self-sufficient energy system for low-scale domestic application as an alternative method to conventionally used batteries.
This study leads to an increase in the final area of the solar PV array to a final value of 65.325 m2, which is feasible within the standard dimensions of the roof of a house and agrees well with previous results published in the literature. The optimal final dimensions of the hydrogen tank were found to be 2.4 × 0.7 m at 30 bars as storage pressure, being the selected material carbon steel. These dimensions are close to the dimensions of the diesel tank that nowadays is commonly being used at home. In addition, the final number of cells in the electrolyzer has been calculated according to the commercial AEMWE units available in the market. A PEM fuel cell is chosen in order to achieve the maximum power required in the application. All the equipment can be laid down in any one-family house.
This paper has demonstrated that the EL-FC system needs only 12827 € of initial capital with an LCOE of 0.541 €/kWh, which are competitive values with the results reported in the bibliography. In addition, this system is sustainable with the environment because it has a lower environmental impact than the conventional system. We hope that the scientific community continues to push up the development of the anion exchange membrane water electrolyzer coupling with renewable sources.
Supplementary Materials
The following are available online at https://www.mdpi.com/article/10.3390/app11209582/s1, Figure S1: P&ID. Figure S2: I-V characteristic curves of the Solartec_SST72_110_24_106W module. Figure S3: I-V curve of the experimental AEMWE of 50 cm2. Figure S4: I-V characteristic curves of the Solartec_SSW72_08_108Wp module. Figure S5: January supplied electrical demand by (a) three PV strings for the 1st day, (b) three PV strings for the first week, (c) four PV strings for the first week, (d) four PV strings for the full month, (e) five PV strings for the full month. Figure S6: Datasheet of Fcgen-1020ACS fuel cell. Figure S7: Mijalev monogram. Figure S8: Hydrogen tank with dimensions. Table S1: Output photovoltaic panel energy and electrolyzer energy. Table S2: Hydrogen initial conditions. Table S3: Vian Method. Table S4: Economical evaluation of both systems: conventional system with battery and electrolyzer-fuel cell system without battery.
Author Contributions
Conceptualization, C.G.-S.; methodology, C.G.-S.; software, C.G.-S.; validation, A.d.L.-C., E.A.-V., F.D.-F. and A.R.d.l.O.-P., formal analysis, A.d.L.-C. and E.A.-V.; investigation, C.G.-S. and E.L.-F.; resources, C.G.-S., E.L.-F., A.d.L.-C., E.A.-V., F.D.-F. and A.R.d.l.O.-P.; data curation, A.d.L.-C., E.A.-V., F.D.-F. and A.R.d.l.O.-P.; writing-original draft preparation, C.G.-S. and A.d.L.-C.; writing-review and editing, C.G.-S., E.L.-F., A.d.L.-C., E.A.-V., F.D.-F. and A.R.d.l.O.-P.; visualization, C.G.-S., E.L.-F., A.d.L.-C., E.A.-V., F.D.-F. and A.R.d.l.O.-P.; supervision, E.L.-F., A.d.L.-C., E.A.-V., F.D.-F. and A.R.d.l.O.-P.; project administration, A.d.L.-C. All authors have read and agreed to the published version of the manuscript.
Funding
This research received no external funding.
Institutional Review Board Statement
Not applicable.
Informed Consent Statement
Not applicable.
Data Availability Statement
Not applicable.
Acknowledgments
The authors thank the ’Fundación DOMINGO MARTINEZ’ for financial support.
Conflicts of Interest
The authors declare no conflict of interest.
Nomenclature
| BA | Battery |
| EEL | Consumed energy by the electrolyzer per kg of hydrogen, 45.29 kWh/kgH2 |
| I | Current, A |
| ηBA | Efficiency of battery, 0.9 |
| ηFC | Efficiency of fuel cell, 0.65 |
| D | Electrical demand, Wh/day or kWh/day |
| SEL | Electrolyzer area |
| EL | Electrolysis cell |
| E | Energy, kWh |
| EBae | Energy of the extra battery, kWh/day |
| Ee | Excess energy, kWh/day |
| BAe | Extra battery |
| FC | Fuel cell |
| HT | Hydrogen tank |
| Ei | Input energy, kWh/day |
| Ei,EL | Input energy of electrolyzer, kWh/day |
| NEL | Number of EL cells in series |
| NPV | Number of PV modules in series |
| PV1m | One photovoltaic module |
| So,EL | Optimal area of electrolyzer |
| NPV,OP | Optimal number of PV modules in series |
| Eo | Output energy, kWh/day |
| Eo,BA | Output energy of battery, kWh |
| Eo,FC | Output energy of fuel cell, kWh/day |
| Eo,PVnm | Output energy of n photovoltaic module, kWh/day; n: number of photovoltaic modules. |
| Po,FC | Output power of fuel cell, kW |
| OT | Oxygen tank |
| SPVp | Photovoltaic array area |
| SPVm | Photovoltaic module area |
| P | Power, kW |
| IMPP | PV Current at the maximum power point (MPP), A |
| VMPP | PV Voltage at the maximum power point (MPP), V |
| fEL | Sizing factor of electrolyzer |
| fPV | Sizing factor of photovoltaic panel |
| PVP | Solar PV array |
| G | Solar radiation, W/m2 |
| SSEL | Stack electrolyzer area |
| T | Time, hour or day |
| V | Voltage, V |
References
- Amores, E.; Rodríguez, J.; Carreras, C. Influence of operation parameters in the modeling of alkaline water electrolyzers for hydrogen production. Int. J. Hydrogen Energy 2014, 39, 13063–13078. [Google Scholar] [CrossRef]
- Siegel, A.; Schott, T. Optimization of photovoltaic hydrogen production. Int. J. Hydrogen Energy 1988, 13, 659–675. [Google Scholar] [CrossRef]
- López-Fernández, E.; Gil-Rostra, J.; Espinós, J.P.; González-Elipe, A.R.; Yubero, F.; de Lucas-Consuegra, A. CuxCo3-xO4 ultra-thin film as efficient anodic catalysts for anion exchange membrane water electrolysers. J. Power Sources 2019, 415, 136–144. [Google Scholar] [CrossRef]
- López-Fernández, E.; Gil-Rostra, J.; Espinós, J.P.; González-Elipe, A.R.; De Lucas Consuegra, A.; Yubero, F. Chemistry and Electrocatalytic Activity of Nanostructured Nickel Electrodes for Water Electrolysis. ACS Catal. 2020, 10, 6159–6170. [Google Scholar] [CrossRef]
- Caravaca, A.; Sapountzi, F.M.; De Lucas-Consuegra, A.; Molina-Mora, C.; Dorado, F.; Valverde, J.L. Electrochemical reforming of ethanol-water solutions for pure H2 production in a PEM electrolysis cell. Int. J. Hydrogen Energy 2012, 37, 9504–9513. [Google Scholar] [CrossRef]
- González-Cobos, J.; Valverde, J.L.; de Lucas-Consuegra, A. Electrochemical vs. chemical promotion in the H2 production catalytic reactions. Int. J. Hydrogen Energy 2017, 42, 13712–13723. [Google Scholar] [CrossRef]
- Kelly, N.A. Hydrogen production by water electrolysis. In Advances in Hydrogen Production, Storage and Distribution; Woodhead Publishing: Cambridge, UK, 2014; ISBN 9780857097736. [Google Scholar]
- Maeda, T.; Ito, H.; Hasegawa, Y.; Zhou, Z.; Ishida, M. Study on control method of the stand-alone direct-coupling photovoltaic—Water electrolyzer. Int. J. Hydrogen Energy 2012, 37, 4819–4828. [Google Scholar] [CrossRef]
- Khalilnejad, A.; Riahy, G.H. A hybrid wind-PV system performance investigation for the purpose of maximum hydrogen production and storage using advanced alkaline electrolyzer. Energy Convers. Manag. 2014, 80, 398–406. [Google Scholar] [CrossRef]
- Chaparro, A.M.; Soler, J.; Escudero, M.J.; De Ceballos, E.M.L.; Wittstadt, U.; Daza, L. Data results and operational experience with a solar hydrogen system. J. Power Sources 2005, 144, 165–169. [Google Scholar] [CrossRef]
- Erdinc, O.; Uzunoglu, M. A new perspective in optimum sizing of hybrid renewable energy systems: Consideration of component performance degradation issue. Int. J. Hydrogen Energy 2012, 37, 10479–10488. [Google Scholar] [CrossRef]
- Sánchez, M.; Amores, E.; Rodríguez, L.; Clemente-Jul, C. Semi-empirical model and experimental validation for the performance evaluation of a 15 kW alkaline water electrolyzer. Int. J. Hydrogen Energy 2018, 43, 20332–20345. [Google Scholar] [CrossRef]
- Teichmann, D.; Arlt, W.; Wasserscheid, P. Liquid Organic Hydrogen Carriers as an efficient vector for the transport and storage of renewable energy. Int. J. Hydrogen Energy 2012, 37, 18118–18132. [Google Scholar] [CrossRef]
- Reuß, M.; Grube, T.; Robinius, M.; Preuster, P.; Wasserscheid, P.; Stolten, D. Seasonal storage and alternative carriers: A flexible hydrogen supply chain model. Appl. Energy 2017, 200, 290–302. [Google Scholar] [CrossRef]
- He, T.; Pei, Q.; Chen, P. Liquid organic hydrogen carriers. J. Energy Chem. 2015, 24, 587–594. [Google Scholar] [CrossRef] [Green Version]
- García-Valverde, R.; Espinosa, N.; Urbina, A. Optimized method for photovoltaic-water electrolyser direct coupling. Int. J. Hydrogen Energy 2011, 36, 10574–10586. [Google Scholar] [CrossRef]
- Ozden, E.; Tari, I. Energy-exergy and economic analyses of a hybrid solar-hydrogen renewable energy system in Ankara, Turkey. Appl. Therm. Eng. 2016, 99, 169–178. [Google Scholar] [CrossRef]
- Gutiérrez-Martín, F.; Calcerrada, A.B.; de Lucas-Consuegra, A.; Dorado, F. Hydrogen storage for off-grid power supply based on solar PV and electrochemical reforming of ethanol-water solutions. Renew. Energy 2020, 147, 639–649. [Google Scholar] [CrossRef]
- Budak, Y.; Devrim, Y. Comparative study of PV/PEM fuel cell hybrid energy system based on methanol and water electrolysis. Energy Convers. Manag. 2019, 179, 46–57. [Google Scholar] [CrossRef]
- PV System Photovoltaic Software. Available online: https://www.pvsyst.com/ (accessed on 10 November 2020).
- Mermoud, A.; Lejeune, T. Performance Assessment of a Simulation Model for Pv Modules of Any Available Technology. In Proceedings of the 25th European Photovoltaic Solar Energy Conference, Valencia, Spain, 6–10 September 2010; pp. 6–10. [Google Scholar]
- Mermoud, A.; Villoz, A.; Wittmer, B.; Apaydin, H. ECONOMIC OPTIMIZATION OF PV SYSTEMS WITH STORAGE. 2020. PVsyst SA Route de la Maison-Carrée 30, CH 1242 Satigny, Switzerland. Available online: https://www.pvsyst.com/ (accessed on 13 October 2021).
- Zablocki, A. Energy storage: Fact sheet (2019). Eesi 2019, 2040, 1–8. [Google Scholar]
- Gibson, T.L.; Kelly, N.A. Optimization of solar powered hydrogen production using photovoltaic electrolysis devices. Int. J. Hydrogen Energy 2008, 33, 5931–5940. [Google Scholar] [CrossRef]
- Behzadi, M.S.; Niasati, M. Comparative performance analysis of a hybrid PV/FC/battery stand-alone system using different power management strategies and sizing approaches. Int. J. Hydrogen Energy 2015, 40, 538–548. [Google Scholar] [CrossRef]
- Clarke, R.E.; Giddey, S.; Ciacchi, F.T.; Badwal, S.P.S.; Paul, B.; Andrews, J. Direct coupling of an electrolyser to a solar PV system for generating hydrogen. Int. J. Hydrogen Energy 2009, 34, 2531–2542. [Google Scholar] [CrossRef]
- Al-Khori, K.; Bicer, Y.; Koç, M. Comparative techno-economic assessment of integrated PV-SOFC and PV-Battery hybrid system for natural gas processing plants. Energy 2021, 222, 119923. [Google Scholar] [CrossRef]
- Amores, E.; Sánchez, M.; Rojas, N.; Sánchez-Molina, M. Renewable hydrogen production by water electrolysis. In Sustainable Fuel Technologies Handbook; Elsevier: Amsterdam, The Netherlands, 2021; pp. 271–313. [Google Scholar]
- Zhang, X.; Ni, M.; Wang, J.; Yang, L.; Mao, X.; Su, S.; Yang, Z.; Chen, J. Configuration design and parametric optimum selection of a self-supporting PEMFC. Energy Convers. Manag. 2020, 225, 113391. [Google Scholar] [CrossRef]
- Fan, L.; Tu, Z.; Chan, S.H. Recent development of hydrogen and fuel cell technologies: A review. Energy Rep. 2021. [Google Scholar] [CrossRef]
- Wishart, J.; Dong, Z.; Secanell, M. Optimization of a PEM fuel cell system based on empirical data and a generalized electrochemical semi-empirical model. J. Power Sources 2006, 161, 1041–1055. [Google Scholar] [CrossRef]
- Cheng, S.; Xu, L.; Wu, K.; Fang, C.; Hu, J.; Li, J.; Ouyang, M. Optimal warm-up control strategy of the PEMFC system on a city bus aimed at improving efficiency. Int. J. Hydrogen Energy 2017, 42, 11632–11643. [Google Scholar] [CrossRef]
- Authayanun, S.; Wiyaratn, W.; Assabumrungrat, S.; Arpornwichanop, A. Theoretical analysis of a glycerol reforming and high-temperature PEMFC integrated system: Hydrogen production and system efficiency. Fuel 2013, 105, 345–352. [Google Scholar] [CrossRef]
- Witkowski, A.; Rusin, A.; Majkut, M.; Stolecka, K. Comprehensive analysis of hydrogen compression and pipeline transportation from thermodynamics and safety aspects. Energy 2017, 141, 2508–2518. [Google Scholar] [CrossRef]
- Møller, K.T.; Jensen, T.R.; Akiba, E.; Li, H. wen Hydrogen—A sustainable energy carrier. Prog. Nat. Sci. Mater. Int. 2017, 27, 34–40. [Google Scholar] [CrossRef]
- Castañeda, M.; Cano, A.; Jurado, F.; Sánchez, H.; Fernández, L.M. Sizing optimization, dynamic modeling and energy management strategies of a stand-alone PV/hydrogen/battery-based hybrid system. Int. J. Hydrogen Energy 2013, 38, 3830–3845. [Google Scholar] [CrossRef]
- de Andrade, G.A.; Mendes, P.R.C.; García-Clúa, J.G.; Normey-Rico, J.E. Control of a grid assisted PV-H2 production system: A comparative study between optimal control and hybrid MPC. J. Process Control 2020, 92, 220–233. [Google Scholar] [CrossRef]
- Amores, E.; Rodríguez, J.; Oviedo, J.; De Lucas-Consuegra, A. Development of an operation strategy for hydrogen production using solar PV energy based on fluid dynamic aspects. Open Eng. 2017, 7, 141–152. [Google Scholar] [CrossRef]
- Pellow, M.A.; Emmott, C.J.M.; Barnhart, C.J.; Benson, S.M. Hydrogen or batteries for grid storage? A net energy analysis. Energy Environ. Sci. 2015, 8, 1938–1952. [Google Scholar] [CrossRef] [Green Version]
- Motealleh, B.; Liu, Z.; Masel, R.I.; Sculley, J.P.; Richard Ni, Z.; Meroueh, L. Next-generation anion exchange membrane water electrolyzers operating for commercially relevant lifetimes. Int. J. Hydrogen Energy 2021, 46, 3379–3386. [Google Scholar] [CrossRef]
- Liu, S.; Wang, J.; Liu, H.; Liu, Q.; Tang, J.; Li, Z. Battery degradation model and multiple-indicators based lifetime estimator for energy storage system design and operation: Experimental analyses of cycling-induced aging. Electrochim. Acta 2021, 384, 138294. [Google Scholar] [CrossRef]
- Harrison, K. 2nd International Workshop Durability and Degradation Issues in PEM Electrolysis Cells and its Components Life-Time Prediction of PEM Water Electrolysis Stacks Coupled with RES Transportation. Johns. Matthey Technol. Rev. 2016, 47–51. [Google Scholar] [CrossRef]
- Hollmuller, P.; Joubert, J.M.; Lachal, B.; Yvon, K. Evaluation of a 5 kWp photovoltaic hydrogen production and storage installation for a residential home in Switzerland. Int. J. Hydrogen Energy 2000, 25, 97–109. [Google Scholar] [CrossRef]
- Li, H.; Gao, Y.-J.; Yuan, S.-H.; Wuu, D.-S.; Wu, W.-Y.; Zhang, S. Improvement in the Figure of Merit of ITO-Metal-ITO Sandwiched Films on Poly Substrate by High-Power Impulse Magnetron Sputtering. Coatings 2021, 11, 144. [Google Scholar] [CrossRef]
- Ababneh, A.; Dagamseh, A.M.K.; Albataineh, Z.; Tantawi, M.; Al-Bataineh, Q.M.; Telfah, M.; Zengerle, T.; Seidel, H. Optical and structural properties of aluminium nitride thin-films synthesized by DC-magnetron sputtering technique at different sputtering pressures. Microsyst. Technol. 2021, 4. [Google Scholar] [CrossRef]
- Cho, S. Properties of Eu-doped—YVO 4 thin films grown on glass substrates by radio - frequency magnetron sputtering. Appl. Phys. A 2021, 127, 161. [Google Scholar] [CrossRef]
- Liu, Z.; Sajjad, S.D.; Gao, Y.; Yang, H.; Kaczur, J.J.; Masel, R.I. The effect of membrane on an alkaline water electrolyzer. Int. J. Hydrogen Energy 2017, 42, 29661–29665. [Google Scholar] [CrossRef]
- Di Profio, P.; Arca, S.; Rossi, F.; Filipponi, M. Comparison of hydrogen hydrates with existing hydrogen storage technologies: Energetic and economic evaluations. Int. J. Hydrogen Energy 2009, 34, 9173–9180. [Google Scholar] [CrossRef]
- Ozaki, M.; Tomura, S.; Ohmura, R.; Mori, Y.H. Comparative study of large-scale hydrogen storage technologies: Is hydrate-based storage at advantage over existing technologies? Int. J. Hydrogen Energy 2014, 39, 3327–3341. [Google Scholar] [CrossRef]
- Niermann, M.; Timmerberg, S.; Drünert, S.; Kaltschmitt, M. Liquid Organic Hydrogen Carriers and alternatives for international transport of renewable hydrogen. Renew. Sustain. Energy Rev. 2021, 135, 110171. [Google Scholar] [CrossRef]
- Mench, M.M. Fuel Cell Engines; Chapter 8; John Wiley & Sons: Hoboken, NJ, USA, 2008. [Google Scholar]
- Enapter Website. Available online: https://handbook.enapter.com/electrolyser/el21/downloads/Enapter_Datasheet_EL21_EN.pdf (accessed on 10 December 2020).
- Code ASME. BPVC, Section VIII, DIV 1. 2015. Available online: https://www.asme.org/wwwasmeorg/media/resourcefiles/shop/standards/newreleases/asme-bpvc-brochure.pdf (accessed on 20 December 2020).
- Züttel, A. Hydrogen storage methods. Naturwissenschaften 2004, 91, 157–172. [Google Scholar] [CrossRef] [PubMed]
- Mijalev, M.F. Cálculo y Diseño de Máquinas y Aparatos de la Industria Química; Mijalev, M.F., Tretiakov, N.P., Milchenko, A.l., Zobnin, Y.V., Eds.; Yneshtorgizdat: Moscú, Russia, 1986. [Google Scholar]
- Moss, D.R. Pressure Vessel Design Manual: Illustrated Procedures for Solving Every Mayor Pressure Vessel Design Problem, 2nd ed.; Gulf Publishing Company: Houston, TX, USA, 1987. [Google Scholar]
- Megyesy, E.F. Manual de Recipientes a Presión: Diseño y Cálculo; Limusa: Mexico City, Mexico, 1992. [Google Scholar]
- Sinnott, R.K. Chemical Engineering Design; Elsevier Butterworth-Heinemann: Oxford, UK, 2005. [Google Scholar]
- Nižetić, S.; Tolj, I.; Papadopoulos, A.M. Hybrid energy fuel cell based system for household applications in a Mediterranean climate. Energy Convers. Manag. 2015, 105, 1037–1045. [Google Scholar] [CrossRef]
- Nižetić, S.; Duić, N.; Papadopulos, A.M.; Tina, G.M.; Grubišić-Čabo, F. Energy efficiency evaluation of a hybrid energy system for building applications in a Mediterranean climate and its feasibility aspect. Energy 2015, 90, 1171–1179. [Google Scholar] [CrossRef]
- Domingos, R.M.A.; Pereira, F.O.R. Comparative cost-benefit analysis of the energy efficiency measures and photovoltaic generation in houses of social interest in Brazil. Energy Build. 2021, 243, 111013. [Google Scholar] [CrossRef]
- Isa, N.M.; Das, H.S.; Tan, C.W.; Yatim, A.H.M.; Lau, K.Y. A techno-economic assessment of a combined heat and power photovoltaic/fuel cell/battery energy system in Malaysia hospital. Energy 2016, 112, 75–90. [Google Scholar] [CrossRef]
- Budak, Y.; Devrim, Y. Investigation of micro-combined heat and power application of PEM fuel cell systems. Energy Convers. Manag. 2018, 160, 486–494. [Google Scholar] [CrossRef]
- Uhm, S.; Jeon, H.; Kim, T.J.; Lee, J. Clean hydrogen production from methanol-water solutions via power-saved electrolytic reforming process. J. Power Sources 2012, 198, 218–222. [Google Scholar] [CrossRef]
- Gökçek, M.; Kale, C. Optimal design of a Hydrogen Refuelling Station (HRFS) powered by Hybrid Power System. Energy Convers. Manag. 2018, 161, 215–224. [Google Scholar] [CrossRef]
- Marocco, P.; Ferrero, D.; Lanzini, A.; Santarelli, M. Optimal design of stand-alone solutions based on RES + hydrogen storage feeding off-grid communities. Energy Convers. Manag. 2021, 238, 114147. [Google Scholar] [CrossRef]
- Basu, S.; John, A.; Akshay; Kumar, A. Design and feasibility analysis of hydrogen based hybrid energy system: A case study. Int. J. Hydrogen Energy 2021, 46, 34574–34586. [Google Scholar] [CrossRef]
Publisher’s Note: MDPI stays neutral with regard to jurisdictional claims in published maps and institutional affiliations. |
© 2021 by the authors. Licensee MDPI, Basel, Switzerland. This article is an open access article distributed under the terms and conditions of the Creative Commons Attribution (CC BY) license (https://creativecommons.org/licenses/by/4.0/).