Abstract
High-velocity and long-lifetime operating conditions of modern high-speed energy storage flywheel rotors may create the necessary conditions for failure modes not included in current quasi-static failure analyses. In the present study, a computational algorithm based on an accepted analytical model was developed to investigate the viscoelastic behavior of carbon fiber reinforced polymer composite flywheel rotors with an aluminum hub assembled via a press-fit. The Tsai-Wu failure criterion was applied to assess failure. Two simulation cases were developed to explore the effects of viscoelasticity on composite flywheel rotors, i.e., a worst-case operating condition and a case akin to realistic flywheel operations. The simulations indicate that viscoelastic effects are likely to reduce peak stresses in the composite rim over time. However, viscoelasticity also affects stresses in the hub and the hub-rim interface in ways that may cause rotor failure. It was further found that charge-discharge cycles of the flywheel energy storage device may create significant fatigue loading conditions. It was therefore concluded that the design of composite flywheel rotors should include viscoelastic and fatigue analyses to ensure safe operation.
1. Introduction
State-of-the-art high-speed flywheel energy storage systems (FESS) are recognized for several advantageous characteristics including a high charge and discharge rate, lifetimes ranging from 10 to 20 years and high specific energy up to 100 Wh·kg−1 [1]. Further, they are unaffected by depth of discharge or cycling effects common to electrochemical batteries and have a relatively high cycle efficiency—up to 95% depending on the electrical components [2]. While the high efficiency and long expected lifetime make FESS an attractive alternative over other short- and medium-term energy storage options, these same attributes pose design and operational challenges.
The majority of studies on fiber reinforced polymer (FRP) composite flywheel rotors have focused on instantaneous, or time-independent, behavior of composite rotors and hubs to optimize performance or minimize cost [3,4,5]. If rotor failure is considered, it is typically seen as a quasi-static process caused by excessive centrifugal loading exceeding material ultimate strengths [6]. While attempts have been made to predict rotor failure with progressive damage models [7], they largely neglect to incorporate viscoelasticity into the stress and failure analyses. It has been theorized that changes in the interfacial compressive forces could lead to rim separation or creep rupture [8], yet the number of studies on viscoelastic behavior in composite rotors supporting this notion are limited.
Some works presented solutions for the boundary-value problem presented by flywheel rotors constructed of viscoelastic materials and discussed creep effects [9,10]. Trufanov and Smetannikov [9] focused on flywheel rotors with an outer shell supporting an inner composite rim. Additionally, the rim is of non-uniform cross sections and features a variable winding angle, neither of which are commonly used in modern FESS [11,12]. Portnov [10] discussed a solution to the equilibrium equations to determine creep strain in rotating disks. Tzeng [13] expanded on previous works by simulating filament-wound composite flywheel rotors with uniform rotor cross section and discussing viscoelastic behavior at 10 years and infinite time (1010 h). Tzeng showed that viscoelastic stress relaxation of approximately 35% in the radial direction and a corresponding increase of approximately 9% in the circumferential direction can occur over the lifetime of the rotor. Emerson [14] conducted experimental investigations on flywheel rotors subjected to three temperatures and speed profiles over the course of 2 months using optoelectronic strain measurements. While rotor creep tests were inconclusive due to a mechanical failure, this work did not rule out any significant impact of creep on strains imposed for the press-fit assembly of the rotor. A similar conclusion was found elsewhere [15].
While there have been developments in the understanding of viscoelastic behavior of flywheel rotors, related insights do not necessarily translate well to typical use cases. For example, FESS in public transit [16] are installed with a vacuum enclosure that minimizes temperature fluctuations. Expected lifetimes are 10 to 20 years. In addition, load cycling occurs every few minutes, with viscoelastic effects effectively being negligible in between cycles. For other promising FESS applications, such as electric vehicle (EV) charging and renewable energy grid support, cycle times are likely much longer than for FESS in public transit, yet temperature conditions and timeframes would be similar.
The present study seeks to describe the viscoelastic behavior of composite flywheel rotors during their expected lifetimes using a computational algorithm to predict the stress evolution in the rotor. Additionally, the Tsai-Wu criterion is used to describe the total stress state, combining radial, circumferential, and axial stress to predict rotor failure. The simulated rotor material is a filament-wound carbon fiber reinforced polymer (CFRP) composite [17,18,19], similar to those typically used in flywheel rotor construction, making its application here appropriate. The rotor also includes an aluminum hub that facilitates the connection between the motor/generator unit and the bearing system. The effects of creep and viscoelastic stress relaxation on a flywheel rotor are examined with respect to two primary rotor failure modes: (i) separation between hub and rotor rims, and (ii) matrix cracking.
2. Composite Flywheel Rotor Modeling
2.1. Analytical Model Description
The analytical model has been discussed in several publications, therefore only a brief description will be provided here. While the present study focuses on the solution of a single-rim rotor, the analysis can be generalized to multi-rim rotors as described in [20], variable thickness rotors [21], and functionally graded materials [22]. The stress development in the thick composite rotor is assumed to be axisymmetric, meaning the resultant stresses and strains are independent of the circumferential coordinate. The material used for these rotors is a unidirectional filament-wound FRP composite where the winding angle is taken to be circumferential, i.e., 90°. Hence, the composite is assumed to be transversely isotropic. Additionally, it was assumed the aluminum hub and composite rim are permanently bonded, that is, the model is unable to simulate separation between hub and rim. However, the latter condition is indicated by interfacial radial stress being greater than or equal to zero. Due to axisymmetry, the rotor response must only satisfy the governing equation in the radial direction [23]. The stress equilibrium equation in cylindrical coordinates is given as [24]
where σr and σθ are the radial and circumferential hoop stresses, which are the only non-trivial terms in the stress matrix; ρ is the material density; and ω is the rotor angular velocity. The stress-strain relationship is defined as
where is the stiffness matrix and is the strain vector. Note that the z-coordinate is associated with the rotor axial direction. The matrix is the inverse of the compliance matrix [25], such that
Considering Equation (2), the compliance matrix must define the behavior in the circumferential (parallel to fibers), radial (transverse to fibers), axial (transverse to fibers), and shear directions. Since the rotor material is assumed to be transversely isotropic with no applied shear forces, the symmetric matrix simplifies from 10 unique terms to seven. The strain in the circumferential and radial directions can be written as, respectively,
where ur is the displacement in the radial direction and r is an arbitrary location along the rotor radial direction. Invoking a plane strain assumption, strain in the axial and shear directions is defined correspondingly by Equation (5). The appropriateness of this assumption will be discussed later in this text.
Combining Equations (1), (2), and (4) yields a second order inhomogeneous ordinary differential equation. Solving this equation gives the local displacement and local stress at an arbitrary radius defined as
The C parameters are integration constants dependent on the boundary conditions and material properties. The κ and φ coefficients are intermediate terms dependent on the stiffness matrix, defined as follows:
Then, upon determining the integration constants, the radial displacement (Equation (6)) and radial stress (Equation (7)) can be found using Equation (8). Circumferential stress can be found by combining Equations (4), (6), and (8) in conjunction with the stress-strain relationship (Equation (2)).
Generalizing to a multi-rim flywheel rotor with an arbitrary number of rims, i.e., the rotor is constructed from N rims labeled j and can vary between j = 1, 2, 3… N, then the continuity condition at the interface states,
where is the radial stress at the outer radius, ro, in the jth rim, and is the radial stress at the inner radius, ri, of the next, j + 1, rim. The same notation is used to describe the radial displacements, ur, at the interface.
2.2. Tsai-Wu Failure Criterion
The general Tsai-Wu failure criterion, described in [6,7,26,27], can be reduced to nine terms for a transversely isotropic material and considering the absence of shear stresses. This criterion finds a relationship, F, between the applied stress tensor and the material tensile strengths and predicts failure when . At failure, the stress tensor represents the maximum allowable stress and F equals unity. Hence, the Tsai-Wu failure criterion can be written as
where is the allowable stress in the i = 1, 2, or 3 directions at an arbitrary point in the rotor. Note as applied herein, the 1 and 3 directions refer to the circumferential and radial stress, respectively, while the 2 direction refers to the axial direction. While the plane strain condition eliminates axial strain, it allows for axial stress; therefore, it is included in the failure criterion. Then,
where the subscripts t and c refer to the tensile and compressive ultimate strengths, respectively. The strength coefficients in the 2 and 3 directions are equal due to the transversely isotropic assumption, discussed further in Section 3.1.
It is common, and more valuable, to define the relationship between maximum allowable stress and the applied stress as the failure ratio (R) [7]. This relationship is found by combining the maximum allowable stress tensor, , with the applied stress tensor, , multiplied with R such that
Then, substituting Equation (12) into Equation (10) yields a quadratic equation, i.e.,
Solving this quadratic equation for R defines the failure ratio. When equals , then R equals unity, indicating failure, whereas R > 1 indicates is less than and no failure is predicted. It is convenient to define a strength ratio (SR) to be 1/R, as this is more intuitive conceptually and graphically [7]. Failure under this criterion is predicted when SR ≥ 1.
2.3. Computational Methodology
The computational methodology has been discussed elsewhere [13,14], so only a brief description is provided here. The analytical model, described in Section 2.1, assumes constant loads, therefore the viscoelastic solution procedure requires approximating time-varying behavior through a number of discrete time and load steps. The response at each step is used to calculate stresses and SR for the flywheel throughout the simulation. First, the rotor dimensions, material properties, and simulation parameters—including time and velocity vectors of interest—are defined as inputs to the algorithm. Then, beginning at the first time and velocity of interest, the material stiffness matrix is calculated for each rim of the flywheel rotor (here, a single-rim rotor is considered). Next, the boundary conditions at each interface and at the inner and outer surface of the rotor are calculated. Using this information, the rotor response and SR are calculated for the given time and velocity. Finally, the algorithm iterates to the next time and velocity. This continues for all discrete times and velocities of interest, which yields the induced stresses and SR for all points in the flywheel rotor at all times and velocities of interest.
3. Modeling Parameters
The flywheel rotor simulated in this study is constructed from a single CFRP rim press-fitted to an aluminum hub. The hub and rim are simulated as cylinders with rectangular cross sections.
3.1. Materials
The aluminum and CFRP are both assumed to be uniform throughout the rotor and free of defects. Referring to [28], the aluminum exhibits negligible viscoelastic response at temperatures below 50 °C, therefore viscoelastic behavior in the aluminum is not considered. The material properties of the chosen 7075-T6 aluminum are found in [29].
The composite considered in this study is IM7 carbon fiber (Hexcel Corp., Stamford, CT, USA) with an 8552 epoxy resin system (Hexcel Corp., Stamford, CT, USA), as described by Tzeng et al. [30]. The filament winding process employed for fabricating CFRP flywheel rotors utilizes continuous unidirectional fiber reinforcement, which creates a transversely isotropic behavior [31].
In the CFRP rim, the fibers run circumferentially and display only subtle viscoelastic characteristics. The long-term behavior of a CFRP in the transverse direction is often described using a time-temperature superposition (TTSP) master curve. This curve is created by measuring short-term creep data at various elevated temperatures. Then, a shift factor is applied to the elevated temperature experimental data to shift them temporally, increasing the time axis while decreasing the temperature. Shifting all elevated temperature experimental data creates a smooth master curve representing the lifetime strain and compliance behavior, provided the applied stress from experimentation is known. Finally, curve fitting is performed on the master curve to generate empirical equations for the creep compliance. TTSP is applicable for modeling linear viscoelasticity, which is acceptable for this application as permanent damage, material aging, and other higher order effects are excluded from this simulation. The transverse compliance equations published by Tzeng et al. [30] are given in Table 1 and Equation (14), as are the aluminum properties, where variable t indicates time. The tensile strengths of the CFRP and yield strength of the aluminum necessary for the Tsai-Wu criteria are given in Table 2.

Table 1.
Material properties for aluminum 7075-T6 [29] and viscoelastic equations for CFRP [30] used in the present study.
Table 2.
Directionally dependent strengths of CFRP and yield strength of aluminum used to find SR from the Tsai-Wu failure criterion.
3.2. Flywheel Rotor Simulation Parameters
Two cases were considered to investigate the effects of viscoelastic behavior on the flywheel rotor. The first case simulates a worst-case scenario for creep and viscoelastic stress relaxation in the flywheel rotor. The second case more closely simulates a realistic scenario of an FESS experiencing daily charge/discharge cycles. The FESS capacity and flywheel rotor dimensions are identical between the two cases. Recent studies on appropriate sizing of FESS have identified various values ranging between 3 kWh and 20 kWh for residential applications, light rail transit, electric vehicle charging, and frequency regulation for microgrid applications [16,31,32]. For the present study, a capacity of 10 kWh was chosen as it is situated in the middle of the range for the applications mentioned above. Note that energy storage capacity scales linearly with rotor height (axial dimension), and scaling is not expected to affect creep behavior appreciably, so the chosen rotor configuration can easily be scaled up or down to adjust for a given application. This scaling could be done, as suggested in [33], by stacking individual composite disks on top of one another to form the rotor, in which case, the analysis for each individual disk is performed as described herein while capacity may be increased or decreased as needed. To illustrate the chosen capacity, a recent study [34] on residential photovoltaic (PV) potential in Lethbridge, Alberta, Canada, identified that the majority of residential homes had roof space for up to 10 kW of solar PV, meaning the FESS in this study could reasonably be expected to reach full capacity throughout the day even under less than ideal irradiation conditions, in order to provide power during high demand times such as in the evening. The simulated flywheel rotor dimensions and energy capacity used in this study are given in Figure 1 and Table 3. Note that changing power demand would necessarily require accelerating or decelerating the flywheel rotor, imposing shear stresses, which is not included in the current model, hence justifying the aforementioned biaxial stress condition.
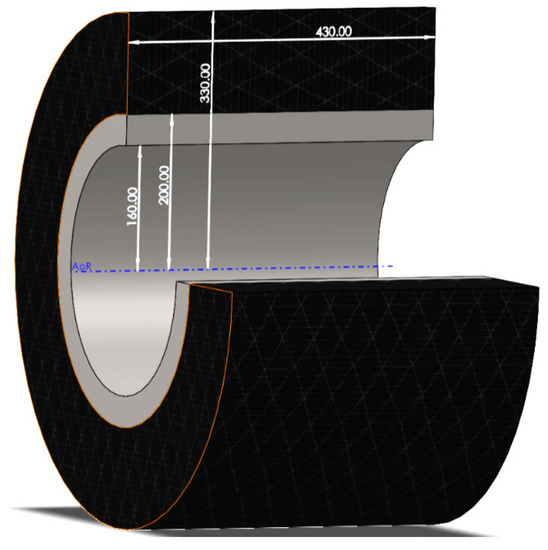
Figure 1.
Simulated flywheel rotor showing dimensions of metallic hub and carbon fiber rim. The axis of rotation (AoR) is shown in blue.
Table 3.
Flywheel rotor rim dimensions, press-fit interference, and energy capacity.
Case 1: The worst-case scenario for viscoelastic effects is simulated by assuming the flywheel rotor to operate at its limit load at all times. The model was used to simulate 10 years of operation. Based on the Tsai-Wu failure criterion, a critical or limit velocity, ωlimit, was determined as 24,250 rpm. Note that failure is initially indicated at this velocity, for an SR lightly above unity (1.01); however, viscoelastic stress relaxation will improve the stress state, allowing for safe operation at this velocity over the long term.
Case 2: This scenario is intended to more realistically simulate the application of an FESS in solar PV electric grids or EV charging support. For these applications, the FESS is assumed to experience a single charge/discharge cycle every day as the system charges during off-peak hours and discharges during peak hours. Peak electricity demands are typically observed in the mornings and evenings [35], which are also when PV systems have low productivity; therefore, a household would rely on the FESS during these times to operate appliances or support the charging of a vehicle. (It should be mentioned here that the considered FESS capacity is not sufficient to fully charge typical EVs on the market. Rather, energy storage is seen as a means to support EV fast charging and associated peak loads.) Minimum demands are observed in the middle of the day when a PV system is most productive, thereby recharging the system. For this study, each day is divided into three 8-h phases and assigned a different average velocity for each period. These are referred to as the maximum phase, intermediate phase, and minimum phase. It is recognized that charging or discharging the FESS may occur over a period of hours; therefore, the intermediate phase represents the average velocity during the charge-discharge periods. Attempting to simulate a real-world scenario, the rotor is assumed to operate below ωlimit; therefore, the velocity during the maximum phase, ωPmax, is set at 0.9 ωlimit. For the minimum phase, the angular velocity, ωPmin, is chosen to be 0.25 ωlimit, as discussed in [36]. Finally, the intermediate phase angular velocity, ωPint, is halfway between ωPmax and ωPmin, i.e., 0.575 ωlimit. The rotor is simulated to rotate at each velocity, i.e., ωPmax, ωPint and ωPmin, for 8 h each day, for 365 days per year.
4. Results and Discussion
Filament-wound composite flywheel rotors may be subject to a variety of failure modes. Considering viscoelasticity and typical composite flywheel rotor construction, two failure modes are of primary concern. First, the rotor structural integrity is dependent on maintaining compressive loading at the interface between the hub and the composite rim, created by the press-fit during assembly. Therefore, in view of possible stress relaxation, a significant reduction or loss of this compressive loading may lead to rotor failure. Second, it has been shown that the prevalent polymer matrix materials for composite rotor fabrication, epoxy resins, experience creep embrittlement as they undergo viscoelastic stress relaxation, leading to an increased size and density of micro-cracks under subcritical loading conditions [37], i.e., applied loads which approach but do not exceed the matrix strength. Therefore, substantial viscoelastic stress increases the potential for micro-crack networks to substantially damage the matrix, which ultimately may lead to failure.
4.1. Algorithm Validation
The computational algorithm was validated by comparing simulation results with stress distributions for viscoelastic stress effects published by Tzeng et al. [13]. In their work, the rotor is constructed from two CFRP rims press-fitted together. The CFRP is an IM7/8552 transversely isotropic composite with no viscoelastic behavior in the fiber direction. Material properties are given in [13]. The simulation results are plotted alongside the published data in Figure 2. The close congruence that is observed between the published results and the current model provides validation that the present modeling approach is capable of accurately predicting the stress response in the flywheel rotor. Hence, model stress responses will herein be used in conjunction with the Tsai-Wu criterion to predict failure location and behavior.
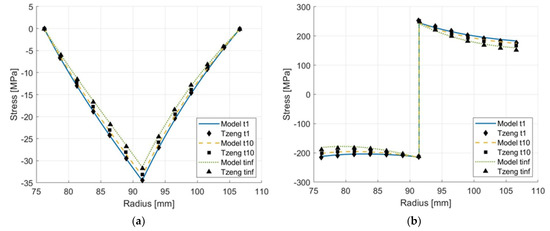
Figure 2.
Radial (a) and circumferential (b) stress distribution comparison between the current model and Tzeng et al. [13] for a two-rim press-fit CFRP flywheel rotor.
Recalling the plane strain assumption made for the present analysis, modeling results validated the chosen approach, which simplified solving the radial inhomogeneous equilibrium equation. Contrasting present work with published literature, see e.g., [14,29,37,38,39], comparable results were achieved. It should be noted that some of these studies assume generalized plane strain. In addition, analyses that quantified axial stress [40] showed it to be an order of magnitude less than radial stress, and two orders less than the circumferential stress. Given the body of published works that impose and validate the plane strain assumption, and the comparatively small magnitude of axial stress, applying a plane strain assumption for the present analysis was seen as appropriate.
4.2. Viscoelastic Behavior
4.2.1. Case 1
Simulation results in terms of radial and circumferential stress are shown in Figure 3 for the flywheel rotor constructed from an aluminum hub with a thick CFRP rim. While the hub, located between r = 160 mm and r = 200 mm, was not inherently subject to viscoelastic behavior, its stress state changed as compressive loading from the composite rim decreased.
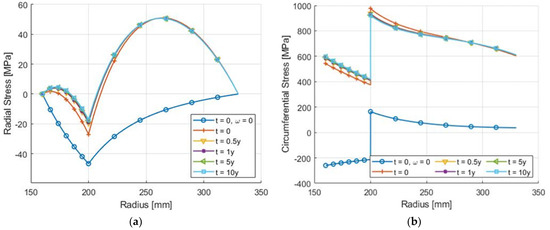
Figure 3.
Radial (a) and circumferential (b) stress predictions for a flywheel rotor constructed of an aluminum hub and CFRP rim, after assembly (zero velocity), at startup, and at various times up to 10 years of continuous operation at the limit velocity of 24,250 rpm.
Considering the radial stress data depicted in Figure 3, the composite rim, in a pristine state post-manufacturing (t = 0 and ω = 0), experiences high compressive loading, approximately −46.7 MPa, due to the press-fit assembly. After startup to ωlimit, the peak compressive load decreases to −27 MPa. This change is induced by the radial position of the hub and rim leading to differences in centrifugal loads, as well as differences in elastic modulus between the two materials. For comparison, the aluminum elastic modulus is 71 GPa while the CFRP longitudinal and transverse modulus is 111 GPa and 9.1 GPa, respectively. As a consequence, the outer rim deforms more than the aluminum hub, reducing the interfacial pressure. Note that this ability to compensate for differential deformation while maintaining rotor integrity is one advantage of a press-fit assembly.
It can further be seen in Figure 3 that circumferential stress in the aluminum hub increases over time. At the inner hub surface, circumferential stress increases from 542 MPa to 596 MPa after 10 years; an increase of 9.2%. (Note that even though this circumferential stress exceeds yield strength, the hub does not undergo failure because the stress coordinate for the given stress state still resides within the failure envelope, invoking, e.g., maximum distortion energy theory.) Additionally, the increased circumferential stress is coupled with a decrease in radial compressive stress, i.e., radial stress becomes less compressive in the aluminum hub. These changes in radial and circumferential stress are attributed to the increased compliance of the CFRP rim during this time period, allowing the hub to deform radially.
Regarding the composite rim, radial and circumferential peak stresses are predicted to decrease moderately between 1% and 5.5%, respectively, over the 10-year simulation period, which is to be expected based on previous research [14]. For greater clarity, peak stress values in the rotor over the simulated 10-year period were determined for (i) the interfacial pressure measured in the radial direction, (ii) the radial stress, and (iii) the circumferential stress. Corresponding values are given in Table 4. To illustrate their change over the simulated operation, they were normalized by their initial value at t = 0 and plotted in Figure 4. Within the first year of (continuous) operation, the rotor undergoes viscoelastic stress changes as the interfacial compressive stress decreases from −27 MPa to −19 MPa, or approximately 70.4% of the initial value. After 1 year, interfacial compressive stress decreases at a reduced rate, decreasing to 63.3% after 10 years. These results indicate that the composite material experiences rapid non-linear relaxation over the first year of operation, which to a large extent is ascribed to primary or transient creep (phase I). In the subsequent years of the rotor’s service life, stress relaxation is significantly reduced, indicating the material has fully transitioned into secondary or steady-state creep (phase II). Conceivably, the initial rapid relaxation could be avoided by subjecting the composite rim to a suitable conditioning process prior to rotor assembly. In this case, only a relative minor decrease in interfacial pressure of about 7% would be expected.
Table 4.
Rotor peak stress values for interfacial stress, radial peak stress, and circumferential peak stress at 0, 0.5, 1, 5, and 10 years of continuous flywheel operation at limit velocity.
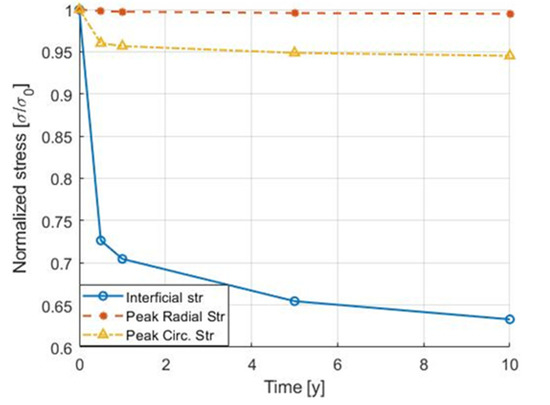
Figure 4.
Normalized rotor peak stress for interfacial pressure, radial stress, and circumferential stress over time for continuous flywheel operation at limit velocity. Values are normalized by the corresponding stress at time t = 0.
Based on present findings, while viscoelastic stress relaxation leading to hub-rim separation is a conceivable scenario, it is controllable provided adequate interfacial pressure is achieved during assembly, or substantial initial creep effects can effectively be mitigated otherwise (e.g., by CFRP rim conditioning). It is interesting to note that for a reduced press-fit interference of 0.45 mm between the hub and rim (instead of 0.8 mm), creep effects are sufficient to cause zero interfacial pressure over the considered operating time, that is, separation between hub and rim would occur. Clearly, these results demonstrate that a viscoelastic analysis is warranted for the engineering design of FESS rotors.
The Tsai-Wu failure criteria were used to determine the SR data and predict the location and angular velocity associated with rotor failure. SR data facilitate predicting failure since these data are based on the combined stresses exceeding the strength threshold. In other words, the SR analysis provides an understanding of the total stress state of the rotor. SR data for the current rotor are provided in Figure 5.
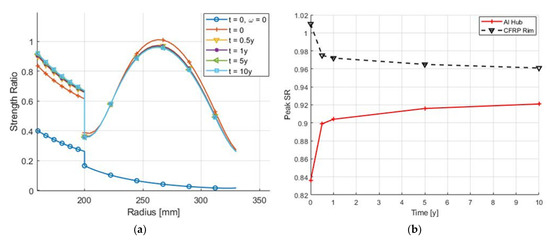
Figure 5.
Strength ratio (SR) data for the flywheel rotor (a), and peak SR in the aluminum hub and CFRP rim at various times throughout the simulated lifetime (b).
The CFRP rim initially has the highest SR of 1.01 and is located at the midplane of the rim; however, viscoelastic stress relaxation improves the stress state of this rim, so SR decreases to 0.975 within 6 months, then continues to slowly decrease to about 0.96 after 10 years. The same cannot be said for the aluminum hub, which exhibits an evolution of stresses approaching failure. The SR for the hub, while initially substantially less than the composite rim, increases from 0.836 to 0.9 within 6 months, then continues to increase to 0.92 over the following 10 years. With an increase by 6.8%, changes in SR for the hub are rapid in the first year of operation, while the SR is predicted to increase by only another 2% over the next 9 years. Referring to Figure 3, this SR growth is caused by a rising circumferential stress in conjunction with a lessening of compression in the radial direction. This behavior can be understood recalling Equation (13), which is composed of radial, circumferential, axial, and coupled terms. The linear term for radial direction is . Since the peak radial stress is compressive, a large negative value is introduced into Equation (13), thus reducing SR accordingly. As the CFRP rim undergoes viscoelastic deformation, the radial compressive load diminishes, so SRradial diminishes as well, thus removing the negative term from the equation, causing the observed SR increase for the hub.
In summary, viscoelastic stress relaxation of the CFRP rim can improve its stress state to the detriment of the aluminum hub. It is reasonable to conclude that for a given rotor geometry, changing stresses may lead to damage of the aluminum hub and/or separation between hub and rim components. Viscoelastic effects should therefore be considered in flywheel rotor design. Nevertheless, based on the present observations, limited viscoelastic stress relaxation in the rotor may also be beneficial to the overall rotor performance. While substantial phase I creep may be a concern from a risk assessment point-of-view, mechanical conditioning and/or thermal aging could be a means to mitigate large initial viscoelastic effects after rotor assembly and operational startup while allowing for phase II creep to gradually evolve over the rotor’s operational lifetime.
4.2.2. Case 2
As mentioned earlier, the load profile for case 2 is intended to more closely simulate the operation of an FESS in actual applications, such as for solar PV electric grids or EV charging. Graphs with the radial and circumferential stresses on day 1 of operation are given in Figure 6. These graphs serve as representative examples of the stress distribution for the simulated operation. While the magnitude of the radial and circumferential stresses was found to decrease in the rim and increase in the hub over time, the overall shape of the stress response at each velocity (minimum phase, ωPmin, intermediate phase, ωPint, maximum phase, ωPmax) was found to be similar for any day of the simulated operation, so only data for the first day are provided. Comparing case 1 (Figure 3) and case 2 (Figure 6), the stress responses at ωPmin and ωPmax closely resemble those from case 1 at t = 0, ω = 0 and at t = 0, ω = ωlimit, respectively, as is expected given the similarity between angular velocities and the non-linear relationship between stress and velocity. Notably, for both cases, the circumferential stress in the hub is seen to change from initially having a positive slope (ω = 0, ω = ωPmin) to having a negative slope at high-velocity operation (ωlimit, ωPmax). Between both extremes, stresses switch from tensile to compressive with the magnitude occurring at the hub inner surface. This loading scenario resembles fatigue loading with a negative stress ratio, positive mean stress, and a comparatively high stress range. The hub design should therefore include a fatigue analysis, especially for FESS that experiences high cycle rates, i.e., numerous cycles per day.
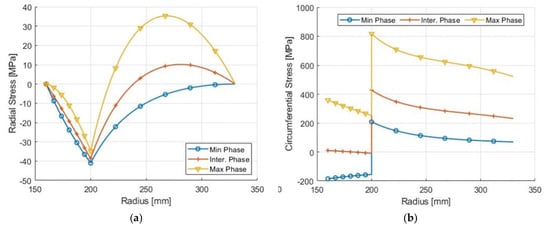
Figure 6.
Radial (a) and circumferential (b) stress results at each velocity on day 1.
Figure 7 depicts SR data for all points along the rotor radial direction at each velocity for day 1 and day 365. Again, while magnitudes at each point are seen to vary for the different velocities, the overall shape of the SR curves at each velocity bear distinct similarities. Broadly, SR graphs exhibit similar trends as in case 1. After year 1, SR values at ωPmax increase in the hub but decrease in the composite rim. As one would expect, SR values in Figure 7 are lower compared to data in Figure 5, due to the overall lower stress levels and the reduced time that the rotor operates at high velocity.
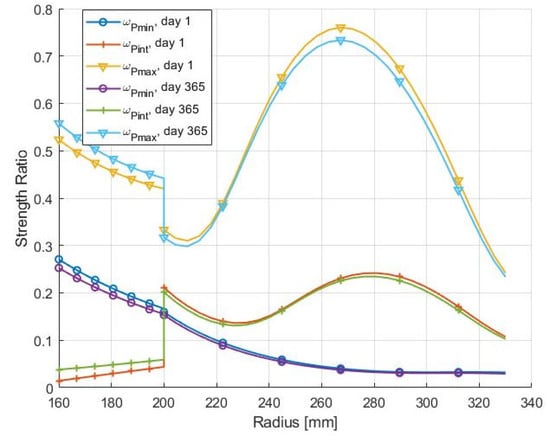
Figure 7.
SR graphs for all points along the flywheel rotor radius at each velocity on day 1.
During each phase, five key indicators are tracked throughout the simulation: (i) interface stress, (ii) peak radial tensile stress (i.e., neglecting compressive stresses, as these are found at the interface), (iii) peak circumferential stress in the CFRP rim, (iv) peak SR in the hub, and (v) peak SR in the CFRP rim. Values for each indicator recorded on day 1, 90, 180, 270, and 365 are given in Table 5. To facilitate comparisons with case 1, data from Table 5 were normalized using the day 1 value at each velocity and each location or component of interest, as depicted in Figure 8. Noting that since the peak radial tensile stress at ωPmin is negligible throughout the simulation (see Table 5), this dataset was omitted in Figure 8.
Table 5.
Peak stress values at the hub-rim interface and radially and circumferentially in the CFRP rim, and peak SR values for the aluminum hub and the CFRP rim, at various times throughout the simulated one-year period.
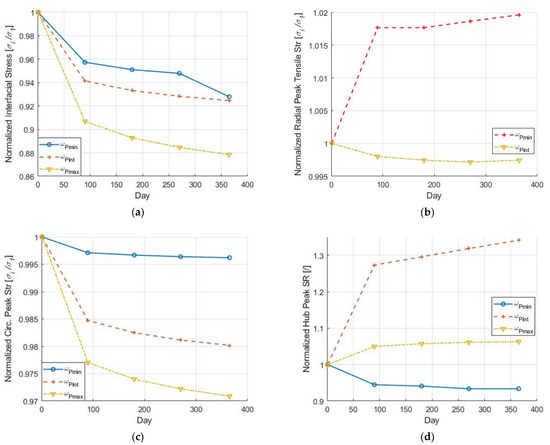
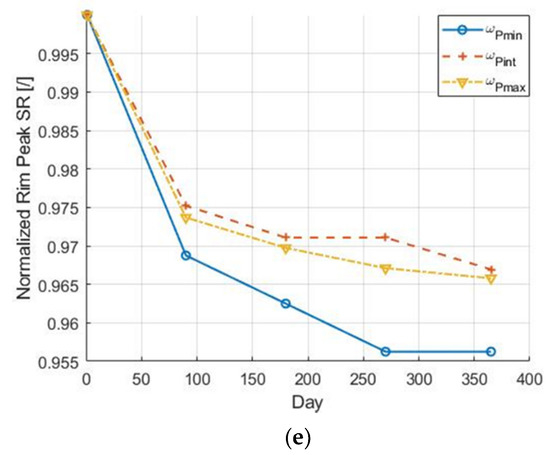
Figure 8.
Stress results normalized by their initial value on day 1 for (a) interfacial pressure, (b) peak radial tensile stress, and (c) peak circumferential stress in the CFRP rim, (d) peak SR in the aluminum hub, and (e) peak SR in the CFRP rim.
Akin to case 1, values for the interfacial pressure exhibit the most significant change during the case 2 simulation, as shown in Figure 8a. This observation again substantiates conclusions in previous work [30] which suggested that stress relaxation at the interface could pose a risk to a flywheel rotor’s structural integrity. After 1 year of operation, the interfacial pressure is predicted to decrease by approximately 7%, 7.5%, and 12% at the minimum, intermediate, and maximum velocities, respectively. However, these reductions are significantly less compared to case 1, for which a decrease of 29% is predicted after year 1. Again, lower predicted interface pressures in case 2 are due to the rotor being subjected to lower average angular velocities than in case 1, and the rotor spending less time subjected to high velocity loading conditions. Since for each charge-discharge cycle the rotor transitions from low to high velocity and vice versa, high cycle rates will typically subject the rotor to reduced viscoelastic effects, as it will spend less time at or near maximum velocities.
Considering Figure 8b,c, changes in peak stresses are rather benign. The peak radial tensile stress increases by a maximum of about 2%, which is comparable to the corresponding decrease seen in case 1. The peak circumferential stress shows a reduction of 0.5% at ωPmin and 3% at ωPmax. Reductions in both peak stress components are less than those for case 1 for the same reasons as discussed earlier.
In Figure 8d, peak SR values for the aluminum hub are indicated to decrease for ωPmin but to rise for the other two velocities. SR changes at ωPmin and ωPint, being seemingly high at the latter velocity, are largely irrelevant given the comparatively low absolute SR values for the hub at these operating conditions (see Figure 7). The rise in SR at ωPmax is considerable but is still confined to below 10% and remains uncritical. Referring to Figure 8e, the SR evolution for the CFRP rim is favorable, as observed for case 1, as values decrease over the considered operating period.
Considering relative SR changes between case 1 and case 2 at high velocity and at critical locations with respect to the rotor radial direction, i.e., the hub inner surface and the rim’s cylindrical midsection, it is apparent that magnitudes in case 2 remain below those in case 1, which is to be expected given that the rotor is subjected to an overall reduced average velocity while also operating for less time under high velocity loading conditions. For example, in case 1, after the first year, the SR for the hub increases by 6.8%, while in case 2 (at ωPmax) over the same period, the increase is 3.3%.
5. Conclusions
The high-stress and long-lifetime operating conditions of modern composite flywheel rotors create the necessary conditions for viscoelastic failure modes not included in contemporary quasi-static failure analyses. In this study, a computational algorithm, based on an accepted analytical modeling approach, was developed to investigate the viscoelastic behavior of fiber reinforced polymer composite rotors during their lifetimes. Additionally, the Tsai-Wu failure criterion was used to compute strength ratios along the rotor radial direction. The values were used to assess the conditions for rotor failure. A composite flywheel rotor design was considered that meets capacity requirements to support an electrical vehicle charging system or solar PV residential electric grid. The rotor consists of a press-fit assembly of an aluminum hub with a carbon fiber polymer composite rim. The viscoelastic behavior of the flywheel rotor was studied for two cases: (i) a worst-case scenario of the rotor operating with an angular velocity at the failure threshold for a simulated lifetime of 10 years, and (ii) a charging/discharging cycle in which the rotor experiences a minimum, intermediate, and maximum velocity for 8 h each per day over a one-year period.
The case 1 simulation indicated that due to viscoelastic stress relaxation, the radial and circumferential stresses in the composite rotor reduce over time. After 10 years, peak stress in the radial and circumferential directions were found to decrease by approximately 1% and 5%, respectively. Given that rim stresses continually decrease over time, the risk of rim failure is diminishing during operation, provided no external factors, such as matrix cracking, affect the rotor’s structural integrity. In contrast, circumferential stresses in the aluminum hub increase while radial stresses decrease. This behavior was attributed to an increasing compliance of the composite rim, allowing it to deform radially outward. Thus, radial compressive stresses in the rotor are reduced, and in turn, circumferential stresses in the hub are increased. The peak strength ratio for the composite rim decreases by approximately 4% compared to an 8% increase in the hub after 10 years. The latter is of concern, as the peak strength ratio in the aluminum hub converges toward unity, suggesting an increased risk of hub failure. The interfacial press-fit pressure is subject to the largest decrease, approximately 36%. Still, taken on its own, this behavior represents a low risk to the flywheel rotor’s structural integrity as long as the rotor design prescribes a sufficient initial press-fit interference that upholds compressive interfacial pressure over the rotor’s lifetime. Based on the observation in case 1, failure may occur in the rim at startup if the rotor reaches a critical velocity, but would decrease over time even if the critical velocity is maintained as viscoelastic stress relaxation improves the overall stress state in the composite rim. However, this behavior does not preclude possible failure due to other effects such as fatigue and matrix cracking, which warrants including such effects in flywheel rotor design and analysis.
The daily charge-discharge cycle considered in case 2 imposes cyclic loading conditions upon the rotor. In this scenario, strength ratios never reached unity, so failure is not predicted for any part of the rotor. Consistent with case 1, viscoelastic stress relaxation allows the radial and circumferential stress in the composite rim to decrease over time, creating a more favorable stress state regardless of angular velocity or time. However, the viscoelastic effects that improve the stress state for the rim are detrimental to the metallic hub. Moreover, charge-discharge cycles were found to impose fatigue loading with a negative stress ratio, positive mean stress, and a comparatively high stress range at the inner surface of the hub.
In summary, the present study conducted simulations on flywheel rotors of appropriate size and over appropriate time frames for applications such as in residential PV energy systems or EV charging stations. While previous studies began to explore this topic, the present study investigated the evolution of stresses in each principal direction between 6 months and 10 years of operation. Findings from these data are vital to consider when designing flywheel rotors for similar and other applications. The simulations conducted in the present study support the notion that viscoelastic effects reduce peak stresses in a composite rim over time. However, this study also showed that viscoelasticity may affect stresses in other parts of the rotor, i.e., the hub and the hub-rim interface, in ways that may lead to rotor failure. Moreover, it was noted that charge-discharge cycles of the flywheel energy storage device may create significant fatigue loading conditions. Therefore, it is concluded that flywheel rotor design should include viscoelastic and fatigue analyses to ensure safe operation, especially for devices experiencing high cycle rates and long-time operation near critical velocities.
Author Contributions
Conceptualization and methodology, M.S. and P.M.; validation, formal analysis, investigation, M.S.; resources, P.M.; data curation, M.S.; writing—original draft preparation, visualization, M.S.; writing—review and editing, M.S. and P.M.; supervision, project administration, funding acquisition, P.M. All authors have read and agreed to the published version of the manuscript.
Funding
This research and the APC was funded by the Canada First Research Excellence Fund with grant number Future Energy Systems T06-P03.
Institutional Review Board Statement
Not applicable.
Informed Consent Statement
Not applicable.
Data Availability Statement
Flywheel rotor simulation algorithm and data available from: mskin001/Flywheel_Rotor_Simulation at Cyclic_Simulation (github.com).
Conflicts of Interest
The authors declare no conflict of interest.
References
- Hadjipaschalis, I.; Poullikkas, A.; Efthimiou, V. Overview of current and future energy storage technologies for electric power applications. Renew. Sustain. Energy Rev. 2009, 13, 1513–1522. [Google Scholar] [CrossRef]
- Luo, X.; Wang, J.; Dooner, M.; Clarke, J. Overview of current development in electrical energy storage technologies and the application potential in power system operation. Appl. Energy 2015, 137, 511–536. [Google Scholar] [CrossRef] [Green Version]
- Takkar, S.; Gupta, K.; Tiwari, V.; Singh, S.P. Dynamics of Rotating Composite Disc. J. Vib. Eng. Technol. 2019, 7, 629–637. [Google Scholar] [CrossRef]
- Yang, L.; Crawford, C.; Ren, Z. A Fuzzy Satisfactory Optimization Method Based on Stress Analysis for a Hybrid Composite Flywheel. IOP Conf. Ser. Mater. Sci. Eng. 2018, 398, 012032. [Google Scholar] [CrossRef]
- Mittelstedt, M.; Hansen, C.; Mertiny, P. Design and multi-objective optimization of fiber-reinforced polymer composite flywheel rotors. Appl. Sci. 2018, 8, 1256. [Google Scholar] [CrossRef] [Green Version]
- Hartl, S.; Schulz, A.; Sima, H.; Koch, T.; Kaltenbacher, M. A Static Burst Test for Composite Flywheel Rotors. Appl. Compos. Mater. 2016, 23, 271–288. [Google Scholar] [CrossRef]
- Corbin, C.K. Burst Failure Prediction of Composite Flywheel Rotors: A Progressive Damage Approach via Stiffness Degredation; Stanford University: Stanford, CA, USA, 2005. [Google Scholar]
- Arnold, S.M.; Saleeb, A.F.; Al-Zoubi, N.R. Deformation and life analysis of composite flywheel disk systems. Compos. Part B Eng. 2002, 33, 433–459. [Google Scholar] [CrossRef]
- Trufanov, N.A.; Smetannikov, O.Y. Creep of Composite Energy Accumulators. Strength Mater. 1991, 23, 671–675. [Google Scholar]
- Portnov, G.G. Estimation of Limit Strains in Disk-Type Flywheels Made of Compliant Elastomeric Matrix Composite Undergoing Radial Creep. Mech. Compos. Mater. 2000, 36, 55–58. [Google Scholar] [CrossRef]
- Levistor Boosting Forecourt Grid Power for the Next Generation of Fast Charging Electric Vehicles. Available online: https://levistor.com/#about (accessed on 14 August 2021).
- Stornetic GmbH Powerful Storage System for Grid Services. Available online: https://stornetic.com/assets/downloads/stornetic_general_presentation.pdf (accessed on 14 August 2021).
- Tzeng, J.T. Viscoelastic Analysis of Composite Cylinders Subjected to Rotation. Trans. Ophthalmol. Soc. 2001, 101, 200–202. [Google Scholar] [CrossRef]
- Emerson, R.P. Viscoelastic Flywheel Rotors: Modeling and Measurement; Pennsylvania State University: State College, PA, USA, 2002. [Google Scholar]
- Emerson, R.P.; Bakis, C.E. Relaxation of press-fit interference pressure in composite flywheel assemblies. In Proceedings of the 43rd International SAMPE Symposium and Exhibition, Anaheim, CA, USA, 31 May–4 June 1998; SAMPE: Anaheim, CA, USA, 1998; Volume 43, pp. 1904–1915. [Google Scholar]
- Rupp, A.; Baier, H.; Mertiny, P.; Secanell, M. Analysis of a Flywheel Energy Storage System for Light Rail Transit. Energy 2016, 107, 625–638. [Google Scholar] [CrossRef]
- Toray CARBON FIBER T700G. Available online: https://www.toraycma.com/wp-content/uploads/T700G-Technical-Data-Sheet-1.pdf (accessed on 14 August 2021).
- Majda, P.; Skrodzewicz, J. A modified creep model of epoxy adhesive at ambient temperature. Int. J. Adhes. Adhes. 2009, 29, 396–404. [Google Scholar] [CrossRef]
- Almeida, J.H.S.; Ornaghi, H.L.; Lorandi, N.P.; Bregolin, B.P.; Amico, S.C. Creep and interfacial behavior of carbon fiber reinforced epoxy filament wound laminates. Polym. Compos. 2018, 39, E2199–E2206. [Google Scholar] [CrossRef]
- Thakur, P.; Sethi, M. Creep deformation and stress analysis in a transversely material disk subjected to rigid shaft. Math. Mech. Solids 2019, 25, 17–25. [Google Scholar] [CrossRef]
- Debljinom, P.; Teorije, P.; Napona, P. Modelling of creep behaviour of a rotating disc in the presence of load and variable thickness by using SETH transition theory. Struct. Integr. Life 2018, 18, 153–160. [Google Scholar]
- Zharfi, H. Creep relaxation in FGM rotating disc with nonlinear axisymmetric distribution of heterogeneity. Theor. Appl. Mech. Lett. 2019, 9, 382–390. [Google Scholar] [CrossRef]
- Tzeng, J.T. Viscoelastic Analysis of Composite Flywheel for Energy Storage; Army Research Laboratory: Adelphi, MD, USA, 2001. [Google Scholar]
- Lekhnitskiy, S.G. Anisotropic Plates; Air Force Systems Command: Moscow, Russia, 1957.
- Ha, S.K.; Jeong, H.M.; Cho, Y.S. Optimum design of thick-walled composite rings for an energy storage system. J. Compos. Mater. 1998, 32, 851–873. [Google Scholar] [CrossRef]
- Li, S.; Sitnikova, E.; Liang, Y.; Kaddour, A.S. The Tsai-Wu failure criterion rationalised in the context of UD composites. Compos. Part A Appl. Sci. Manuf. 2017, 102, 207–217. [Google Scholar] [CrossRef]
- Tsai, S.W.; Wu, E.M. A General Theory of Strength for Anisotropic Materials. J. Compos. Mater. 1971, 5, 58–80. [Google Scholar] [CrossRef]
- Rojas, J.I.; Nicolás, J.; Crespo, D. Study on mechanical relaxations of 7075 (Al-Zn-Mg) and 2024 (Al-Cu-Mg) alloys by application of the time-temperature superposition principle. Adv. Mater. Sci. Eng. 2017, 2017, 2602953. [Google Scholar] [CrossRef] [Green Version]
- ASM International Handbook Committee. Metals Handbook Properties and Selection: Nonferrous Alloys and Special-Purpose Materials; ASM International: Geauga County, OH, USA, 1990; Volume 2, ISBN 978-0-87170-378-1. [Google Scholar]
- Tzeng, J.T. Viscoelastic Modeling of Press-Fitted Composite Cylinders. J. Compos. Tech. Res. 2001, 23, 21–27. [Google Scholar]
- Ding, H.; Chen, W.; Zhang, L. Elasticity of Transversely Isotropic Materials; Gladwell, G.M.L., Ed.; Springer: Dordrecht, The Netherlands, 2006; ISBN 9781119130536. [Google Scholar]
- Sadananda, K.; Nani Babu, M.; Vasudevan, A.K. The unified approach to subcritical crack growth and fracture. Eng. Fract. Mech. 2019, 212, 238–257. [Google Scholar] [CrossRef]
- Kheawcum, M.; Sangwongwanich, S. A Case Study on Flywheel Energy Storage System Application for Frequency Regulation of Islanded Amphoe Mueang Mae Hong Son Microgrid. In Proceedings of the 17th International Conference on Electrical Engineering/Electronics, Computer, Telecommunications and Information Technology, ECTI-CON 2020, Phuket, Thailand, 24–27 June 2020; pp. 421–426. [Google Scholar]
- Amiryar, M.E.; Pullen, K.R. A review of flywheel energy storage system technologies and their applications. Appl. Sci. 2017, 7, 286. [Google Scholar] [CrossRef] [Green Version]
- Mansouri Kouhestani, F.; Byrne, J.; Johnson, D.; Spencer, L.; Hazendonk, P.; Brown, B. Evaluating solar energy technical and economic potential on rooftops in an urban setting: The city of Lethbridge, Canada. Int. J. Energy Environ. Eng. 2019, 10, 13–32. [Google Scholar] [CrossRef] [Green Version]
- Andersen, F.M.; Baldini, M.; Hansen, L.G.; Jensen, C.L. Households’ hourly electricity consumption and peak demand in Denmark. Appl. Energy 2017, 208, 607–619. [Google Scholar] [CrossRef]
- Peña-Alzola, R.; Sebastián, R.; Quesada, J.; Colmenar, A. Review of flywheel based energy storage systems. In Proceedings of the 2011 International Conference on Power Engineering, Energy and Electrical Drives, Malaga, Spain, 11–13 May 2011. [Google Scholar] [CrossRef]
- Odegard, G.M.; Bandyopadhyay, A. Physical aging of epoxy polymers and their composites. J. Polym. Sci. Part B Polym. Phys. 2011, 49, 1695–1716. [Google Scholar] [CrossRef]
- Ha, S.K.; Yang, H.-I.; Kim, D.-J. Optimum design of a hybrid composite flywheel with permanent magnet rotor. J. Compos. Mater. 1999, 33, 1544–1575. [Google Scholar] [CrossRef]
- Pérez-Aparicio, J.L.; Ripoll, L. Exact, integrated and complete solutions for composite flywheels. Compos. Struct. 2011, 93, 1404–1415. [Google Scholar] [CrossRef]
Publisher’s Note: MDPI stays neutral with regard to jurisdictional claims in published maps and institutional affiliations. |
© 2021 by the authors. Licensee MDPI, Basel, Switzerland. This article is an open access article distributed under the terms and conditions of the Creative Commons Attribution (CC BY) license (https://creativecommons.org/licenses/by/4.0/).