
Preparation of Powders Containing Sb, Ni, and O for the Design of a Novel CO and C3H8 Sensor

 , ,
, ,  , and
, and
Abstract
1. Introduction
2. Materials and Methods
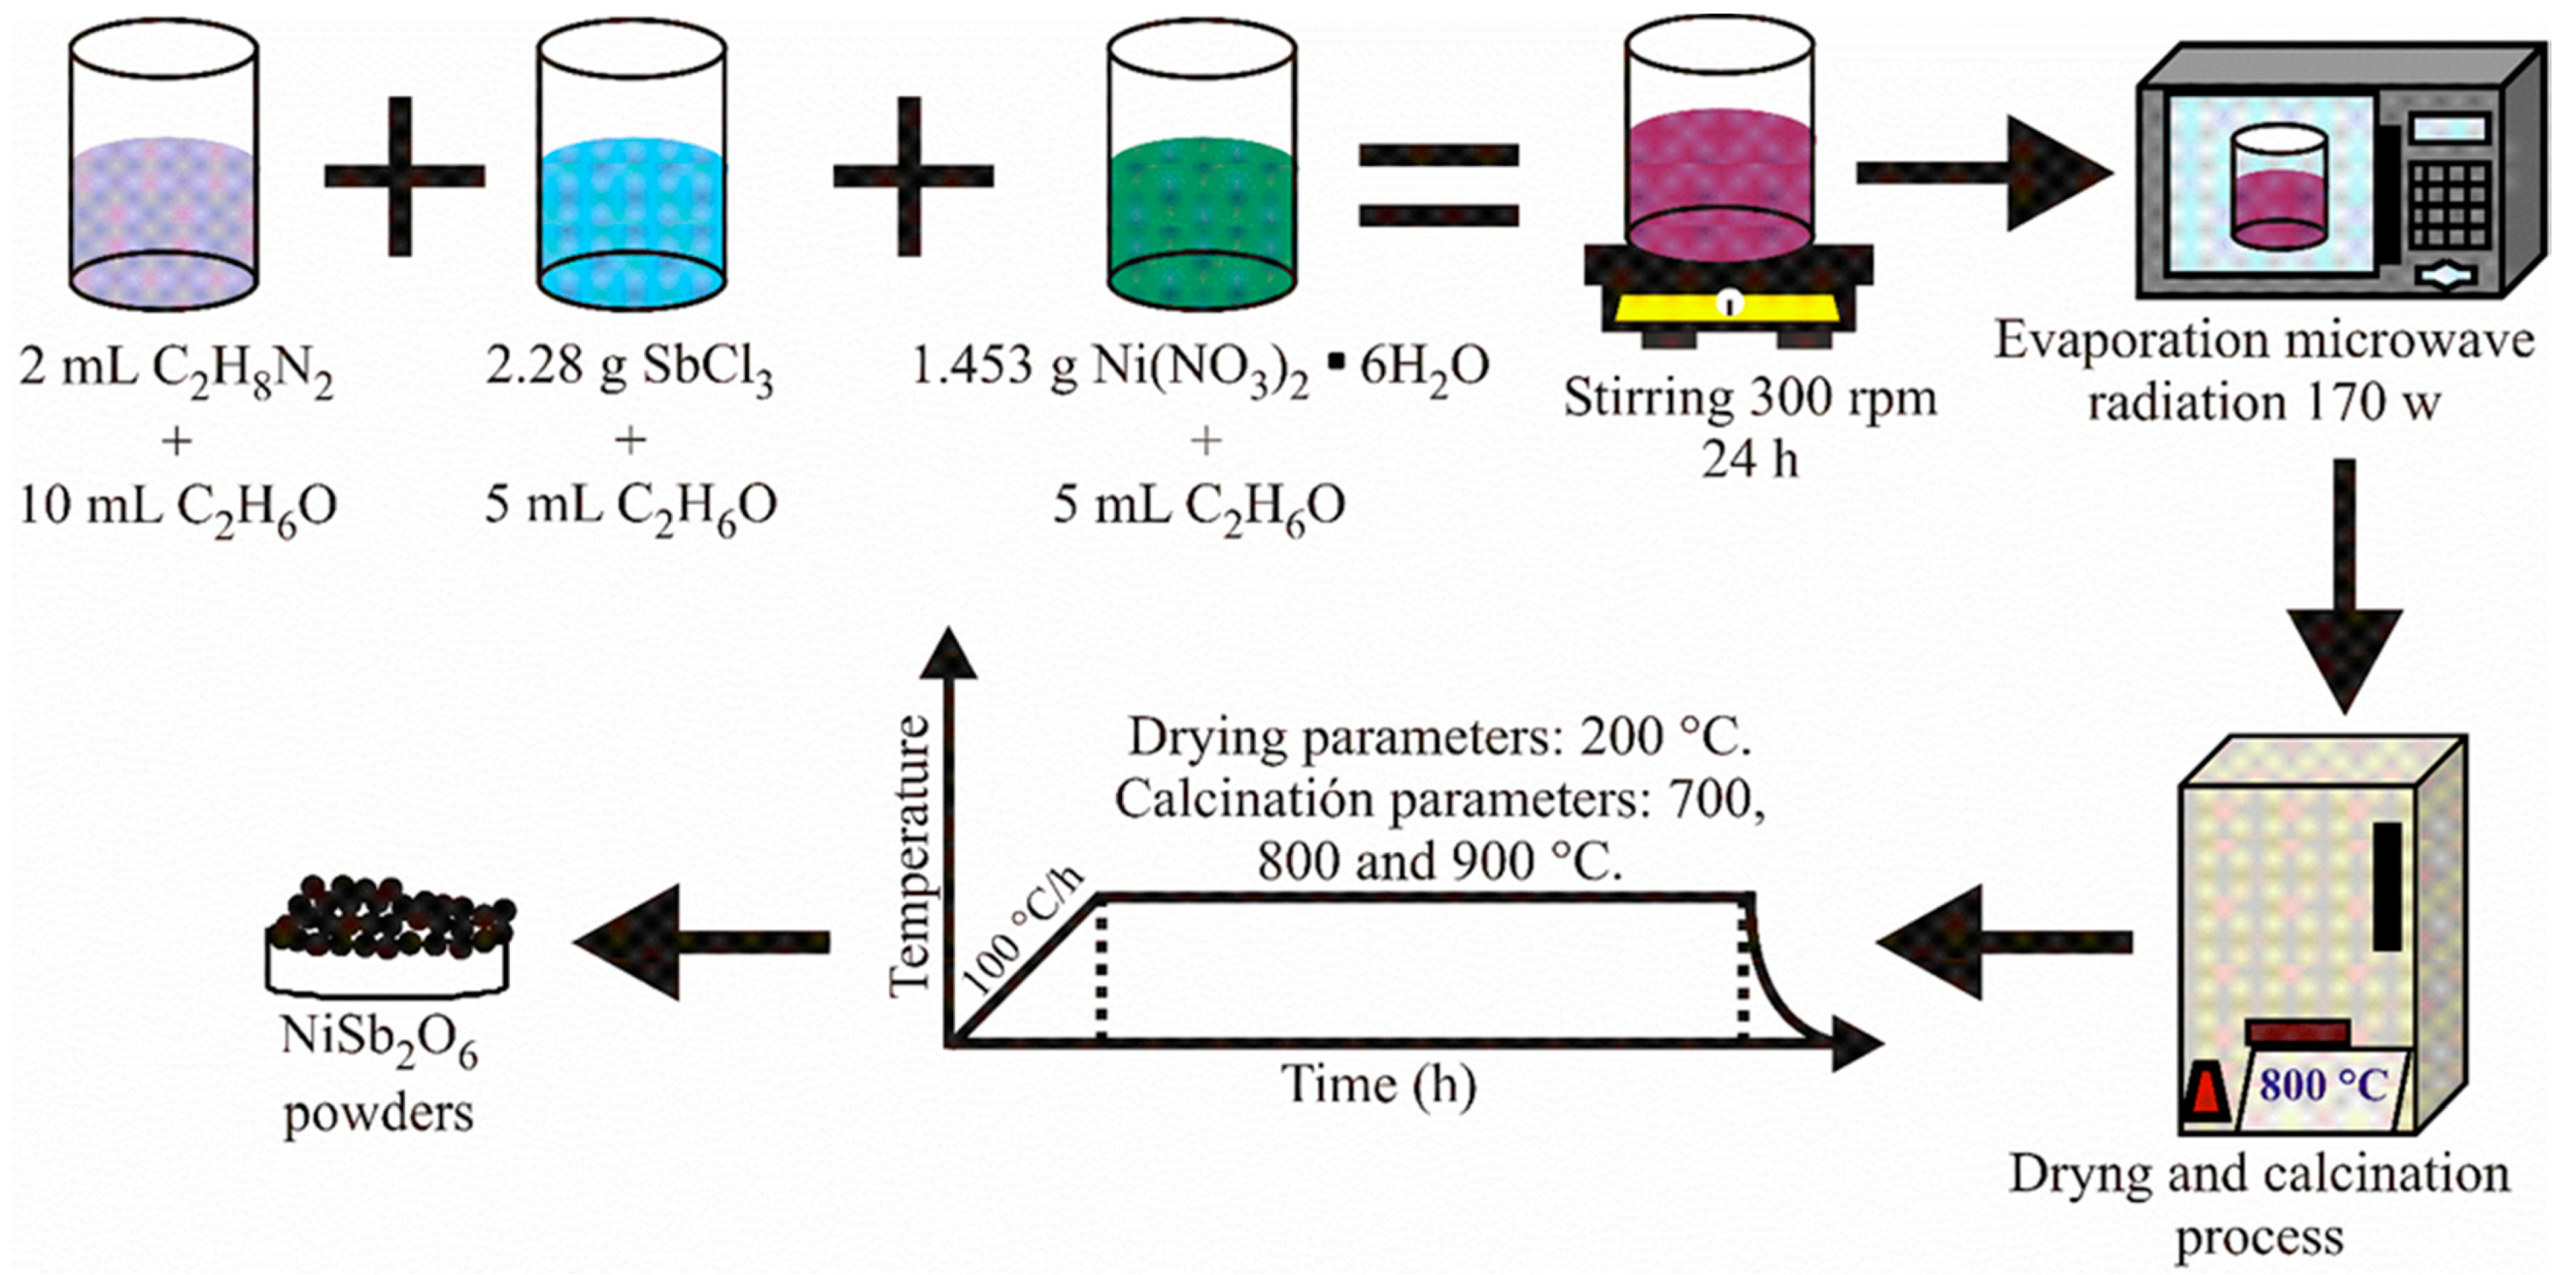
2.1. Synthesis
2.2. Physical Characterization
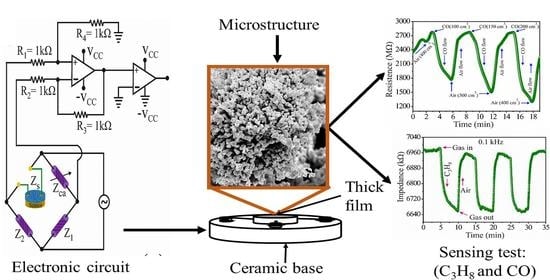
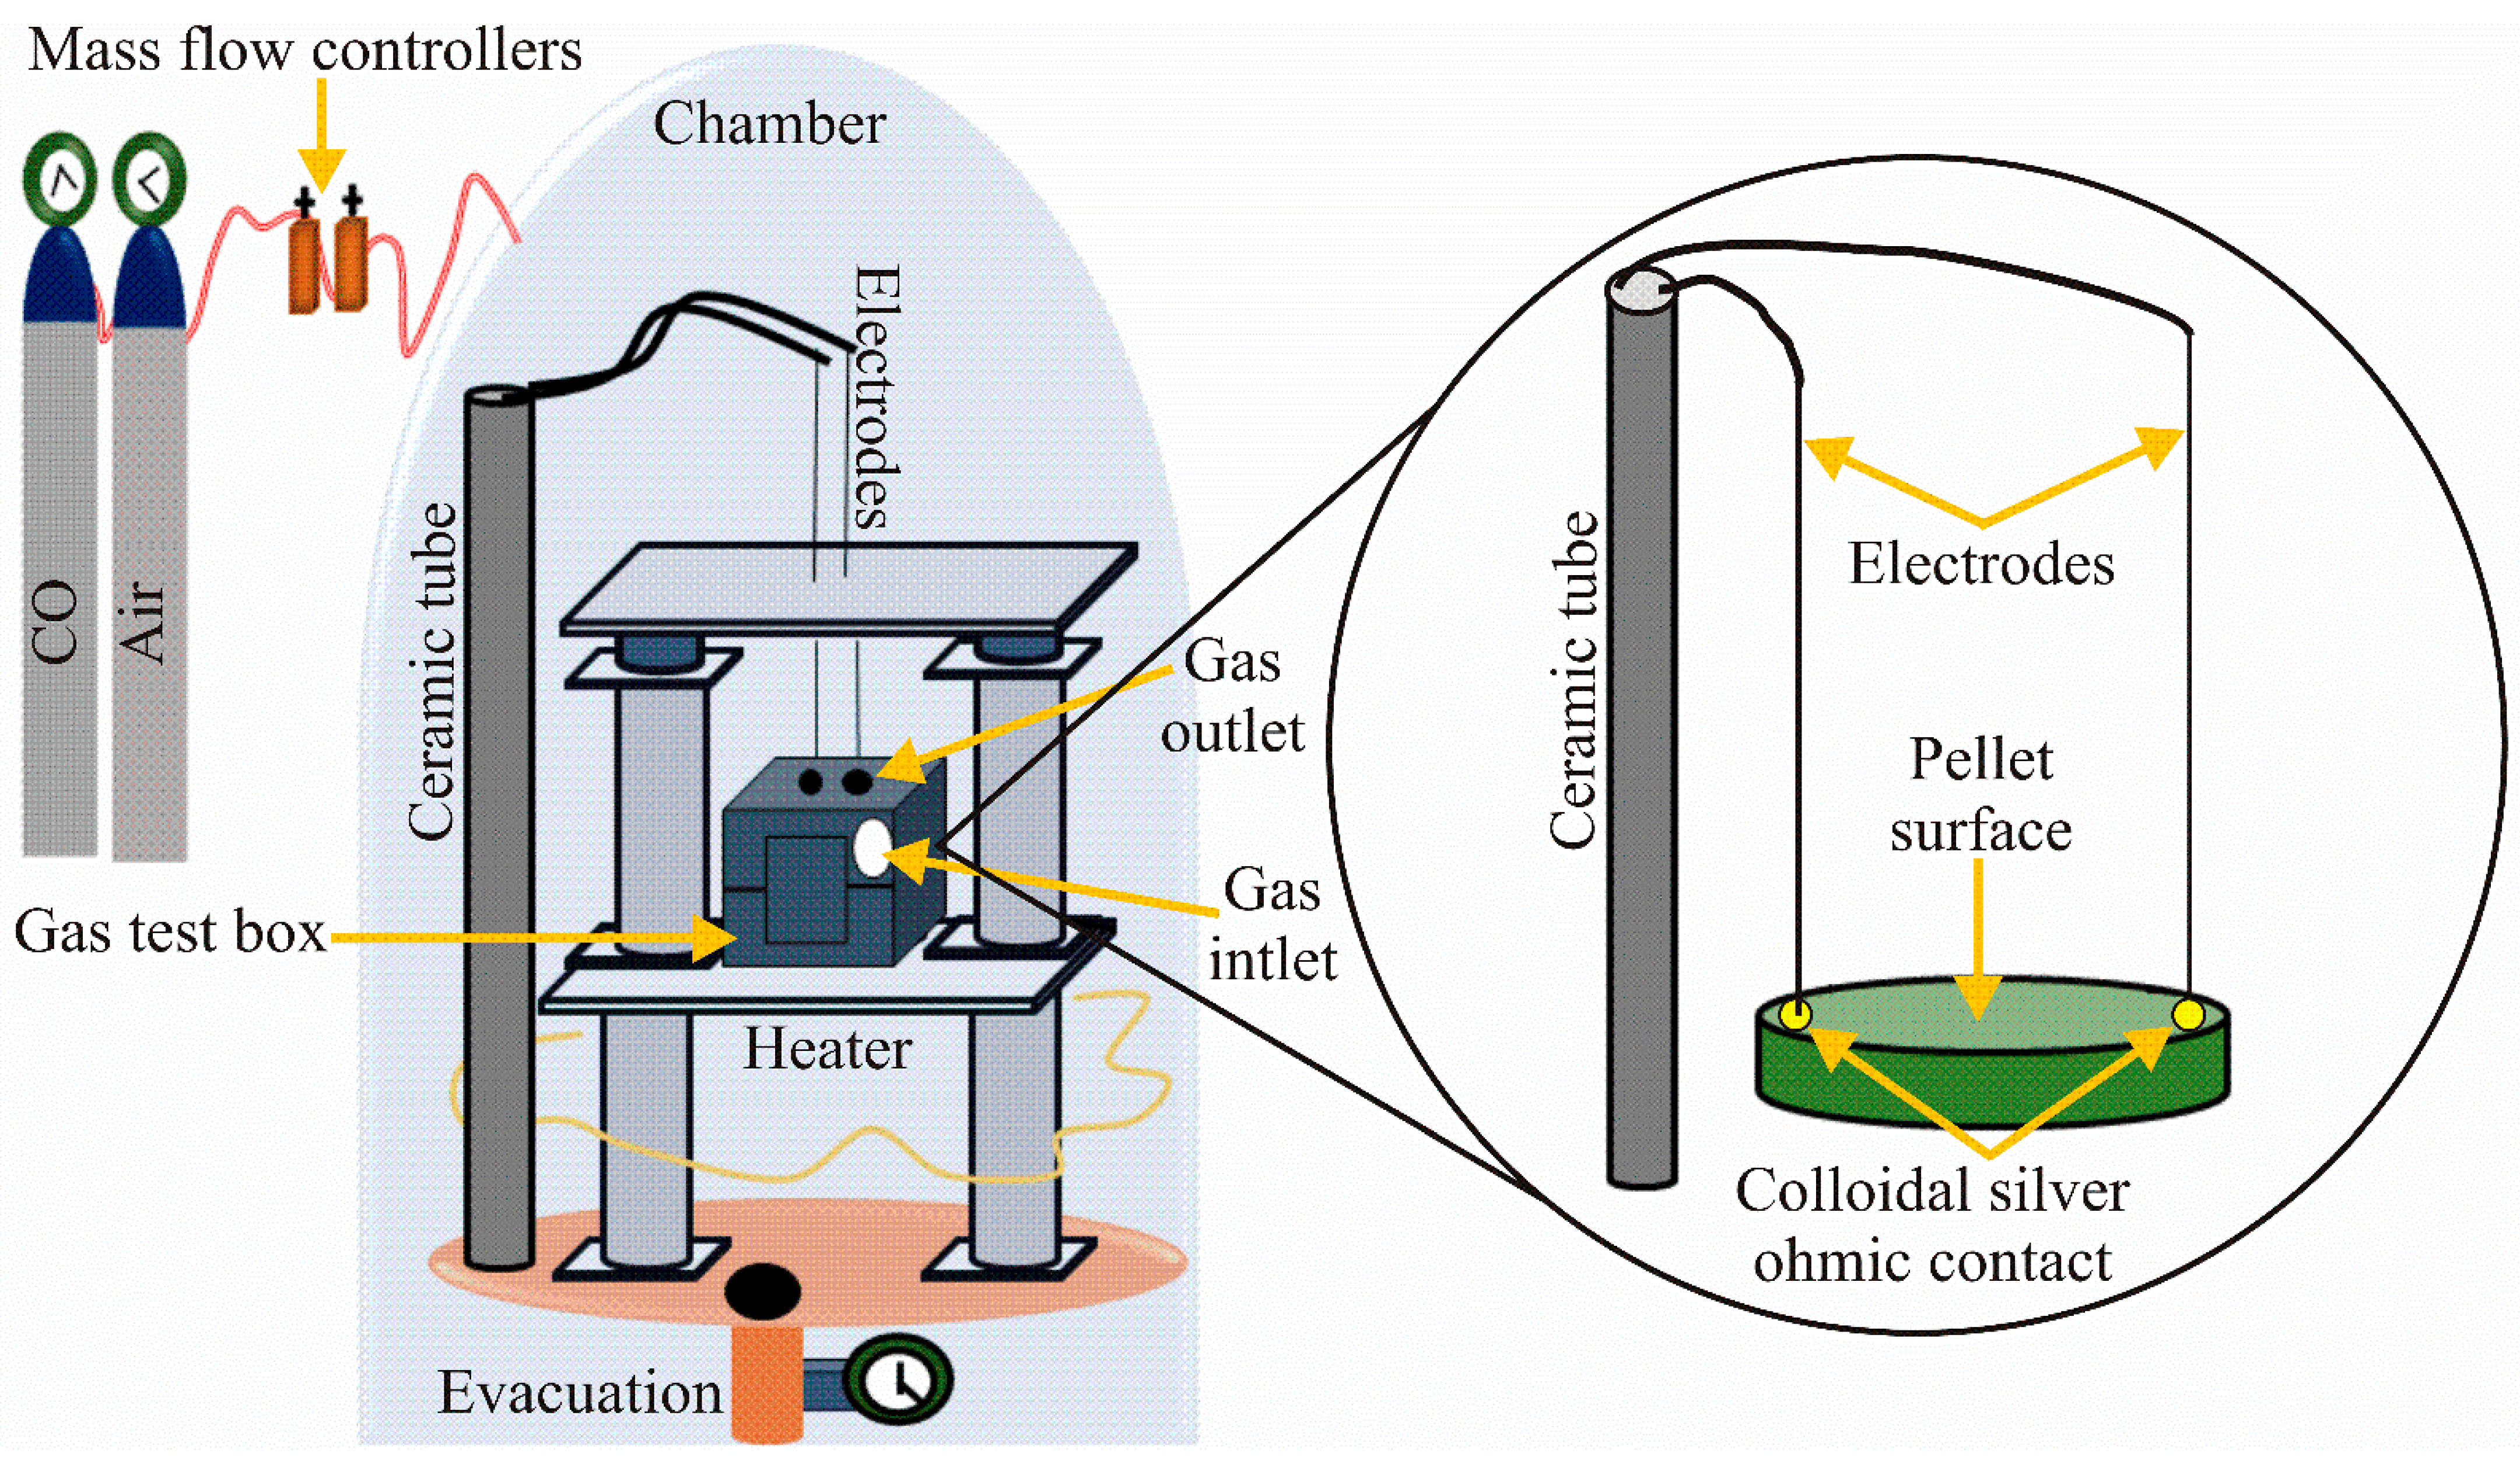
2.3. Tests in CO
2.4. Tests in Propane
3. Results and Discussion
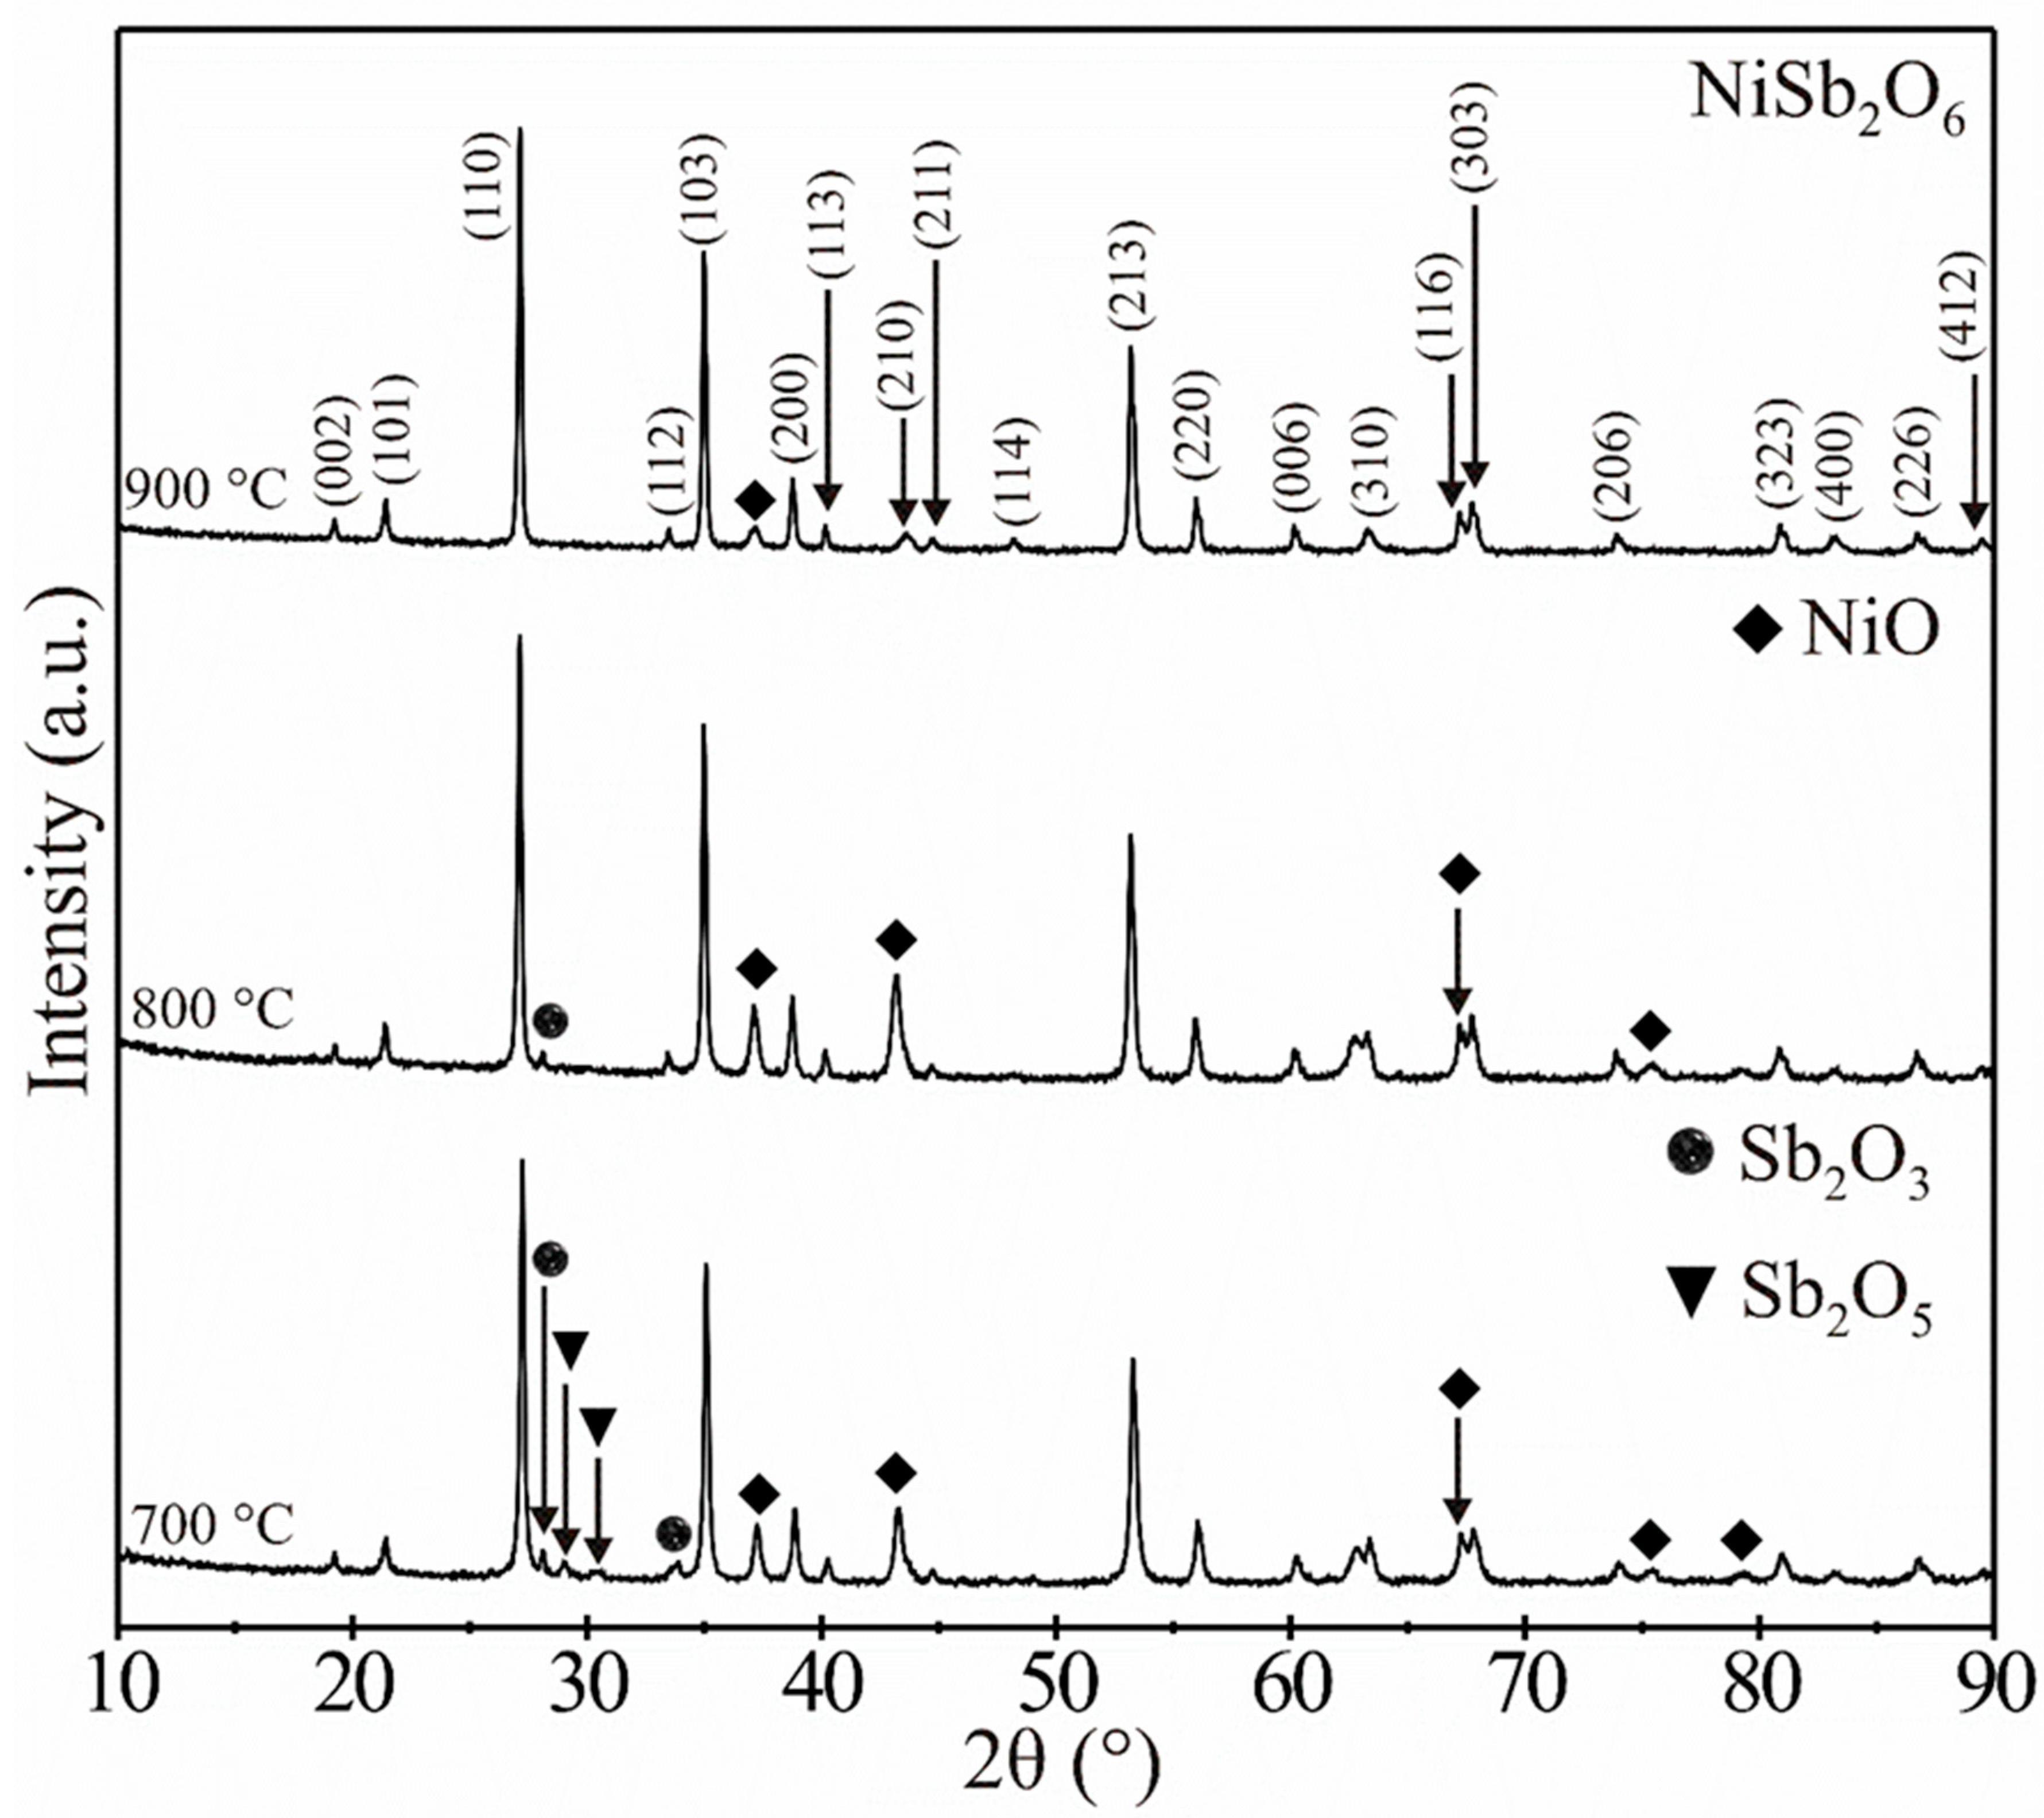
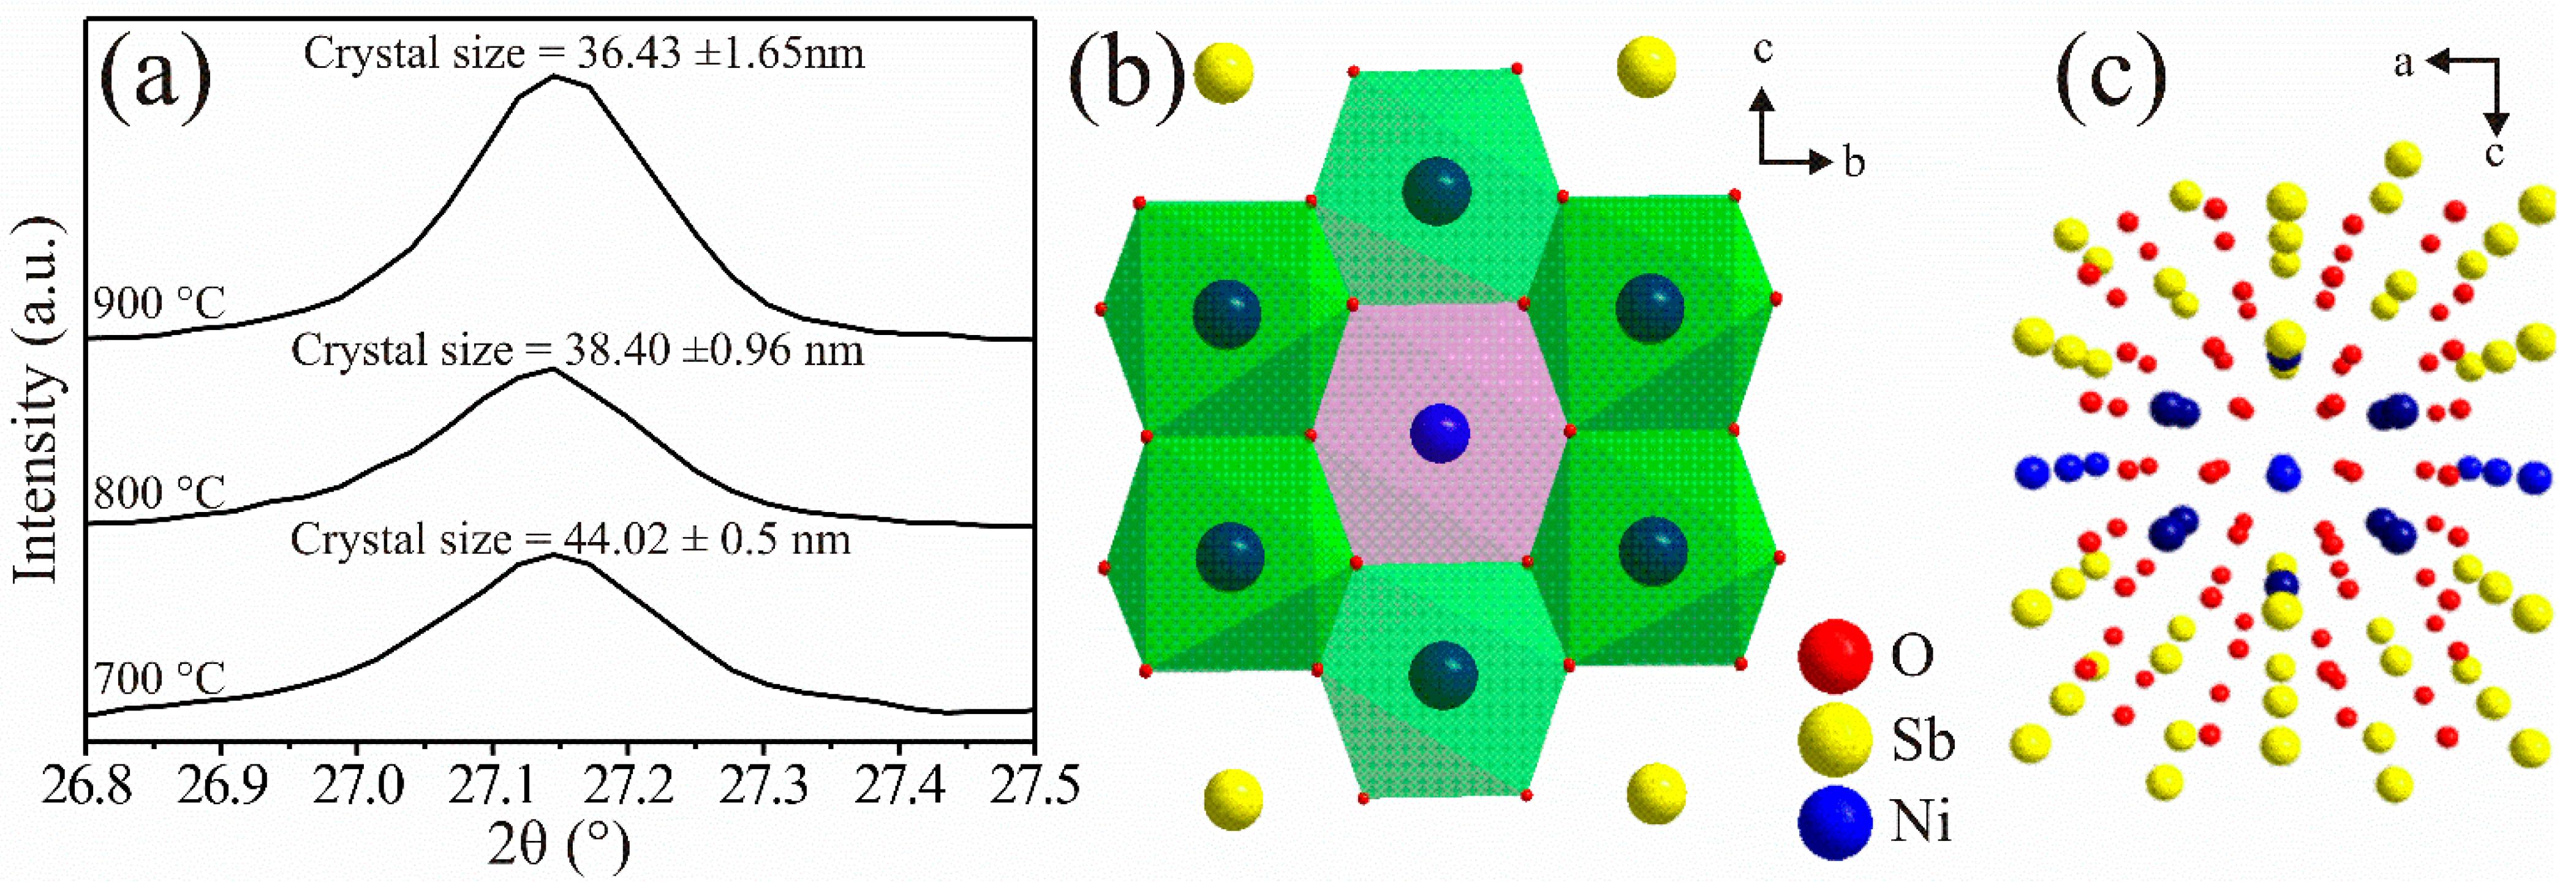
3.1. XRD Analysis
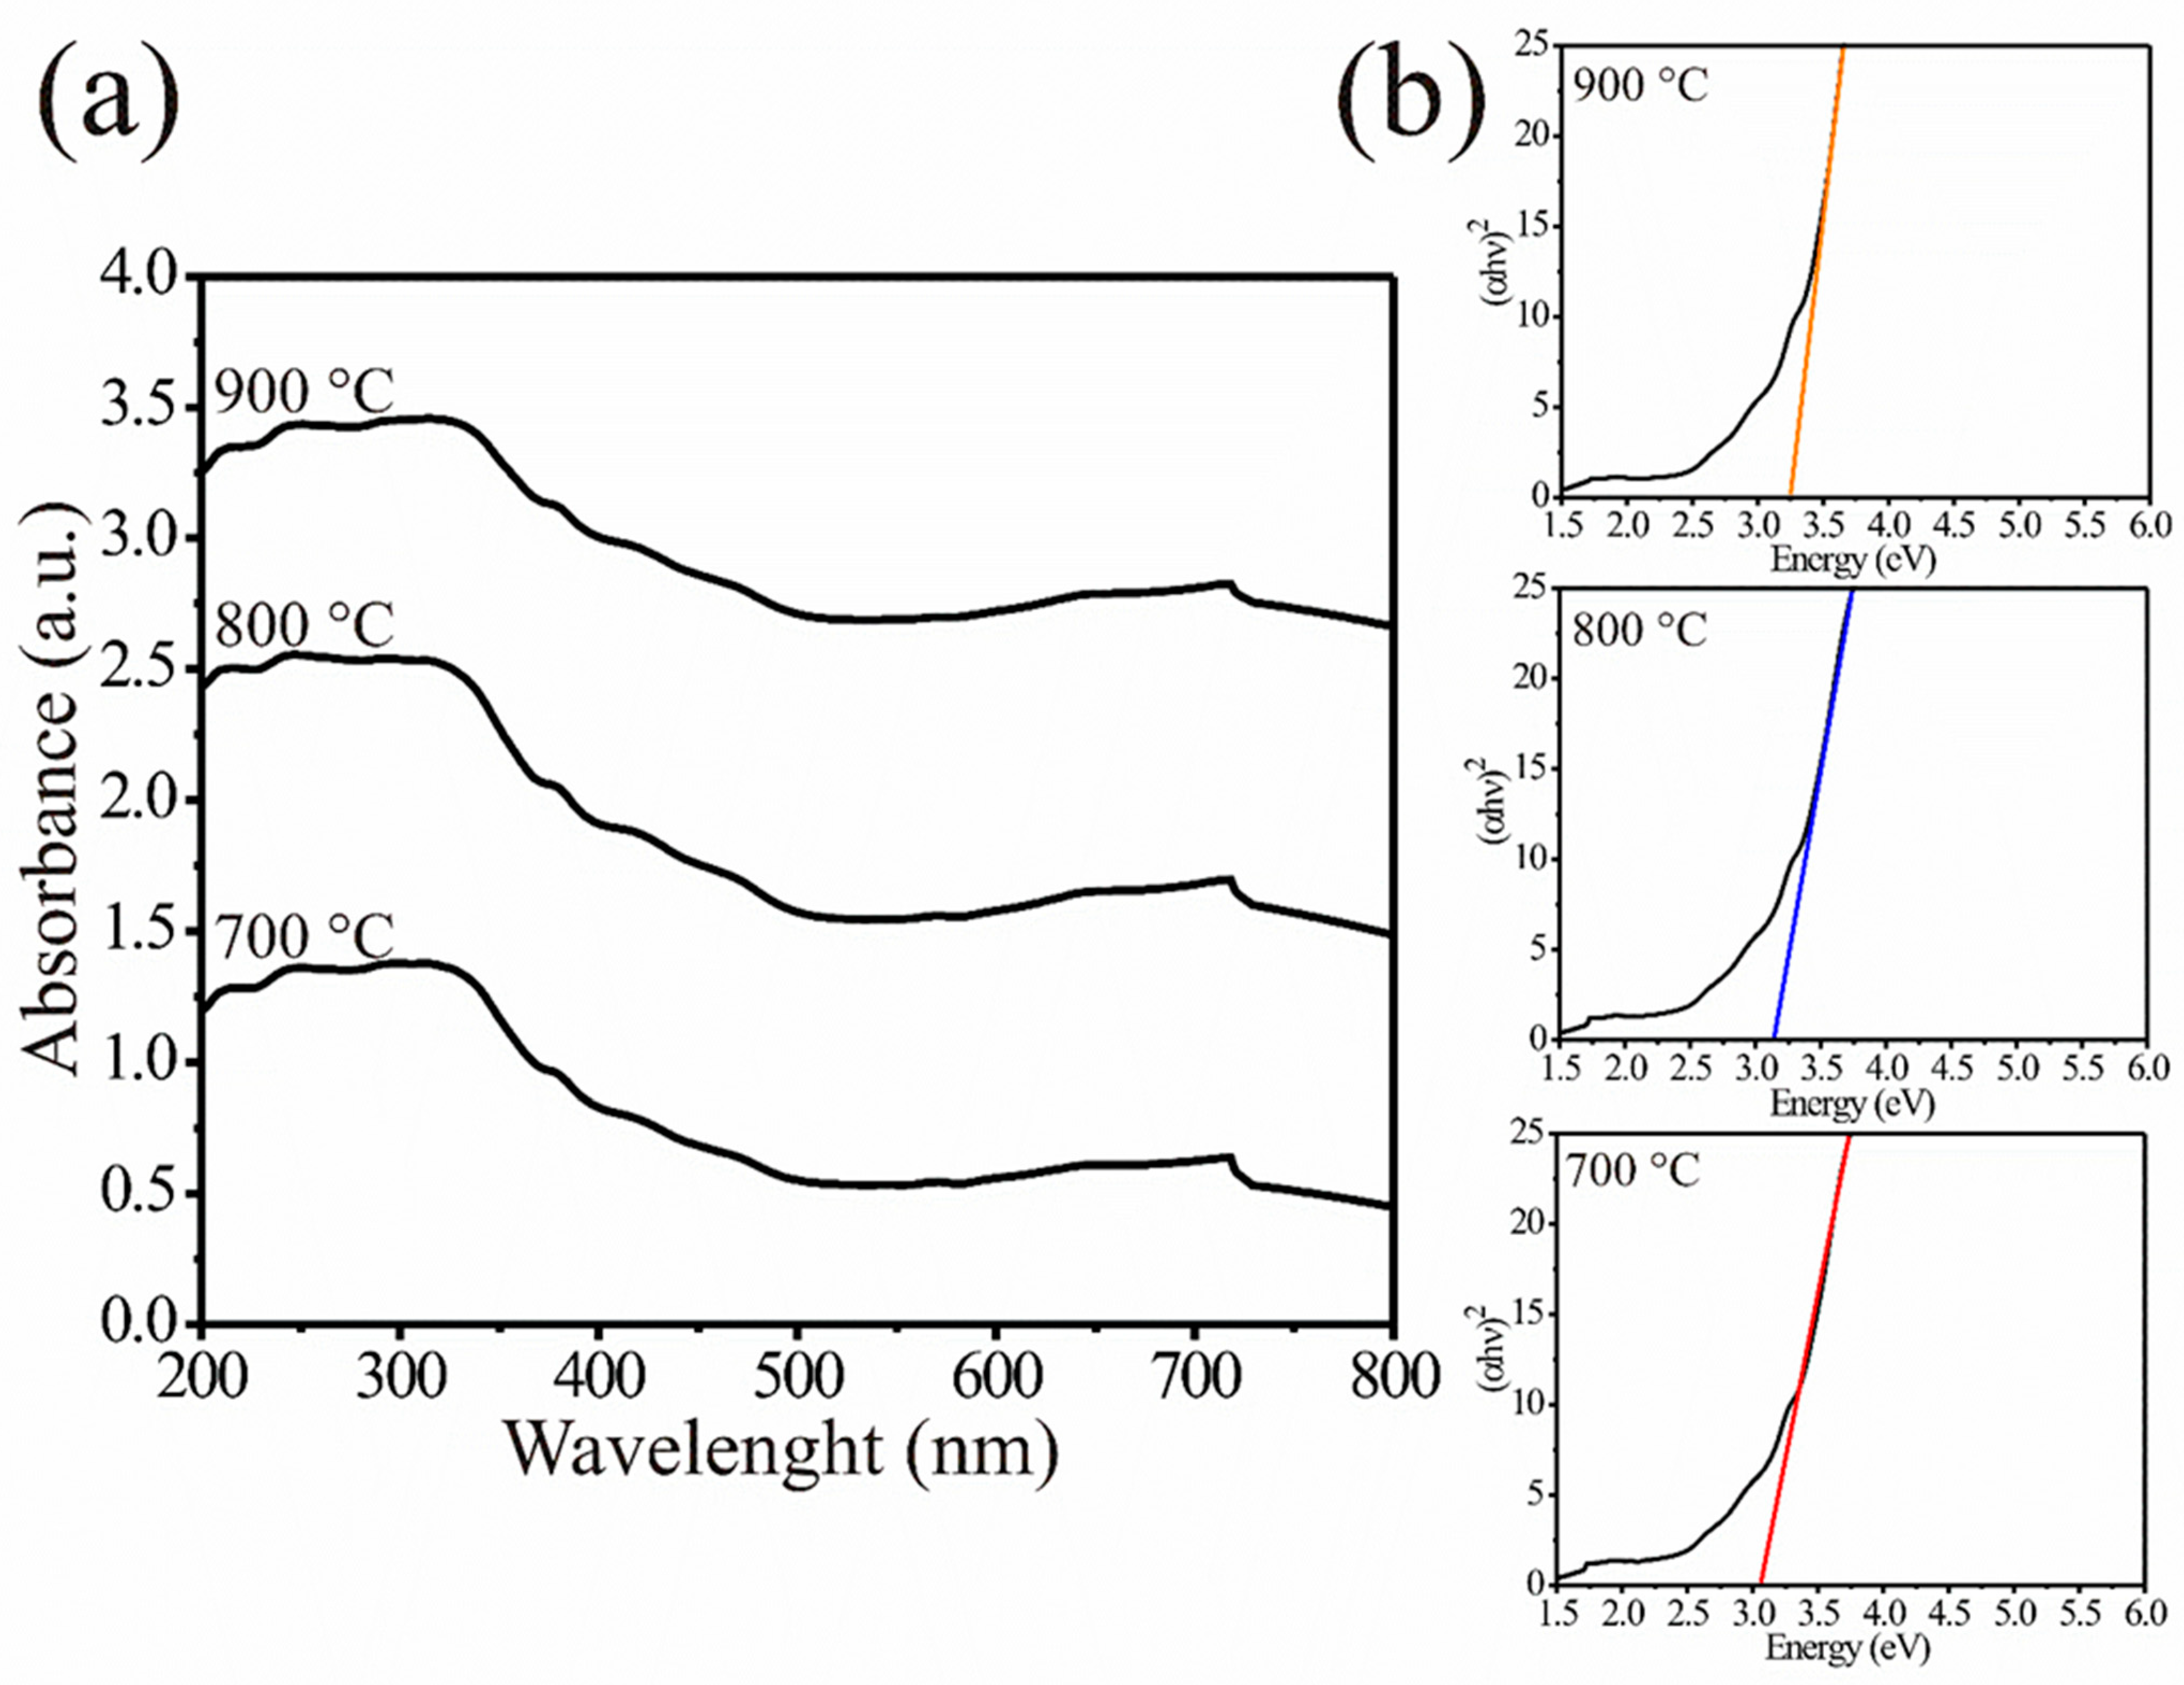
3.2. UV–Vis Analysis
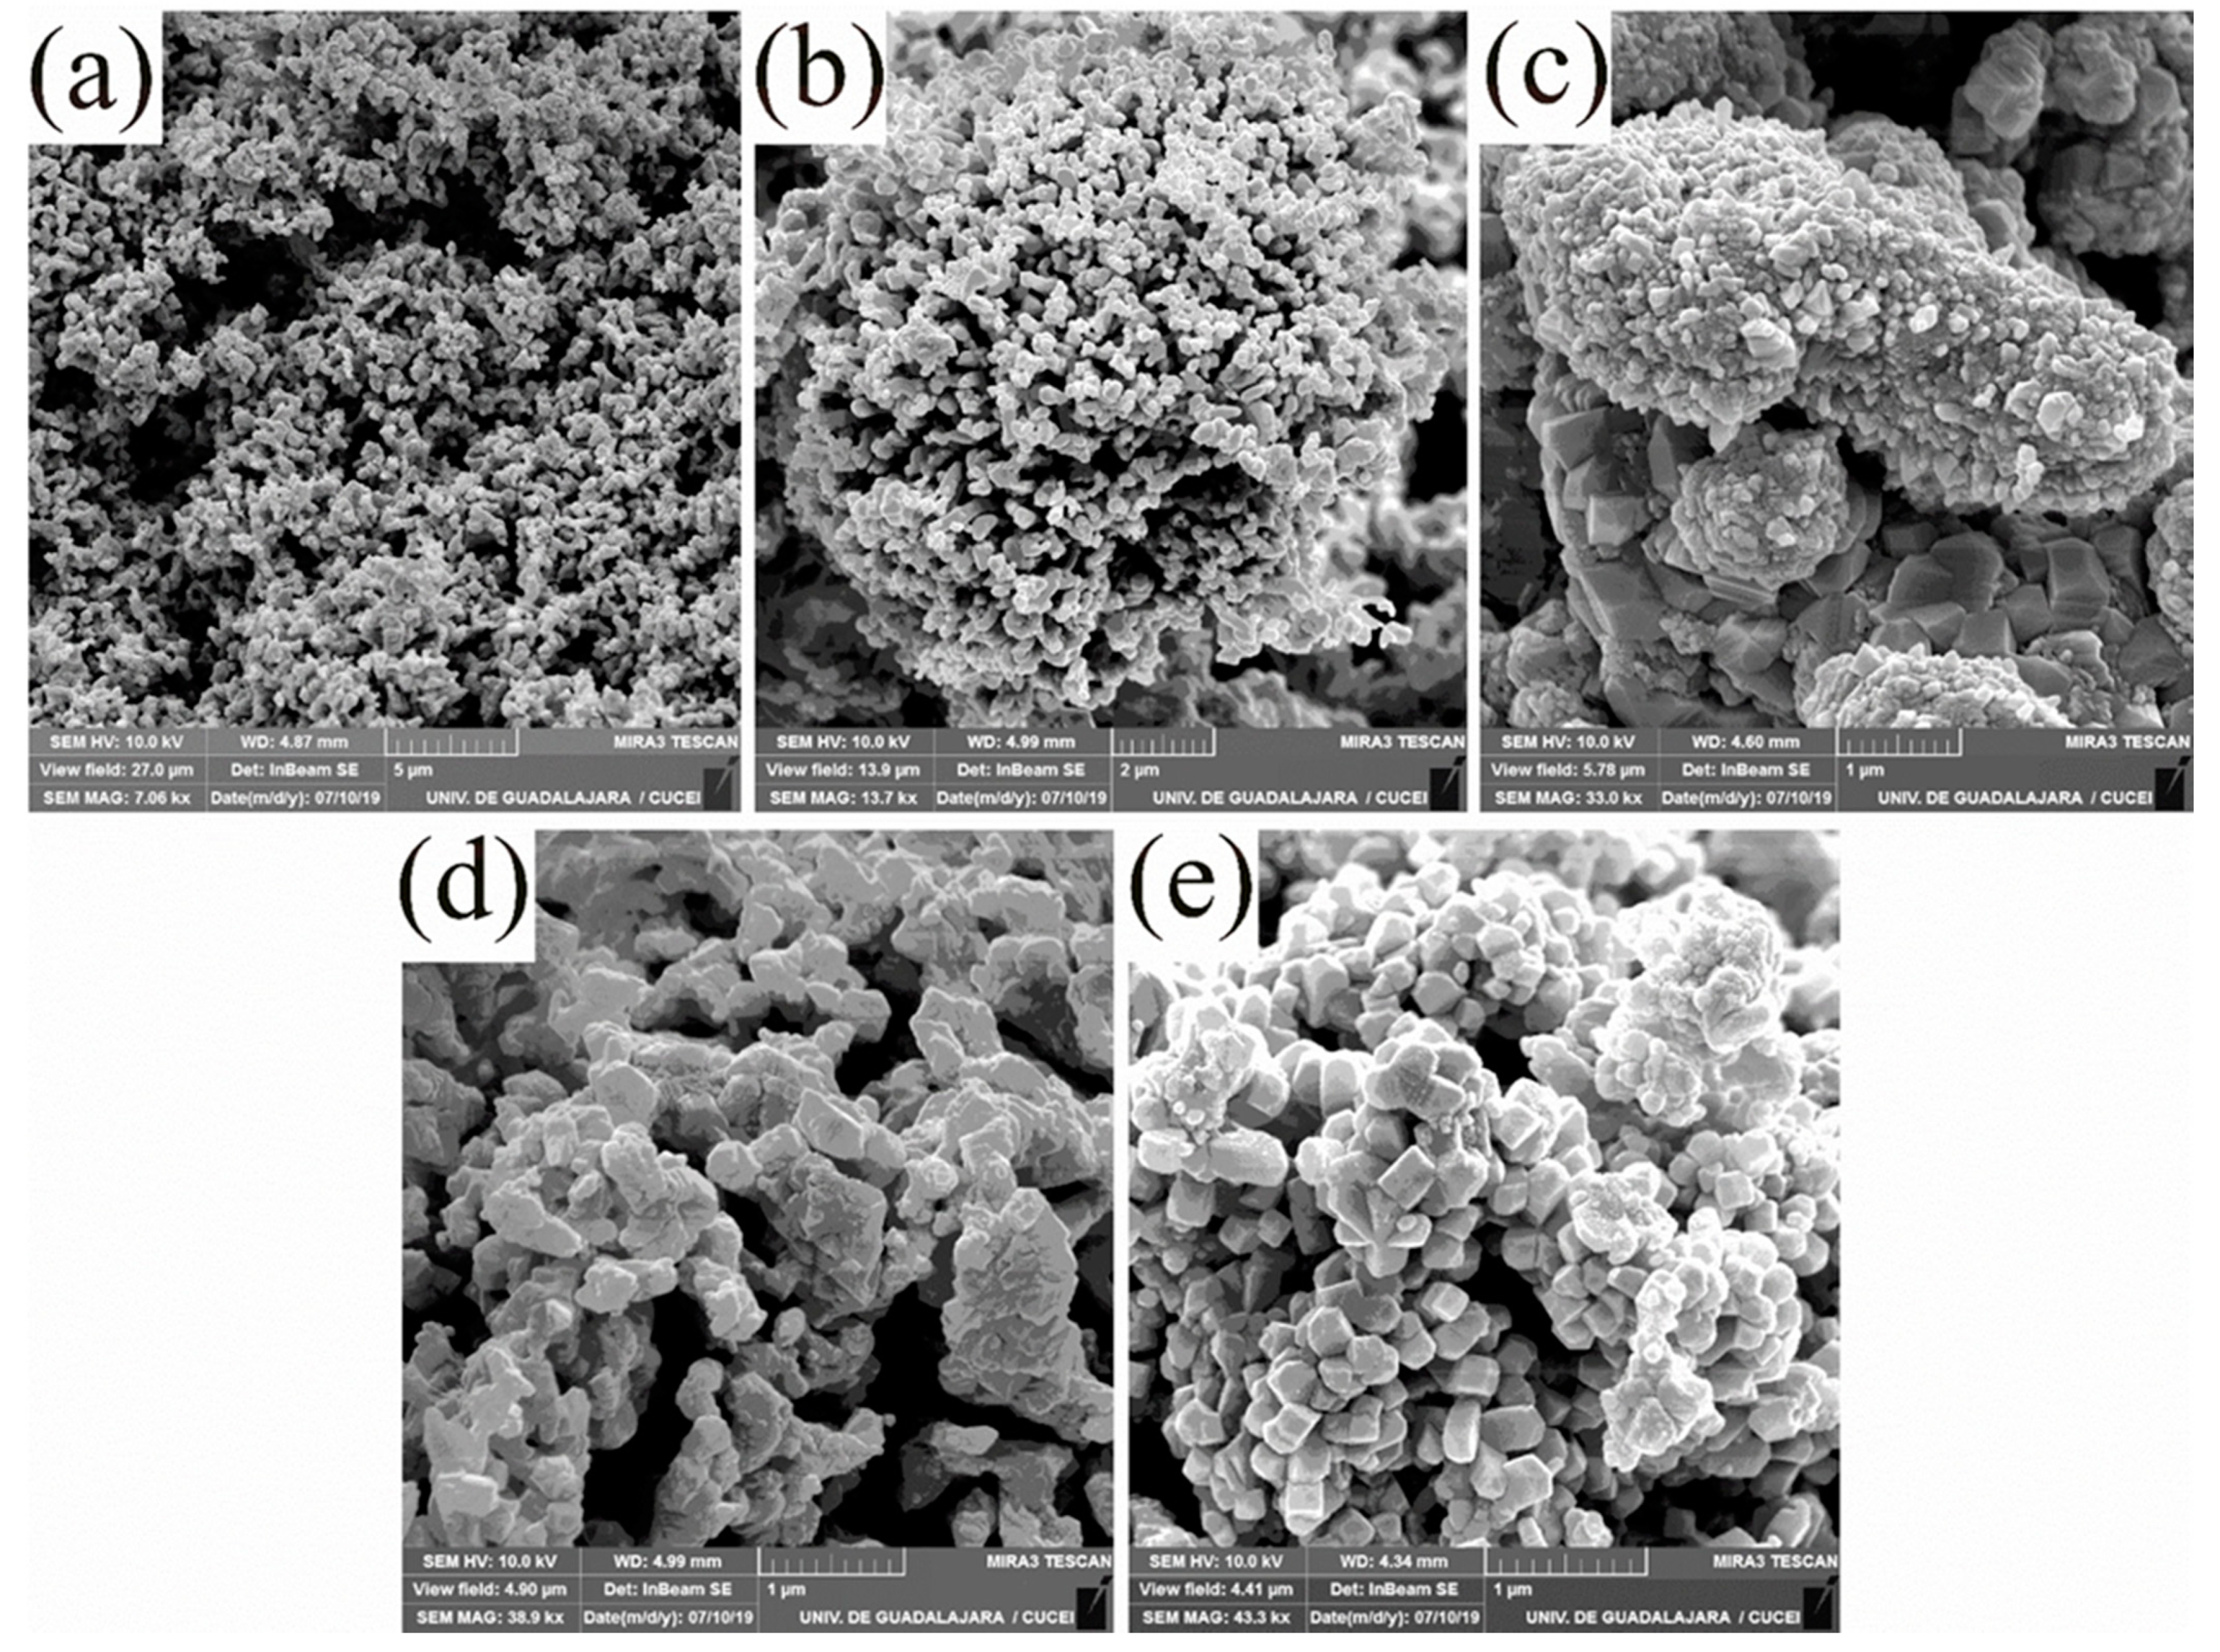
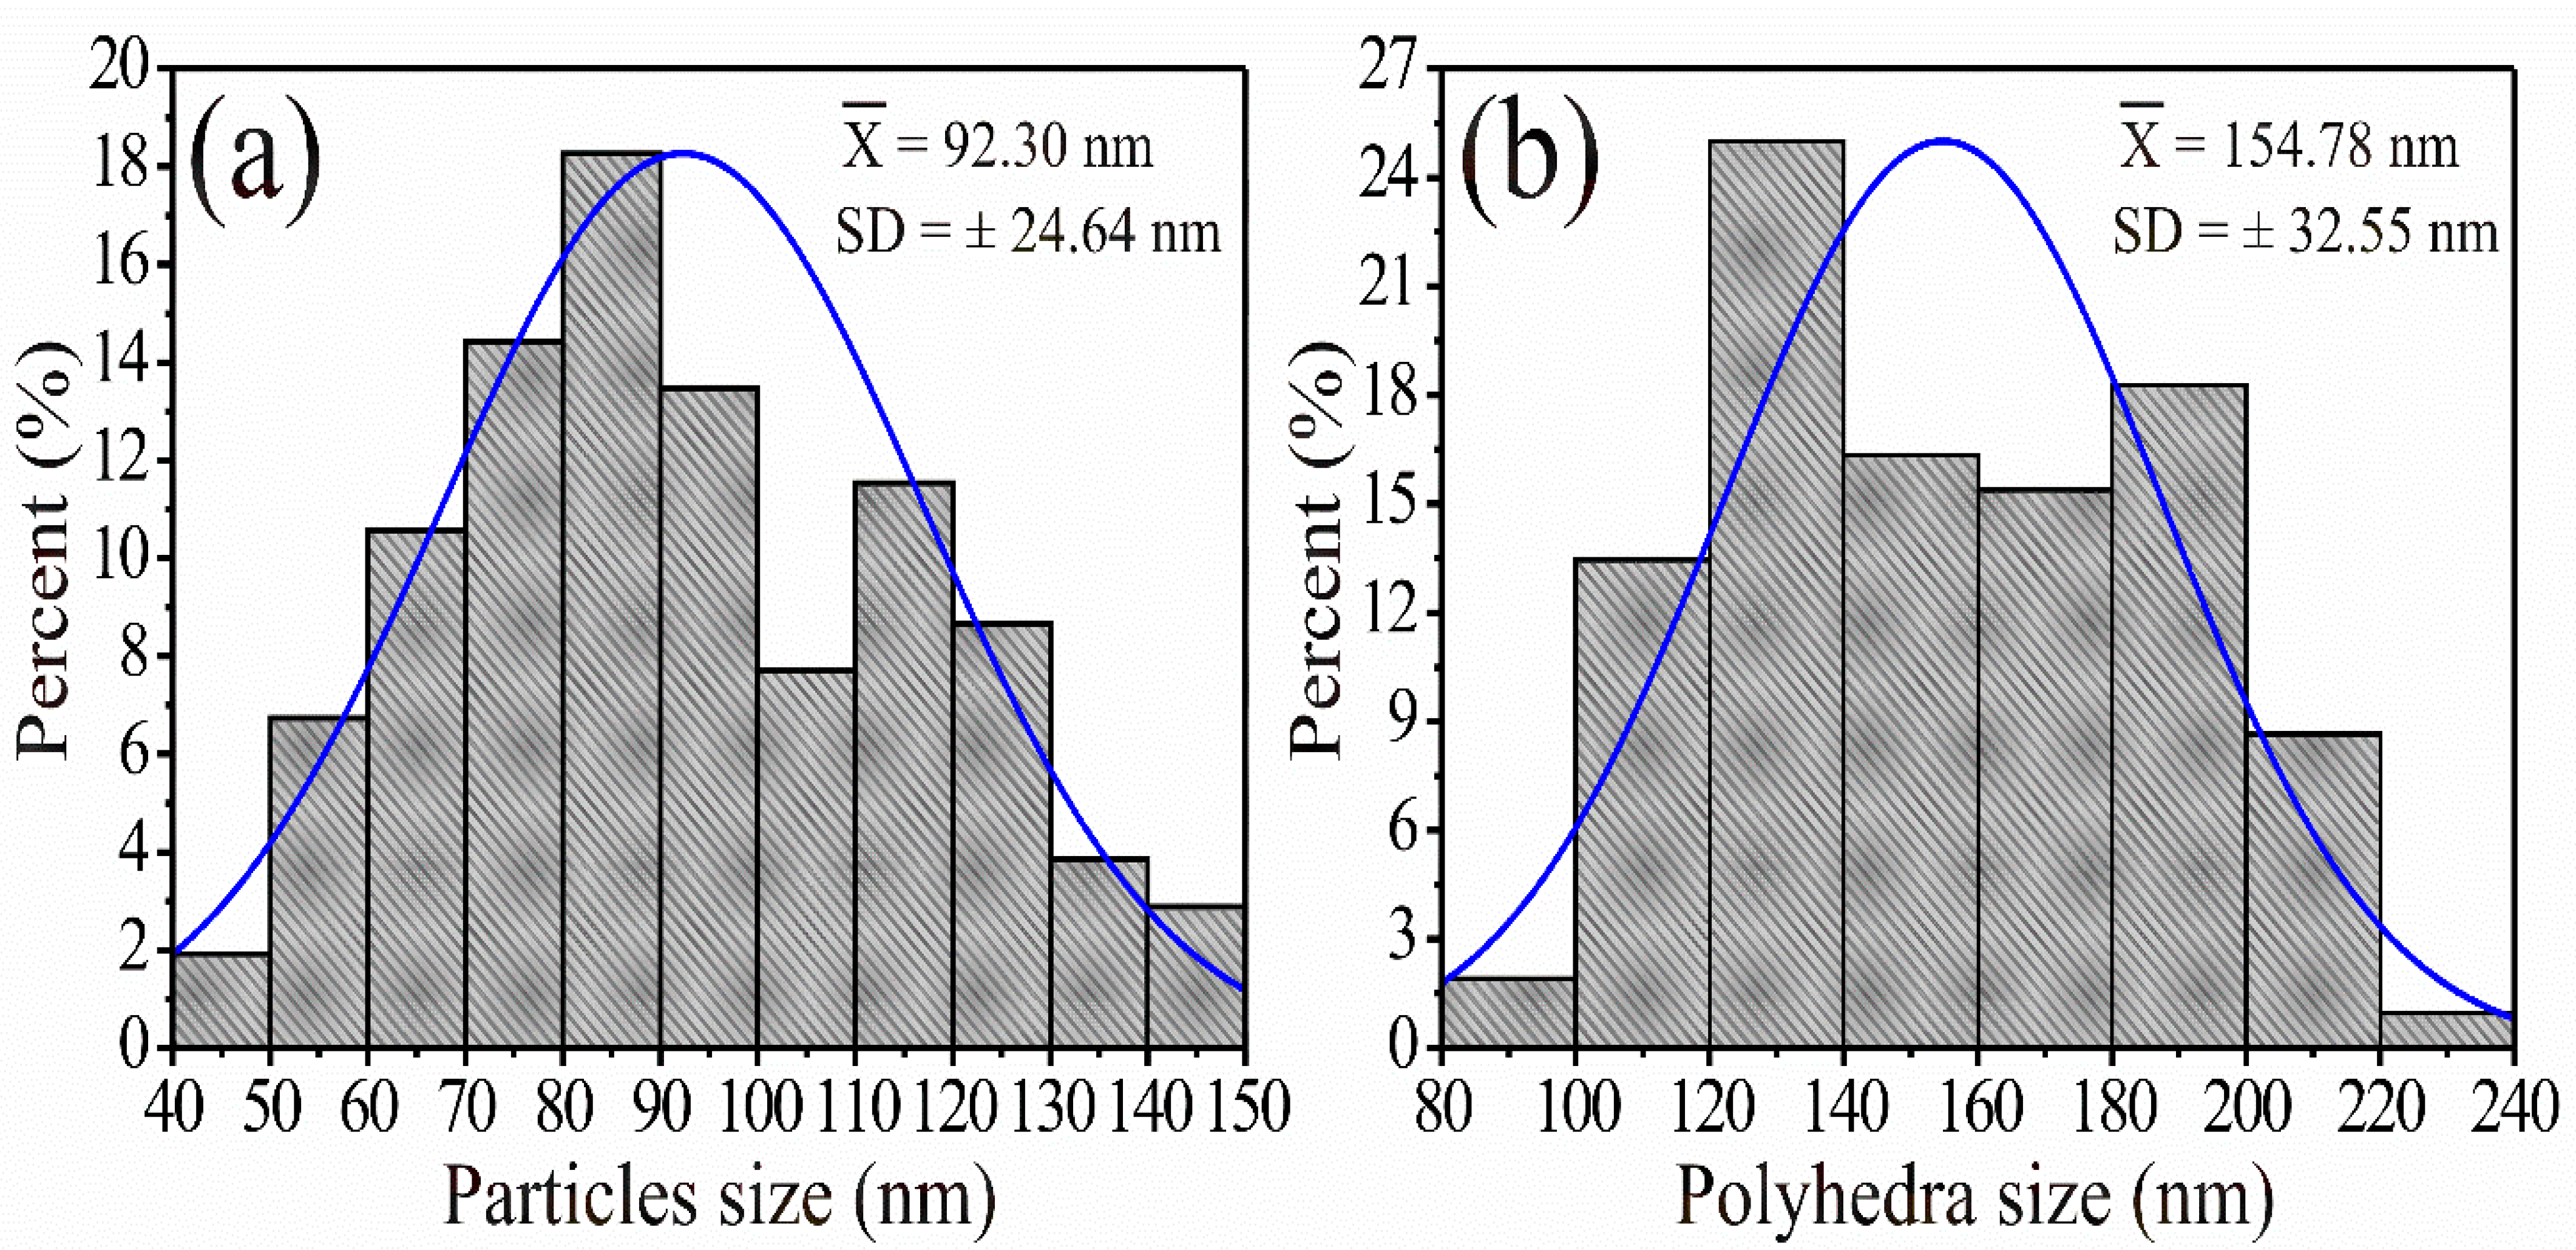
3.3. SEM Analysis
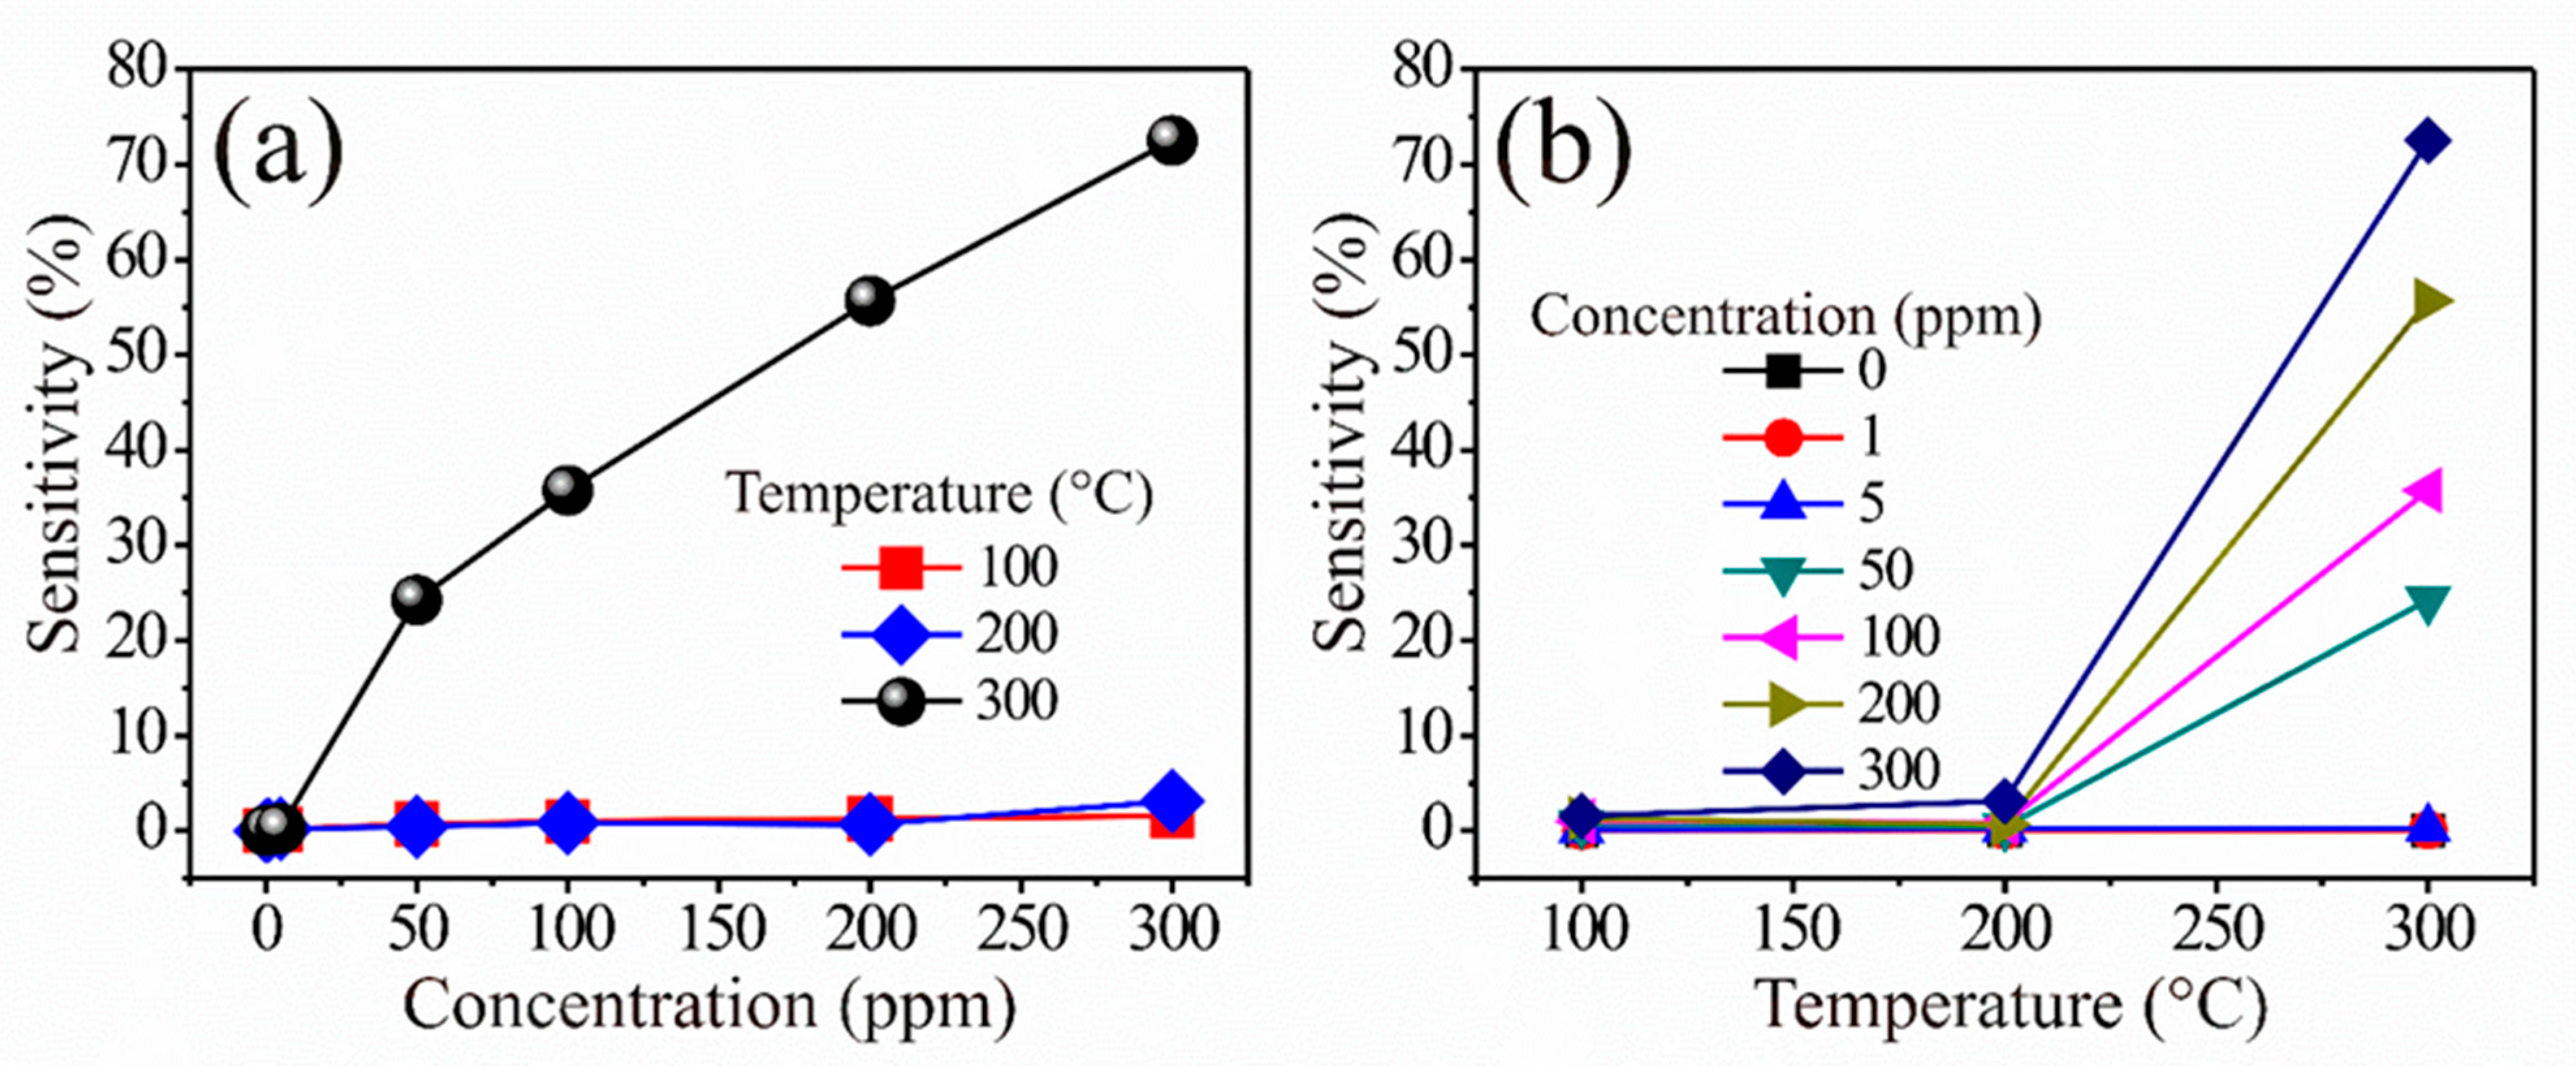
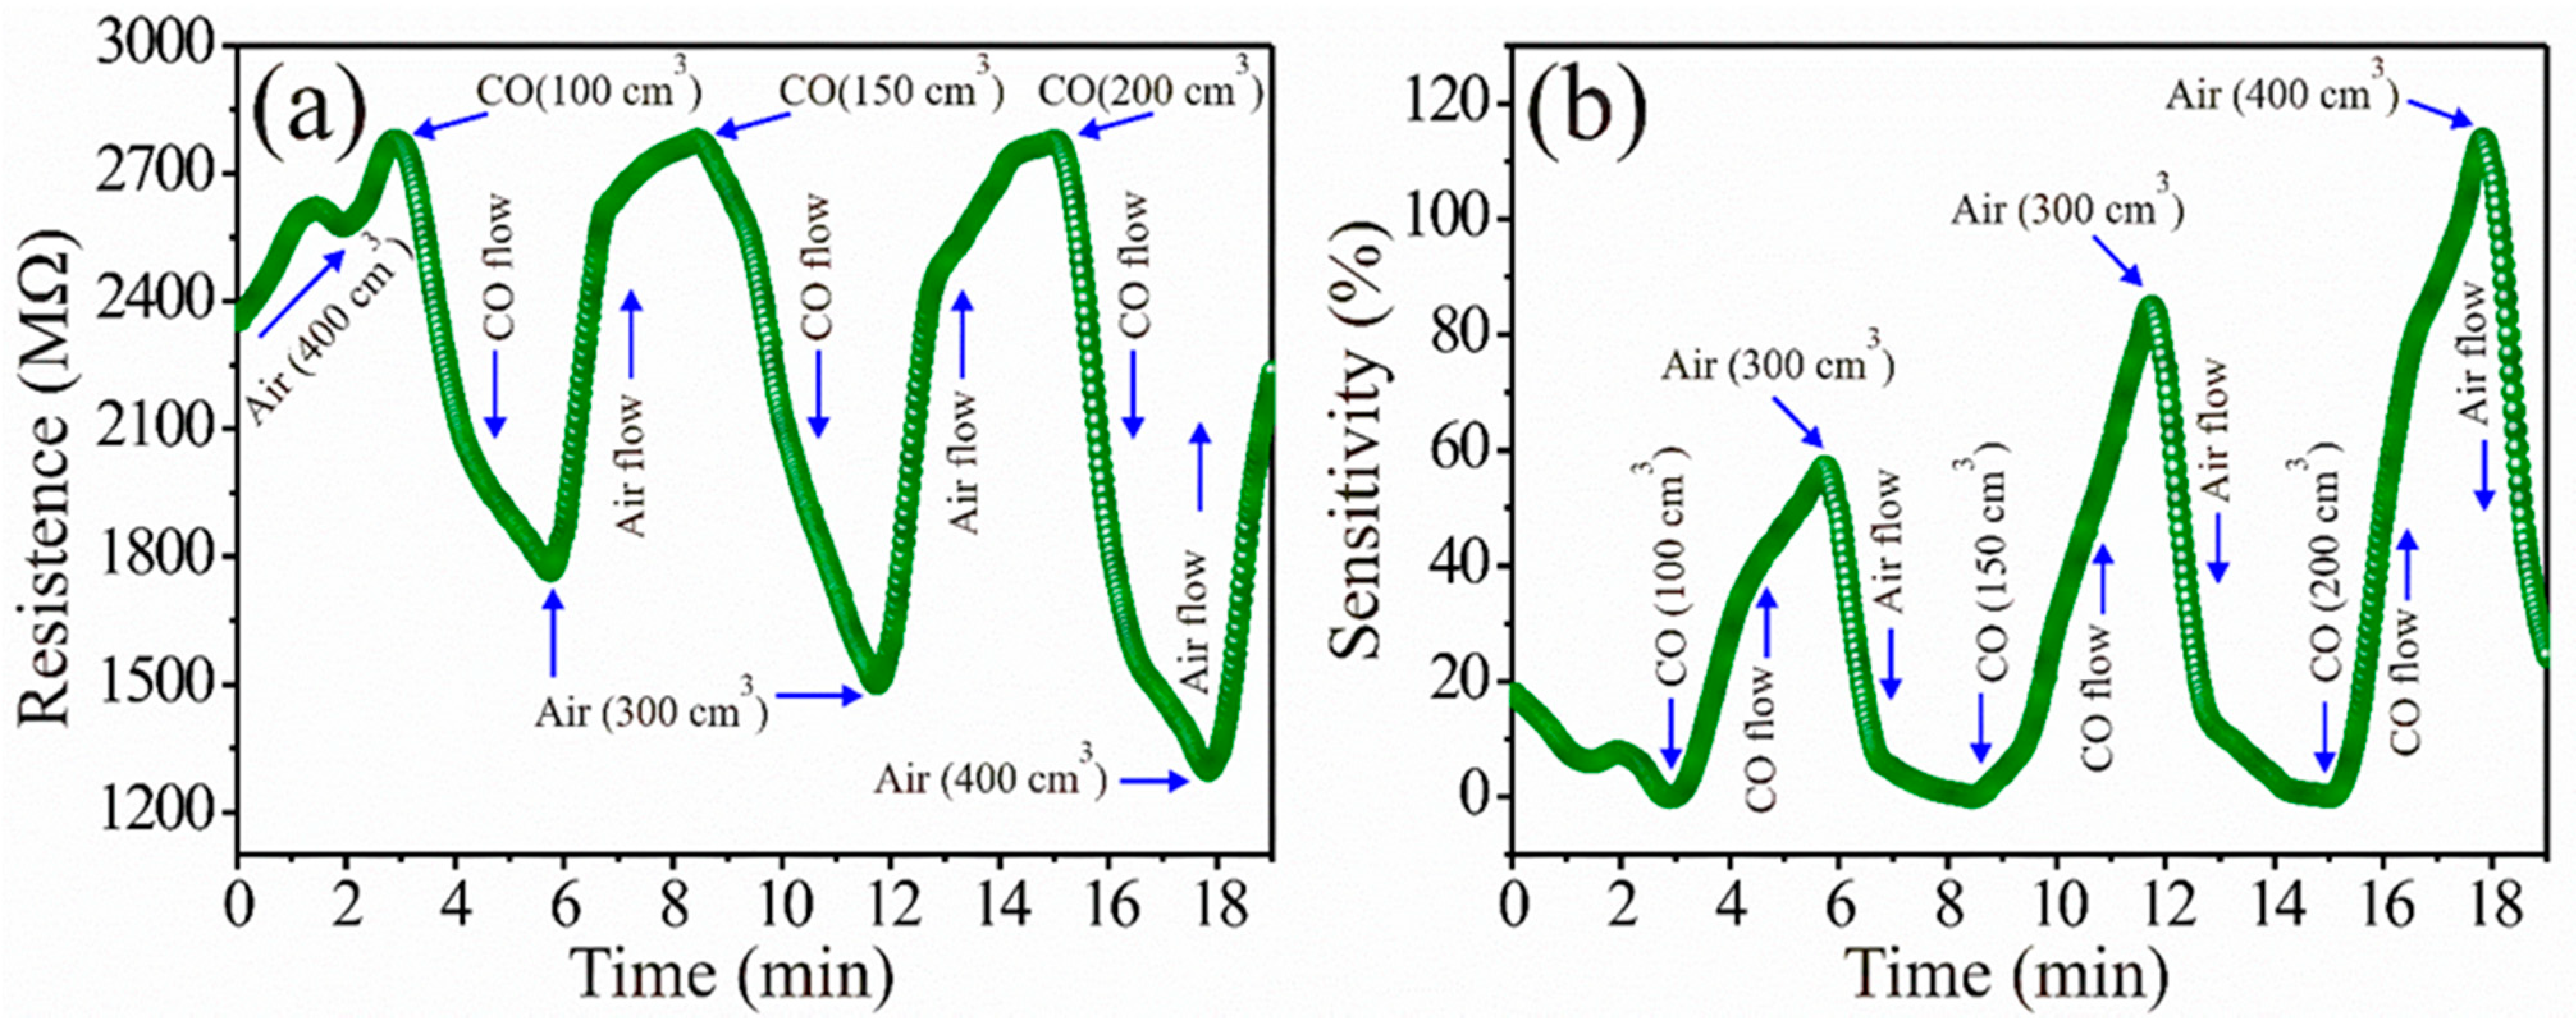
3.4. CO Analysis
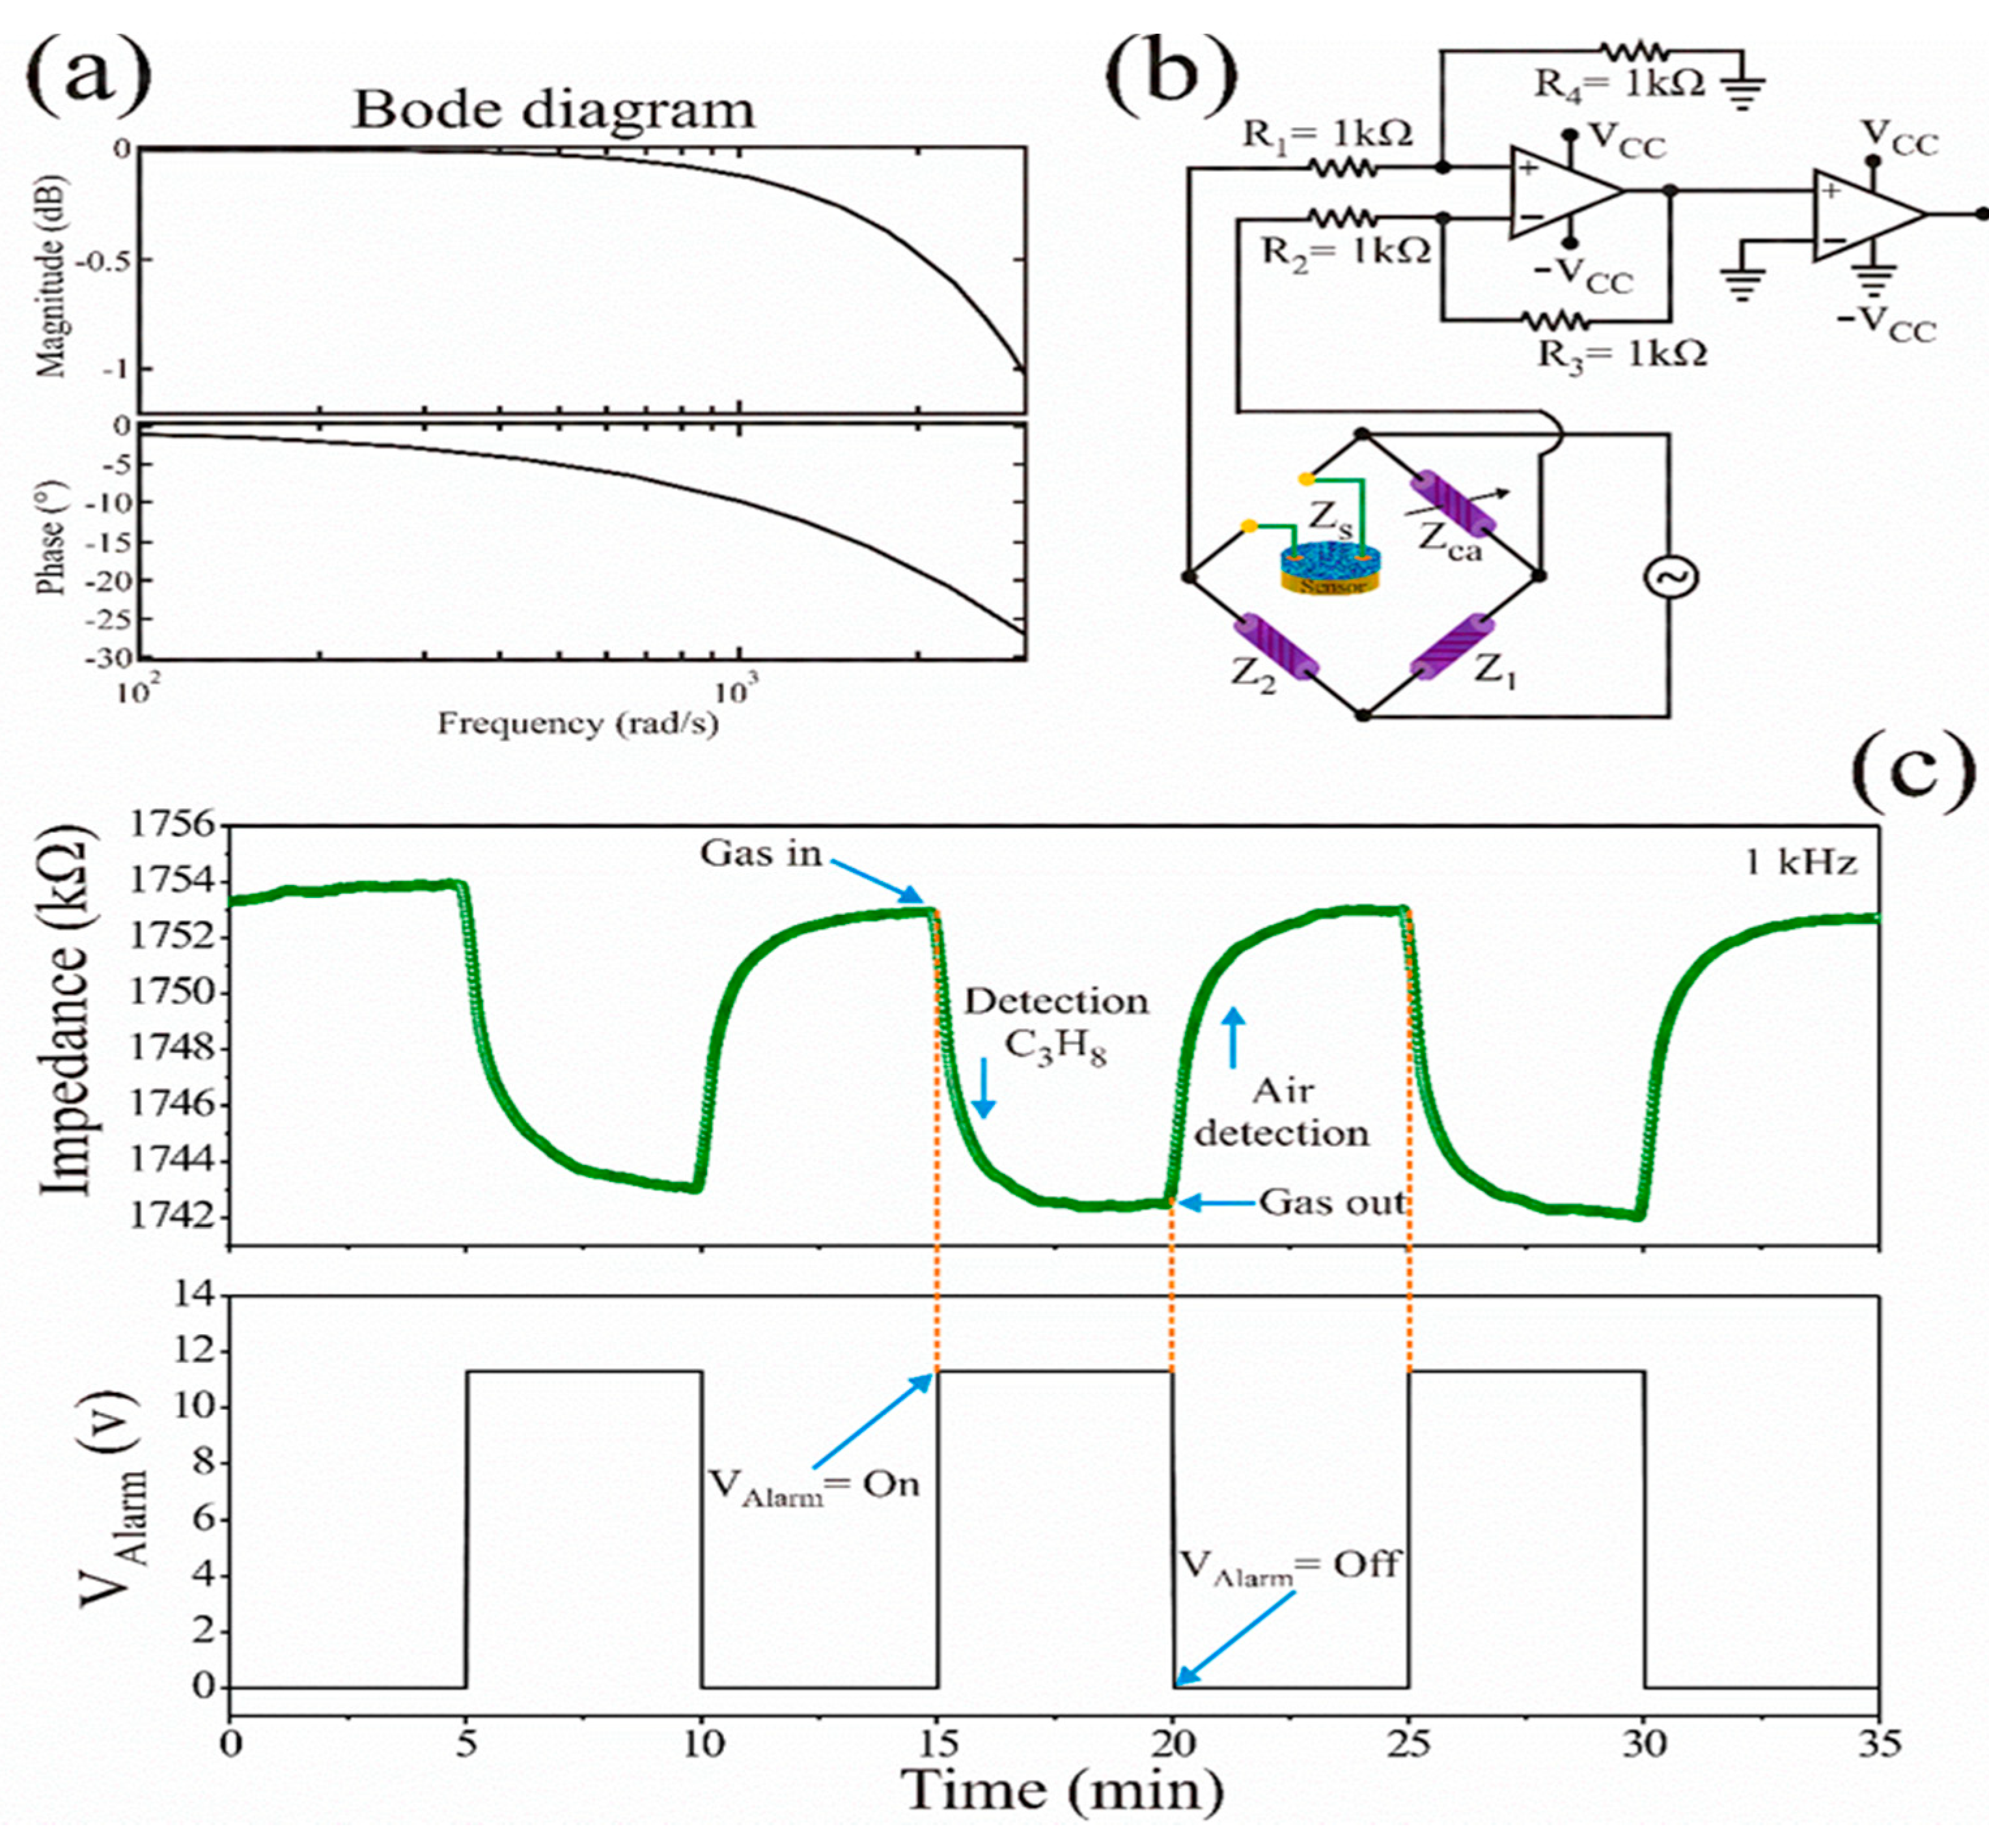
3.5. Propane Analysis
4. Conclusions
Author Contributions
Funding
Institutional Review Board Statement
Informed Consent Statement
Data Availability Statement
Acknowledgments
Conflicts of Interest
References
- Bergmann, S.; Li, B.; Pilot, E.; Chen, R.; Wang, B.; Yang, J. Effect modification of the short-term effects of air pollution on morbidity by season: A systematic review and meta-analysis. Sci. Total Environ. 2020, 716, 136985. [Google Scholar] [CrossRef] [PubMed]
- Manisalidis, I.; Stavropoulou, E.; Stavropoulos, A.; Bezirtzoglou, E. Environmental and Health Impacts of Air Pollution: A Review. Front. Public Health 2020, 8, 14. [Google Scholar] [CrossRef] [PubMed]
- Kheirbek, I.; Haney, J.; Douglas, S.; Ito, K.; Matte, T. The contribution of motor vehicle emissions to ambient fine particulate matter public health impacts in New York City: A health burden assessment. Environ. Health 2016, 15, 1–14. [Google Scholar] [CrossRef]
- Majhi, S.M.; Mirzaei, A.; Kim, H.W.; Kim, S.S.; Kim, T.W. Recent advances in energy-saving chemiresistive gas sensors: A review. Nano Energy 2021, 79, 105369. [Google Scholar] [CrossRef]
- Nikolic, M.V.; Milovanovic, V.; Vasiljevic, Z.Z.; Stamenkovic, Z. Semiconductor gas sensors: Materials, technology, design, and application. Sensors 2020, 20, 6694. [Google Scholar] [CrossRef]
- Nayyar, A.; Puri, V.; Le, D.-N. A Comprehensive Review of Semiconductor-Type Gas Sensors for Environmental Monitoring. Rev. Comput. Eng. Res. 2016, 3, 55–64. [Google Scholar] [CrossRef][Green Version]
- Morrison, S.R. Selectivity in semiconductor gas sensors. Sens. Actuators 1987, 12, 425–440. [Google Scholar] [CrossRef]
- Korotcenkov, G. Handbook of Gas Sensor Materials; Burnaby, DC, Canada, 2014; Volume 2, ISBN 9781461473886. [Google Scholar]
- Liu, X.; Cheng, S.; Liu, H.; Hu, S.; Zhang, D.; Ning, H. A survey on gas sensing technology. Sensors 2012, 12, 9635–9665. [Google Scholar] [CrossRef]
- Gautam, Y.K.; Sharma, K.; Tyagi, S.; Ambedkar, A.K.; Chaudhary, M.; Pal Singh, B. Nanostructured metal oxide semiconductor-based sensors for greenhouse gas detection: Progress and challenges. R. Soc. Open Sci. 2021, 8. [Google Scholar] [CrossRef]
- Shankar, P.; Rayappan, J. Gas sensing mechanism of metal oxides: The role of ambient atmosphere, type of semiconductor and gases-A review. Sci. Lett. J. 2015, 4, 126. [Google Scholar]
- Amiri, V.; Roshan, H.; Mirzaei, A.; Neri, G.; Ayesh, A.I. Nanostructured metal oxide-based acetone gas sensors: A review. Sensors 2020, 20, 3096. [Google Scholar] [CrossRef] [PubMed]
- Saruhan, B.; Lontio Fomekong, R.; Nahirniak, S. Review: Influences of Semiconductor Metal Oxide Properties on Gas Sensing Characteristics. Front. Sensors 2021, 2, 1–24. [Google Scholar] [CrossRef]
- Delgado, E.; Michel, C.R. CO2 and O2 sensing behavior of nanostructured barium-doped SmCoO3. Mater. Lett. 2006, 60, 1613–1616. [Google Scholar] [CrossRef]
- Balasubramaniam, M.; Balakumar, S. A review on multifunctional attributes of zinc antimonate nanostructures towards energy and environmental applications. Chem. Pap. 2020, 74, 55–75. [Google Scholar] [CrossRef]
- Alireza, H. Effects of reaction temperature and raw material type on optical properties and crystal phase growth of solid state synthesized NiSb2O6 nanomaterials. Adv. Mater. Process. 2017, 5, 56–65. [Google Scholar]
- Larcher, D.; Prakash, A.S.; Laffont, L.; Womes, M.; Jumas, J.C.; Olivier-Fourcade, J.; Hedge, M.S.; Tarascon, J.-M. Reactivity of Antimony Oxides and MSb2O6 (M = Cu, Ni, Co), Trirutile-type Phases with Metallic Lithium. J. Electrochem. Soc. 2006, 153, A1778. [Google Scholar] [CrossRef]
- Matijević, E. Uniform Inorganic Colloid Dispersions. Achievements and Challenges. Langmuir 1994, 10, 8–16. [Google Scholar] [CrossRef]
- Sberveglieri, G.; Comini, E.; Faglia, G.; Atashbar, M.Z.; Wlodarski, W. Titanium dioxide thin films prepared for alcohol microsensor applications. Sens. Actuators B Chem. 2000, 66, 139–141. [Google Scholar] [CrossRef]
- Mahajan, S.; Jagtap, S. Metal-oxide semiconductors for carbon monoxide (CO) gas sensing: A review. Appl. Mater. Today 2020, 18, 100483. [Google Scholar] [CrossRef]
- Ehrenberg, H.; Wltschek, G.; Rodriguez-Carvajal, J.; Vogt, T. Magnetic structures of the tri-rutiles NiTa2O6 and NiSb2O6. J. Magn. Magn. Mater. 1998, 184, 111–115. [Google Scholar] [CrossRef]
- Han, J.; Xu, M.; Jia, M.; Liu, T. Evaluation of reduced graphene oxide-supported NiSb2O6 nanocomposites for reversible lithium storage. Ceram. Int. 2016, 42, 14782–14787. [Google Scholar] [CrossRef]
- Cullity, B.D.; Stock, S.R. Elements of X-ray Diffraction; Prentice Hall: Upper Saddle River, NJ, USA, 2001. [Google Scholar]
- Comini, E.; Baratto, C.; Concina, I.; Faglia, G.; Falasconi, M.; Ferroni, M.; Galstyan, V.; Gobbi, E.; Ponzoni, A.; Vomiero, A.; et al. Metal oxide nanoscience and nanotechnology for chemical sensors. Sens. Actuators B Chem. 2013, 179, 3–20. [Google Scholar] [CrossRef]
- Wang, S.-F.; Sun, G.Z.; Fang, L.M.; Lei, L.; Xiang, X.; Zu, X.T. A comparative study of ZnAl2O4 nanoparticles synthesized from different aluminum salts for use as fluorescence materials. Sci. Rep. 2015, 5, 1–12. [Google Scholar] [CrossRef]
- Available online: https://materials.springer.com/isp/crystallographic/docs/sd_1815953 (accessed on 22 August 2021).
- Matsubara, N.; Damay, F.; Vertruyen, B.; Barrier, N.; Lebedev, O.I.; Boullay, P.; Elkaïm, E.; Manuel, P.; Khalyavin, D.D.; Martin, C. Mn2TeO6: A Distorted Inverse Trirutile Structure. Inorg. Chem. 2017, 56, 9742–9753. [Google Scholar] [CrossRef]
- Singh, A.; Singh, A.; Singh, S.; Tandon, P. Nickel antimony oxide (NiSb2O6): A fascinating nanostructured material for gas sensing application. Chem. Phys. Lett. 2016, 646, 41–46. [Google Scholar] [CrossRef]
- Guillén-Bonilla, A.; Rodríguez-Betancourtt, V.M.; Guillén-Bonilla, J.T.; Sánchez-Martínez, A.; Gildo-Ortiz, L.; Santoyo-Salazar, J.; Morán-Lázaro, J.P.; Guillén-Bonilla, H.; Blanco-Alonso, O. A novel CO and C3H8 sensor made of CuSb2O6 nanoparticles. Ceram. Int. 2017, 43, 13635–13644. [Google Scholar] [CrossRef]
- Singh, J.; Bhardwaj, N.; Uma, S. Single step hydrothermal based synthesis of M(II)Sb2O6 (M = Cd and Zn) type antimonates and their photocatalytic properties. Bull. Mater. Sci. 2013, 36, 287–291. [Google Scholar] [CrossRef]
- Balamurugan, C.; Maheswari, A.R.; Lee, D.W. Structural, optical, and selective ethanol sensing properties of p-type semiconducting CoNb2O6 nanopowder. Sens. Actuators B Chem. 2014, 205, 289–297. [Google Scholar] [CrossRef]
- Barreca, D.; Massignan, C.; Daolio, S.; Fabrizio, M.; Piccirillo, C.; Armelao, L.; Tondello, E. Composition and microstructure of cobalt oxide thin films obtained from a novel cobalt(II) precursor by chemical vapor deposition. Chem. Mater. 2001, 13, 588–593. [Google Scholar] [CrossRef]
- Yang, H.; Bai, X.; Hao, P.; Tian, J.; Bo, Y.; Wang, X.; Liu, H. A simple gas sensor based on zinc ferrite hollow spheres: Highly sensitivity, excellent selectivity and long-term stability. Sens. Actuators B Chem. 2019, 280, 34–40. [Google Scholar] [CrossRef]
- Guillén-Bonilla, A.; Blanco-Alonso, O.; Guillén-Bonilla, J.T.; de la Luz Olvera-Amador, M.; Rodríguez-Betancourtt, V.M.; Sánchez-Martínez, A.; Morán-Lázaro, J.P.; Martínez-García, M.; Guillén-Bonilla, H. Synthesis and characterization of cobalt antimonate nanostructures and their study as potential CO and CO2 sensor at low temperatures. J. Mater. Sci. Mater. Electron. 2018, 29, 15632–15642. [Google Scholar] [CrossRef]
- Rodríguez-Betancourtt, V.M.; Bonilla, H.G.; Flores Martínez, M.; Guillén Bonilla, A.; Moran Lazaro, J.P.; Bonilla, J.T.G.; González, M.A.; De La Luz Olvera Amador, M. Gas Sensing Properties of NiSb2O6 Micro-and Nanoparticles in Propane and Carbon Monoxide Atmospheres. J. Nanomater. 2017, 2017, 8792567. [Google Scholar] [CrossRef]
- Polshettiwar, V.; Baruwati, B.; Varma, R.S. Self-assembly of metal oxides into three-dimensional nanostructures: Synthesis and application in catalysis. ACS Nano 2009, 3, 728–736. [Google Scholar] [CrossRef] [PubMed]
- Tricoli, A.; Righettoni, M.; Teleki, A. Semiconductor gas sensors: Dry synthesis and application. Angew. Chem.-Int. Ed. 2010, 49, 7632–7659. [Google Scholar] [CrossRef] [PubMed]
- Polte, J. Fundamental growth principles of colloidal metal nanoparticles—a new perspective. CrystEngComm 2015, 17, 6809–6830. [Google Scholar] [CrossRef]
- Mirzaei, A.; Lee, J.H.; Majhi, S.M.; Weber, M.; Bechelany, M.; Kim, H.W.; Kim, S.S. Resistive gas sensors based on metal-oxide nanowires. J. Appl. Phys. 2019, 126. [Google Scholar] [CrossRef]
- Oleksenko, L.P.; Maksymovych, N.P. Sensors for CO Based on Semiconductor Nanomaterials Pd/SnO2. Theor. Exp. Chem. 2019, 55, 201–206. [Google Scholar] [CrossRef]
- Habib, I.Y.; Tajuddin, A.A.; Noor, H.A.; Lim, C.M.; Mahadi, A.H.; Kumara, N.T.R.N. Enhanced Carbon monoxide-sensing properties of Chromium-doped ZnO nanostructures. Sci. Rep. 2019, 9, 1–12. [Google Scholar] [CrossRef]
- Gildo-Ortiz, L.; Rodríguez-Betancourtt, V.M.; Blanco-Alonso, O.; Guillén-Bonilla, A.; Guillén-Bonilla, J.T.; Guillén-Cervantes, A.; Santoyo-Salazar, J.; Guillén-Bonilla, H. A simple route for the preparation of nanostructured GdCoO3 via the solution method, as well as its characterization and its response to certain gases. Results Phys. 2019, 12, 475–483. [Google Scholar] [CrossRef]
- Guillén, H.; Rodríguez Betancourtt, V.M.; Guillen, J.T.; Gildo, L.; Guillen, A.; Casallas, Y.; Blanco, O.; Reyes, J. Sensitivity tests of pellets made from manganese antimonate nanoparticles in carbon monoxide and propane atmospheres. Sensors 2018, 18, 2299. [Google Scholar] [CrossRef]
- Alrammouz, R.; Podlecki, J.; Abboud, P.; Sorli, B.; Habchi, R. A review on flexible gas sensors: From materials to devices. Sens. Actuators A Phys. 2018, 284, 209–231. [Google Scholar] [CrossRef]
- Hua, Z.; Tian, C.; Huang, D.; Yuan, W.; Zhang, C.; Tian, X.; Wang, M.; Li, E. Power-law response of metal oxide semiconductor gas sensors to oxygen in presence of reducing gases. Sens. Actuators B Chem. 2018, 267, 510–518. [Google Scholar] [CrossRef]
- Morán Lázaro, J.P.; Guillen López, E.S.; López Urias, F.; Muñoz Sandoval, E.; Blanco Alonso, O.; Guillén Bonilla, H.; Guillén Bonilla, A.; Rodríguez Betancourtt, V.M.; Sanchez Tizapa, M.; Olvera Amador, M. de la L. Synthesis of ZnMn₂O₄ Nanoparticles by a Microwave-Assisted Colloidal Method and their Evaluation as a Gas Sensor of Propane and Carbon Monoxide. Sensors 2018, 18, 701. [Google Scholar] [CrossRef]
- Arshak, K.; Moore, E.; Lyons, G.M.; Harris, J.; Clifford, S. A Review of Gas Sensors Employed in Electronic Nose Applications; Limerick, Ireland, 2004; Volume 24, ISBN 0260228001. [Google Scholar]
- Mcaleer, J.F.; Moseley, P.T.; Norris, J.O.W.; Williams, D.E. Tin Dioxide Gas Sensors. J. Chem. Soc. Faraday Trans. I 1987, 83, 1323–1346. [Google Scholar] [CrossRef]
- Nandy, T.; Coutu, R.A.; Ababei, C. Carbon monoxide sensing technologies for next-generation cyber-physical systems. Sensors 2018, 18, 3443. [Google Scholar] [CrossRef] [PubMed]
- Carbajal-Franco, G.; Tiburcio-Silver, A.; Domínguez, J.M.; Sánchez-Juárez, A. Thin film tin oxide-based propane gas sensors. Thin Solid Films 2000, 373, 141–144. [Google Scholar] [CrossRef]
- Kumar, A.; Kumar, R.; Singh, R.; Prasad, B.; Kumar, D.; Kumar, M. Effect of Surface State Density on Oxygen Chemisorption, Grain Potential and Carrier Concentration for Different Grain Sizes of Nanocrystallite Metal Oxide Semiconductors: A Numerical Modelling Approach. Arab. J. Sci. Eng. 2021, 46, 617–630. [Google Scholar] [CrossRef]
- Hjiri, M.; Bahanan, F.; Aida, M.S.; El Mir, L.; Neri, G. High Performance CO Gas Sensor Based on ZnO Nanoparticles. J. Inorg. Organomet. Polym. Mater. 2020, 30, 4063–4071. [Google Scholar] [CrossRef]
- Gao, X.; Zhang, T. An overview: Facet-dependent metal oxide semiconductor gas sensors. Sens. Actuators B Chem. 2018, 277, 604–633. [Google Scholar] [CrossRef]
- Dey, A. Semiconductor metal oxide gas sensors: A review. Mater. Sci. Eng. B 2018, 229, 206–217. [Google Scholar] [CrossRef]
- Ha, N.H.; Thinh, D.D.; Huong, N.T.; Phuong, N.H.; Thach, P.D.; Hong, H.S. Fast response of carbon monoxide gas sensors using a highly porous network of ZnO nanoparticles decorated on 3D reduced graphene oxide. Appl. Surf. Sci. 2018, 434, 1048–1054. [Google Scholar] [CrossRef]
- Wetchakun, K.; Samerjai, T.; Tamaekong, N.; Liewhiran, C.; Siriwong, C.; Kruefu, V.; Wisitsoraat, A.; Tuantranont, A.; Phanichphant, S. Semiconducting metal oxides as sensors for environmentally hazardous gases. Sens. Actuators B Chem. 2011, 160, 580–591. [Google Scholar] [CrossRef]
- Kim, H.J.; Lee, J.H. Highly sensitive and selective gas sensors using p-type oxide semiconductors: Overview. Sens. Actuators B Chem. 2014, 192, 607–627. [Google Scholar] [CrossRef]
- Singh, S.; Singh, A.; Singh, A.; Rathore, S.; Yadav, B.C.; Tandon, P. Nanostructured cobalt antimonate: A fast responsive and highly stable sensing material for liquefied petroleum gas detection at room temperature. RSC Adv. 2020, 10, 33770–33781. [Google Scholar] [CrossRef]
- Gildo-Ortiz, L.; Guillén-Bonilla, H.; Reyes-Gómez, J.; Rodríguez-Betancourtt, V.M.; Olvera-Amador, M.D.L.L.; Eguiá-Eguiá, S.I.; Guillén-Bonilla, A.; Santoyo-Salazar, J. Facile Synthesis, Microstructure, and Gas Sensing Properties of NdCoO3 Nanoparticles. J. Nanomater. 2017, 2017, 8174987. [Google Scholar] [CrossRef]
- Jayaraman, V.K.; Maldonado Álvarez, A.; Amador, M.D.l.L.O. A simple and cost-effective zinc oxide thin film sensor for propane gas detection. Mater. Lett. 2015, 157, 169–171. [Google Scholar] [CrossRef]
- Haocheng, J.; Zeng, W.; Li, Y. Gas sensing mechanisms of metal oxide semiconductors: A focus review. Nanoscale 2019, 11, 22664–22684. [Google Scholar] [CrossRef]
- Wang, C.; Yin, L.; Zhang, L.; Xiang, D.; Gao, R. Metal oxide gas sensors: Sensitivity and influence factors. Sensors 2010, 10, 2088–2106. [Google Scholar] [CrossRef] [PubMed]
- Du, H.; Xie, G.; Su, Y.; Tai, H.; Du, X.; Yu, H.; Zhang, Q. A new model and its application for the dynamic response of RGO resistive gas sensor. Sensors 2019, 19, 889. [Google Scholar] [CrossRef] [PubMed]
- Thanh-Tien, N.; Phuong-Than, L.V.; Yen-Mi, T. An ab initio study of small gas molecule adsorption on the edge of N-doped sawtooth penta-graphene nanoribbons. Pap. Phys. 2021, 13, 130003. [Google Scholar] [CrossRef]
- Roohi, H.; Askari-Ardehjani, N. Exploring the adsorption of CO toxic gas on pristine and M-doped (M = Ti, Cr, Fe, Ni and Zn) GaN nanosheets. New J. Chem. 2019, 43, 15280–15292. [Google Scholar] [CrossRef]
- Nykanen, L.; Honkala, K. Density functional theory study on propane and propene adsorption on Pt(111) and PtSn alloy surfaces. J. Phys. Chem. C 2011, 115, 9578–9586. [Google Scholar] [CrossRef]
- Guillén-Bonilla, A.; Rodríguez-Betancourtt, V.M.; Guillén-Bonilla, H.; Gildo-Ortiz, L.; Blanco-Alonso, O.; Franco-Rodríguez, N.E.; Reyes-Gómez, J.; Casillas-Zamora, A.; Guillen-Bonilla, J.T. A new CO2 detection system based on the trirutile-type CoSb2O6 oxide. J. Mater. Sci. Mater. Electron. 2018, 29, 15741–15753. [Google Scholar] [CrossRef]
- Bochenkov, V.E.; Sergeev, G.B. Preparation and chemiresistive properties of nanostructured materials. Adv. Colloid Interface Sci. 2005, 116, 245–254. [Google Scholar] [CrossRef] [PubMed]
- Yamazoe, N. Toward innovations of gas sensor technology. Sens. Actuators B Chem. 2005, 108, 2–14. [Google Scholar] [CrossRef]
- Neri, G. First fifty years of chemoresistive gas sensors. Chemosensors 2015, 3, 1–20. [Google Scholar] [CrossRef]


| Temperature (°C) | CO (ppm) | Response (R) | Temperature (°C) | CO (ppm) | Response (R) |
| 100 | 0.87 | 100 | 35.52 | ||
| 200 | 200 | 0.67 | 300 | 200 | 55.50 |
| 300 | 3.14 | 300 | 72.67 |
Publisher’s Note: MDPI stays neutral with regard to jurisdictional claims in published maps and institutional affiliations. |
© 2021 by the authors. Licensee MDPI, Basel, Switzerland. This article is an open access article distributed under the terms and conditions of the Creative Commons Attribution (CC BY) license (https://creativecommons.org/licenses/by/4.0/).
Share and Cite
Ramírez-Ortega, J.A.; Guillén-Bonilla, J.T.; Guillén-Bonilla, A.; Rodríguez-Betancourtt, V.M.; Gildo-Ortiz, L.; Blanco-Alonso, O.; Soto-García, V.M.; Jiménez-Rodríguez, M.; Guillén-Bonilla, H. Preparation of Powders Containing Sb, Ni, and O for the Design of a Novel CO and C3H8 Sensor. Appl. Sci. 2021, 11, 9536. https://doi.org/10.3390/app11209536
Ramírez-Ortega JA, Guillén-Bonilla JT, Guillén-Bonilla A, Rodríguez-Betancourtt VM, Gildo-Ortiz L, Blanco-Alonso O, Soto-García VM, Jiménez-Rodríguez M, Guillén-Bonilla H. Preparation of Powders Containing Sb, Ni, and O for the Design of a Novel CO and C3H8 Sensor. Applied Sciences. 2021; 11(20):9536. https://doi.org/10.3390/app11209536
Chicago/Turabian StyleRamírez-Ortega, Jorge Alberto, José Trinidad Guillén-Bonilla, Alex Guillén-Bonilla, Verónica María Rodríguez-Betancourtt, Lorenzo Gildo-Ortiz, Oscar Blanco-Alonso, Víctor Manuel Soto-García, Maricela Jiménez-Rodríguez, and Héctor Guillén-Bonilla. 2021. "Preparation of Powders Containing Sb, Ni, and O for the Design of a Novel CO and C3H8 Sensor" Applied Sciences 11, no. 20: 9536. https://doi.org/10.3390/app11209536
APA StyleRamírez-Ortega, J. A., Guillén-Bonilla, J. T., Guillén-Bonilla, A., Rodríguez-Betancourtt, V. M., Gildo-Ortiz, L., Blanco-Alonso, O., Soto-García, V. M., Jiménez-Rodríguez, M., & Guillén-Bonilla, H. (2021). Preparation of Powders Containing Sb, Ni, and O for the Design of a Novel CO and C3H8 Sensor. Applied Sciences, 11(20), 9536. https://doi.org/10.3390/app11209536