1. Introduction
With the start of the Fourth Industrial Revolution around the world, Internet of Things (IoT), artificial intelligence (AI), and big data are attracting attention as major technologies. Most people these days own a smartphone, which is an IoT device. In addition, a large volume of data can be stored and used through big data technology. These two technologies of IoT and big data can be combined with AI to increase efficiency in the navigation field.
It is very important for navigation technology to estimate the initial location of the user to perform accurate route guidance. If the user’s initial location cannot be accurately positioned, the user is guided to an inefficient path. The global positioning system (GPS) technology currently used in outdoor environments has reliable positioning accuracy [
1]. However, GPS has a limitation in performing indoor positioning due to a signal loss problem caused by obstacles and walls existing in indoor environments [
2,
3,
4]. Hence, various positioning technologies are developed for indoor office environments [
5]. Such indoor positioning technology is generally based on two types of communication technology and positioning algorithm.
Mobile communication technologies are wireless-fidelity (Wi-Fi) [
6], ultra-wide band (UWB) [
7], and Bluetooth [
8]. Fingerprinting, triangulation, and particle swarm optimization (PSO) techniques can be used as location positioning techniques [
9]. These existing wireless sensor positioning algorithms can be divided into range-based algorithms and range-free algorithms. The former are applied more widely for convenience in engineering practice. Typical range-based technologies include received signal strength indicator (RSSI), angle of arrival (AoA) [
10], time of arrival (ToA) [
11], time difference of arrival (TDoA) [
12], etc. However, in an indoor environment, the signal path is short and due to the complexity of the radio wave environment, it is difficult to achieve an accurate measurement distance with ToA, TDoA, and AoA, causing a problem in obtaining an accurate location. In contrast, RSSI can obtain relatively high positioning accuracy at a low cost by combining it with a fingerprinting scheme, which are generally applied for user positioning in an indoor environment [
13].
Therefore, in this work, a study was conducted to improve the performance of the PSO algorithm to increase the indoor positioning accuracy based on Wi-Fi in the indoor office environment suggested by the Third Generation Partnership Project (3GPP) [
14]. First, the database is built based on RSSI by performing the fingerprinting scheme in the offline step. As the indoor environment expands, these fingerprinting databases can be stored through big data. Thereafter, sample points (SPs) adjacent to the user can be derived through a fuzzy matching algorithm in the online step, and a region can be limited based on the derived SPs. Distributed particles within a limited region are then subjected to the PSO. The PSO locates the user by performing optimizations based on intelligent particles. There are two advantages to limiting the initial search region of the PSO. First, the probability of reaching the global optimum is improved in the PSO optimization process. Second, the processing time for target accuracy is reduced. Based on these two advantages, the proposed scheme can achieve fast processing time and high accuracy when positioning the user’s location. The main contributions of this paper are described as follows:
- (1)
We propose an improved PSO method for positioning the user’s location, based on a new method for limiting the initial search region of the PSO.
- (2)
It uses a single algorithm (fingerprinting, fuzzy matching) to find the region where the user is most likely to exist and limits that region to the initial search region of the PSO. It then locates the user by deploying intelligent particles within a limited region.
- (3)
Through the simulation results, it can be confirmed that when the PSO is performed in a limited region, high positioning accuracy and fast processing time are achieved.
This paper is structured as follows.
Section 2 analyzes related work for performing indoor localization.
Section 3 describes the system model.
Section 4 describes the proposed positioning scheme in detail.
Section 4 and
Section 5 describe the parameter values used in the simulation and the simulation results. Finally,
Section 6 presents the conclusion of this paper.
2. Related Work
There have been three types of models suggested regarding indoor user location positioning. First, in [
15], a method of identifying the user’s location using a particle filter in a complex indoor environment was proposed. The particle filter is a method of moving each particle in the same direction and speed according to the user’s movement. After moving the particle, if the particle is in an invalid position, the resampling process relocates the particle. As mentioned above, the movement and resampling of the particles are repeated to position the user. However, for resampling to be performed, many obstacles and walls must exist indoors.
The second uses fingerprinting. The fingerprinting scheme has been adopted by many existing indoor positioning systems [
16,
17]. The fingerprinting scheme collects RSS samples from SPs of the indoor environment and constructs a database. After that, the measured value in the online step is matched with the database to determine the user’s location. In [
18], an F-score-weighted indoor positioning algorithm that combines RSSI and magnetic field (MF) fingerprints in a Wi-Fi communication environment was proposed. The proposed scheme creates a learning database for indoor positioning based on the RSSI value and MF fingerprint value from each AP at the location of each SP (SP) in the offline step. Next, in the online step, the F-score-weighted algorithm is used to estimate the real user’s location. However, the experimental results of the authors could achieve 91% of the average positioning error less than 3 m. Despite this relatively high positioning accuracy, it requires a lot of time to calculate the user’s location in the online step.
The third method locates the user’s location based on the PSO. In [
19], the maximum likelihood estimation (MLE) method and PSO are used together. In the proposed method, the approximate location of the user is determined using MLE. Thereafter, the initial search region of the PSO is limited by setting a certain radius around the estimated position. The PSO distributes particles within a limited region to derive the user’s final location. However, there may be a problem that the user does not exist within a limited radius due to the RSSI error according to the distance. In [
20], the authors proposed a hybrid PSO-artificial neural network (ANN). A feed-forward neural network was chosen for this algorithm. The algorithm used Levenberg-Marquardt to estimate the distance between the AP and the user. Although the algorithm’s positioning accuracy has improved, it requires a large data set to train a feedforward neural network. If there are not enough data sets for training, it cannot converge to the best local minimum or global minimum. In [
21], the authors propose an improved algorithm for hybrid annealing particle swarm optimization (HAPSO). The proposed method improved the convergence speed and accuracy of PSO based on the annealing mechanism. However, the benefits of the proposed algorithm diminish as the number of access points (APs) increases. In [
22], the authors performed a comparison of the improved PSO of four methods. Although the hierarchical PSO with time acceleration coefficients in the literature achieved the highest positioning accuracy, the total number of iterations used in the simulation is 100, so the PSO processing time is very long.
Therefore, in this work we try to use a fingerprinting scheme [
23], weighted fuzzy matching (WFM) algorithm [
24,
25], and PSO algorithm to improve the positioning accuracy. Compared with the existing studies, the main improvements of this paper are as follows:
In [
15], each particle acts as a filter that moves in the same way as the user’s movement. However, when there are no obstacles in the indoor environment, the algorithm processing time is slowed down. The proposed method in this paper can shorten the convergence time by using intelligent particles.
In [
19], a merger of MLE and PSO was proposed. However, if the initial PSO search region is limited to a radius centered on the MLE result due to an error in the RSSI value, particles may not converge to an optimal position. The method proposed in this paper can achieve higher accuracy by setting the region where the user actually exists as a limited region through fuzzy matching.
4. Proposed Indoor Positioning
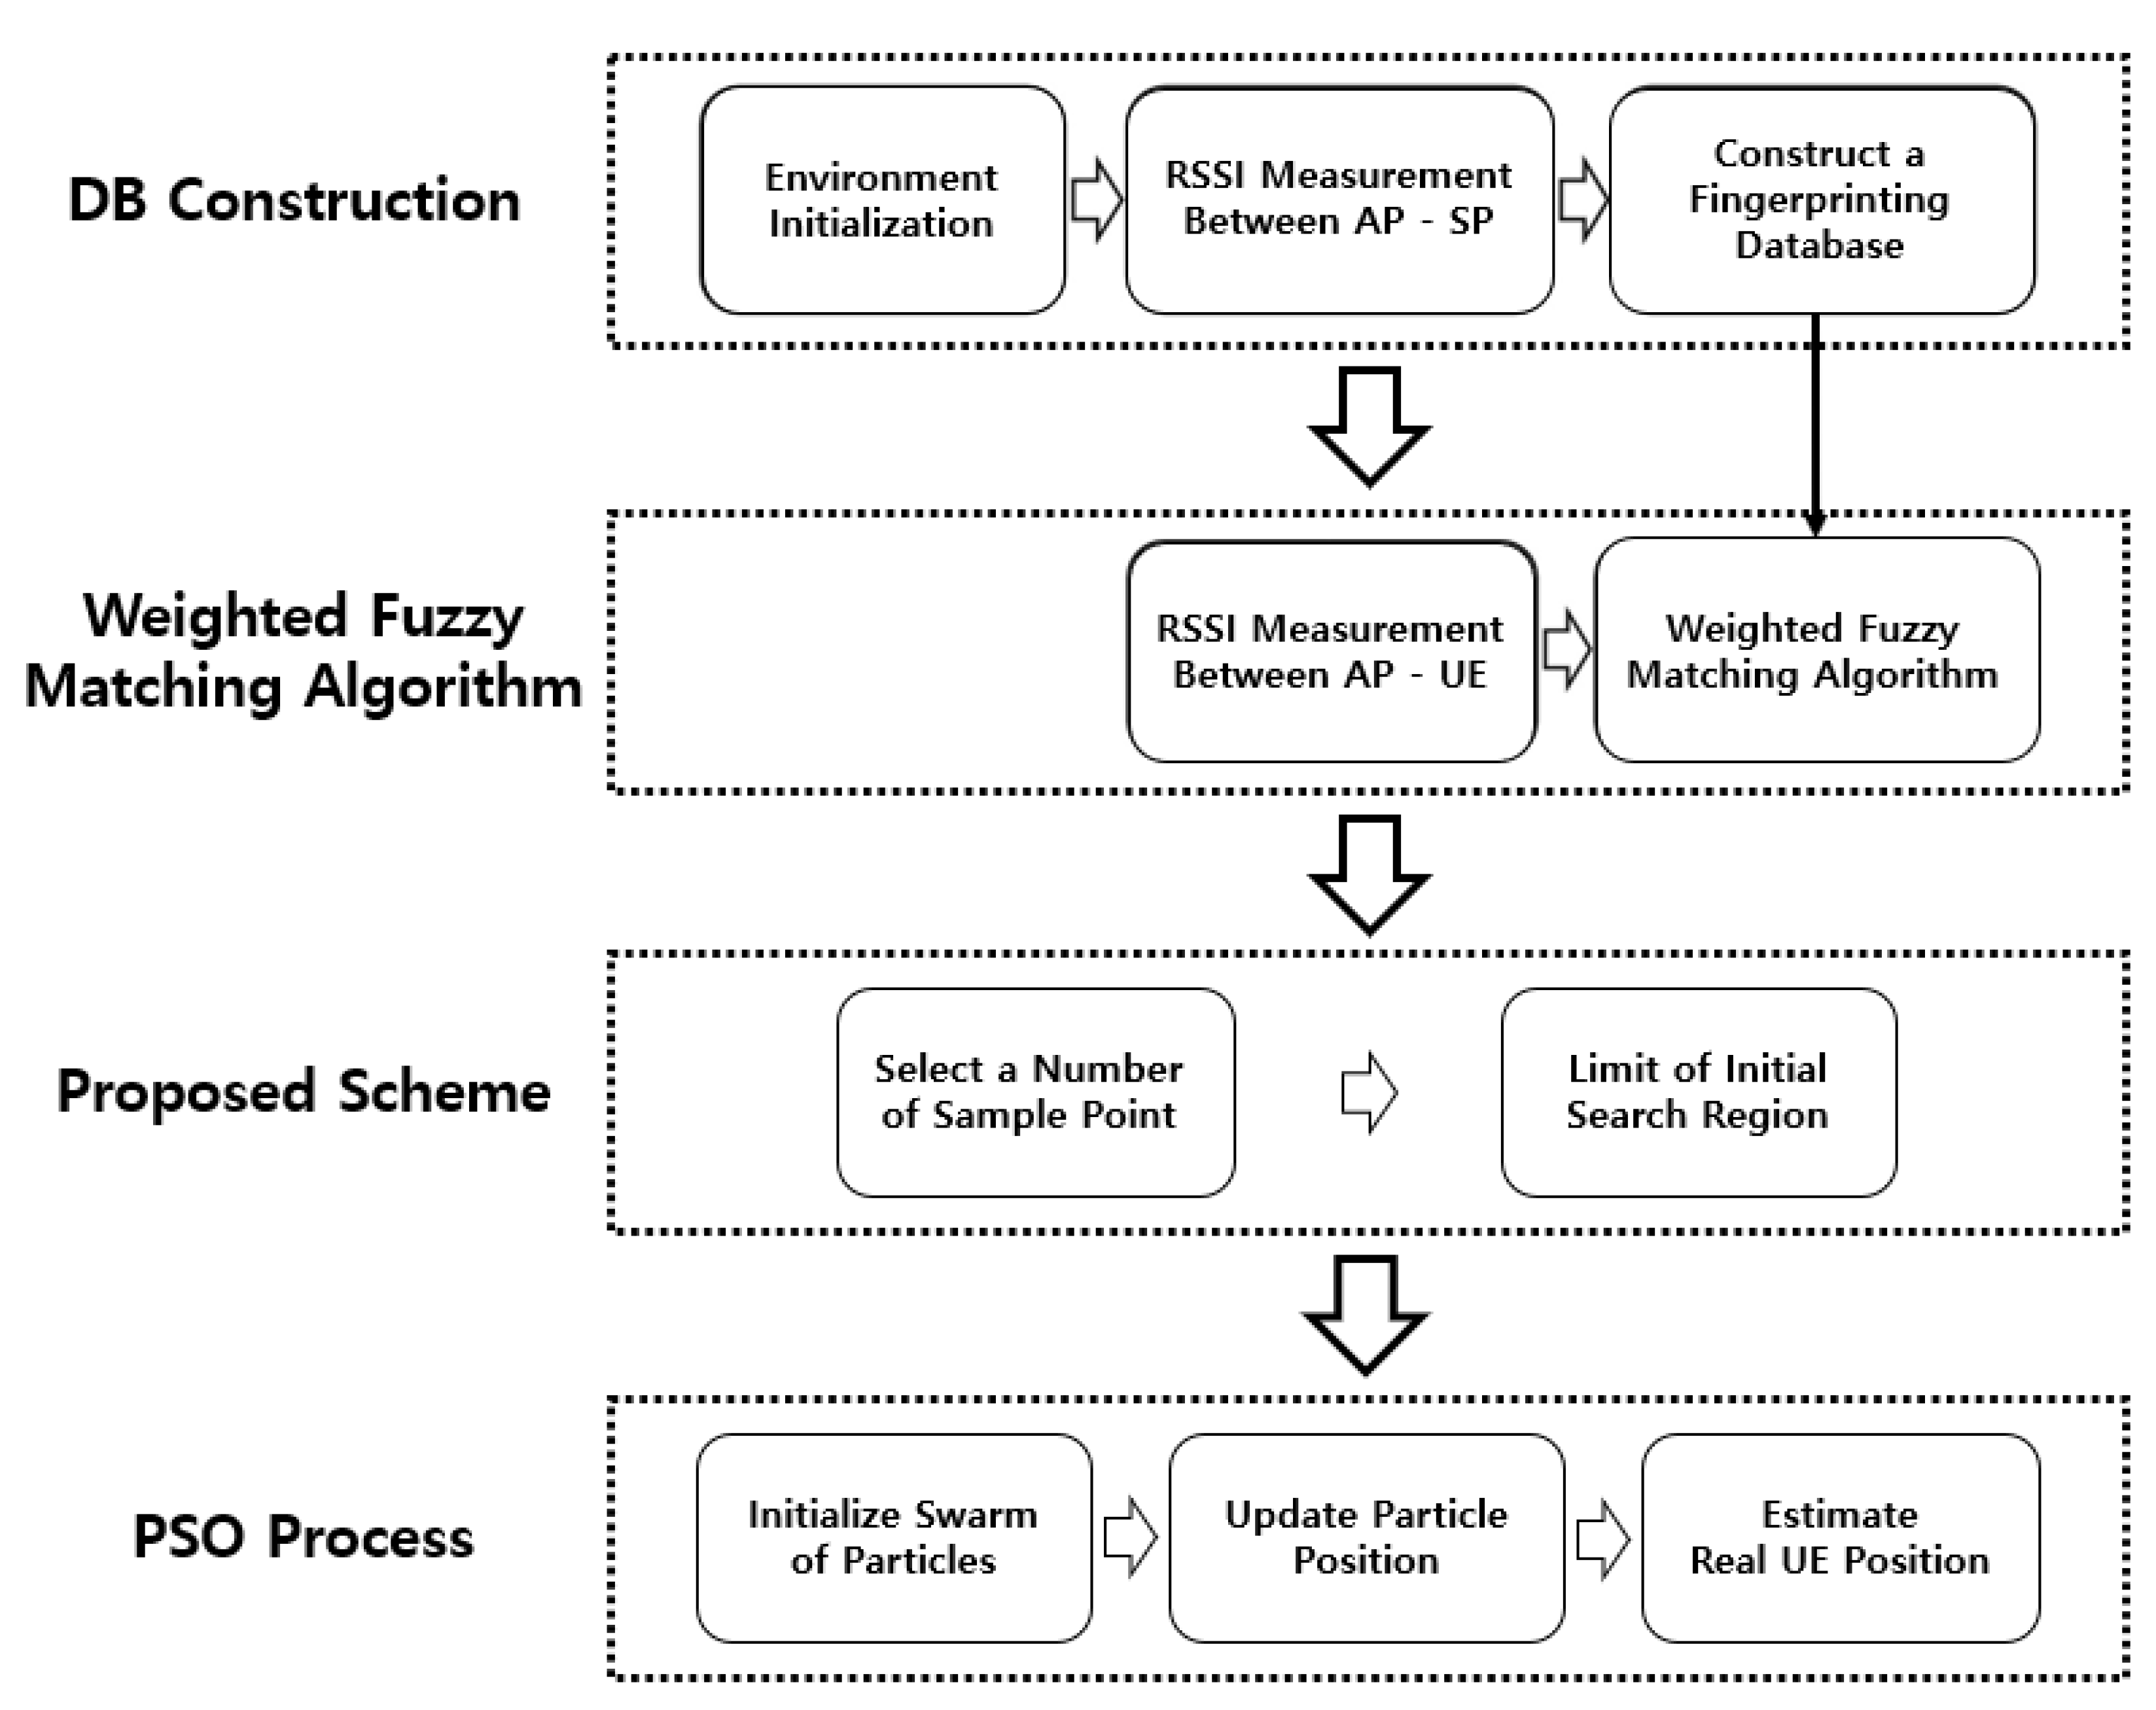
Figure 2 shows the block diagram of the proposed scheme in this paper. The proposed scheme sequentially applies the fingerprinting scheme, the WFM algorithm, the initial search region limitation, and the PSO. First, the fingerprinting scheme is performed in an offline step, and the RSSI value for each AP is measured at a SP. A fingerprinting database is built based on the measured RSSI values. In the online step, the RSSI value of the actual user is measured from the AP. The measured RSSI value of the user performs a WFM algorithm with the value of the fingerprinting database. When the WFM algorithm is applied, the closest SP can be derived based on the degree of correlation between the user and the SP [
26,
27].
The core idea of the proposed scheme is to limit the initial search region of the PSO to the closest SPs derived above. When the initial search region is limited, the probability that the user exists within the limited region can be increased. It is possible to increase the probability that intelligent particles converge to the global optimum (i.e., the user’s position) in the PSO process and shorten the convergence time for achieving the target positioning accuracy.
The PSO, which is then performed in a limited region, is an intelligent evolutionary computation algorithm that uses intelligent particles to find the optimal location of the user. The PSO has many advantages, such as high location accuracy, few parameters, and simple implementation [
21,
28]. During the search, all particles within the cluster share their optimal position. Each particle determines its own direction of movement based on shared information. Therefore, all particles must be periodically updated not only to the optimal position of the individual but also to the optimal position of the cluster. If the information of each particle is not shared or updated, all particles converge to the wrong position, which causes a serious position error. Each scheme is analyzed in detail through the following subsections.
4.1. Fingerprinting Scheme
The fingerprinting scheme is a method of constructing a database by measuring RSSI values at a specific location in the offline step. In the case of a real environment, the RSSI value from the AP must be collected at a certain location. In recent years, as indoor environments have become wider and more complex, i.e., large department stores, skyscrapers, and airports—big data technology that can store a large number of RSS samples has been needed when constructing fingerprinting databases. Hence, if a large number of SPs are used, problems arise in terms of time to measure the RSSI value for each SP and cost when managing the measured data. Conversely, if a small number of SPs are used, the error in positioning accuracy increases. Therefore, in a real environment, the two aspects should be considered, and an appropriate number of SPs suitable for the size of the positioning environment should be used. Due to this problem, in this paper, we perform a fingerprinting scheme based on simulation. To conduct this, we initially place the SP at a certain location. After that, each AP calculates the RSSI value for each SP based on (1) and builds the fingerprint database
. The established fingerprinting database
can be expressed as (3) below.
where
represents an RSSI value between the
-th AP and the
-th SP. Thereafter, the
value is used to estimate the actual user’s position in WFM.
4.2. WFM Algorithm
WFM is performed in the online step where the real user is present. Each AP calculates the RSSI value from user equipment (UE)
. The corresponding RSSI value can be expressed as (4).
where
represents an RSSI value between AP
and UE
. The Euclidean distance vector can then be derived after evaluating the correlation between
and
. For the
-th AP, the correlation between the RSSI value of the UE
position in the online step and the RSSI value of the SP
position in the offline step is given by
and can be expressed as (5).
After that, the value of
is normalized based on the min–max normalization formula, and it is defined as
.
can be expressed as (6).
where
represents the degree of correlation between UE
and SP
. According to (5), as
has a smaller value, it means that the distance between UE
and SP
is smaller, and it is determined that the correlation is high.
and
represent the maximum and minimum values of all correlations, respectively. The range of defined
is
. The Euclidean distance vector can be derived as (7) as the result obtained from the above equation.
Thereafter, the four fingerprinting vectors closest to UE
, which is the target for the current location positioning, may be selected. After that, the selected fingerprinting values can be sorted sequentially, starting from nearest. Furthermore, the coordinates of the UE can be calculated as follows.
where
is the closeness weighting factor obtained using the four SP coordinate values closest to the UE and the Euclidean distance vector. The larger the value of
, the smaller the distance between the UE and SP
.
can be defined as (11).
where
represents the Euclidean distance vector of the four SPs nearest to the location of the user derived in (7). Therefore, it can be expressed as
, and
is the largest Euclidean distance vector value.
represents the sum of the values of the four SP Euclidean distance vectors closest to the UE. Using
and
, we obtain the closeness weighting factor
corresponding to the four SPs closest to the UE.
As above, the user’s location can be estimated through WFM. However, in this paper, we propose a method to limit the initial search region of the PSO by using the four SPs nearest the actual user derived through fuzzy matching.
4.3. Limiting of Initial Search Region
The method of limiting the initial search region described in this subsection is the main contribution of this paper. The PSO is a technology to find the global optimum based on intelligent particles. When positioning a user’s location through the PSO, it is very important to limit the initial search region. Therefore, in this paper, we propose a scheme of limiting the initial search region to highly correlated SPs derived through fingerprinting and WFM algorithms.
First, the closeness between the user and each SP can be known based on the Euclidean distance vectors obtained through (7). After that, the Euclidean distance vectors are sorted in descending order from the largest value. The sorted values can be expressed as follows.
where
is the SP closest to the user among all SPs. To limit the initial search region, three or more SPs should be selected. Therefore, the proposed method limits the initial region by selecting four SPs from among the SPs sorted in descending order based on the results in
Figure 3.
Figure 3 shows the initial particle distribution of the PSO in both cases with a limited initial search region and a non-limited initial search region. As shown in
Figure 3, a high positioning accuracy can be obtained if the region is limited based on four SPs.
represents the number of SPs selected for region limitation. When the initial search region is limited and not limited, the initial distribution region of particles can be expressed as in (13) and (14), respectively.
where
represents the width of the search region,
represents the length of the search region, and
represents the distance between SPs. In general, the range of
is
, so if the region is limited by SPs, it is possible to narrow the region that the particle needs to search to find the global optimum.
Figure 4 shows the initial particle distribution of PSO in the case where the initial search region is limited and in the case where the initial search region is non-limited. As shown in
Figure 4, when the region is limited, it can be confirmed that the particles are distributed close to the actual user’s location
. Based on this, the PSO process can be performed to precisely position the user’s location. The next subsection describes the PSO.
4.4. PSO Algorithm
The PSO is an intelligent evolutionary computational algorithm proposed by James Kennedy and Russell Eberhart in 1995. The PSO is a population-based probabilistic approach used to optimize nonlinear problems. The detailed process of the PSO algorithm is as follows.
First, all particles undergo an initialization process. After that, the particles are randomly distributed in the search region to estimate the location of the UE. The distributed particles perform an iterative process of finding an optimal location estimated as the actual location of the UE. At each iteration, the particles follow the individual optimal position
and the swarm optimal position
. Particles derive the optimal location of the actual user based on the values of
and
that are continuously updated during the iteration process. The iterative process is performed using the equation below.
where
is the velocity of the
i-th particle in the
τ-th iteration and
is the position of the
i-th particle in the
τ-th iteration. In addition,
is an acceleration coefficient,
is an inertia coefficient, and
is an arbitrary coefficient of contraction.
represents the current number of iterations, and T is the total number of iterations of the PSO algorithm.
In general, the PSO algorithm is applied to optimization problems. However, in this paper, it is applied and used as one of the positioning schemes. In a practical environment, an error exists in the RSSI the UE receives from each Wi-Fi AP due to propagation loss, which obviously causes an error in the positioning process. Therefore, through the PSO process, the error can be converted to obtain a fitness with a minimum value. At this time, the function to determine the fitness of each particle can be written as (18).
where
is the distance between AP m and the receiver, and
is the location of AP m. We update swarm with the PSO and optimize the fit of each particle in (19).
After that, the PSO process ends when the preset accuracy error and number of iterations are reached. After the PSO process ends, the position of the particle with the best fit becomes the final UE’s estimated position. The process of the proposed algorithm is detailed in Algorithm 1.
| Algorithm 1: Proposed Indoor Positioning Algorithm |
| Result: Estimated Positioning |
Initialization
Distribute the SP at a specific location within the region |
for m = 1:M
where M is the total number of Wi-Fi APs
Measure Wi-Fi AP m and each SP’s RSSI value
End |
| Fingerprinting database
construction and Euclidean vector D calculation |
for m = 1:M
Measure Wi-Fi AP m and UE’s RSSI value
End |
| Construction of with measured values |
WFM with and
Select the 4 SPs nearest to the UE and obtain a limited region |
| Randomly distribute particles over the limited region |
For t = 1:T
PSO algorithm implementation
End |
| Obtain the position of the particle with the most optimal fit and use it as the UE’s estimated position |
5. Simulation Results
In this section, simulation is performed to verify the performance of the proposed scheme. The parameters used in the simulation are described in
Table 1.
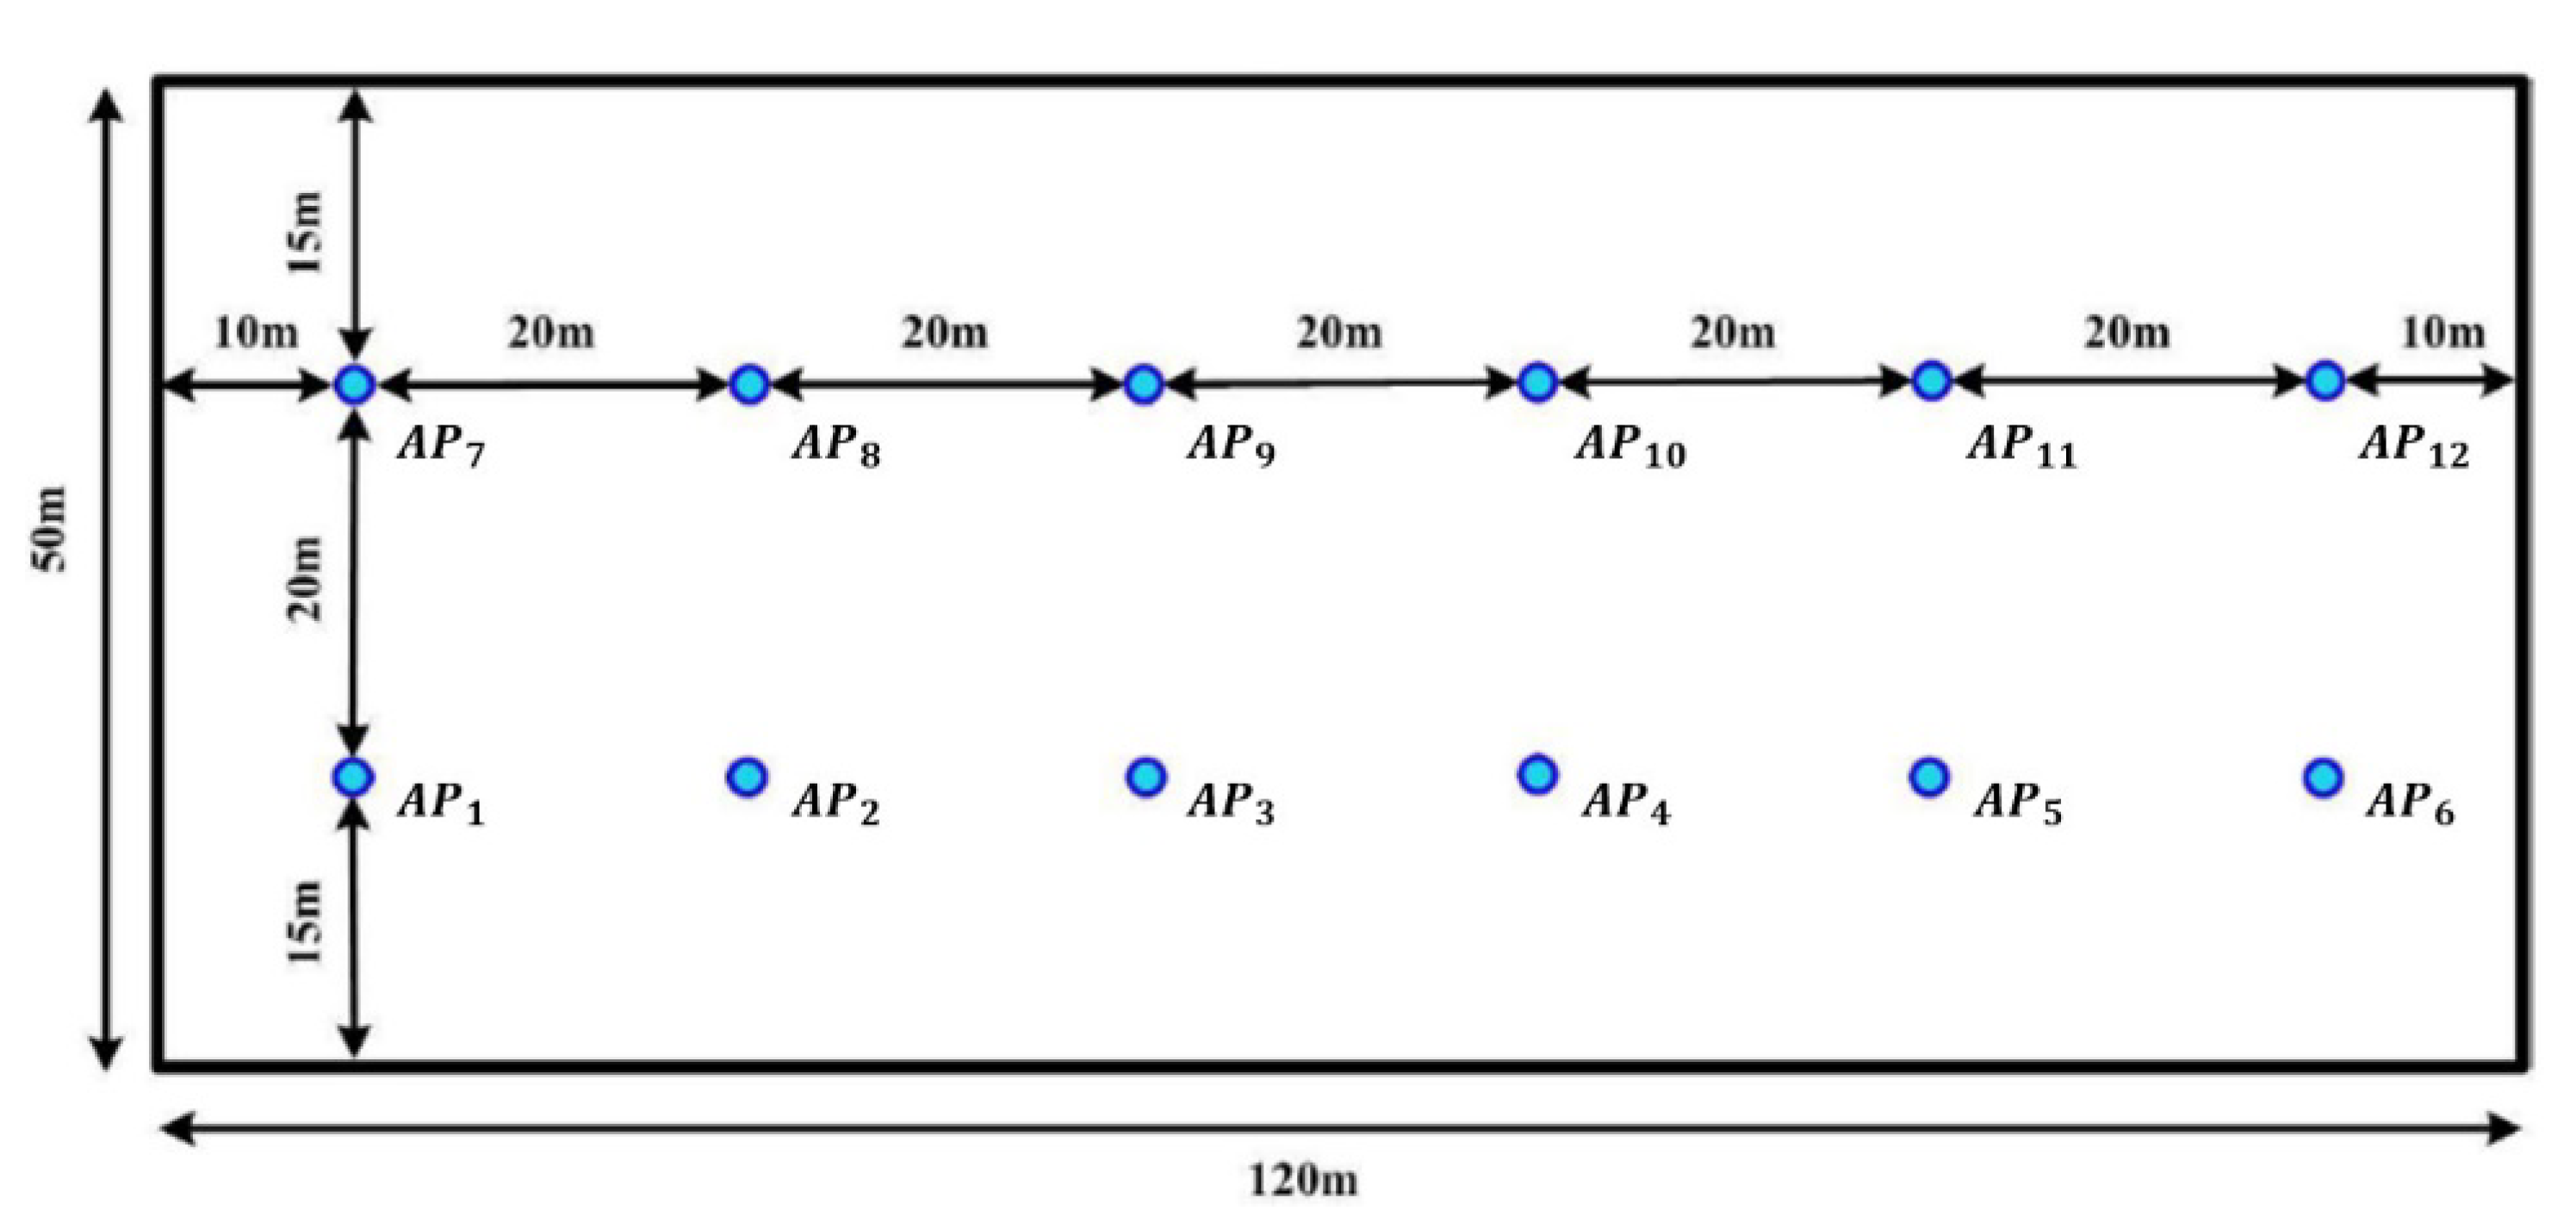
The simulation uses the indoor environment proposed by 3GPP [
14]. The size of the environment is defined as a space of 120 m × 50 m. The number of APs deployed in the indoor environment is 12, the same as the environment proposed by 3GPP. The power of each AP is set to 20 dBm. For N, the shadow fading standard deviation is used, and the value is
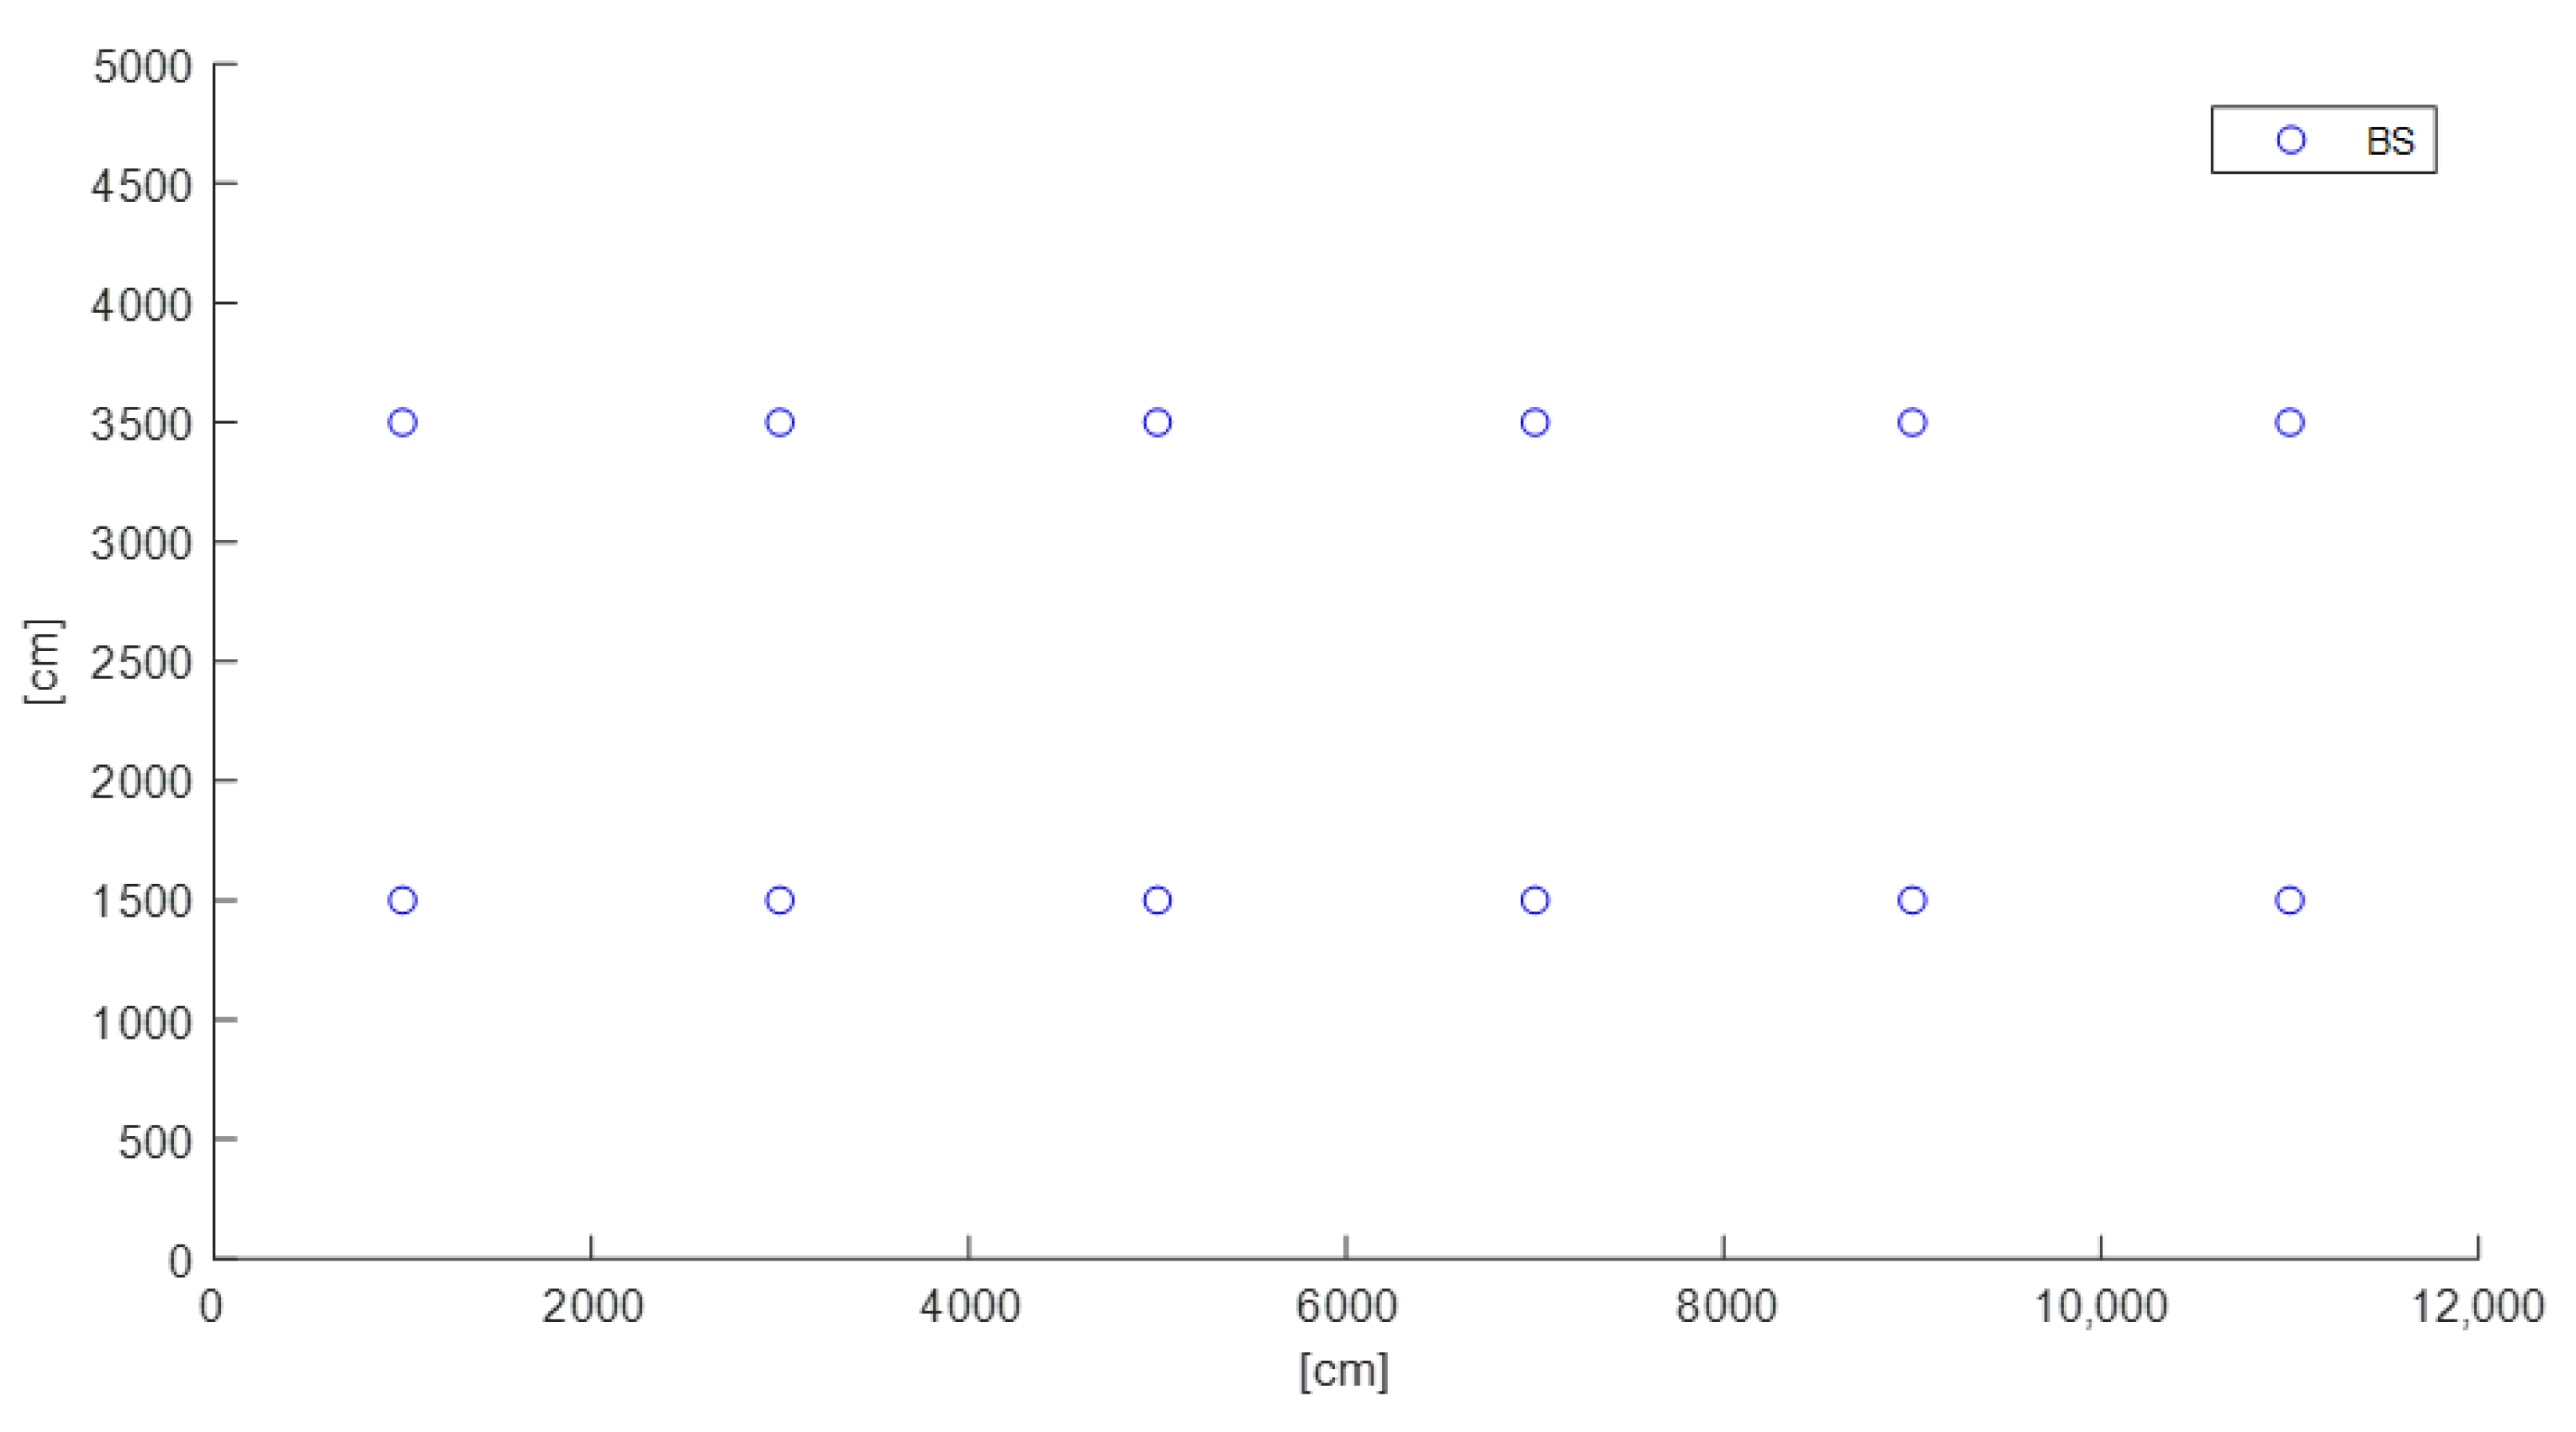
. If the N value is large, the error in the initial limited region will occur, which will result in a larger positioning error. The total number of iterations of the simulation is set to 10,000. At this time, the location is estimated using one UE. In addition, as the distance between SPs changes, the number of SPs also changes, and accordingly, the positioning accuracy is evaluated. The location of the Wi-Fi AP is shown in
Figure 5.
As shown in
Figure 5, 12 APs are deployed in the indoor environment. In addition, to analyze the performance of the proposed method, simulations are performed while changing the distance between SPs to 3, 6, and 9 m.
Table 2 shows the change of the number of SPs according to the change of the distance between SPs in the proposed environment.
As can be seen in
Table 2, the number of SPs significantly decreases as the distance between SPs increases.
Table 3 is the result of comparing the positioning accuracy of the ToA, TDoA, AoA, RSSI, and RSSI + FP (Fingerprinting) schemes. As shown in
Table 3, the positioning error is the largest when triangulating based on RSSI. However, when RSSI is used together with the FP technique in an indoor environment, the highest positioning accuracy can be achieved. Based on these results, in this paper, the RSSI and FP schemes are applied together.
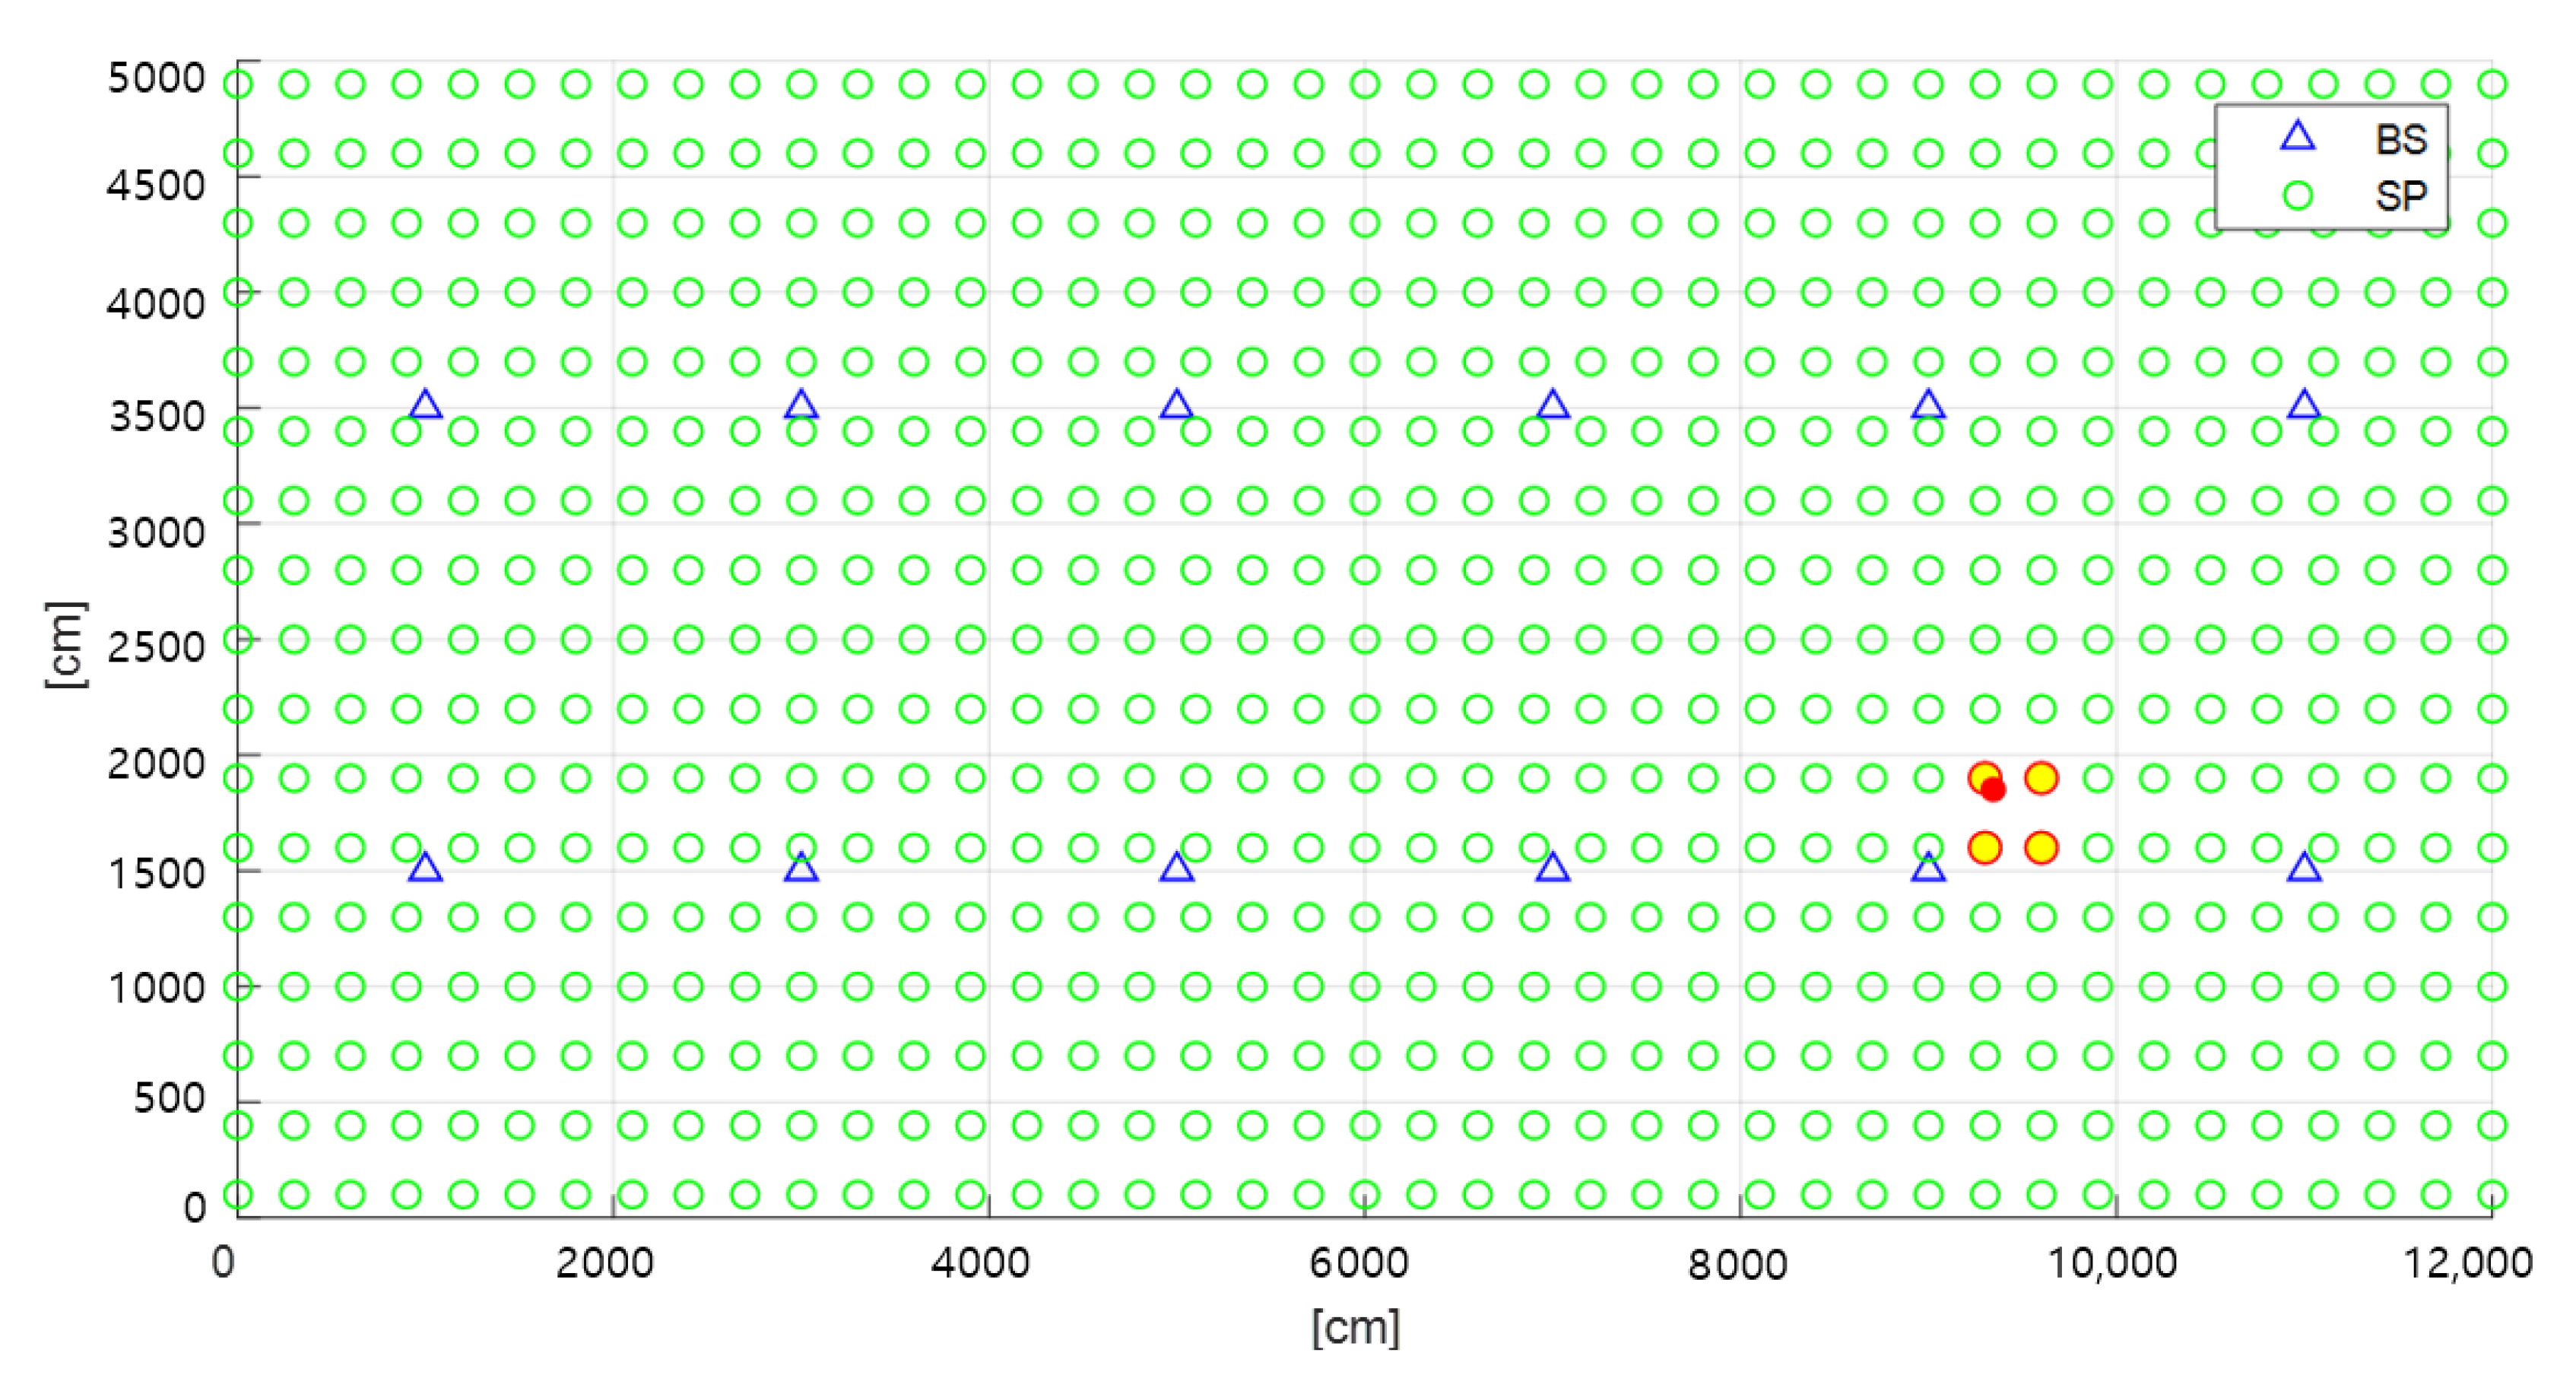
First, each AP builds a fingerprinting database by measuring RSSI values for all SPs in the offline phase. In the online positioning step, each AP measures the RSSI value for the actual user location. After that, the RSSI value of the actual user performs WFM with the built fingerprinting database. As a result of fuzzy matching, the four closest SPs can be derived from the actual UE location. The SPs derived through the simulation are shown in
Figure 6.
In
Figure 6, the green circles, red circles, and blue triangles represent the SPs, the actual UE locations, and the Wi-Fi APs, respectively. The yellow circles represent the SPs closest to the actual UE locations. The distance between SPs is 3 m, and the total number of SPs is 697.
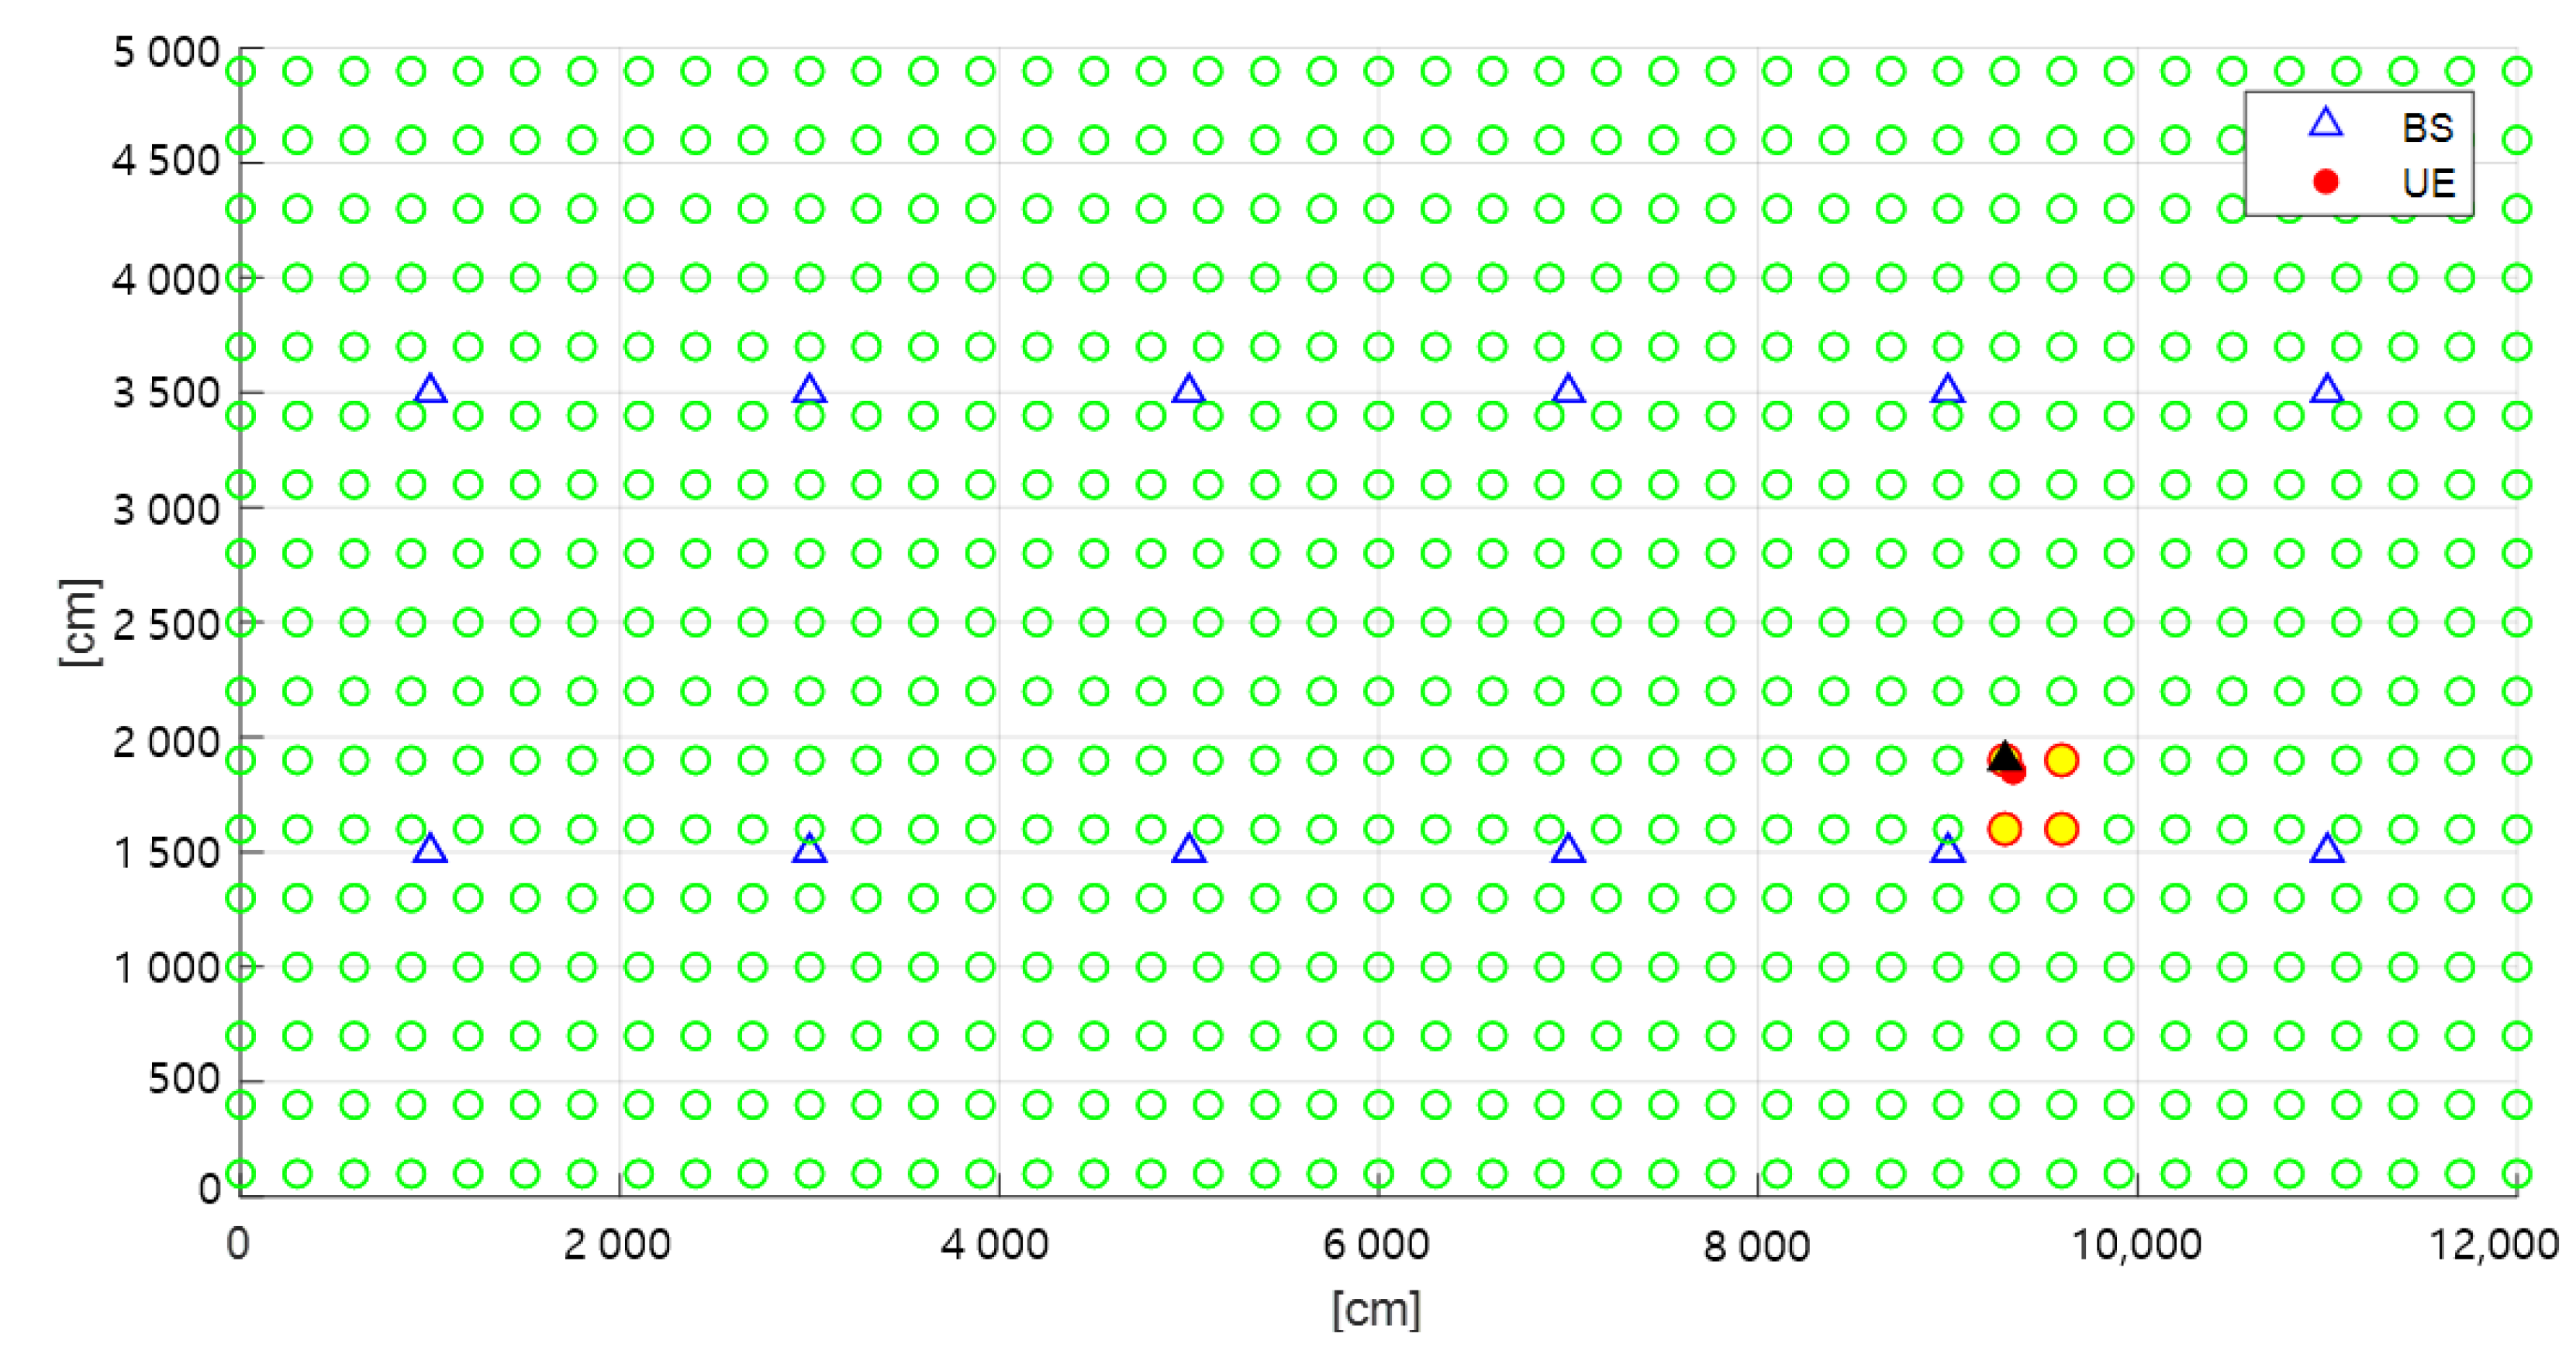
Figure 7 shows the results of improving the performance through the PSO algorithm after performing the WFM algorithm. The simulation limits the region to the four SPs closest to the UE obtained through the WFM algorithm. This can further improve the average positioning accuracy and convergence speed by limiting the initial region of the PSO algorithm. Location accuracy can be obtained by calculating the difference between the actual UE location and the estimated location.
As shown in
Figure 7, it can be confirmed that the four SPs nearest to the UE are selected through the WFM algorithm. In addition, the black triangle is the user’s final position obtained by performing the PSO algorithm. In other words, this is the position of the particle with the smallest value by evaluating the fitness of each particle after the PSO algorithm is ended. That position can be used as the UE’s final estimated position and compared to the UE’s actual location. The simulation is performed a total of 10,000 times, and the position of the UE is changed randomly during iterations. The final positioning error is determined by averaging all the values from the 10,000 different locations of the UE.
Figure 8 shows the result of comparing the proposed scheme with the existing positioning algorithm. To perform the performance comparison, positioning errors are compared while changing the distance between SPs. The PSO algorithm ends when the maximum number of iterations T is reached.
In
Figure 8, WFM is a result of estimating the location of the UE through a WFM algorithm. The cosine similarity (CS) is a result of estimating the location of the UE through a CS scheme [
29]. MLE-PSO is the result of estimating the location of the UE through the combination of MLE and a PSO scheme [
19]. Finally, the range-limited (RL)-PSO executes the PSO algorithm within a limited region. The simulation result is the result of measuring the positioning error while changing the distance between the SPs. The WFM algorithm is the result of determining the final location of the UE based on the closeness weight. It can be seen that the smaller the spacing between the SPs, the higher the accuracy achieved. However, as can be seen in
Table 2, the number of SPs increases rapidly as the distance between SPs decreases. This causes a complexity problem when building a database in the fingerprinting scheme. The CS is the result of estimating the final position of the UE through a CS scheme. The CS is a method of calculating the similarity between the fingerprinting database of SPs measured at each AP and the RSSI of the real user. After that, the location of the SP with the highest similarity to the actual user is mapped to the user’s estimated location. As can be seen from
Figure 8, the positioning error increases as the distance between SPs increases. Additionally, it is confirmed that the result obtained through fuzzy matching is the same when the four SPs adjacent to the actual user are derived based on the CS.
The MLE-PSO is a method of estimating the position of the UE through MLE and limiting the initial region of the PSO algorithm based on a circle centered on the estimated location. It can be seen that this scheme also shows a constant positioning error irrespective of the distance between the SPs in the same way as PSO only. In addition, it can be confirmed that the MLE-PSO scheme achieves higher accuracy when the distance between the SPs is increased compared to the scheme that depends on the distance between the SPs. However, it is difficult to allow an error of about 4 m in an indoor environment. To summarize the previous information, the positioning accuracy and the number of SPs are in a tradeoff relationship. Therefore, research is needed to improve the indoor positioning accuracy by fusing several single algorithms, as in the method proposed in this paper. As can be seen in
Figure 8, the RL-PSO scheme proposed in this paper achieves the highest positioning accuracy. With the RL-PSO, as mentioned above, if the initial search region of the PSO is limited, faster convergence speed and higher positioning accuracy can be achieved. This result was verified through simulation. Furthermore, we confirmed that we achieved high positioning accuracy performance when using a single algorithm by fusing it rather than using a single algorithm such as WFM or CS.
Table 4 shows the processing time required to achieve a positioning error of 1 m through each scheme. The distance between the SPs of the RL-PSO scheme is 3 m, and there are a total of 697 SPs, as shown in
Table 2. The number of particles of the particle filter is 697, the same as the number of SPs of the RL-PSO. As can be seen from the results of
Table 4, the processing time of the RL-PSO is shorter. The RL-PSO can position the user by performing the RSSI-based positioning process once, but the particle filter is a sensor-based positioning method of the UE and moves particles according to the movement of the UE to the position the user. Although the above result is the processing time obtained through simulation, it can be seen that a longer processing time is required for positioning, considering that the user’s moving speed is about 3 to 5 km/h in the real environment.
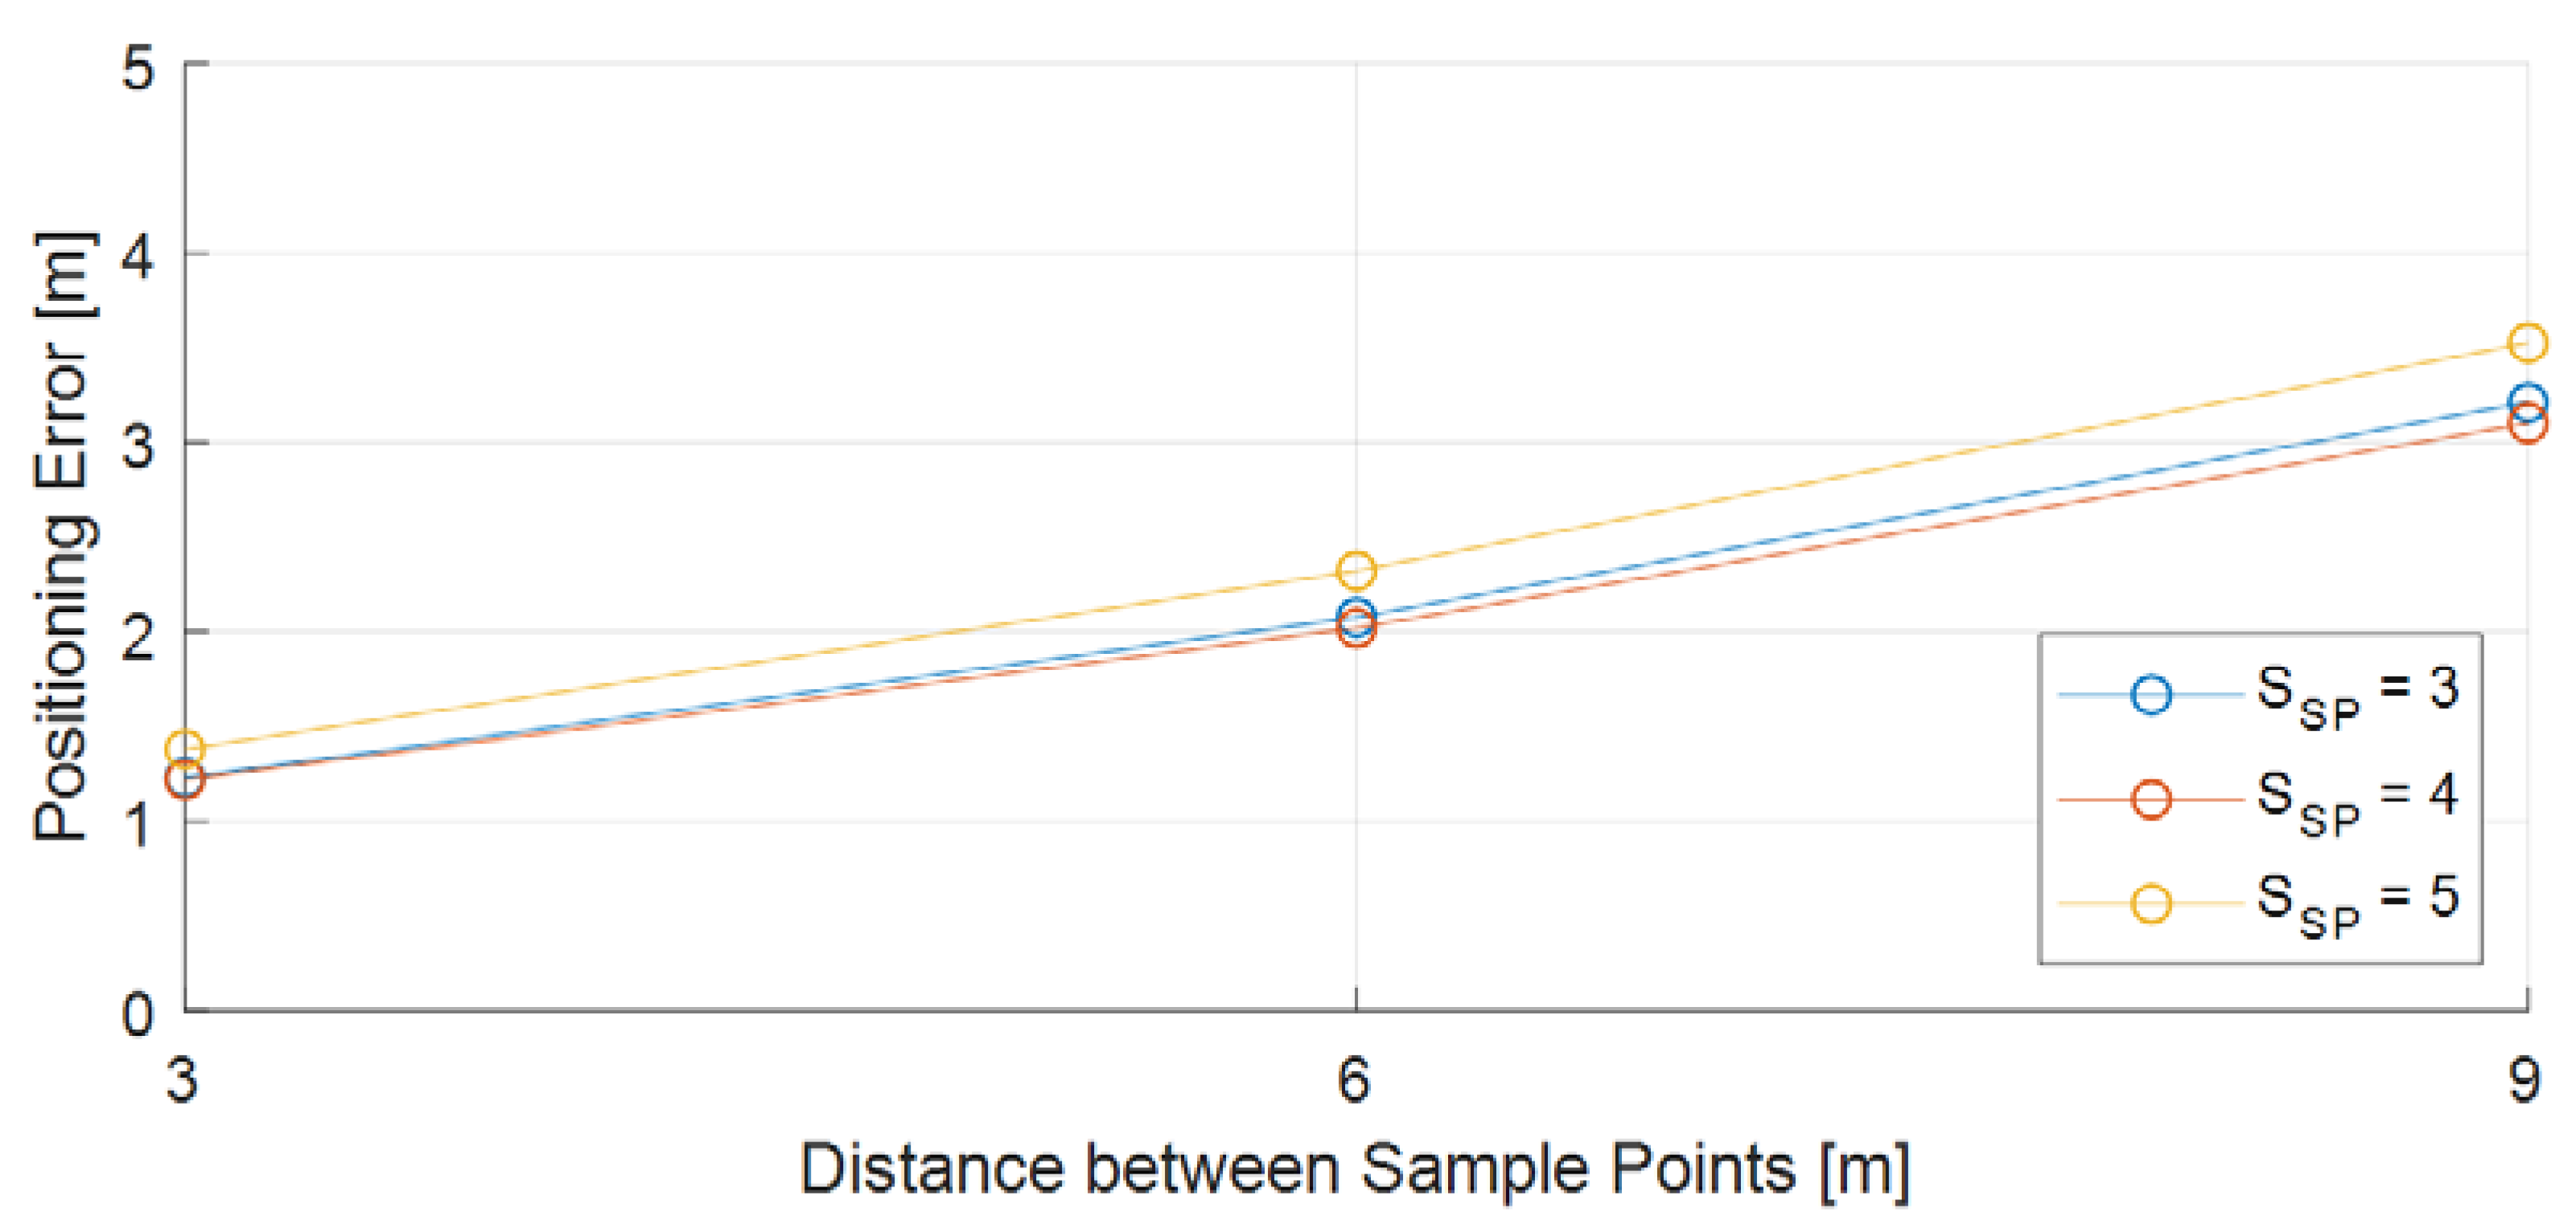
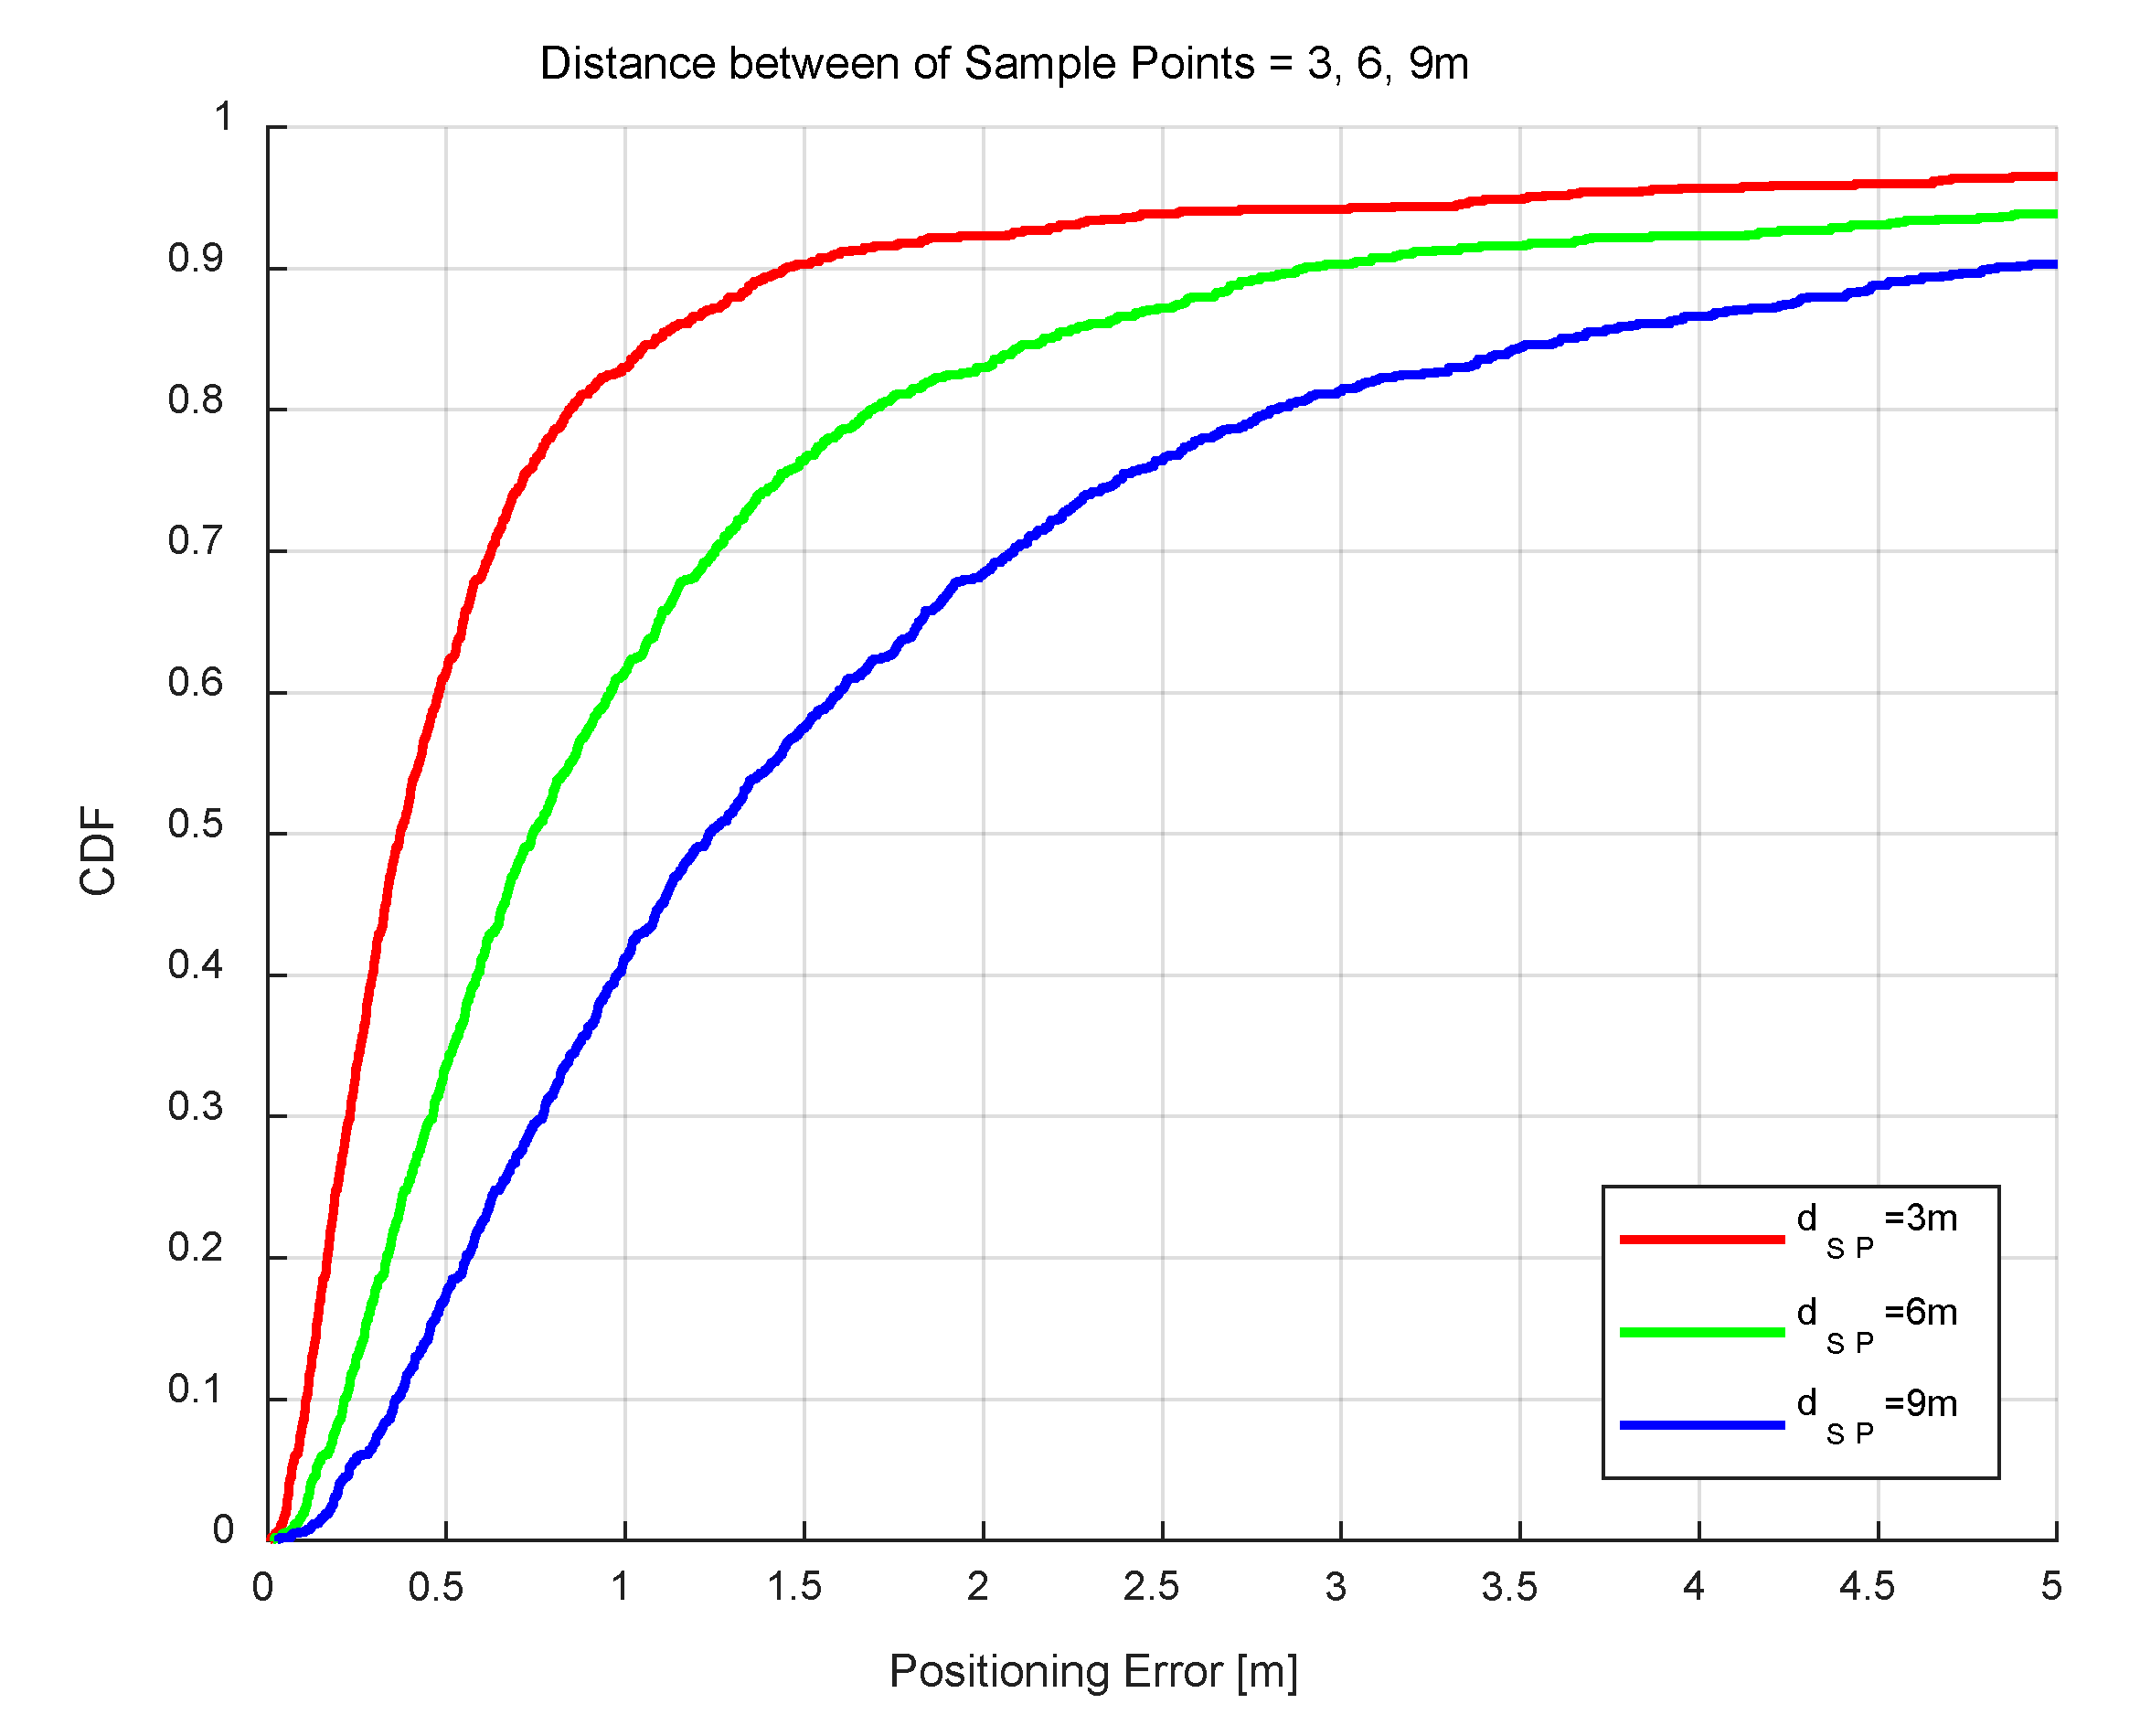
Figure 9 shows the cumulative distribution function(CDF) of the positioning error according to the distance between SPs. In the figure, it can be seen that when the distance between SPs is 3 m, about 90% of the positioning errors are within 1.5 m. However, it can also be seen that the positioning error increases as the distance between SPs increases. This is because when the number of iterations of PSO is fixed, as the distance between SPs increases, the region where particles need to be searched becomes wider. Therefore, it is necessary to set the distance between SPs in consideration of the algorithm processing time and target positioning accuracy.


