Article

Assessment of Skin Deep Layer Biochemical Profile Using Spatially Offset Raman Spectroscopy

by
Martha Z. Vardaki
1,*,
Konstantinos Seretis
2,
Georgios Gaitanis
3,
Ioannis D. Bassukas
3 and
Nikolaos Kourkoumelis
1
1
Department of Medical Physics, School of Health Sciences, University of Ioannina, 45110 Ioannina, Greece
2
Department of Plastic Surgery, School of Health Sciences, University of Ioannina, 45110 Ioannina, Greece
3
Department of Skin and Venereal Diseases, School of Health Sciences, University of Ioannina, 45110 Ioannina, Greece
*
Author to whom correspondence should be addressed.
Appl. Sci. 2021, 11(20), 9498; https://doi.org/10.3390/app11209498
Submission received: 9 September 2021 / Revised: 8 October 2021 / Accepted: 10 October 2021 / Published: 13 October 2021

Abstract

:

Featured Application

This study employs a spatially offset spectroscopic approach with a potential applicability to in vivo skin cancer screening.

Abstract

Skin cancer is currently the most common type of cancer with millions of cases diagnosed worldwide yearly. The current gold standard for clinical diagnosis of skin cancer is an invasive and relatively time-consuming procedure, consisting of visual examination followed by biopsy collection and histopathological analysis. Raman spectroscopy has been shown to efficiently aid the non-invasive diagnosis of skin cancer when probing the surface of the skin. In this study, we employ a recent development of Raman spectroscopy (Spatially Offset Raman Spectroscopy, SORS) which is able to look deeper in tissue and create a deep layer biochemical profile of the skin in areas where cancer lesions subtly evolve. After optimizing the measurement parameters on skin tissue phantoms, we then adopted SORS on human skin tissue from different anatomical areas to investigate the contribution of the different skin layers to the recorded Raman signal. Our results show that using a diffuse beam with zero offset to probe a sampling volume where the lesion is typically included (surface to epidermis-dermis junction), provides the optimum signal-to-noise ratio (SNR) and may be employed in future skin cancer screening applications.

1. Introduction

Skin cancer is currently the most common type of cancer in Caucasian populations with annual estimates of cases and deaths to be constantly rising (more than 7000 deaths in the USA for 2019) [1]. The three main skin cancer types are basal cell carcinoma, squamous cell carcinoma and melanoma, named after the skin cell where the cancer initially develops and varying in recurrence rate and metastatic nature. Non-melanoma cancers [2] derive either from the innermost layer of the epidermis (basal cell layer) forming basal cell carcinoma or from the upper part of the epidermis (squamous cells), resulting in the squamous cell carcinoma. Melanoma on the other hand develops in the skin’s melanocytes, which reside at the dermal-epidermal junction [3].
The current gold standard for the clinical diagnosis of skin cancer is based on visual examination followed by biopsy. However, the accuracy of diagnosis can vary depending on the clinician, experience and training [4]. Additionally, biopsy removal remains an invasive procedure and cannot be used for the spatial evaluation of tumor growth or as often as required for lesion monitoring with time. Therefore, there is imminent need for a non-invasive approach able to effectively assess the tumor growth and spread.
Raman spectroscopy (RS) is an emerging group of non-invasive and highly chemically specific techniques relying on light-matter interaction to provide information of the sample (i.e., skin cells) on a molecular level. Among numerous biomedical applications [5,6], Raman spectroscopy has been extensively employed to skin cancer diagnosis with most of the studies involving measuring skin tissue of various pathologies ex vivo [7,8], and real-time in vivo skin measurements [9]. Although, depending on the skin cancer type, the origin of the cancer can be found in different depths of the tissue, most recent studies are focused on the surface of the skin using confocal measurements where better resolution and therefore, malignancy discrimination, can be achieved [10].
Deep Raman spectroscopy and specifically Spatially Offset Raman Spectroscopy (SORS), is a relatively recent development [11] able to look deeper inside the skin tissue and collect Raman photons with a bias towards deeper skin layers where skin cancer initially spreads. In SORS measurements, the excitation and collection area on the sample surface are decoupled and the distance between them (which is defined as the ‘’offset’’) tends to correlate with the depth of Raman photon origin [12]. In vivo SORS measurements on humans have currently recovered bone signal underneath the skin [13] using an inverse SORS system, and glucose in the blood below the epidermis using defocused Raman [14] which is also a SORS variant. Although SORS measurements have demonstrated the potential of assessing the quality of deeper layers of salmon skin itself [15], similar measurements have never been performed on human skin before. The most relevant reports to our study include the in vivo employment of Raman fiber probes which are able to probe a greater depth in the sample compared to typical microscopy, reportedly up to 200 μm in the skin [16,17,18].
However, none of those studies employed a spatially offset mode to explore the skin deep layer profile with a potential applicability to skin cancer screening. Unlike breast cancer studies where SORS has been successfully applied to recover a signal of in tissue-depth suspicious calcifications [19], it remains unclear whether there is a benefit for the deep Raman modality to be employed in the case of skin cancer. This is mainly due to the lack of a specific biomarker of adequate concentration and strong Raman scattering cross-section (comparable with calcifications, bone, or glucose in blood) which spontaneous RS would be able to pick up through the skin.
In this study we attempt a novel approach to explore the skin biochemical profile with a potential applicability to skin cancer screening by employing both human skin tissue and equivalent phantoms. We achieve that by employing the SORS configuration on a set of healthy samples and in depths where skin cancer lesions are expected to develop. We initially use optical phantoms to specify the optimum range of spatial offset while probing ‘’lesions’’ in different depths and then employ the optimum offset range in healthy human skin of different anatomical areas to assess the sampling volume and study the different skin layers’ signal contribution to the recorded Raman signal.
The invasion depth of a skin tumor is frequently underestimated and inadequate excision and local recurrence is often the poor outcome of a surgical intervention. To that end, the preliminary results derived from this study aim to the development of in vivo skin cancer screening applications able to early detect the biochemical profile of cancer in deeper skin layers.

2. Materials and Methods

2.1. Tissue Phantom Preparation

Based on previous studies [20], we employed two-layer optical tissue phantoms to simulate skin tissue for Raman measurements. The phantoms consisted of a top and a bottom gelatin layer of different optical properties, representing epidermis and dermis respectively, and a 3-layer parafilm (PF) with a total thickness of 0.39 mm which was either laid at the top or embedded in the gelatin matrix. The gelatin-gel based layers were prepared according to previously published, adapted protocols [21,22] (Supplementary Material).
Two types of skin tissue phantoms were fabricated: (i) Type A with a PF layer at the top of the gelatin matrix, representing superficial types of skin cancer and (ii) Type B with PF buried in a depth of 3 mm (representing lesions of deeper layer origin).
Different concentrations of Intralipid were added to the top and bottom layers in order to match the lower limits of the reduced scattering coefficient for epidermis and dermis found in the literature [23,24,25,26,27]. During top layer fabrication, 5 mL of Intralipid were added for a reduced scattering coefficient of 20 cm−1, whereas for the bottom layer, a volume of 10 mL Intralipid were added to achieve a value of 10 cm−1 reduced scattering coefficient. Intralipid was optically characterized in previous work [12] and additional absorbing agents were not added during phantom fabrication. All phantoms were prepared and measured in three replicates.

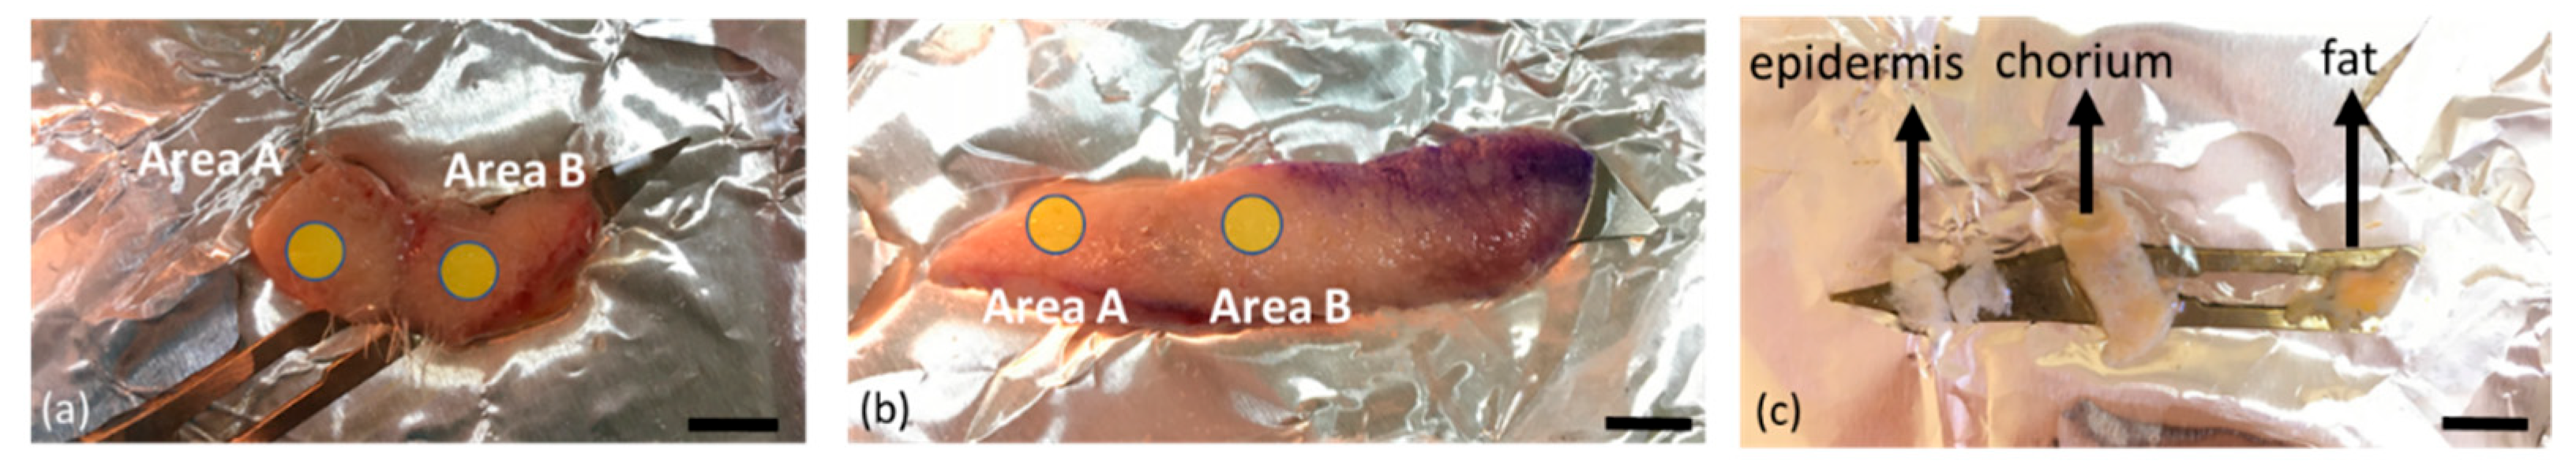
2.2. Human Tissue Samples
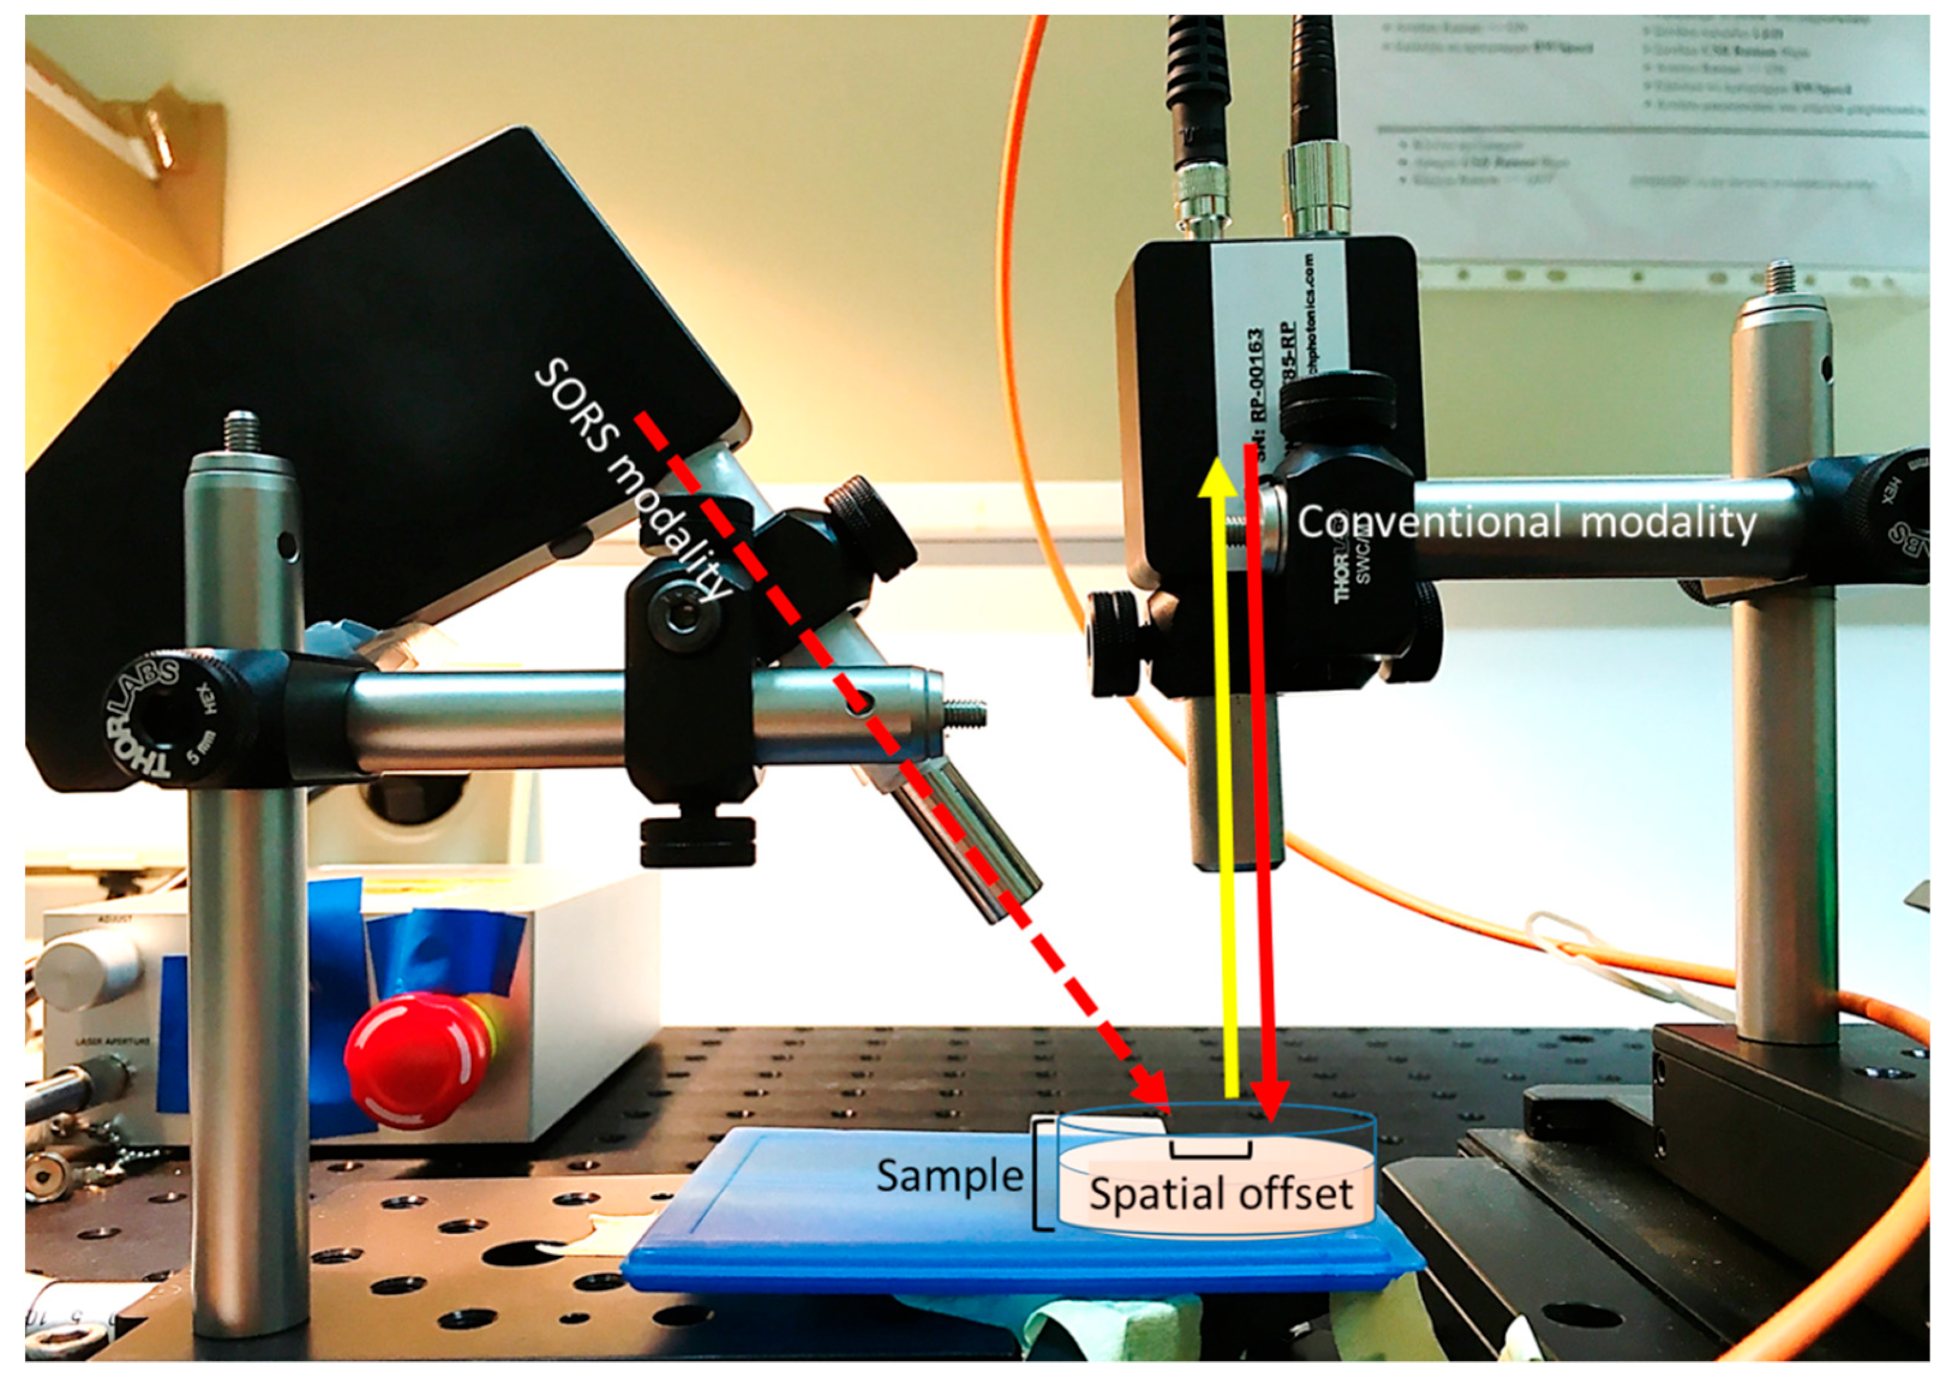
Five human tissue samples (summarized in Table 1) were removed as part of a skin excision. The samples were all visually assessed as healthy, varied in thickness and morphology and stored in a gauge soaked in saline while transferred. Total sample and epidermis thickness was measured in all samples with a micrometer before and after dissection, respectively. Each sample was rinsed with saline to remove the excess of blood and placed on a stainless-steel blade at the top of aluminum foil in a petri dish prior to measurement acquisition. One or two areas were measured on each sample (Table 1) and saline was applied in between sets of measurements to maintain the hydration and avoid tissue shrinkage.
At the end of the Raman measurements, one sample from the scalp and one eyelid (Samples 1 and 4, respectively) were dissected into three visually distinct from each other separate layers (epidermis, dermis, subcutaneous tissue) (Figure 1) in order to acquire reference Raman measurements.

2.3. Raman Setup

All Raman measurements were carried out using a custom-built Raman system. The optical design was based on previous studies [28]. A 785 nm laser (Mini-Benchtop Stabilized Laser, Coherent, Santa Clara, CA, USA) was focused on the sample through a multimode fiber (M43L01, Thorlabs) which was in turn coupled to a standard probe with a 4 cm long and 11 mm working distance probe tip (Wasatch Photonics, Morrisville, NC, USA). A second fiber (M29L01, Thorlabs) was coupled to the same probe to collect the Raman scattered photons in a back-scattering conventional mode. The collection fiber was coupled to an f/1.3 Raman spectrometer (WP 785 ER Raman Spectrometer, Wasatch Photonics). The laser spot size employed in conventional modality was 170 μm.
For the SORS measurements, a second excitation probe (BAC102, B&W TEK) was instead coupled to the laser delivering a beam at a 45° angle to the sample (Figure 2). The 45° angle setup was used for practical reasons but also as it was efficiently employed in previous studies [29,30].The incident beam on the sample surface was elliptical, with the shorter radius being 2 mm and the longer 3 mm. The excitation probe employed for the SORS measurements was mounted on an individual xy translational stage (Thorlabs, Inc., Newton, NJ, USA) to adjust the spatial offset.

2.4. Raman Measurements

The signal was collected using five accumulations of 5–10 s depending on the CCD saturation levels. Dark noise was recorded prior to each measurement and automatically removed by the software (Enlighten Spectroscopy software, Wasatch Photonics). The system was calibrated using Raman bands of an aspirin tablet (acetylsalicylic acid). All samples were measured with full laser power (300 mW on the sample) in an extended spectral range (0–3656 cm−1). Reference skin spectra were acquired in the conventional configuration. For SORS measurements, the spatial offset used was in a span of 0–10,000 μm (with a 500 μm increment) for the phantoms and 0–200 μm (with a 10 μm increment) for the skin tissue. Visual examination of the tissue revealed no heat degradation due to the laser beam as (i) the sample was kept hydrated between measurements with saline and (ii) the large volume of each tissue sample (compared to tissue sections) allowed for efficient heat dissipation.

2.5. Data Analysis

All data were exported through Enlighten Spectroscopy software (Wasatch Photonics) and loaded into Matlab version R2019b (Mathworks). The Raman spectra were subjected to cosmic ray removal using a 3-window median filter, baseline corrected (11 iterations) and smoothed using custom algorithms [31,32].
For the manual estimation of signal-to-noise ratio (SNR) in tissue phantoms, the spectral range was truncated between 1753 and 1800 cm−1 and the baseline was corrected using asymmetric least squares smoothing. The noise in this featureless area was calculated as the standard deviation of the residual. The height of the baseline corrected peak of Parafilm at 1061 cm−1 was then divided with the noise to calculate the SNR value at each recorded spectrum. The SNRs at different offsets for each phantom were normalized to the SNR corresponding to the zero offset measurement in each set.
For Principal component analysis (PCA) the data were additionally vector normalized, mean-centered and truncated to the fingerprint region (680–1800 cm1).

3. Results

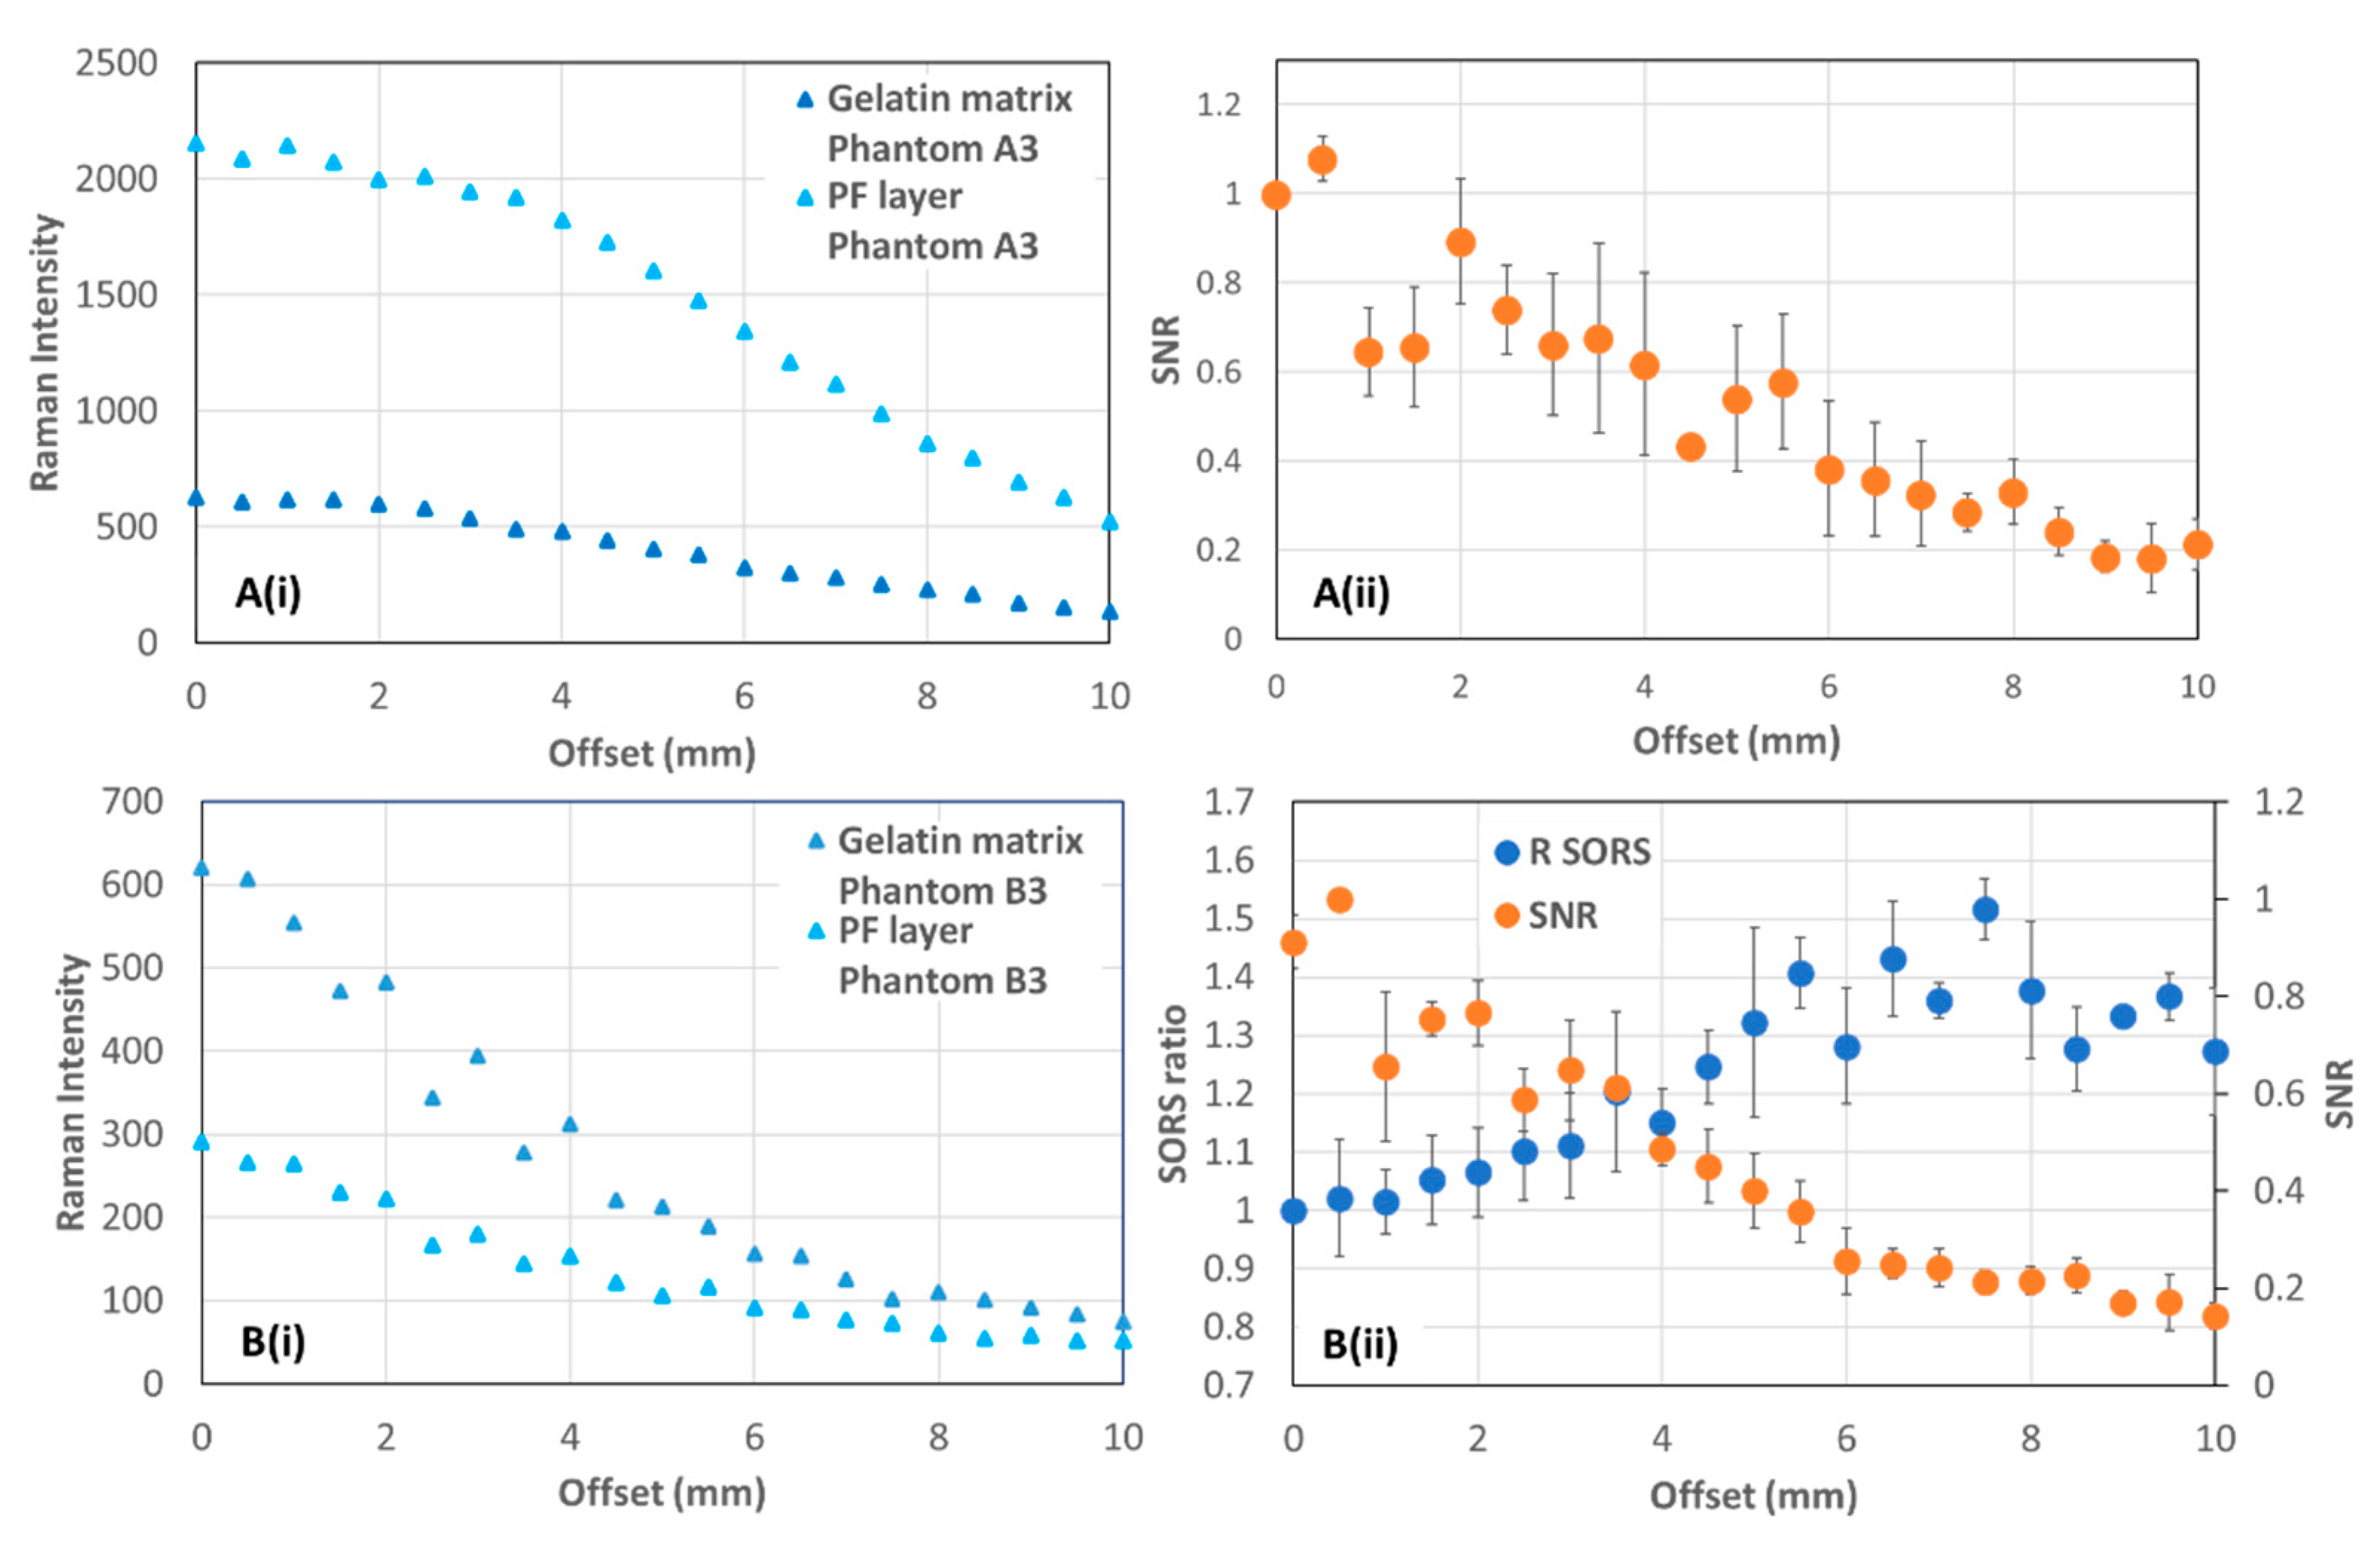
3.1. Tissue Phantoms

In order to explore the signal contribution of the PF layer in the collected Raman spectra, when the latter was located in different positions in tissue phantoms (on the top of Phantoms A and buried in a 3 mm depth in Phantoms B), we employed the SORS configuration of the optical setup. SORS measurements were acquired after decoupling the excitation and collection optical paths in different degrees, by changing their relative distance, resulting in a series of different offsets (0–10 mm with an interval of 0.5 mm).
The individual contributions of gelatin and the PF layer in the collected Raman spectra were assessed in correlation with the offset in both types of tissue phantoms (Figure 3). As expected, the top layer signal in both cases diminishes faster with offset compared to the bottom layer signal (Figure 3A(i),B(i)). This is expected as in two-layer phantoms the Raman photons that are generated deeper inside the phantom are more likely to migrate laterally before they are emitted from the sample surface [33]. However, we also notice that in Phantoms A (Figure 3A) the bottom layer (gelatin) signal significantly deteriorates with increasing offset compared to the bottom layer (PF) in Phantoms B (Figure 3B). As the bottom layer thickness in Phantoms A is significantly larger compared to Phantoms B, our observation is in line with previous studies which demonstrate a dramatic decrease in signal strength with bottom layer thickness [34]. It needs to be noted that although Phantoms B consist in reality three-layer systems and the laser beam dimensions are considerable compared to the PF layer thickness, the respective top and bottom signal contributions (Figure 3B(i)) exhibit a similar trend as previously observed in 2-layer samples studies [34].
The offset measurements in Phantoms type B were assessed in terms of: (a) the ratio of signal from the bottom layer (PF) to the signal from the top layer (gelatin) (SORS ratio) and (b) the normalized bottom layer SNR (Figure 3B(ii)).
Although Phantoms B are not typical 2-layer phantoms, the SORS ratio can also be applied to them through the definition of the normalized ratio of signal from the intermediate (PF) layer to the signal from the top (gelatin) layer [34]. Raman signal variation with spatial offset was studied in three distinct layer samples before, showing that the SORS ratio varies in a nonlinear fashion for the intermediate/top layer [34]. However, in our case the top and bottom layers exhibit identical chemical signature as the intermediate (PF) layer is essentially embedded in a gelatin matrix. For that reason, we would expect the gelatin Raman signal to be a combination of top and bottom layer contribution. Nevertheless, the total matrix signal is still diminishing faster compared to the intermediate (PF) layer signal up to a certain offset (7 mm) where the SORS ratio reaches a plateau and gelatin contribution overtakes (Figure 3B(ii)). Therefore the SORS ratio generally increases with offset, resembling the trend that has been demonstrated experimentally and through numerical simulations in 2-layer systems of similar optical properties [34].
For Phantoms A, the calculation of the SORS ratio would entail no physical meaning as the PF layer (representing the lesion) is located at the top of the gelatin matrix. The normalized SNR was instead calculated for different offsets (Figure 3A(ii)). The resulting plot indicates the signal generated at minimum offset (0.5 mm) measurement as the most efficient one. This is expected as the PF layer is placed at the top of the phantom and therefore the majority of Raman scattered photons generated at the surface would back-scatter towards the collection probe. Due to the defocused nature of the laser beam and the comparable PF thickness to the beam size, the optimum offset in our case was not zero. This is in line with previous studies also describing a modified SORS configuration, but for a different clinical application [35].
For Phantoms B, the SNR decreases with increasing offset whereas SORS ratio increases (Figure 3B(ii)). Although the SORS ratio is an initial indicator for assessing the optimum offset, the determination of the optimum offset was generally shown to be more accurate by SNR assessment [36]. Our results are not unusual and are in agreement with previous studies employing a defocused beam to probe an intermediate layer of interest in between two identical layers [35]. Similarly to Phantoms A, the offset leading to optimum measurements in Phantoms B is also shown to be between 0–0.5 mm. This indicates that in both Phantom types the PF layer is adequately included within the sampling volume when probed with the defocused laser beam in a depth of 0–3 mm. That includes the depth of the most superficial cancer such as BCC which is located between 40 and 300 μm from the surface, depending on the anatomical area [37].

3.2. Human Skin Tissue

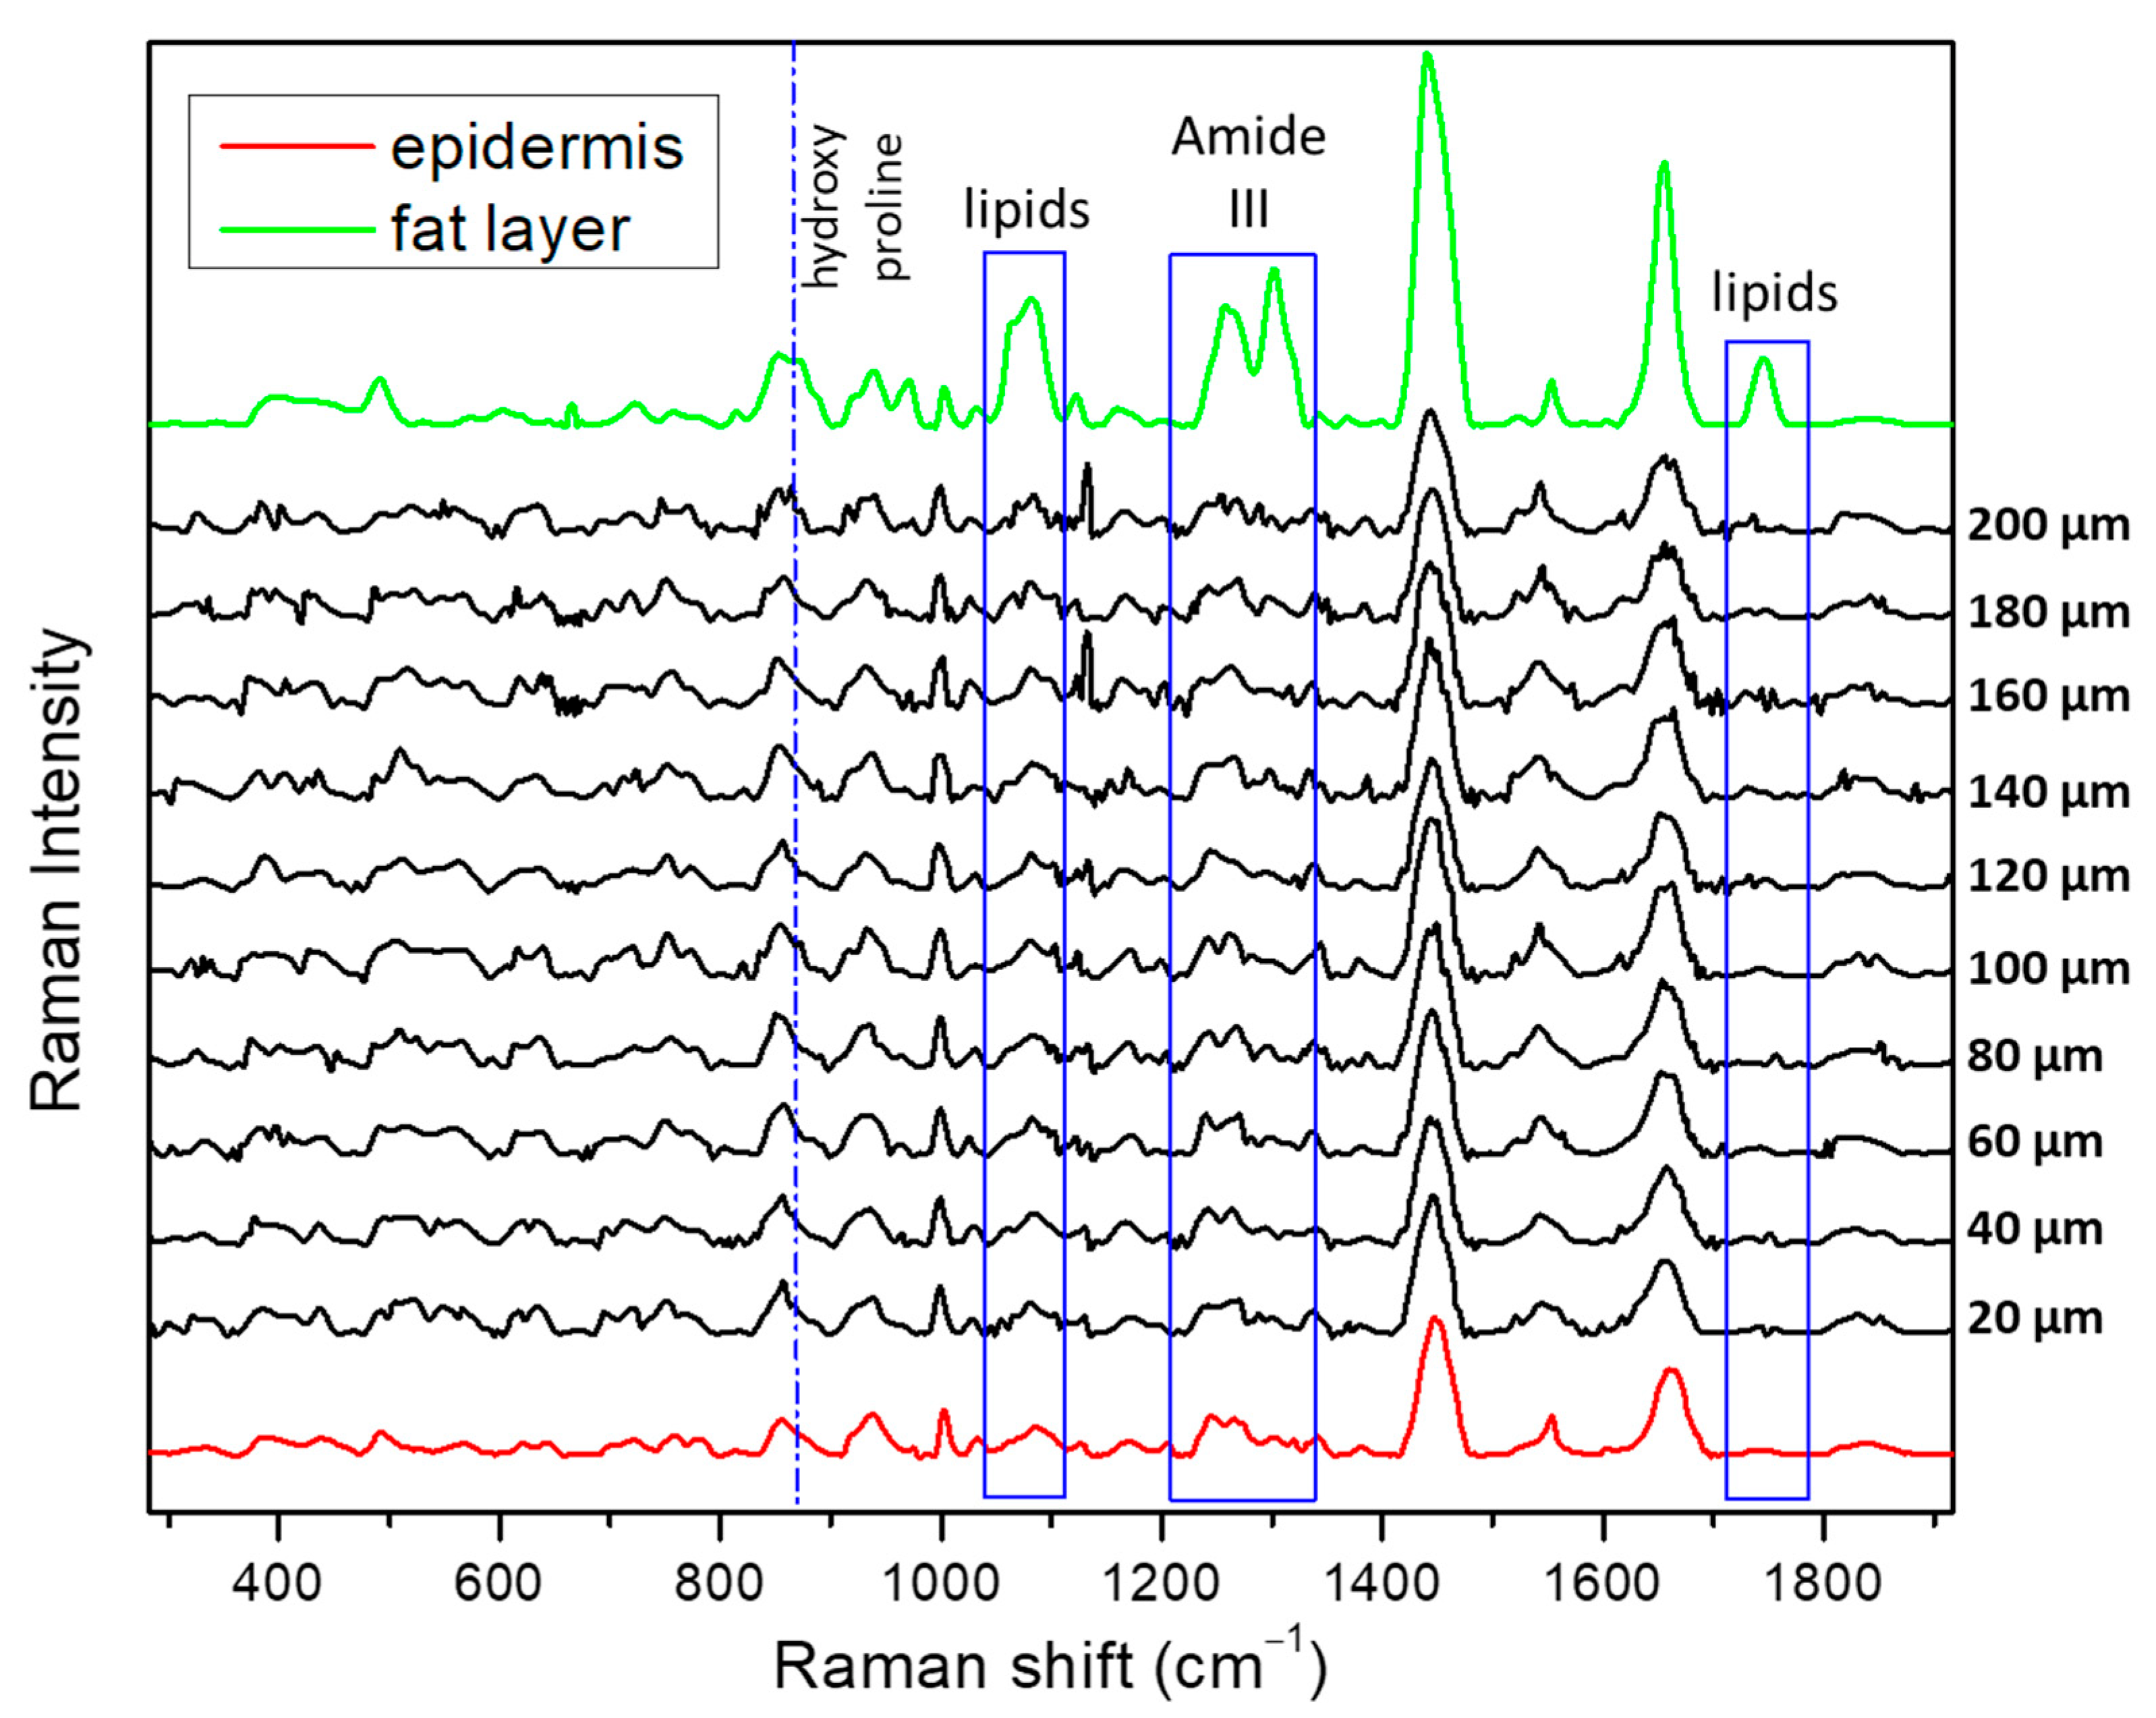
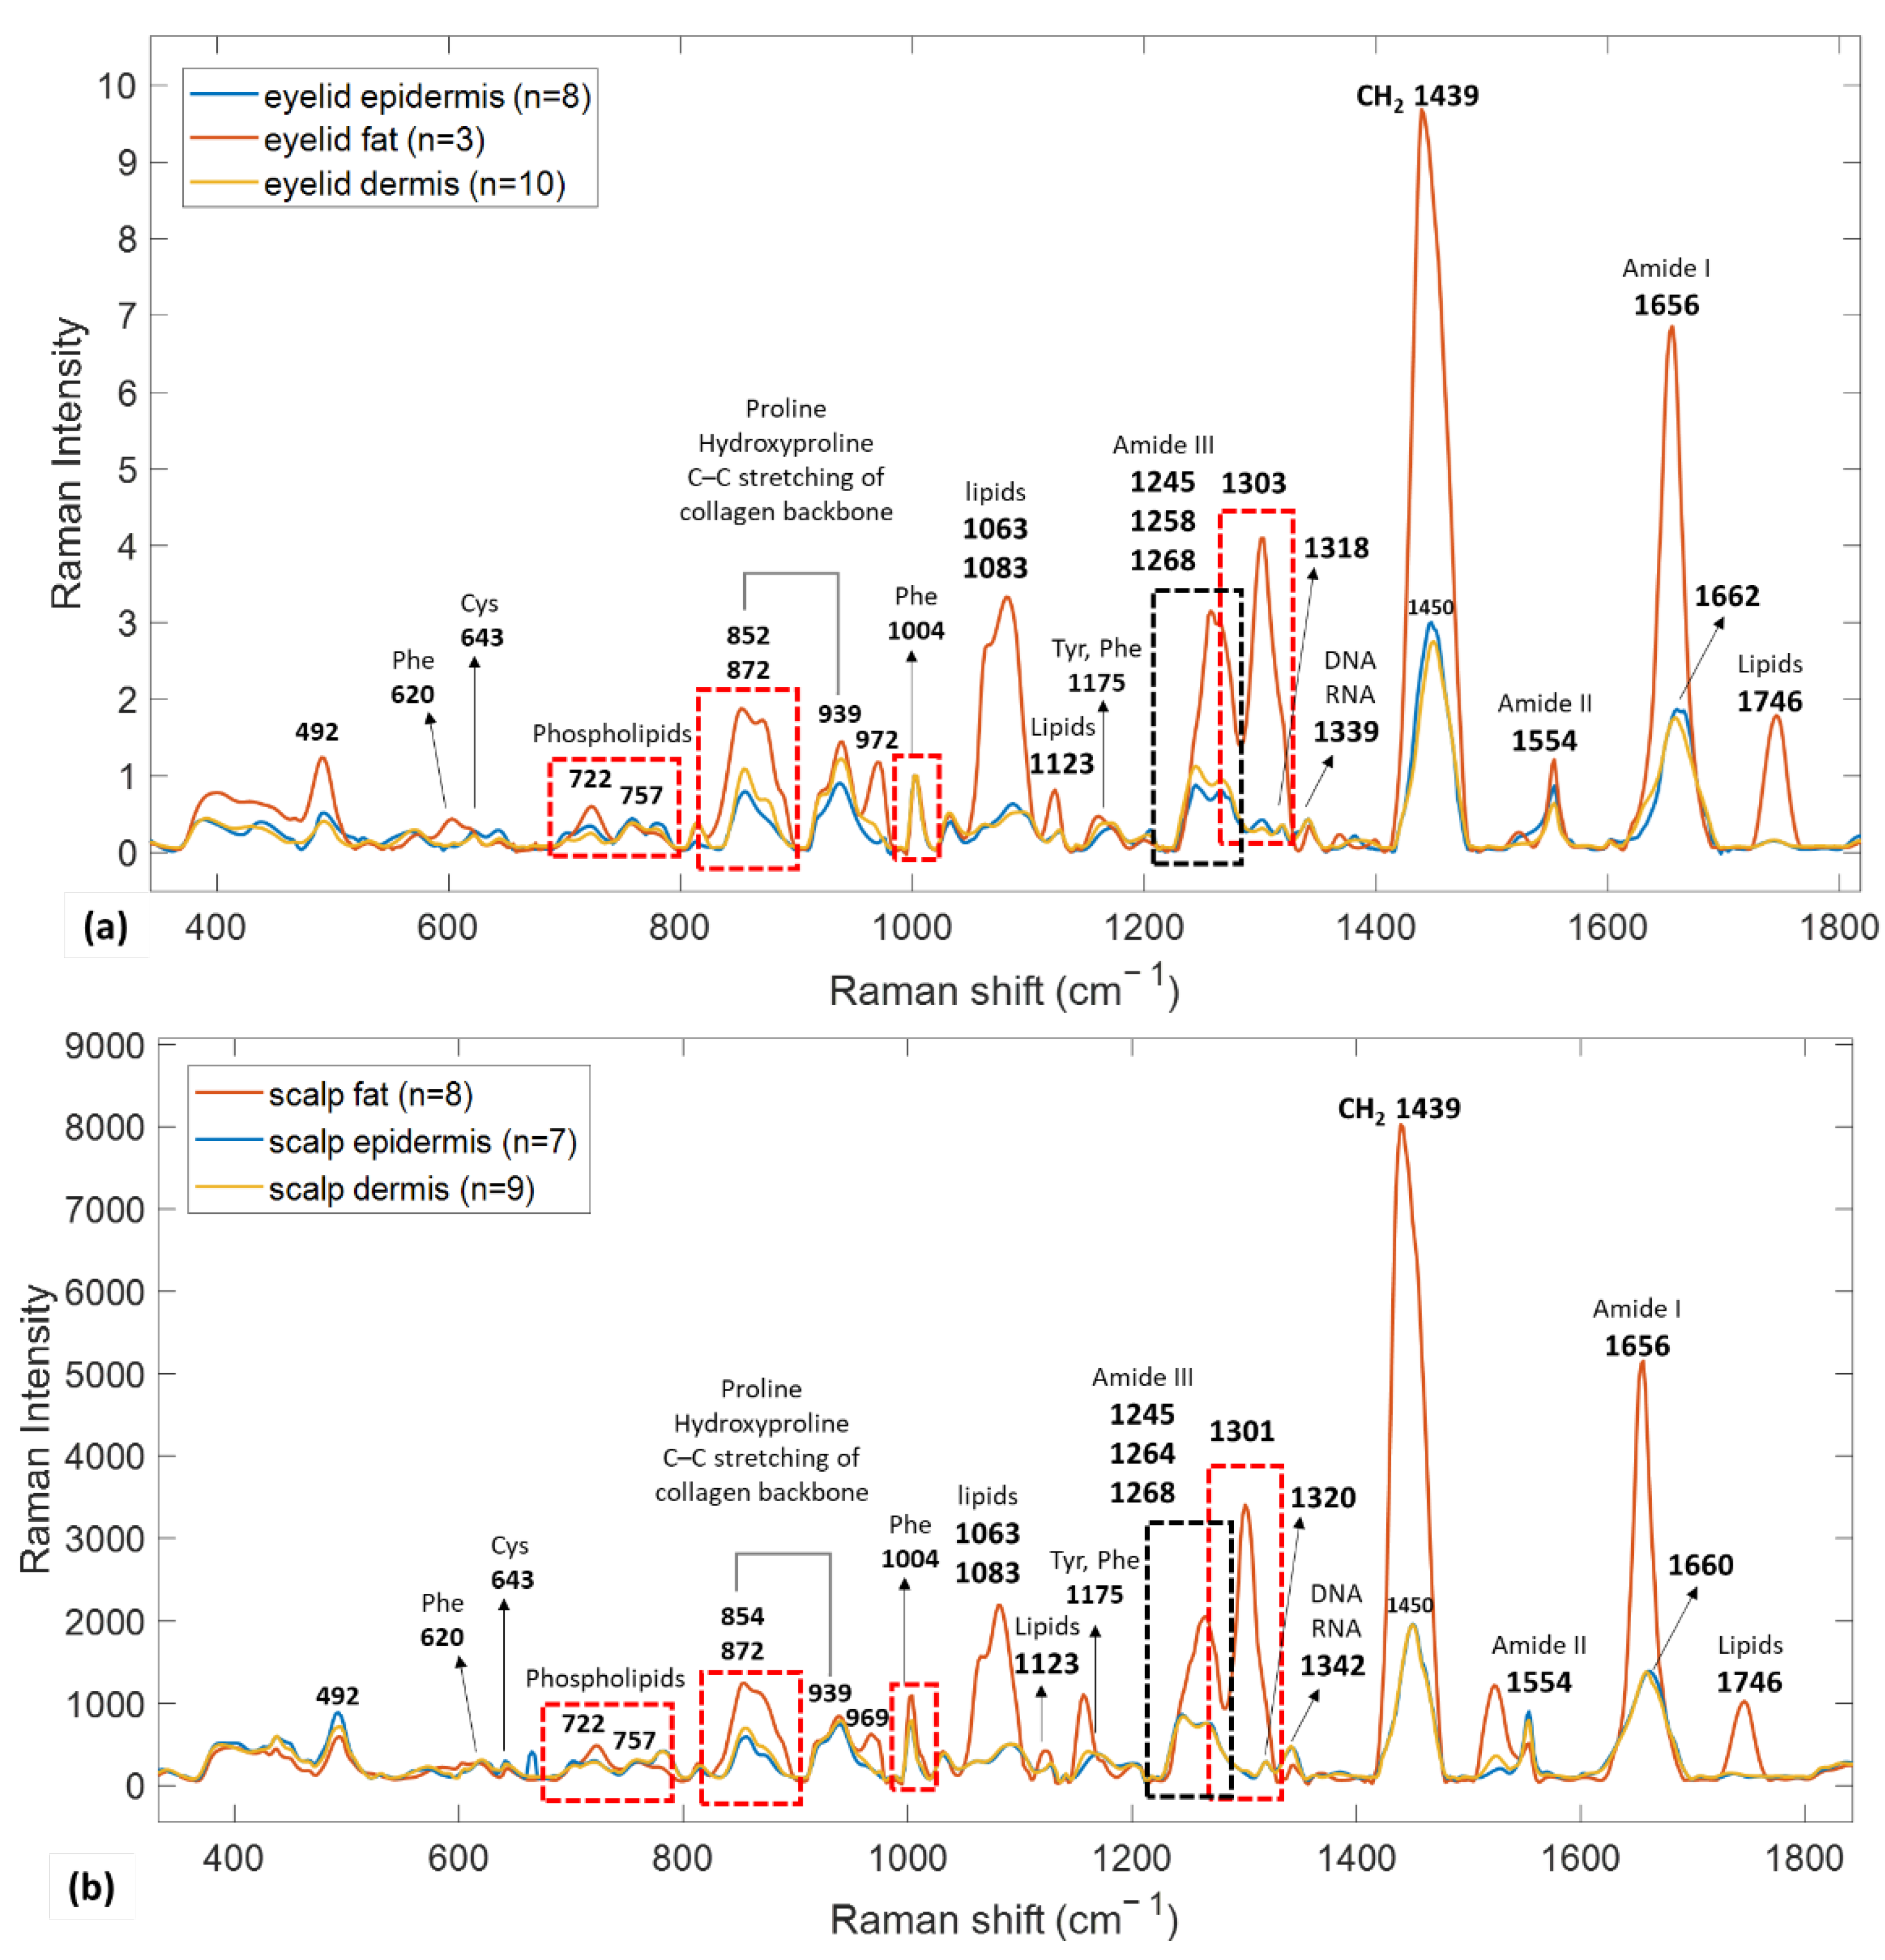
3.2.1. Reference Spectra

Contrary to the simple two-layer system used in phantom measurements, skin tissue comprises of several heterogeneous layers which lack distinct biochemical Raman signals. This was observed in literature before [38], but also shown in our reference spectra acquired from dissected tissues using confocal Raman spectroscopy (Figure 4). As shown in Figure 4, rather than exhibiting unique Raman features, the three main skin layers (epidermis, dermis and subcutaneous tissue) inherently share common bands but in different ratios.
In Figure 4 we observe that Raman bands of epidermis and dermis exhibit a great degree of similarity. Given the age of the donors in this study (70 and 62 years old), this observation is in agreement with previous studies [39] where the two skin layers in older donors show very few spectral differences. The main spectral features present in the layers of epidermis and dermis are Raman bands at 852, 872 and 939 cm−1 assigned to the amino acid side chain vibrations of proline and hydroxyproline (collagen type I) as well as to a C-C stretching vibration of the collagen backbone [40]. As collagen is the main constituent of the human dermis layer (70% of the dry weight and 90% of the total protein content) [41], we notice that those spectral features are more prominent there compared to the epidermis layer, which is in line with the literature [40]. Other bands observed are the ones associated with vibrations of amide bonds in polypeptide chains: Amide I at 1656–1668 cm−1 (predominantly C=O stretching), amide II at 1554 cm−1 (ν(C-N) and δ(Ν-H)) and amide III at 1242–1268 cm−1 (C-N stretching and N-H bending vibrations) [39]. Amide I and III consist of underlying bands whose strength is related to the secondary structure of the proteins. In those bands, maximums at 1242 and 1656 cm−1, respectively, reveal the predominance of α-helix structure, whereas maximums at 1268 and 1668 cm−1 are related to an unordered β-sheet structure [42,43]. Although previous studies agree on the predominance of the α-helix conformation in the epidermis [44], our study shows the epidermis to exhibit a slightly shifted to the right amide I band. This may relate to an underlying lipid band at 1671 cm−1 assigned to ceramides in the stratum corneum [45]. Other Raman bands include CH2 deformation (1450 cm−1) assigned to both protein and lipid content and CH in-plane bending and stretching (1031 cm−1 and 1170 cm−1, respectively) assigned to phenylalanine [40,43]. Both of those bands are similar in morphology and height between dermis and epidermis. A closer look at the lower wavelength area, reveals vibrations of phenylalanine (620 cm−1) and cysteine (642 cm−1), with the latter to be stronger in the case of epidermis as cysteine is a major amino acid of keratin fibers [46]. This is also confirmed by the stronger epidermis band at around 700 cm−1 where a C-S cysteine vibration also manifests [43].
An additional difference observed in the layer of epidermis compared to dermis is Raman bands corresponding to traces of lipids in the stratum corneum (the uppermost epidermis layer). These are located at 1083 and 1303 cm−1 and are very weak compared to those present at the transcutaneous fat layer which predominantly consists of lipids. Phospholipids found at 721 and 757 cm−1 follow the same trend, reflecting a higher content in epidermis compared to the dermis layer.
Contrary to epidermis and dermis, transcutaneous fat exhibits a distinct Raman signal with spectral ratios significantly different from the rest of the skin. The fat layer mainly consists of lipids in the form of triacylglycerol (TAG), a glycerol esterified with three fatty acids. We therefore expect to see an abundance of lipid components in the Raman spectrum of transcutaneous fat. Indeed, strong Raman bands can be found at 1063, 1083 and 1123 cm−1 and are assigned to the C-C bending modes of the lipid skeleton. The Raman band at 1083 cm−1 specifically indicates an organized conformation of the lipid components [43] in transcutaneous tissue, whereas the one at 1746 cm−1 is characteristic to the fat tissue and does not overlap with any of the epidermis and dermis peaks. The latter band is assigned to the C=O stretching mode of the ester groups in the glycerol heads of TAG. Last, the vibration at 972 cm−1 is attributed to the =C-H bending mode in unsaturated fatty chains whereas the amide I band (C=C stretching) is clearly shifted to the left (1655 cm−1), similarly to what has been observed in animal fat tissue before [47].

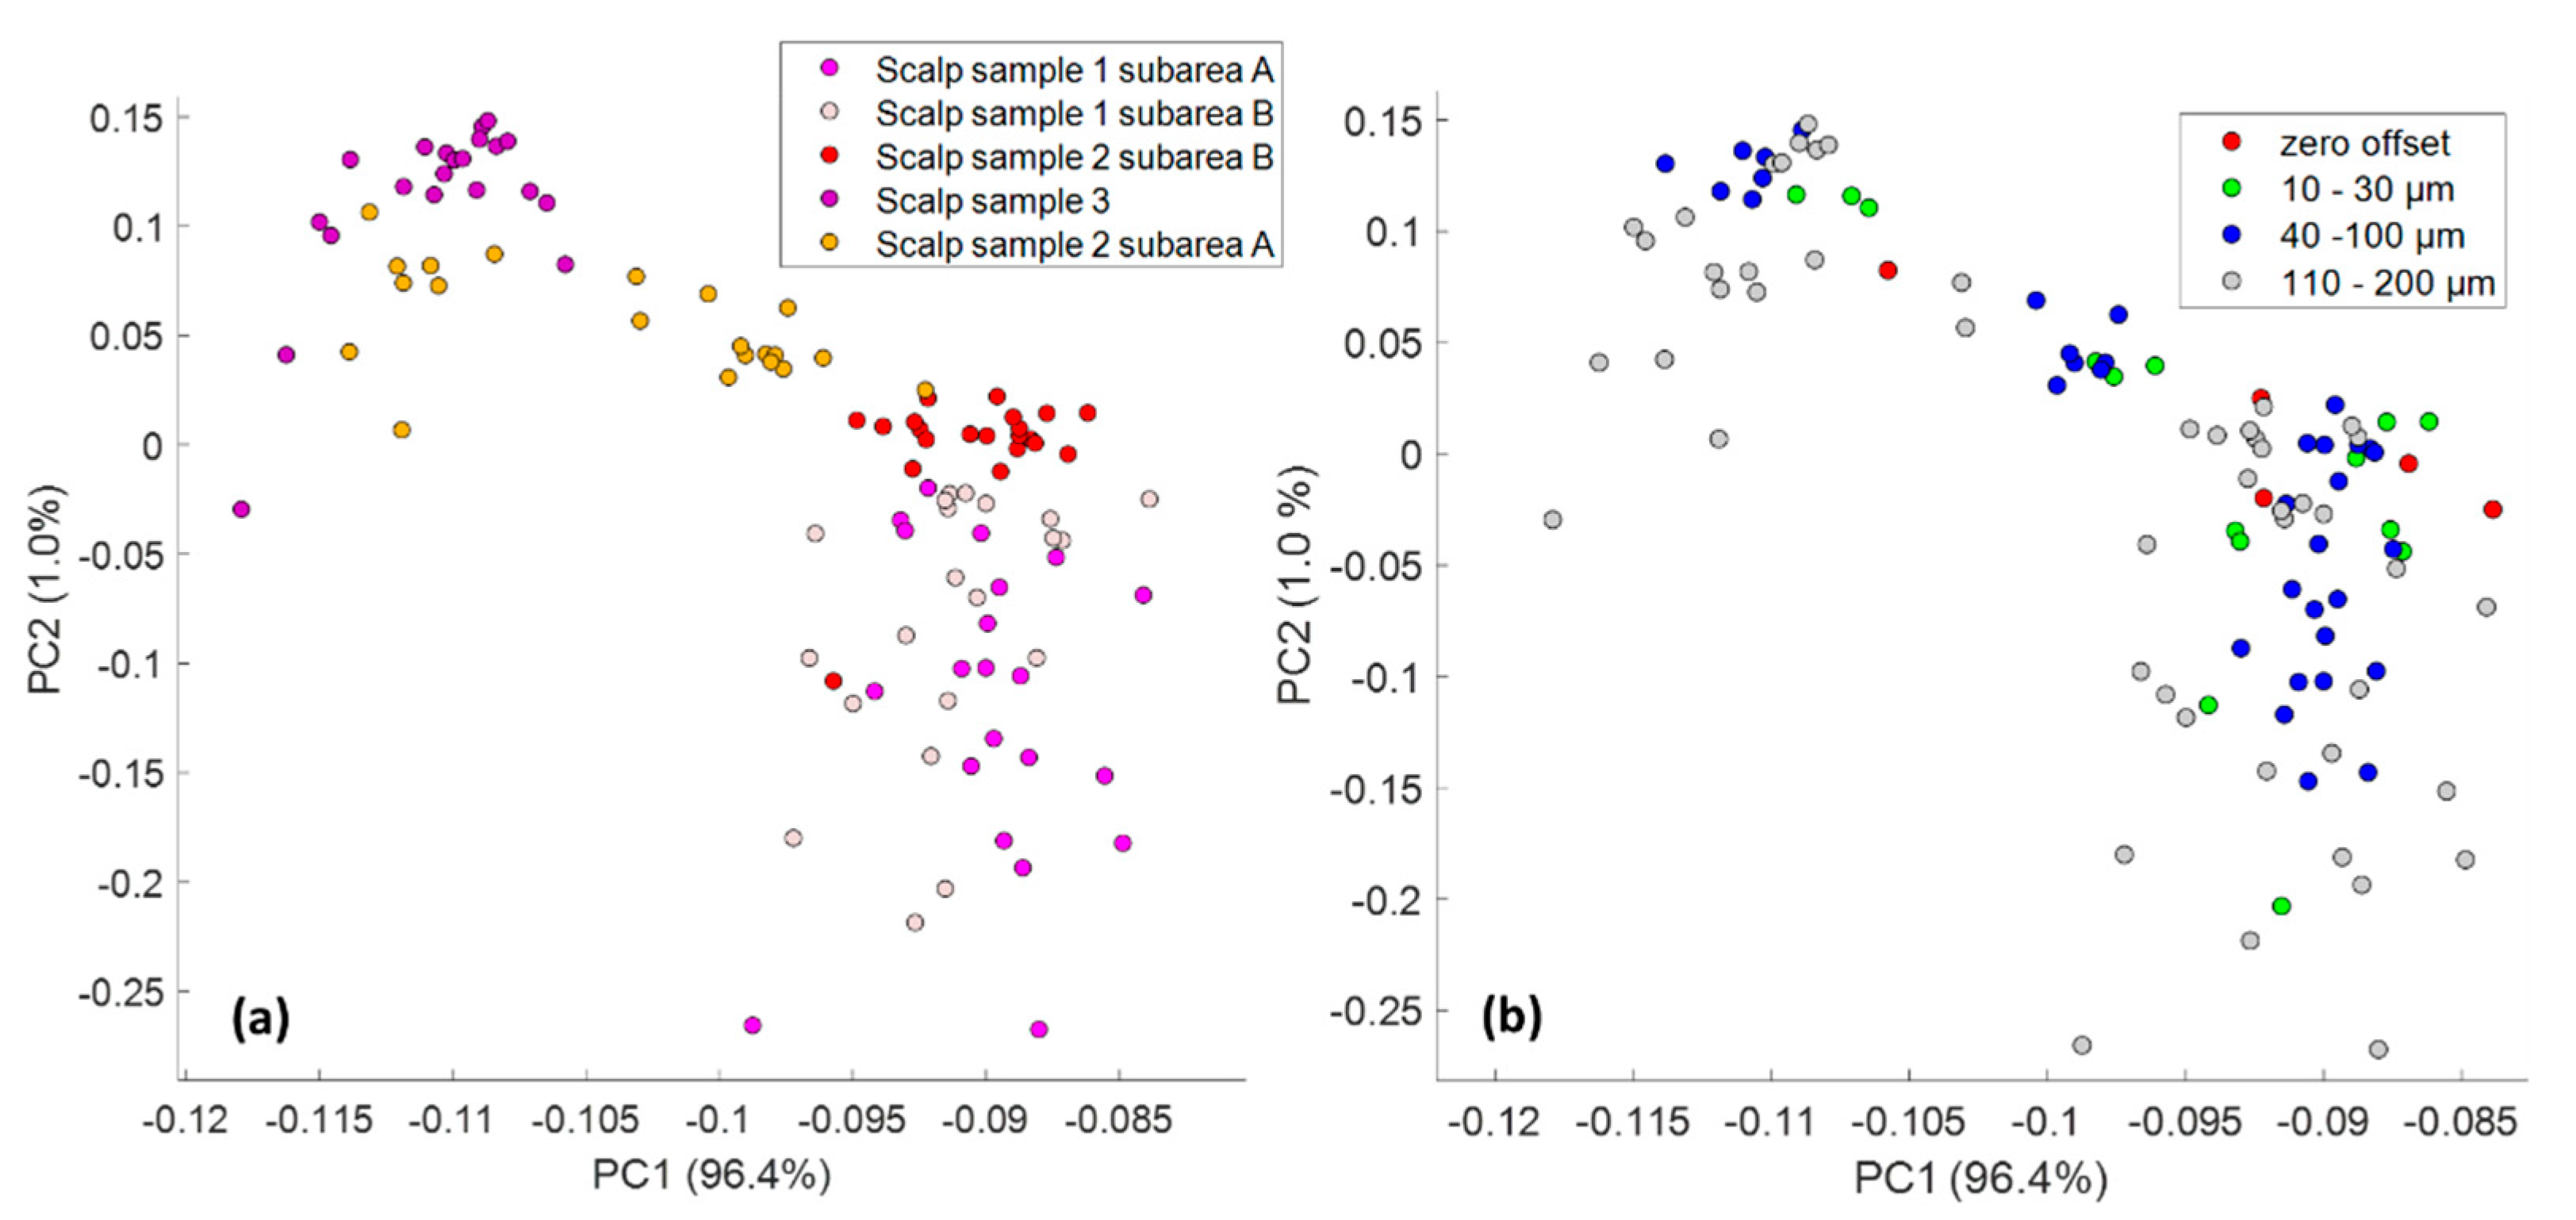
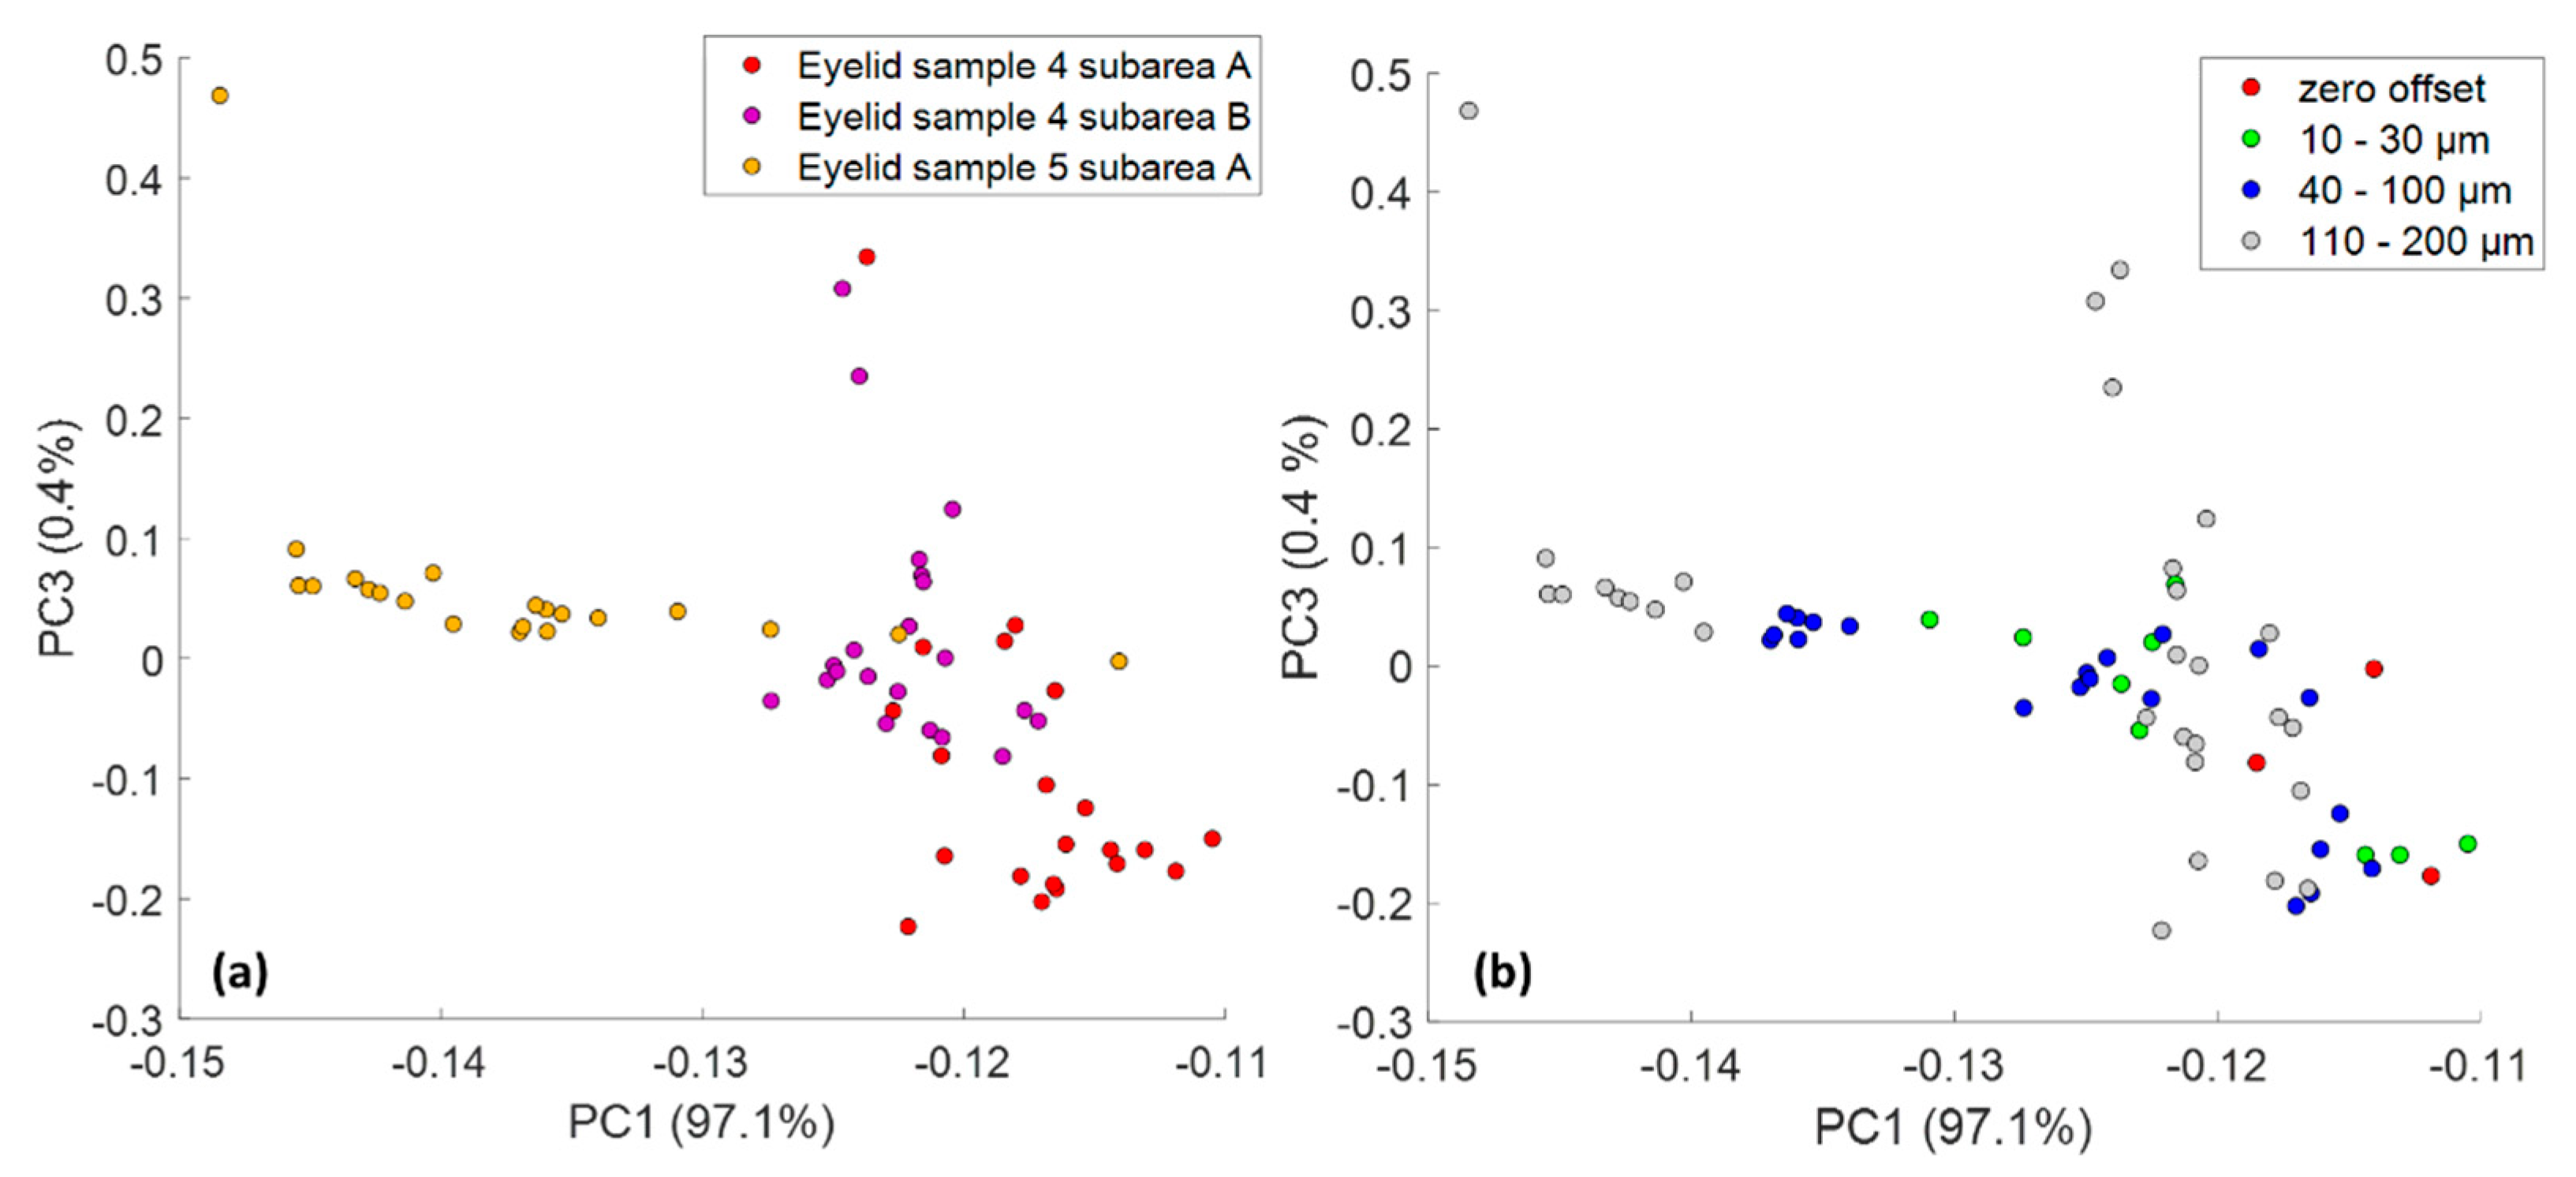
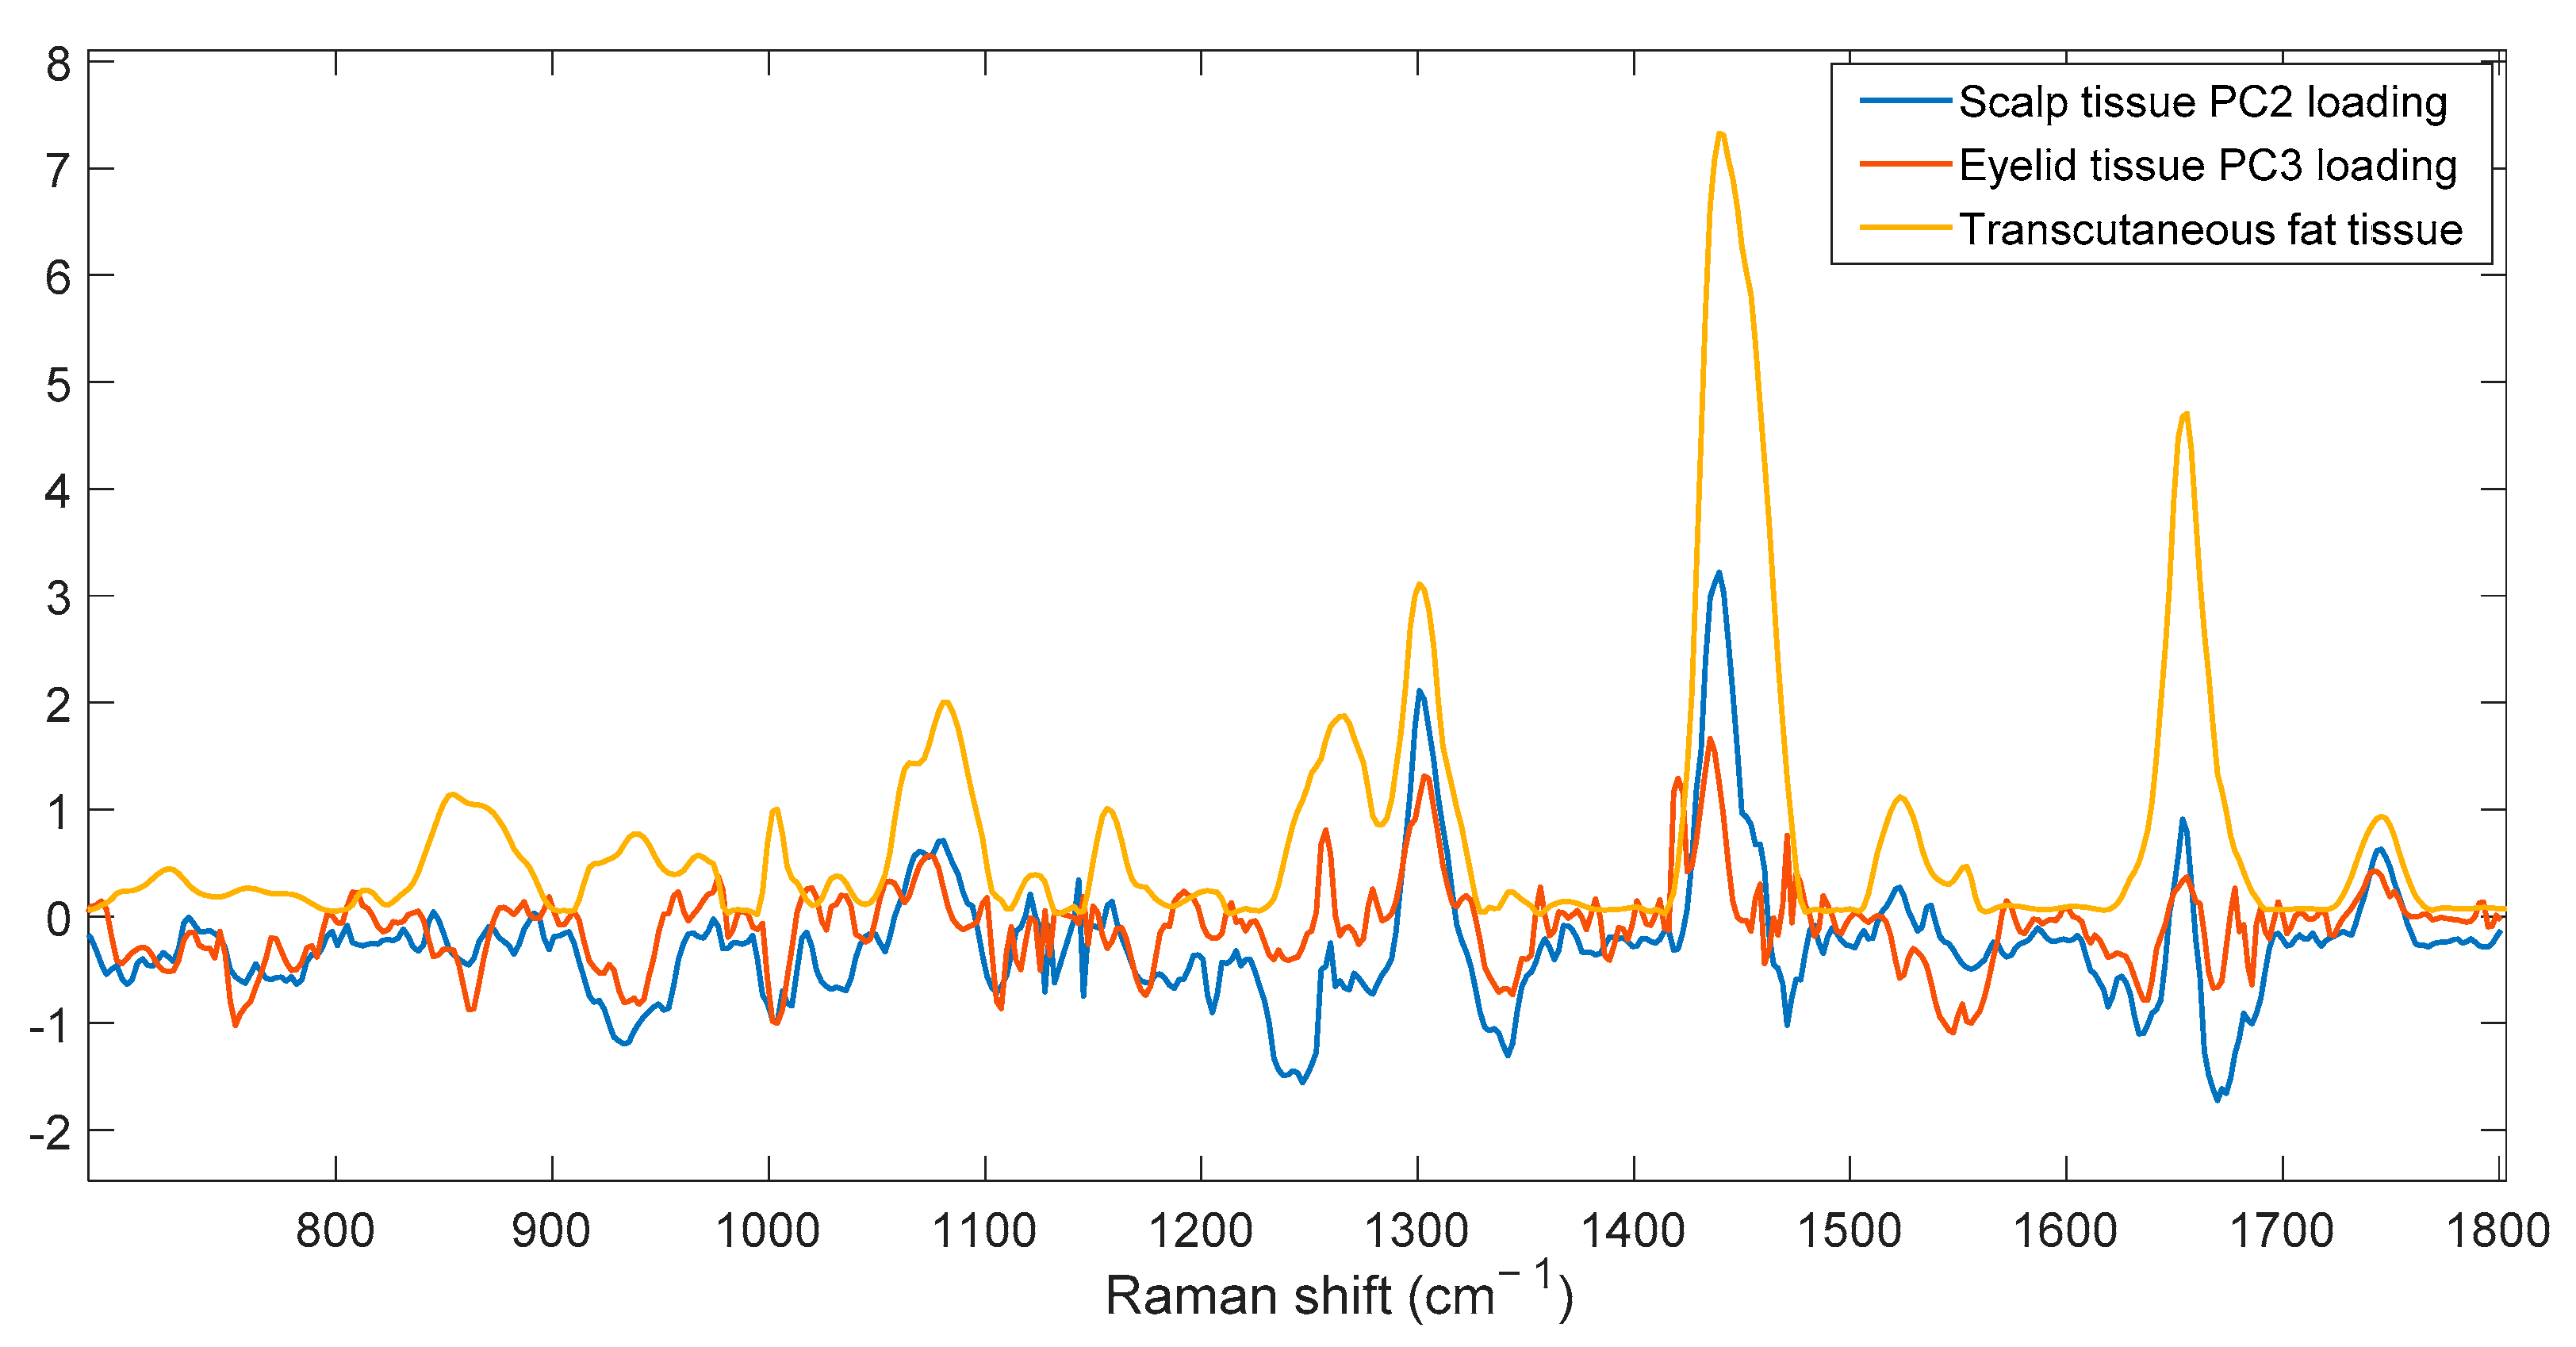
3.2.2. SORS Measurements

The reference spectra acquired from the individual skin layers provided the basis for the analysis of SORS measurements on samples from the scalp (thickest epidermis) and eyelid (thinnest epidermis) prior to dissection. Figure 5 shows the general spectral patterns for a representative healthy eyelid as measurement offset increases. The spatial offset range employed in SORS measurements of human skin was limited between 0–2 mm, as values close to zero were shown to exhibit the highest SNR in tissue phantoms of similar optical properties and geometry.
In Figure 5 we can see that as the offset increases the spectra gain features of the subcutaneous fat. Although it is difficult to discern changing trends in the transition from dermis to epidermis, we notice that collagen spectral features such as the most obvious 872 cm−1 band (hydroxyproline), start showing up at around 100 μm spatial offset which corresponds to less than 100 μm of probing depth, as suggested by previous studies [48]. This is in line with the dermis depth in the human eyelid where the thinnest epidermis (0.05 mm thickness) on the body can be found. Another characteristic band which is more dominant in spectra up to 100 μm is the vibration at 1242 cm−1, corresponding to the α-helix secondary structure of keratin. This band starts diminishing after 120 μm of offset and is eventually replaced by the 1258 cm−1 lipid band in fat tissue. Raman spectra recorded with a spatial offset larger than 160–180 μm show increasing evidence of subcutaneous fat signal contribution with vibrations at 972, 1063, 1083, 1123 and 1746 cm−1, which are characteristic to lipids vibration modes (Table S1) and become more prominent with increasing sampling depth
Due to a lack of distinct and unique biochemical signals from each skin layer, we were unable to employ SORS and SNR ratios to assess the individual layer signal contribution in human samples. Yet, the highly similar Raman spectra in Figure 5 suggest that in the case of a skin lesion within that depth range, a non-interfering unambiguous set of Raman signals will arise in a similar way to the phantoms study.
To evaluate the spectral features recorded in the measuring volume with increasing offset we used the Principal Component Analysis (PCA) method as an unsupervised classification approach. PCA was run on human skin tissue data originating from scalp (Figure 6) and eyelid (Figure 7) separately, to rule out dependence on epidermis thickness.
In the PCA scatter plot of scalp samples (Figure 6a), Sample 3 and 2A consistently separate from the rest across Principal Component 1 (PC 1), whose loading explains 96.4% of the spectral variance. Similarly, Sample 5A separates from the eyelid samples across PC 1 (97.1%) in the PCA scatter plot (Figure 7a). In the case of Sample 3 and 2A, this separation also occurs across PC 2, for which the corresponding loading is positively associated with bands assigned to the fat tissue. Those bands include 1081, 1301, 1437, 1525, 1656 and 1744 cm−1 and are moving in the opposite direction from 1003, 1247 and 1670 cm−1, which are assigned to skin typical bands negatively associated with the loading for PC2 (Figure 8). This is expected for Sample 3 as it is the thickest one (6 mm) from those measured and therefore a thick bottom layer of fat is expected in the measuring volume. In the case of Sample 2A, the strong presence of a fat layer in the collected Raman signal is due to the thin epidermis compared to the total sample volume (Table 1).
To further explore PCA separation, score plots were additionally labelled by offset. In Figure 7a,b we observe that for all samples, except for Sample 3, the zero offset measurements are grouped on the negative values of PC2 (scalp tissue) and PC3 (eyelid tissue) score, indicating a strong association with the negative peaks of the respective loadings. Those peaks are mostly assigned to all skin layers, however some of them are specifically assigned to ceramides of the stratum corneum (1671 cm−1), and the C-S cysteine vibration of dermis and epidermis layer around 700 cm−1. On the contrary, bands that are positively associated with both loadings for PC2 (scalp tissue) and PC3 (eyelid tissue), include 1063, 1083 and 1123 cm−1 assigned to C-C bending modes of the lipid skeleton, as well as 1301, 1437, 1656 and 1744 cm−1. From spectra comparison in Figure 8, it becomes obvious that these are all bands assigned to the transcutaneous fat layer of skin.
Since positive scores result from bands associated with positive loading features, while negative scores result from bands associated with negative loading features [49], we can conclude that increasing offset in measurements is associated with increasing fat contribution in the recorded signal. This is expected as Raman photons from deeper tissue layers (such as the transcutaneous tissue) are being collected with increasing offset.
Our PCA results indicate that for sample thickness up to 3.5 mm and epidermis thickness up to 1 mm (Table 1), the Raman signal from the fat layer is not present in the zero offset recorded measurements in the given conditions of the study. This does not necessarily rule out the presence of fat in the measuring volume, as the measurement sensitivity may be insufficient to allow detection, but it certainly allows for a more accurate data analysis and therefore diagnosis in the absence of additional overlapping signals from the fat, which is not included in the measuring volume of interest (since the melanoma and non-melanoma lesions initiate from the epidermis) [3,50].

4. Discussion

Previous studies suggested that it is feasible to spectrally separate the top layer of epidermis (stratum corneum) from the dermis by means of confocal Raman spectroscopy combined with K-means cluster analysis [40]. In this study we concluded that although some spectral signature (1671 cm−1) from the stratum corneum was evident in our measurements, a discrimination between epidermis and dermis (including all sublayers) was not possible with a defocused Raman system. Furthermore, it was difficult to observe clear spectral changes in the transition from epidermis to dermis. This is due to: (a) the absence of major biochemical differences between the two layers, (b) the low confocality and large sampling volume of the employed setup and (c) the weak signal-to-noise ratio when probing deeper layers.
Although the insufficient spatial resolution of our system did not allow for specifically probing the most lipid-rich and therefore spectrally-distinct sublayer of stratum corneum, such a possibility would not provide any advantage over a potential cancer diagnosis since not all malignant lesions develop superficially. Through our investigation of spatially offset measurements, we concluded that a defocused Raman system configured in a zero offset mode is able to capture biochemical information from deeper skin layers and specifically between the skin surface and the epidermis-dermis junction, where the lesions mainly develop and therefore the sampling volume for future cancer screening would lay.
Our results are not conclusive, as human skin is subjected to great variability (such as age and race) [51], affecting the recorded Raman signal. However, they provide a strong indication of the benefits of a defocused Raman system applied to a potential in vivo skin cancer screening. In any case, a defocused Raman modality would allow for the employment of higher laser power for in vivo skin measurements within the suggested ANSI MPE limits (0.06–0.1 mW/cm2) (ANSI Z136.1-2014 American National Standard for the Safe Use of Lasers) Additionally, the relatively large sampling volume (compared to a confocal measurement) of defocused Raman spectroscopy can reduce the number and time of measurements required and render the implementation of the technique into clinics faster and simpler.
There are currently a number of studies focusing on the diagnostic potential of skin cancer using either a multimodal [18] or fiber optic Raman probes [17]. A few of those have been reported to reach a depth of up to 200 μm [16], considering the fact that non-melanoma skin cancers invade the lower dermis layers of the skin. Although our study does not include any malignant samples, it clearly shows that a SORS approach would be able to adequately sample the biochemical profile of deeper skin layers similarly to measurements demonstrated on healthy samples. The novelty of our work is that the SORS modality is not just able to look deeper inside the skin tissue but most importantly to collect Raman photons with a bias towards inner skin layers. In that respect, this study employs deep Raman spectroscopy to assess the deep layer biochemical profile of skin, paving the way for non-invasive skin cancer screening.

Supplementary Materials

The following are available online at https://www.mdpi.com/article/10.3390/app11209498/s1, Table S1: Raman band assignments of healthy eyelid and scalp human skin layers.

Author Contributions

Conceptualization, M.Z.V., K.S., G.G., I.D.B. and N.K.; methodology, M.Z.V. and N.K.; validation, M.Z.V., K.S. and N.K.; formal analysis, M.Z.V. and N.K.; investigation, M.Z.V., K.S. and N.K.; data curation, M.Z.V. and N.K.; writing—original draft preparation, M.Z.V.; writing—review and editing, M.Z.V., K.S., G.G., I.D.B. and N.K.; supervision, N.K.; project administration, M.Z.V. and N.K.; funding acquisition, M.Z.V. and N.K. All authors have read and agreed to the published version of the manuscript.

Funding

This research is co-financed by Greece and the European Union (European Social Fund- ESF) through the Operational Programme “Human Resources Development, Education and Lifelong Learning” in the context of the project “Reinforcement of Postdoctoral Researchers-2nd Cycle” (MIS-5033021), implemented by the State Scholarships Foundation (IKΥ).

Institutional Review Board Statement

The study was conducted according to the guidelines of the Declaration of Helsinki and approved by the Institutional Ethical Review Committee of the University Hospital of Ioannina which confirmed the proposed protocol and the anonymity of the donors (reference number: 8(17)/14.04.2021).

Informed Consent Statement

Informed consent was obtained from all patients involved in the study.

Data Availability Statement

Not applicable.

Acknowledgments

We thank the International Atomic Energy Agency (ΙAΕA) for the financial support to build the Raman setup.

Conflicts of Interest

The authors declare no conflict of interest. The funders had no role in the design of the study; in the collection, analyses, or interpretation of data; in the writing of the manuscript, or in the decision to publish the results.

References

  1. Leiter, U.; Keim, U.; Garbe, C. Epidemiology of Skin Cancer: Update 2019. Adv. Exp. Med. Biol. 2020, 1268, 123–139. [Google Scholar] [CrossRef]
  2. Seretis, K.; Thomaidis, V.; Karpouzis, A.; Tamiolakis, D.; Tsamis, I. Epidemiology of surgical treatment of nonmelanoma skin cancer of the head and neck in Greece. Derm. Surg. 2010, 36, 15–22. [Google Scholar] [CrossRef]
  3. Zaidi, M.R.; Fisher, D.E.; Rizos, H. Biology of melanocytes and primary melanoma. In Cutaneous Melanoma; Springer: Cham, Switzerland, 2020; pp. 3–40. [Google Scholar]
  4. English, D.R.; Del Mar, C.; Burton, R.C. Factors influencing the number needed to excise: Excision rates of pigmented lesions by general practitioners. Med. J. Aust. 2004, 180, 16–19. [Google Scholar] [CrossRef]
  5. Rangan, S.; Schulze, H.G.; Vardaki, M.Z.; Blades, M.W.; Piret, J.M.; Turner, R.F.B. Applications of Raman spectroscopy in the development of cell therapies: State of the art and future perspectives. Analyst 2020, 145, 2070–2105. [Google Scholar] [CrossRef]
  6. Petrokilidou, C.; Gaitanis, G.; Bassukas, I.D.; Velegraki, A.; Guevara, E.; Vardaki, M.Z.; Kourkoumelis, N. Emerging Optical Techniques for the Diagnosis of Onychomycosis. Appl. Sci. 2020, 10, 2340. [Google Scholar] [CrossRef] [Green Version]
  7. Philipsen, P.A.; Knudsen, L.; Gniadecka, M.; Ravnbak, M.H.; Wulf, H.C. Diagnosis of malignant melanoma and basal cell carcinoma by in vivo NIR-FT Raman spectroscopy is independent of skin pigmentation. Photochem. Photobiol. Sci. 2013, 12, 770–776. [Google Scholar] [CrossRef] [PubMed]
  8. Nguyen, H.T.M.; Zhang, Y.; Moy, A.J.; Feng, X.; Sebastian, K.R.; Reichenberg, J.S.; Fox, M.C.; Markey, M.K.; Tunnell, J.W. Characterization of Ex Vivo Nonmelanoma Skin Tissue Using Raman Spectroscopy. Photonics 2021, 8, 282. [Google Scholar] [CrossRef]
  9. Kourkoumelis, N.; Balatsoukas, I.; Moulia, V.; Elka, A.; Gaitanis, G.; Bassukas, I.D. Advances in the in Vivo Raman Spectroscopy of Malignant Skin Tumors Using Portable Instrumentation. Int. J. Mol. Sci. 2015, 16, 14554–14570. [Google Scholar] [CrossRef] [PubMed] [Green Version]
  10. Santos, I.P.; van Doorn, R.; Caspers, P.J.; Bakker Schut, T.C.; Barroso, E.M.; Nijsten, T.E.C.; Noordhoek Hegt, V.; Koljenovic, S.; Puppels, G.J. Improving clinical diagnosis of early-stage cutaneous melanoma based on Raman spectroscopy. Br. J. Cancer 2018, 119, 1339–1346. [Google Scholar] [CrossRef] [PubMed] [Green Version]
  11. Mosca, S.; Conti, C.; Stone, N.; Matousek, P. Spatially offset Raman spectroscopy. Nat. Rev. Methods Primers 2021, 1, 22. [Google Scholar] [CrossRef]
  12. Vardaki, M.Z.; Gardner, B.; Stone, N.; Matousek, P. Studying the distribution of deep Raman spectroscopy signals using liquid tissue phantoms with varying optical properties. Analyst 2015, 140, 5112–5119. [Google Scholar] [CrossRef] [Green Version]
  13. Buckley, K.; Kerns, J.; Gikas, P.D.; Birch, H.; Vinton, J.; Keen, R.; Parker, A.W.; Matousek, P.; Goodship, A. Measurement of abnormal bone composition in vivo using noninvasive Raman spectroscopy. IBMS BoneKEy 2014, 11, 72178. [Google Scholar] [CrossRef]
  14. Lundsgaard-Nielsen, S.M.; Pors, A.; Banke, S.O.; Henriksen, J.E.; Hepp, D.K.; Weber, A. Critical-depth Raman spectroscopy enables home-use non-invasive glucose monitoring. PLoS ONE 2018, 13, e0197134. [Google Scholar] [CrossRef] [Green Version]
  15. Afseth, N.K.; Bloomfield, M.; Wold, J.P.; Matousek, P. A novel approach for subsurface through-skin analysis of salmon using spatially offset Raman spectroscopy (SORS). Appl. Spectrosc. 2014, 68, 255–262. [Google Scholar] [CrossRef]
  16. Pence, I.J.; O’Brien, C.M.; Masson, L.E.; Mahadevan-Jansen, A. Application driven assessment of probe designs for Raman spectroscopy. Biomed. Opt. Express 2021, 12, 852–871. [Google Scholar] [CrossRef]
  17. Schleusener, J.; Gluszczynska, P.; Reble, C.; Gersonde, I.; Helfmann, J.; Fluhr, J.W.; Lademann, J.; Rowert-Huber, J.; Patzelt, A.; Meinke, M.C. In vivo study for the discrimination of cancerous and normal skin using fibre probe-based Raman spectroscopy. Exp. Derm. 2015, 24, 767–772. [Google Scholar] [CrossRef]
  18. Lim, L.; Nichols, B.; Migden, M.R.; Rajaram, N.; Reichenberg, J.S.; Markey, M.K.; Ross, M.I.; Tunnell, J.W. Clinical study of noninvasive in vivo melanoma and nonmelanoma skin cancers using multimodal spectral diagnosis. J. Biomed. Opt. 2014, 19, 117003. [Google Scholar] [CrossRef] [PubMed]
  19. Stone, N.; Baker, R.; Rogers, K.; Parker, A.W.; Matousek, P. Subsurface probing of calcifications with spatially offset Raman spectroscopy (SORS): Future possibilities for the diagnosis of breast cancer. Analyst 2007, 132, 899–905. [Google Scholar] [CrossRef] [PubMed]
  20. Vardaki, M.Z.; Kourkoumelis, N. Tissue Phantoms for Biomedical Applications in Raman Spectroscopy: A Review. Biomed. Eng. Comput. Biol. 2020, 11. [Google Scholar] [CrossRef] [PubMed]
  21. Lai, P.X.; Xu, X.; Wang, L.H.V. Dependence of optical scattering from Intralipid in gelatin-gel based tissue-mimicking phantoms on mixing temperature and time. J. Biomed. Opt. 2014, 19, 035002. [Google Scholar] [CrossRef] [PubMed] [Green Version]
  22. Kim, C.; Garcia-Uribe, A.; Kothapalli, S.R.; Wang, L.H.V. Optical phantoms for ultrasound-modulated optical tomography. In Proceedings of the Design and Performance Validation of Phantoms Used in Conjunction with Optical Measurements of Tissue, San Jose, CA, USA, 19–24 January 2008; p. 6870. [Google Scholar] [CrossRef]
  23. Vardaki, M.Z.; Matousek, P.; Stone, N. Characterisation of signal enhancements achieved when utilizing a photon diode in deep Raman spectroscopy of tissue. Biomed. Opt. Express 2016, 7, 2130–2141. [Google Scholar] [CrossRef]
  24. Salomatina, E.; Jiang, B.; Novak, J.; Yaroslavsky, A.N. Optical properties of normal and cancerous human skin in the visible and near-infrared spectral range. J. Biomed. Opt. 2006, 11, 064026. [Google Scholar] [CrossRef]
  25. Lister, T.; Wright, P.A.; Chappell, P.H. Optical properties of human skin. J. Biomed. Opt. 2012, 17, 090901. [Google Scholar] [CrossRef]
  26. Jacques, S.L. Optical properties of biological tissues: A review. Phys. Med. Biol. 2013, 58, R37–R61. [Google Scholar] [CrossRef]
  27. Meglinski, I.V.; Matcher, S.J. Quantitative assessment of skin layers absorption and skin reflectance spectra simulation in the visible and near-infrared spectral regions. Physiol. Meas. 2002, 23, 741–753. [Google Scholar] [CrossRef] [PubMed]
  28. Bloomfield, M.; Andrews, D.; Loeffen, P.; Tombling, C.; York, T.; Matousek, P. Non-invasive identification of incoming raw pharmaceutical materials using Spatially Offset Raman Spectroscopy. J. Pharm. Biomed. 2013, 76, 65–69. [Google Scholar] [CrossRef] [PubMed]
  29. Nicolson, F.; Andreiuk, B.; Andreou, C.; Hsu, H.T.; Rudder, S.; Kircher, M.F. Non-invasive In Vivo Imaging of Cancer Using Surface-Enhanced Spatially Offset Raman Spectroscopy (SESORS). Theranostics 2019, 9, 5899–5913. [Google Scholar] [CrossRef]
  30. Matousek, P. Inverse spatially offset Raman spectroscopy for deep noninvasive probing of turbid media. Appl. Spectrosc. 2006, 60, 1341–1347. [Google Scholar] [CrossRef] [PubMed]
  31. Schulze, H.G.; Foist, R.B.; Okuda, K.; Ivanov, A.; Turner, R.F.B. A Small-Window Moving Average-Based Fully Automated Baseline Estimation Method for Raman Spectra. Appl. Spectrosc. 2012, 66, 757–764. [Google Scholar] [CrossRef] [PubMed]
  32. Schulze, H.G.; Rangan, S.; Blades, M.W.; Piret, J.M.; Turner, R.F.B. Smoothing Raman Spectra with Contiguous Single-Channel Fitting of Voigt Distributions: An Automated, High-Quality Procedure. Appl. Spectrosc. 2019, 73, 47–58. [Google Scholar] [CrossRef] [PubMed]
  33. Matousek, P.; Clark, I.P.; Draper, E.R.C.; Morris, M.D.; Goodship, A.E.; Everall, N.; Towrie, M.; Finney, W.F.; Parker, A.W. Subsurface probing in diffusely scattering media using spatially offset Raman spectroscopy. Appl. Spectrosc. 2005, 59, 393–400. [Google Scholar] [CrossRef]
  34. Matousek, P.; Morris, M.D.; Everall, N.; Clark, I.P.; Towrie, M.; Draper, E.; Goodship, A.; Parker, A.W. Numerical simulations of subsurface probing in diffusely scattering media using spatially offset Raman spectroscopy. Appl. Spectrosc. 2005, 59, 1485–1492. [Google Scholar] [CrossRef] [PubMed]
  35. Vardaki, M.Z.; Devine, D.V.; Serrano, K.; Simantiris, N.; Blades, M.W.; Piret, J.M.; Turner, R.F.B. Defocused Spatially Offset Raman Spectroscopy in Media of Different Optical Properties for Biomedical Applications Using a Commercial Spatially Offset Raman Spectroscopy Device. Appl. Spectrosc. 2020, 74, 223–232. [Google Scholar] [CrossRef] [PubMed]
  36. Maher, J.R.; Berger, A.J. Determination of ideal offset for spatially offset Raman spectroscopy. Appl. Spectrosc. 2010, 64, 61–65. [Google Scholar] [CrossRef] [PubMed]
  37. Konishi, E.; Yoshizawa, Y. Estimation of Depth of Basal-Cell Layer of Skin for Radiation Protection. Radiat. Prot. Dosim. 1985, 11, 29–33. [Google Scholar]
  38. Silveira, L., Jr.; Silveira, F.L.; Bodanese, B.; Zangaro, R.A.; Pacheco, M.T. Discriminating model for diagnosis of basal cell carcinoma and melanoma in vitro based on the Raman spectra of selected biochemicals. J. Biomed. Opt. 2012, 17, 077003. [Google Scholar] [CrossRef] [PubMed]
  39. Pezzotti, G.; Boffelli, M.; Miyamori, D.; Uemura, T.; Marunaka, Y.; Zhu, W.; Ikegaya, H. Raman spectroscopy of human skin: Looking for a quantitative algorithm to reliably estimate human age. J. Biomed. Opt. 2015, 20, 065008. [Google Scholar] [CrossRef]
  40. Ali, S.M.; Bonnier, F.; Tfayli, A.; Lambkin, H.; Flynn, K.; McDonagh, V.; Healy, C.; Lee, T.C.; Lyng, F.M.; Byrne, H.J. Raman spectroscopic analysis of human skin tissue sections ex-vivo: Evaluation of the effects of tissue processing and dewaxing. J. Biomed. Opt. 2013, 18, 061202. [Google Scholar] [CrossRef] [Green Version]
  41. Caspers, P.J.; Lucassen, G.W.; Wolthuis, R.; Bruining, H.A.; Puppels, G.J. In vitro and in vivo Raman spectroscopy of human skin. Biospectroscopy 1998, 4, S31–S39. [Google Scholar] [CrossRef]
  42. Kuzuhara, A. Analysis of structural change in keratin fibers resulting from chemical treatments using Raman spectroscopy. Biopolymers 2005, 77, 335–344. [Google Scholar] [CrossRef]
  43. Tfayli, A.; Piot, O.; Draux, F.; Pitre, F.; Manfait, M. Molecular characterization of reconstructed skin model by Raman microspectroscopy: Comparison with excised human skin. Biopolymers 2007, 87, 261–274. [Google Scholar] [CrossRef] [PubMed]
  44. Baden, H.P.; Goldsmith, L.A.; Bonar, L. Conformational changes in the α-fibrous protein of epidermis. J. Investig. Dermatol. 1973, 60, 215–218. [Google Scholar] [CrossRef] [PubMed] [Green Version]
  45. Tfaili, S.; Gobinet, C.; Josse, G.; Angiboust, J.F.; Manfait, M.; Piot, O. Confocal Raman microspectroscopy for skin characterization: A comparative study between human skin and pig skin. Analyst 2012, 137, 3673–3682. [Google Scholar] [CrossRef]
  46. Baden, H.P.; Bonar, L.; Katz, E. Fibrous proteins of epidermis. J. Investig. Derm. 1968, 51, 301–307. [Google Scholar] [CrossRef] [Green Version]
  47. Meksiarun, P.; Andriana, B.B.; Matsuyoshi, H.; Sato, H. Non-invasive Quantitative Analysis of Specific Fat Accumulation in Subcutaneous Adipose Tissues using Raman Spectroscopy. Sci. Rep. 2016, 6, 37068. [Google Scholar] [CrossRef] [Green Version]
  48. Mosca, S.; Dey, P.; Salimi, M.; Gardner, B.; Palombo, F.; Stone, N.; Matousek, P. Spatially Offset Raman Spectroscopy-How Deep? Anal. Chem. 2021, 93, 6755–6762. [Google Scholar] [CrossRef]
  49. Beattie, J.R.; Esmonde-White, F.W.L. Exploration of Principal Component Analysis: Deriving Principal Component Analysis Visually Using Spectra. Appl. Spectrosc. 2021, 75, 361–375. [Google Scholar] [CrossRef] [PubMed]
  50. Thieu, K.; Ruiz, M.E.; Owens, D.M. Cells of origin and tumor-initiating cells for nonmelanoma skin cancers. Cancer Lett. 2013, 338, 82–88. [Google Scholar] [CrossRef] [Green Version]
  51. Vargis, E.; Byrd, T.; Logan, Q.; Khabele, D.; Mahadevan-Jansen, A. Sensitivity of Raman spectroscopy to normal patient variability. J. Biomed. Opt. 2011, 16, 117004. [Google Scholar] [CrossRef]
Figure 1. Indicative human skin tissue from (a) scalp (Sample 2) and (b) eyelids (Sample 4). Shaded regions indicate the individual areas measured on each sample. Panel (c) shows Sample 1 after dissection for purposes of reference spectra acquisition. Scale bar shows 0.6 cm.
Applsci 11 09498 g001
Figure 2. Raman setup in a conventional (excitation indicated with red solid line) and a SORS (excitation with red dashed line) configuration. In the SORS configuration, a 785 nm laser was delivered at a 45° angle with regards to the collection path. A translational xyz stage was used to move the collection away from the external excitation path.
Applsci 11 09498 g002
Figure 3. (i) Representative Raman signal of top and bottom layer with offset for Phantoms type A and B (Panel A(i) and B(i) respectively). (ii) SNR versus offset for Phantoms type A and SORS and SNR versus offset for Phantoms type B (Panel A(ii) and B(ii) respectively). SORS ratio values were normalized to the respective zero offset value for convenience.
Applsci 11 09498 g003
Figure 4. Typical Raman spectra of separate skin layers of (a) healthy human eyelid and (b) healthy human scalp. All spectra are baseline corrected and normalized to phenylalanine content, to help visualize changes between skin layers by enabling spectral comparison. Raman band assignments can be found in Table S1. Dashed boxes highlight areas of multiple bands assigned to vibrations of similar biomolecules.
Applsci 11 09498 g004
Figure 5. Spatially offset Raman spectra from a representative healthy eyelid sample. All spectra are background corrected, smoothed, normalized to phenylalanine residue (1004 cm−1) and vertically shifted for clear presentation and comparison. The perpendicular line represents the position of the 872 cm−1 band (hydroxyproline), whereas solid line boxes highlight areas of expected spectral changes with offset.
Applsci 11 09498 g005
Figure 6. PCA scatter plots for Raman spectra collected from scalp skin of (a) different sample areas and donors and (b) different offsets.
Applsci 11 09498 g006
Figure 7. PCA scatter plots for Raman spectra collected from eyelid skin of (a) different sample areas and donors and (b) different offsets.
Applsci 11 09498 g007
Figure 8. PC3 loading (0.4%) of eyelid SORS dataset and PC2 loading (1%) of scalp tissue SORS dataset subplotted with the reference Raman spectrum of the subcutaneous fat layer.
Applsci 11 09498 g008
Table 1. Location and characteristics of human tissue samples employed in the study.
SampleLocationSubareasEpidermis Thickness (mm)Total Sample Thickness (mm)Dissected
1ScalpA, B13.5 Y
2ScalpA, B0.53N
3ScalpA1.36N
4EyelidA, B0.42Y
5EyelidA0.32N
Publisher’s Note: MDPI stays neutral with regard to jurisdictional claims in published maps and institutional affiliations.

