Abstract
The diesel particulate filter of a diesel engine is an after-treatment device that removes particulate matter from exhaust emissions by filtering and oxidating them through a regeneration process. When the diesel particulate filter is damaged, a vehicle inspection is usually performed; if the cause is not found through using on-board diagnostics, then the diesel particulate filter is removed, and a visual test is conducted. However, it is not easy to find the exact cause of the diesel particulate filter being damaged, and a visual test takes a long time as the diesel particulate filter substrate is covered by a canister. In this study, using the computed radiography X-ray imaging technique, X-ray images were taken after placing an accumulated amount of carbon powder, similar to soot and ash powder in the substrate. Results confirmed that carbon powder and ash powder were shown in white in X-ray images, leading to a conclusion that distinguishing between carbon powder and ash powder is possible by analyzing the pixel value through the image processing technique. However, since pixel values alone are insufficient for exact quantitative evaluation, various studies and analyses are necessary for quantitative evaluation.
1. Introduction
Nanoparticulate matter among air pollutants is a growing environmental concern worldwide. A data book on automotive particulate matter (PM) reduction published by the National Assembly of the Republic of Korea indicates that diesel vehicles account for 29 percent of the total PM emissions in the Seoul Metropolitan Area, followed by construction equipment (accounting for 22 percent). These results signify that diesel engines are responsible for more than half of PM emissions in the Seoul Metropolitan Area [1]. A few years ago, research studies reported poorer performance of the after-treatment device due to an increase in the driving mileage of in-use vehicles [2,3]. Furthermore, concerns are being raised over air pollution triggered by aged diesel vehicles and construction equipment without after-treatment devices. Against this backdrop, stronger controls and regulations are being imposed, as manifested in the following measures. Firstly, government-backed projects for attaching after-treatment devices, such as the diesel particulate filter (DPF), to aged diesel vehicles are being pursued. Secondly, retrofit attachment projects of PM-NOX simultaneous reduction devices for Euro-4 heavy-duty diesel vehicles or those subject to lower standards are being done. Lastly, maintenance regulations for diesel vehicles are being enforced [4].
The DPF is a device that prevents PM from being exhausted into the atmosphere by filtering the matter generated from diesel vehicles, and the substrate inside the DPF serves as a filter. Once a certain amount of soot is accumulated after being filtered by the substrate, the soot regeneration process takes place. However, when the substrate is aged, it may be internally damaged due to various reasons, such as thermal stress occurring during the regeneration process, vibrations generated while driving, and increasing back pressure caused by the loaded PM [5,6,7]. Damage on the substrate leads to a lower filtering performance, resulting in excessive PM emissions. As a prevention measure, DPFs must be checked on a regular basis, and such a periodic inspection of in-use vehicles typically assesses the status of and maintains the DPF by measuring the smoke concentration of diesel vehicle emissions. To evaluate the status of the DPF, a measurement of the smoke concentration and an on-board diagnostics (OBD) test are carried out, and a visual test is executed after removing the DPF from the vehicle in case the smoke concentration exceeds the regulation standards. However, the visual test after the removal has limitations, such as its long duration and difficulties in identifying the internal problems of the substrate.
Nondestructive testing using the X-ray imaging technique is deemed as a valid alternative to overcome such limitations. Nondestructive testing utilized for the DPF include ultrasonic testing and neutron radiographic testing, other than radiographic testing [8,9,10]. Ultrasonic testing detects a change in the density using signals. However, in case it is difficult to conduct an accurate check, the pertinent part is removed, and liquid is inserted for further analysis. Therefore, the liquid makes the testing technique an invalid approach to see if soot and ash are accumulated. Neutron radiographic testing, a testing technique more sophisticated than the radiographic one, shows outstanding transmittance. However, it is expensive and sensitive to safety, as it is used as equipment specifically for large reactors, posing difficulties in taking a measurement for the after-treatment device.
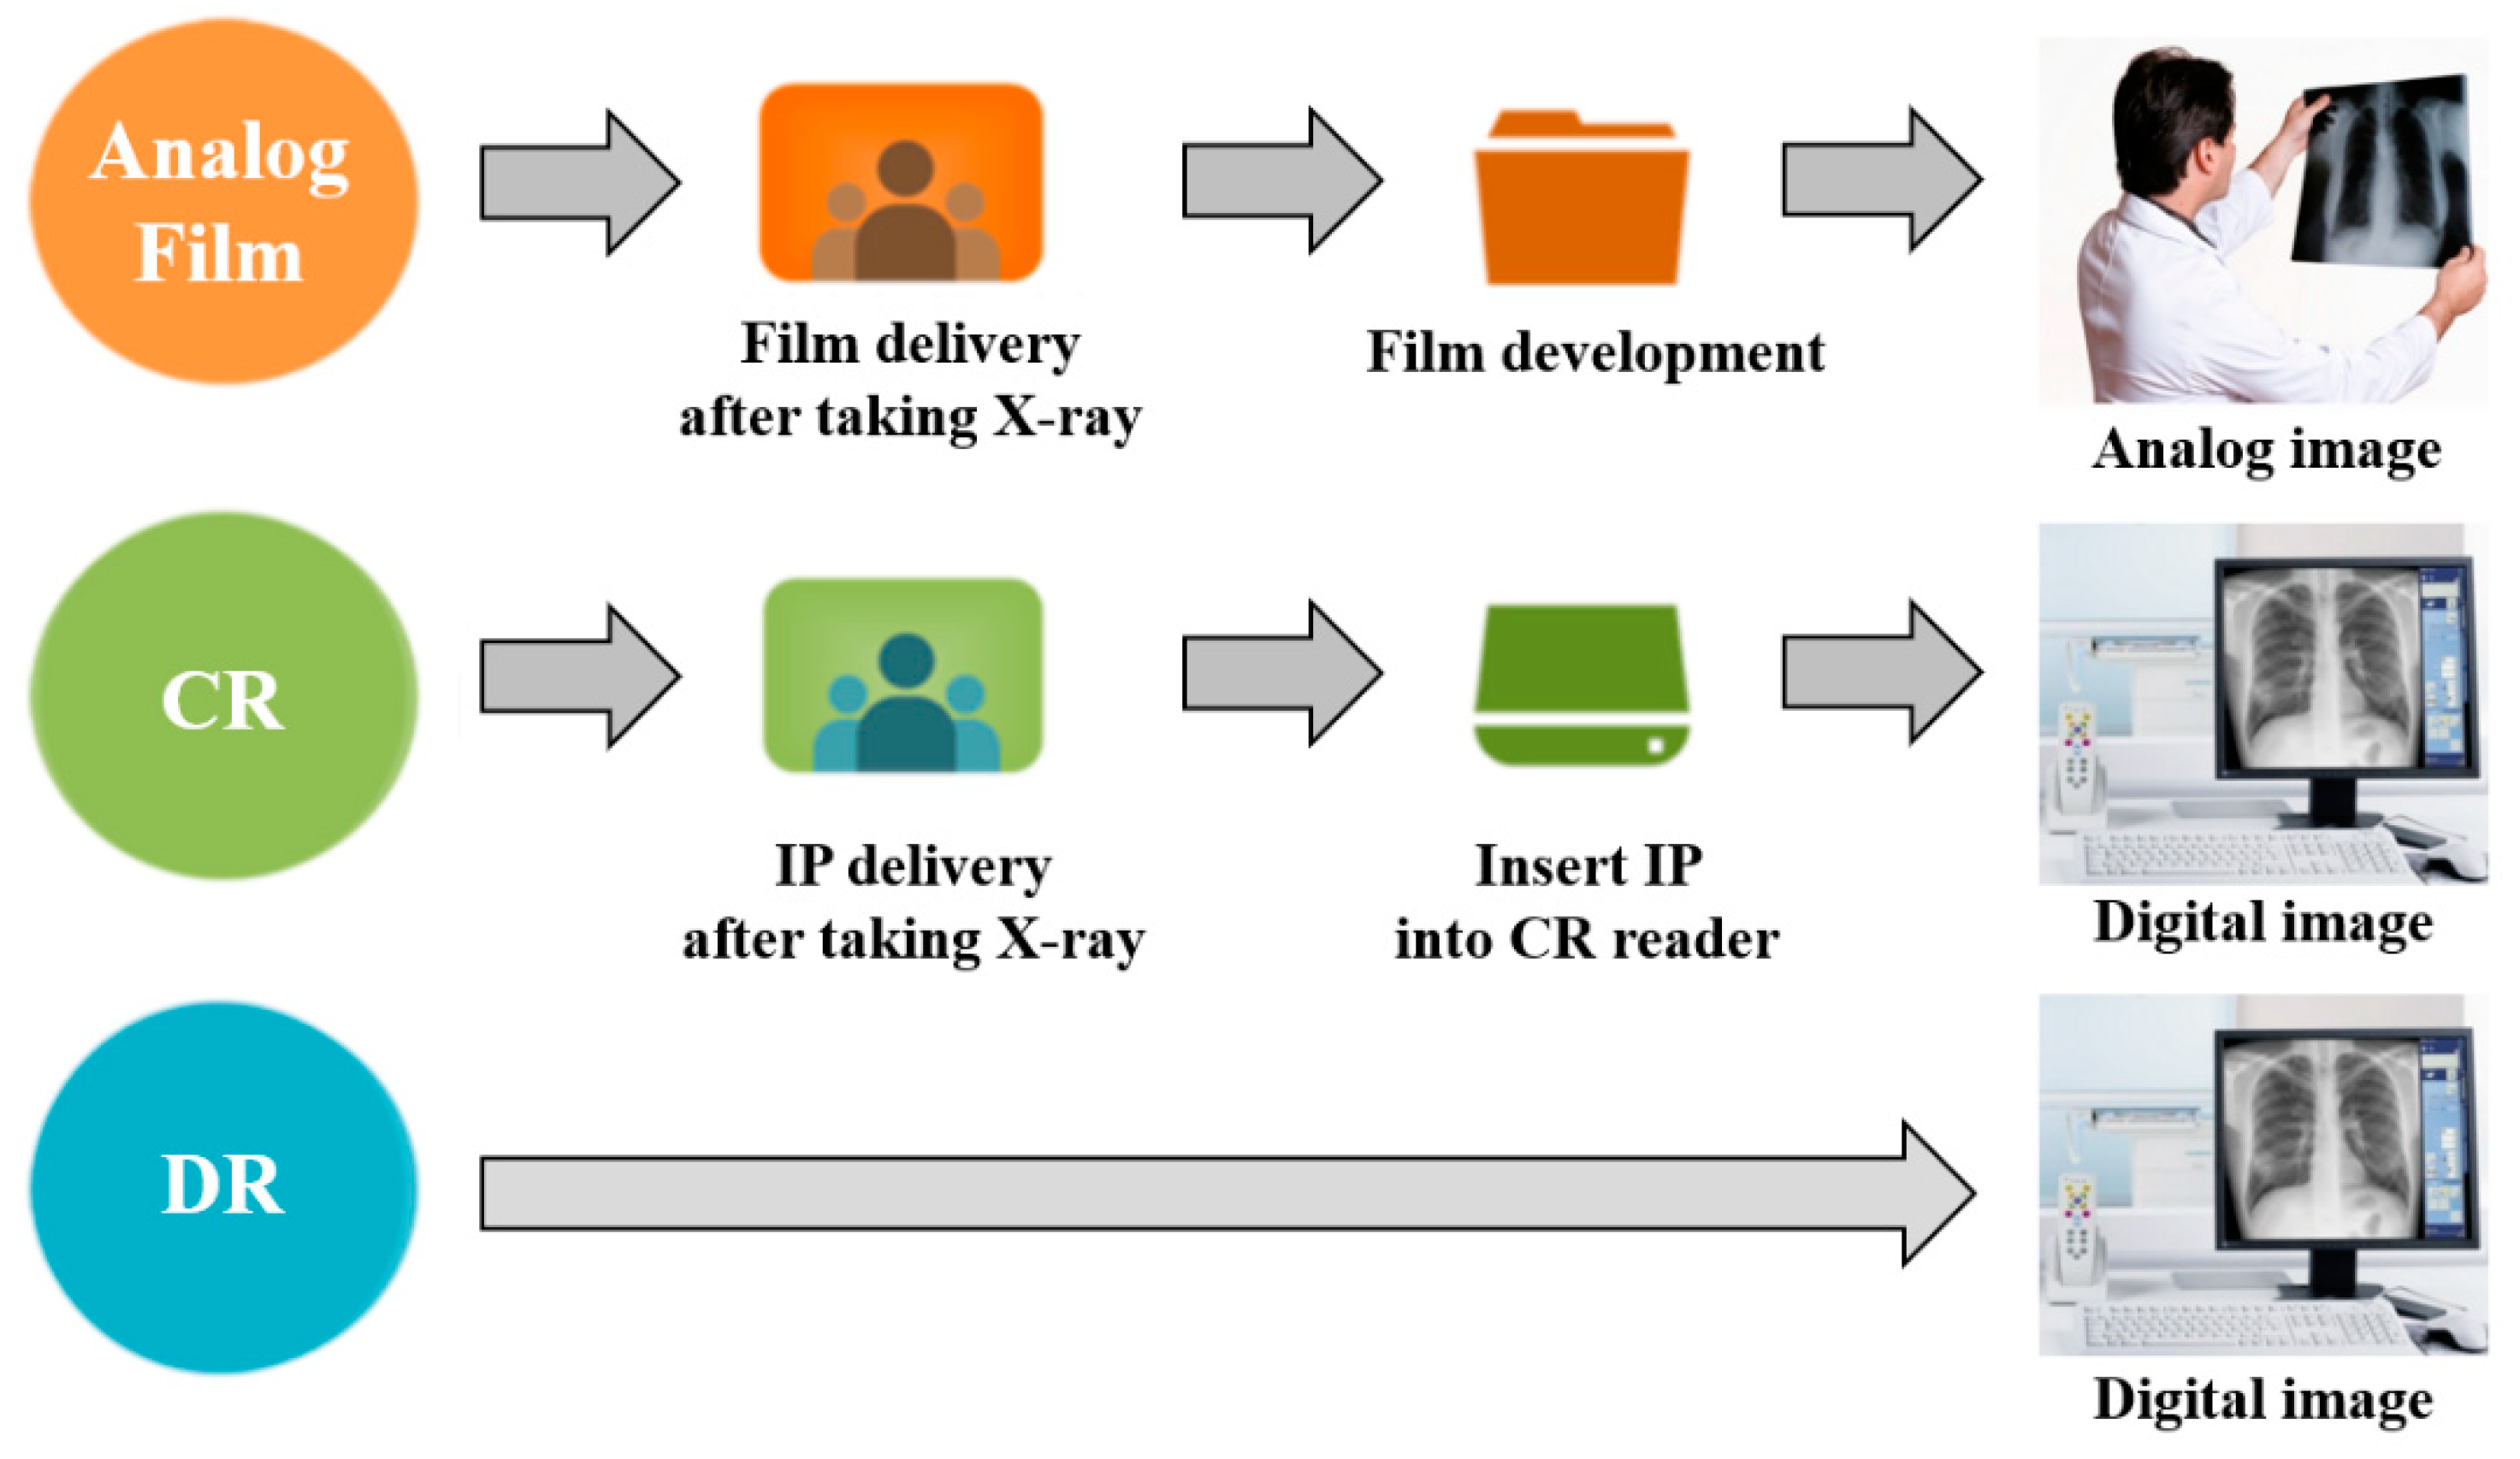
Radiographic testing usually uses three types of X-ray detection methods in medical institutions. Firstly, in the analog method, an X-ray film is used as a detector. However, after taking an X-ray, a liquid is required to develop the film, and the development process takes a lot of time. In addition, the film must be replaced after each imaging, and it is impossible to transfer the image to a computer. Therefore, the analog method is rarely used nowadays. Secondly, there is the digital radiography (DR) method, in which a flat panel detector (FPD) is used. After taking an X-ray, it can be transferred to a computer within a few seconds without a separate process, and additional image processing is possible. Furthermore, it is possible to obtain excellent images even with a lower radiation dose compared to the analog method. However, the equipment is expensive, and the digital FPD is sensitive to handling. Accordingly, there is a high risk of damage to the FPD when used as a target for mechanical devices. Thirdly, the computed radiography (CR) method is easily understood as a combination of analog and DR. The CR method is used an imaging plate (IP) as a detector. After taking an X-ray, when IP is inserted into the CR reader, the image is transmitted to the computer through the image processing process. CR transmits images faster than analog but slower than DR. Nevertheless, in the same way as DR, CR can also be transmitted to a computer for additional image processing. In addition, the CR is lower than DR in investment cost, and the IP detector is easier to manage than FPD, so it can be used for various purposes. For comparison, the characteristic comparison table of the X-ray detection methods is shown in Table 1, and the workflow of the X-ray detection methods is shown in Figure 1.

Table 1.
The characteristic comparison table of the X-ray detection methods.
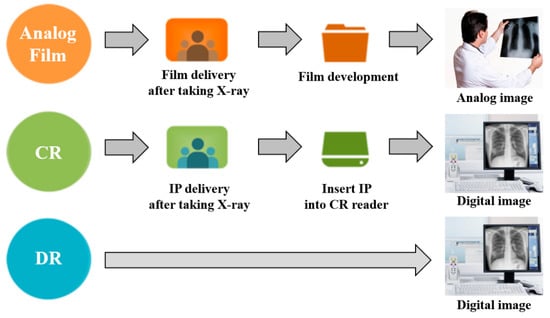
Figure 1.
Workflow of the X-ray detection methods.
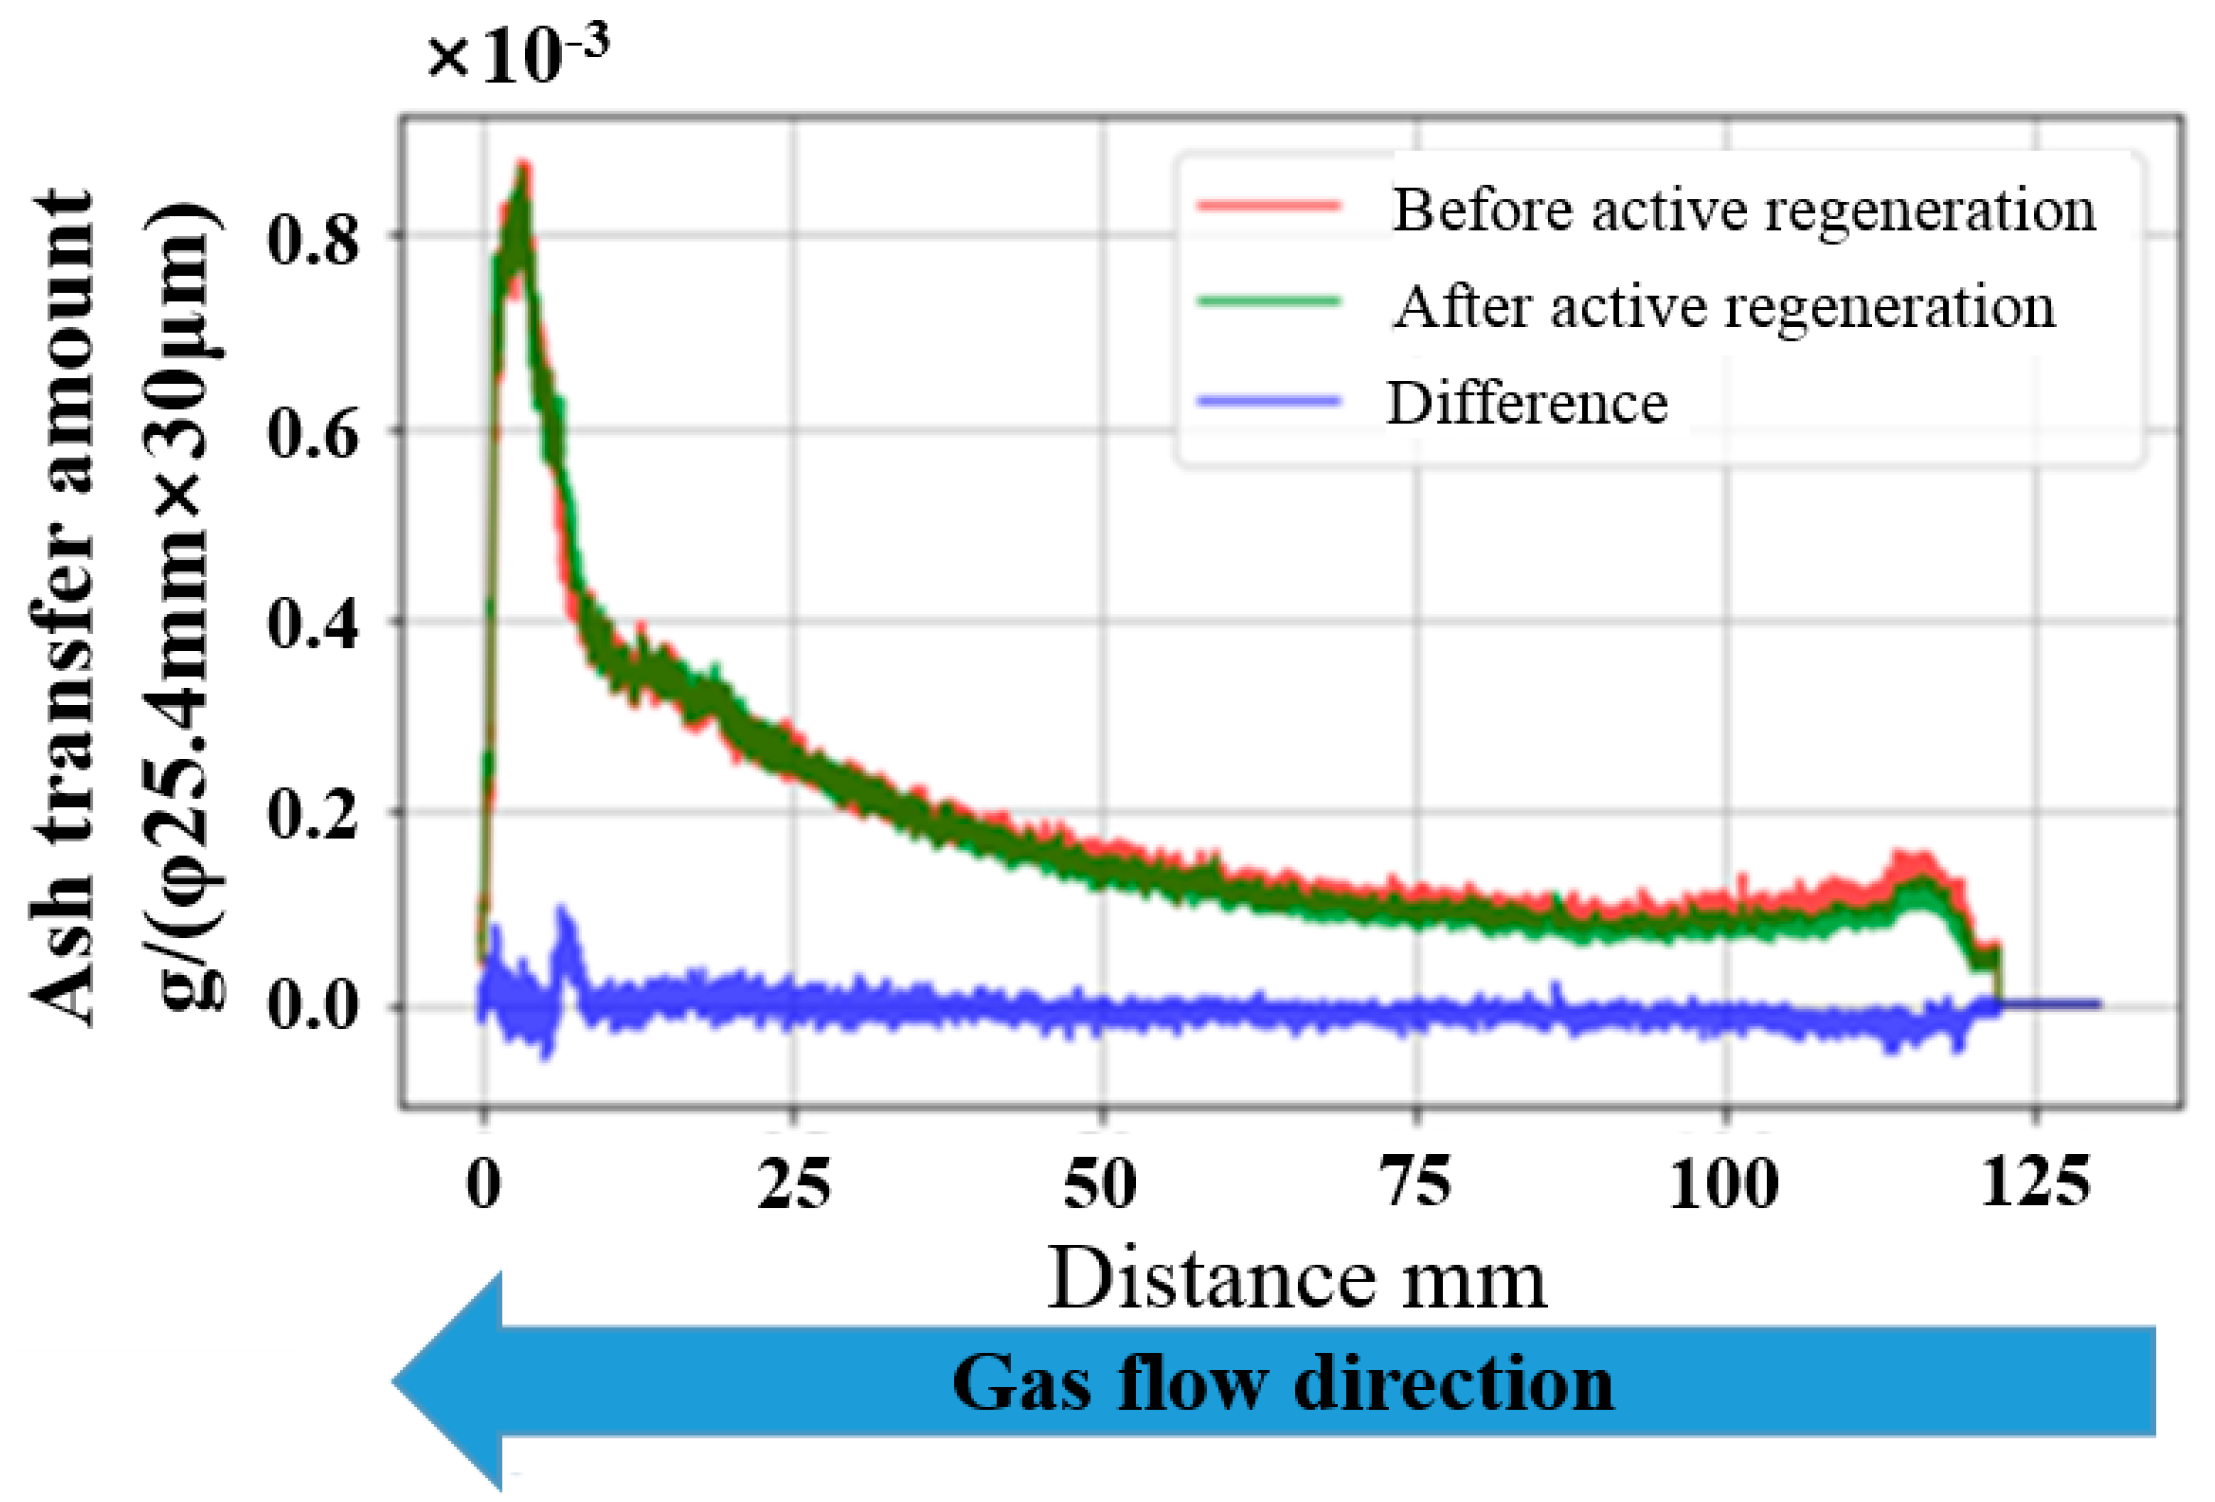
Besides that, there are computed tomography (CT) X-ray methods. Since the CT X-ray method takes 360° of an object, it is possible to obtain an accurate image. Therefore, Waseda University and the National Institute of Advanced Industrial Science and Technology in Japan conducted a study on the transfer and accumulation of ash based on images taken using the CT X-ray imaging technique (Figure 2) [11,12]. Furthermore, Korea University identified the length and shape of ash employing the CT X-ray imaging technique (Figure 3) [13]. However, CT X-ray equipment is expensive, and removal is inevitable when taking DPF. Accordingly, the CT X-ray method takes a lot of time to take a DPF. On the other hand, the DPF installed under vehicles was estimated to be able to take an image in a short period of time using portable CR X-ray equipment and flexible IP without its actual removal. Accordingly, a study was conducted to measure the damaged DPF using the CR X-ray imaging technique [14]. As the CR X-ray imaging technique photographs an object unidirectionally, there are no research studies applying the technique on vehicles, as it has limitations in obtaining a highly clear image required to identify characteristics of ash accumulation on each channel of the substrate. In this study, Image J software (capable of image processing and analysis) was used, and the accumulation of soot and ash was analyzed based on the pixel values obtained through the histogram function.
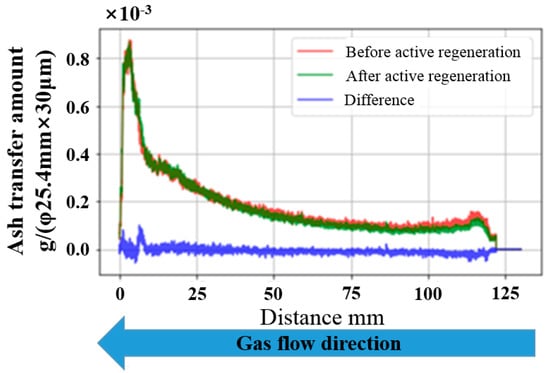
Figure 2.
Ash transport during active regeneration (Waseda University with the National Institute of Advanced Industrial Science and Technology in Japan).

Figure 3.
CT X-ray image of aged DPF.
2. Testing Device and Method
2.1. Testing Device
2.1.1. X-ray System
An X-ray is generated in a vacuum tube, called an X-ray tube. There are anode and cathode enveloped in the X-ray tube. The cathode is a filament made of tungsten and emits thermal electrons when heated by the current. When a high voltage is applied to the anode, electron current of the cathode is transferred at a high velocity towards the anode and made to collide with the target made of tungsten and molybdenum, releasing X-rays.
- Tube voltage: Tube voltage refers to a high voltage applied to the anode to generate X-rays in the X-ray tube, and its size determines the size of photon energy of the X-rays. Therefore, in case the tube voltage is low, it cannot sufficiently transmit an object, deteriorating the image quality. Conversely, a high tube voltage leads to an excessive amount of X-ray penetrating the object, reducing the contrast of the produced image. Therefore, an adequate level of tube voltage should be determined according to the type of object in use.
- Tube current: Tube current means a current flowing from anode to cathode, and its size determines the number of photons. The quantity of tube current is expressed in the unit mAs, which is generated by multiplying the tube current (mA) by the exposure time (s). Depending on the type of object, an appropriate level of tube current should be set to reduce the noise in images.
This study was able to obtain proper DPF substrate images using GXR-S of DRGEM Co., Ltd. in Gyeonggi-do, South Korea, which is generally used in medical fields. The specifications of the X-ray generator are shown in Table 2.
Table 2.
Specifications of the X-ray system.
2.1.2. IP
As a panel-shaped digital sensor to detect an X-ray that penetrates an object, IP shows better quantitation and sensitivity more than 100 times higher than the existing X-ray film. In addition, the data recorded onto the plate is erasable, enabling repeated use.
For this study, Regius CR Cassette (10 × 12 inches) manufactured by KONICA MINOLTA, Inc. in Tokyo, Japan, was used.
2.1.3. CR Reader
A laser beam is ejected from a CR reader once an IP with a certain amount of X-ray accumulated is inserted into the reader, releasing an optical signal whose size is proportional to the accumulated amount of X-ray. An image is obtained after the produced optical signal is converted into an electrical signal, amplified to be made to go through analog to digital (A/D) conversion, and sent to a computer. The CR readers usually have two laser scan modes: low mode and high mode. In low mode, a thick laser beam is an output. In that case, the resolution of the image is lowered, and each pixel is 175 μm in the image. On the contrary, in high mode, a thin laser beam is an output. In that case, as opposed to the low mode, the resolution is increased, and pixel size is 87.5 μm.
The CR reader used for this study is Regius model 110 of KONICA MINOLTA, Inc., and its specifications are shown in Table 3.
Table 3.
Specifications of the CR reader.
2.1.4. Image J
Image J, a Java-based image processing program created by the National Institute of Health in the US, is used to process radiographic images in medical fields and offers various features for image processing and analysis [15]. When the brightness and contrast of an image are adjusted using Image J, it leads to a dramatic change in the overall brightness and the contrast between black and white of the image. The pixel of an image is used as the minimum unit, and the brightness of an X-ray image is expressed in a pixel value. A pixel value makes it possible to analyze a difference in density, which is difficult to achieve visually and is expressed in fixed numbers within a range between 0 (black) and 255 (white) on an image of grayscale. Therefore, the higher (lower) the pixel value, the higher (lower) the density is.
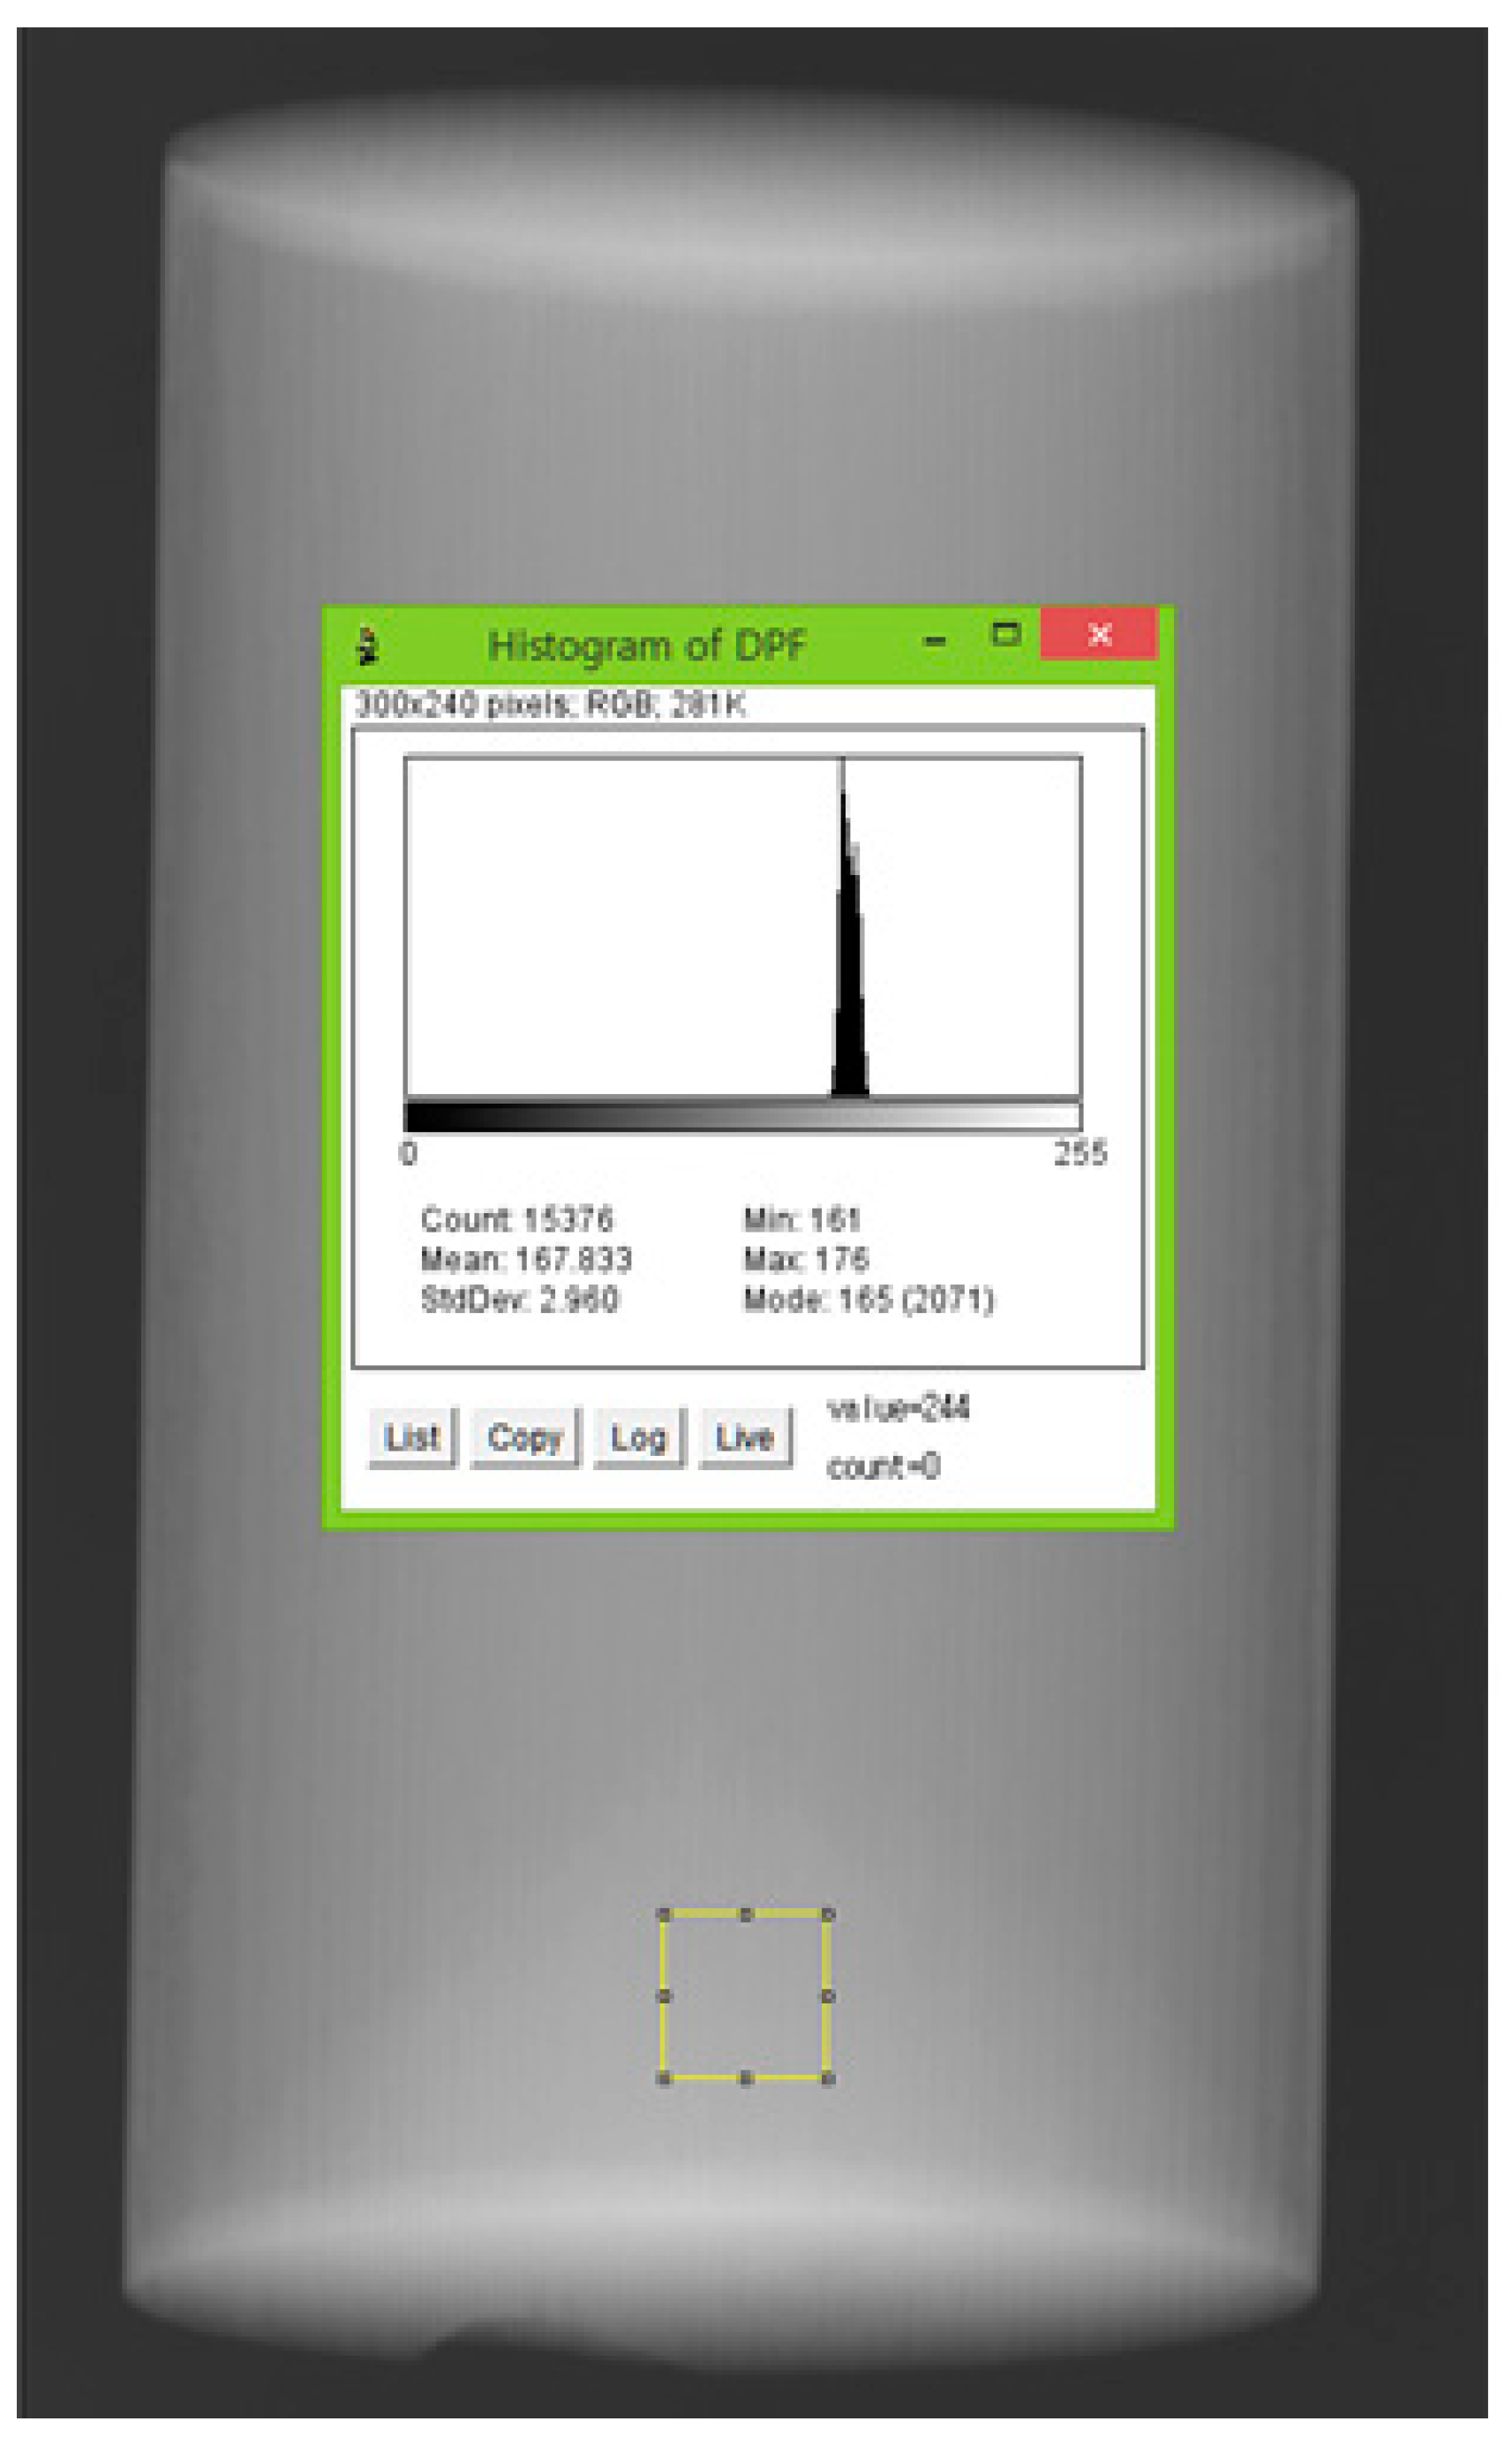
Image J was employed to analyze images deemed difficult to visually distinguish whether soot and ash were accumulated. Whether they are accumulated can be checked with a pixel value produced by setting and designating the areas accumulated with soot and ash as the region of interest (ROI) and utilizing the density histogram feature (Figure 4).

Figure 4.
ROI and Histogram.
2.2. Testing Method
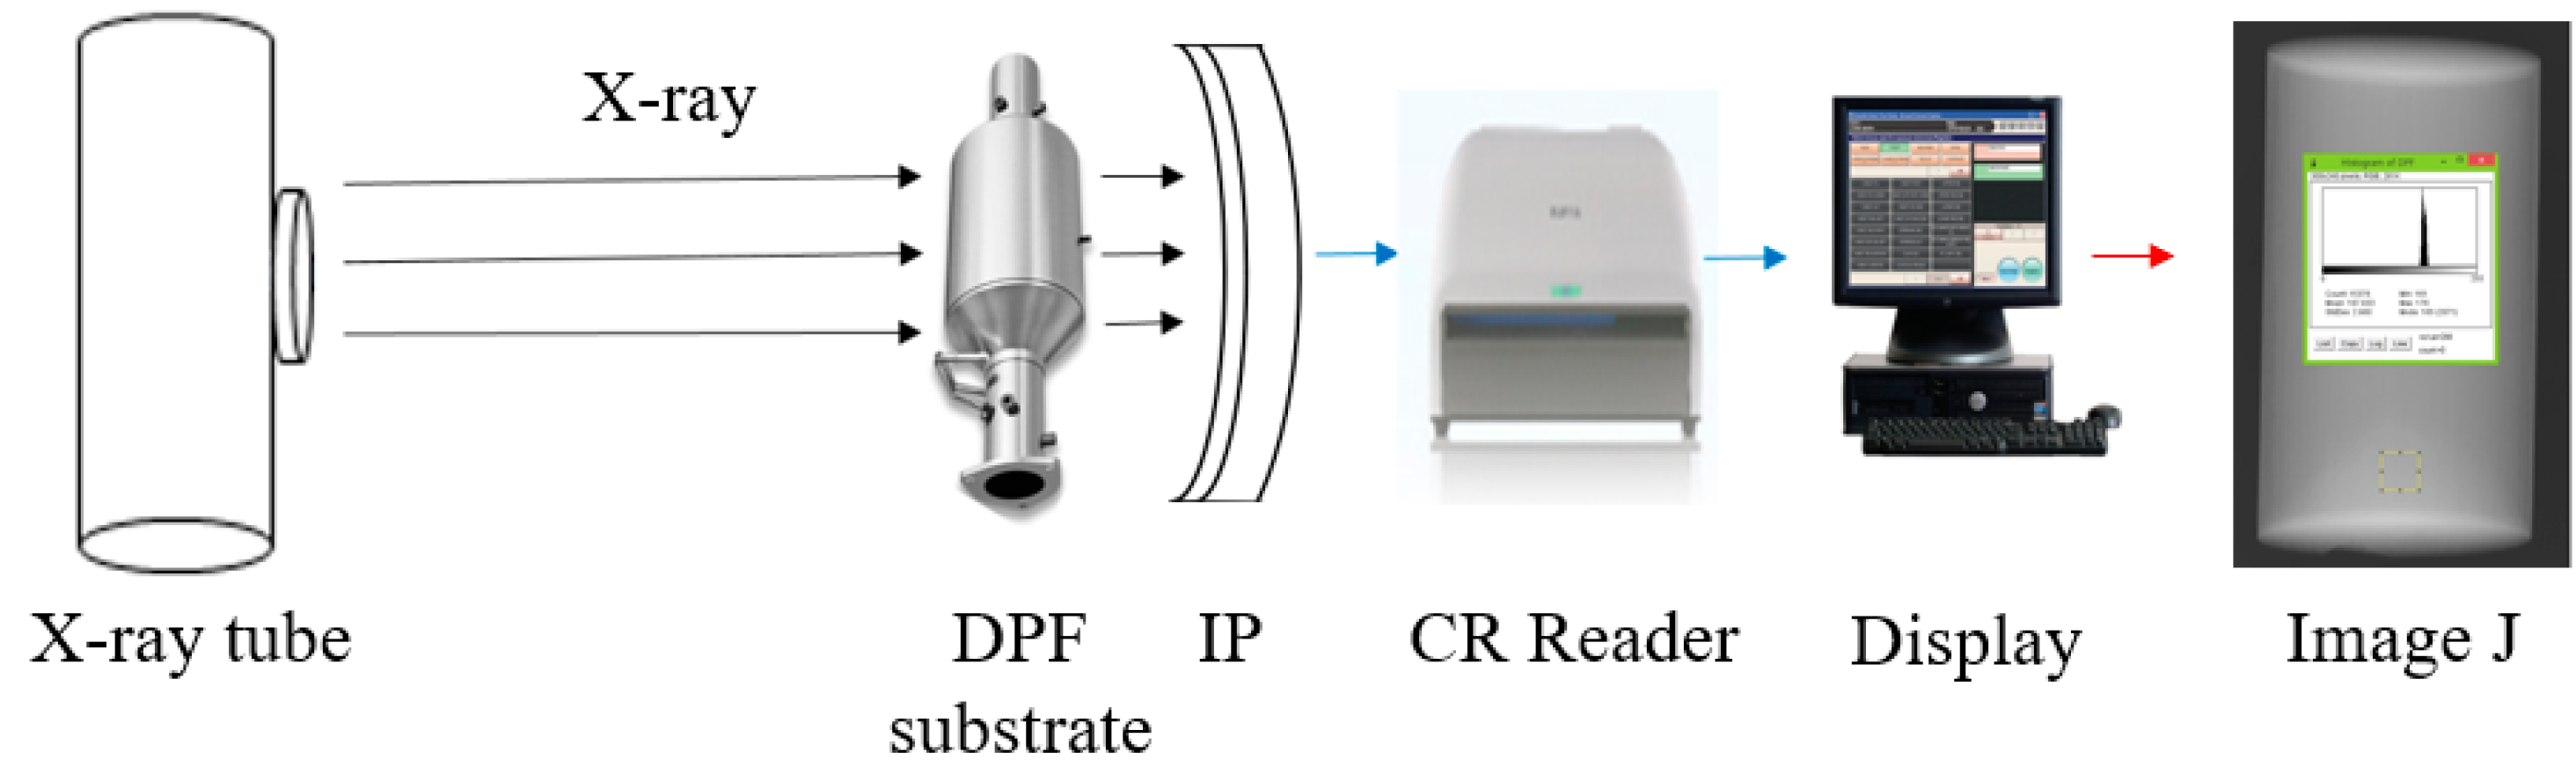
X-ray filming was carried out in a laboratory environment equipped with safety facilities for this study. New DPF substrates were prepared to see if it was possible to observe the accumulation of soot and ash, and its size was 5.66 inches in diameter and 10 inches in height, with a cell density of 200 cells per square inch (CPSI). Each image was obtained with the CR reader after placing the DPF substrate onto the IP and inspecting the X-ray. They were checked for whether soot and ash were accumulated using a pixel value of the image, which was measured with Image J. A diagram showing the sequential process of producing the X-ray image of the DPF substrate and analyzing the accumulation status is shown in Figure 5; photos of the experimental setup are presented in Figure 6.
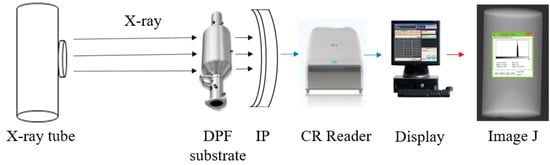
Figure 5.
The schematic diagram from CR X-ray system to Image J.
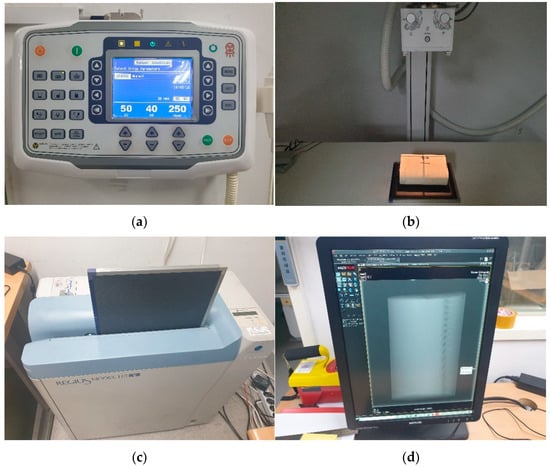
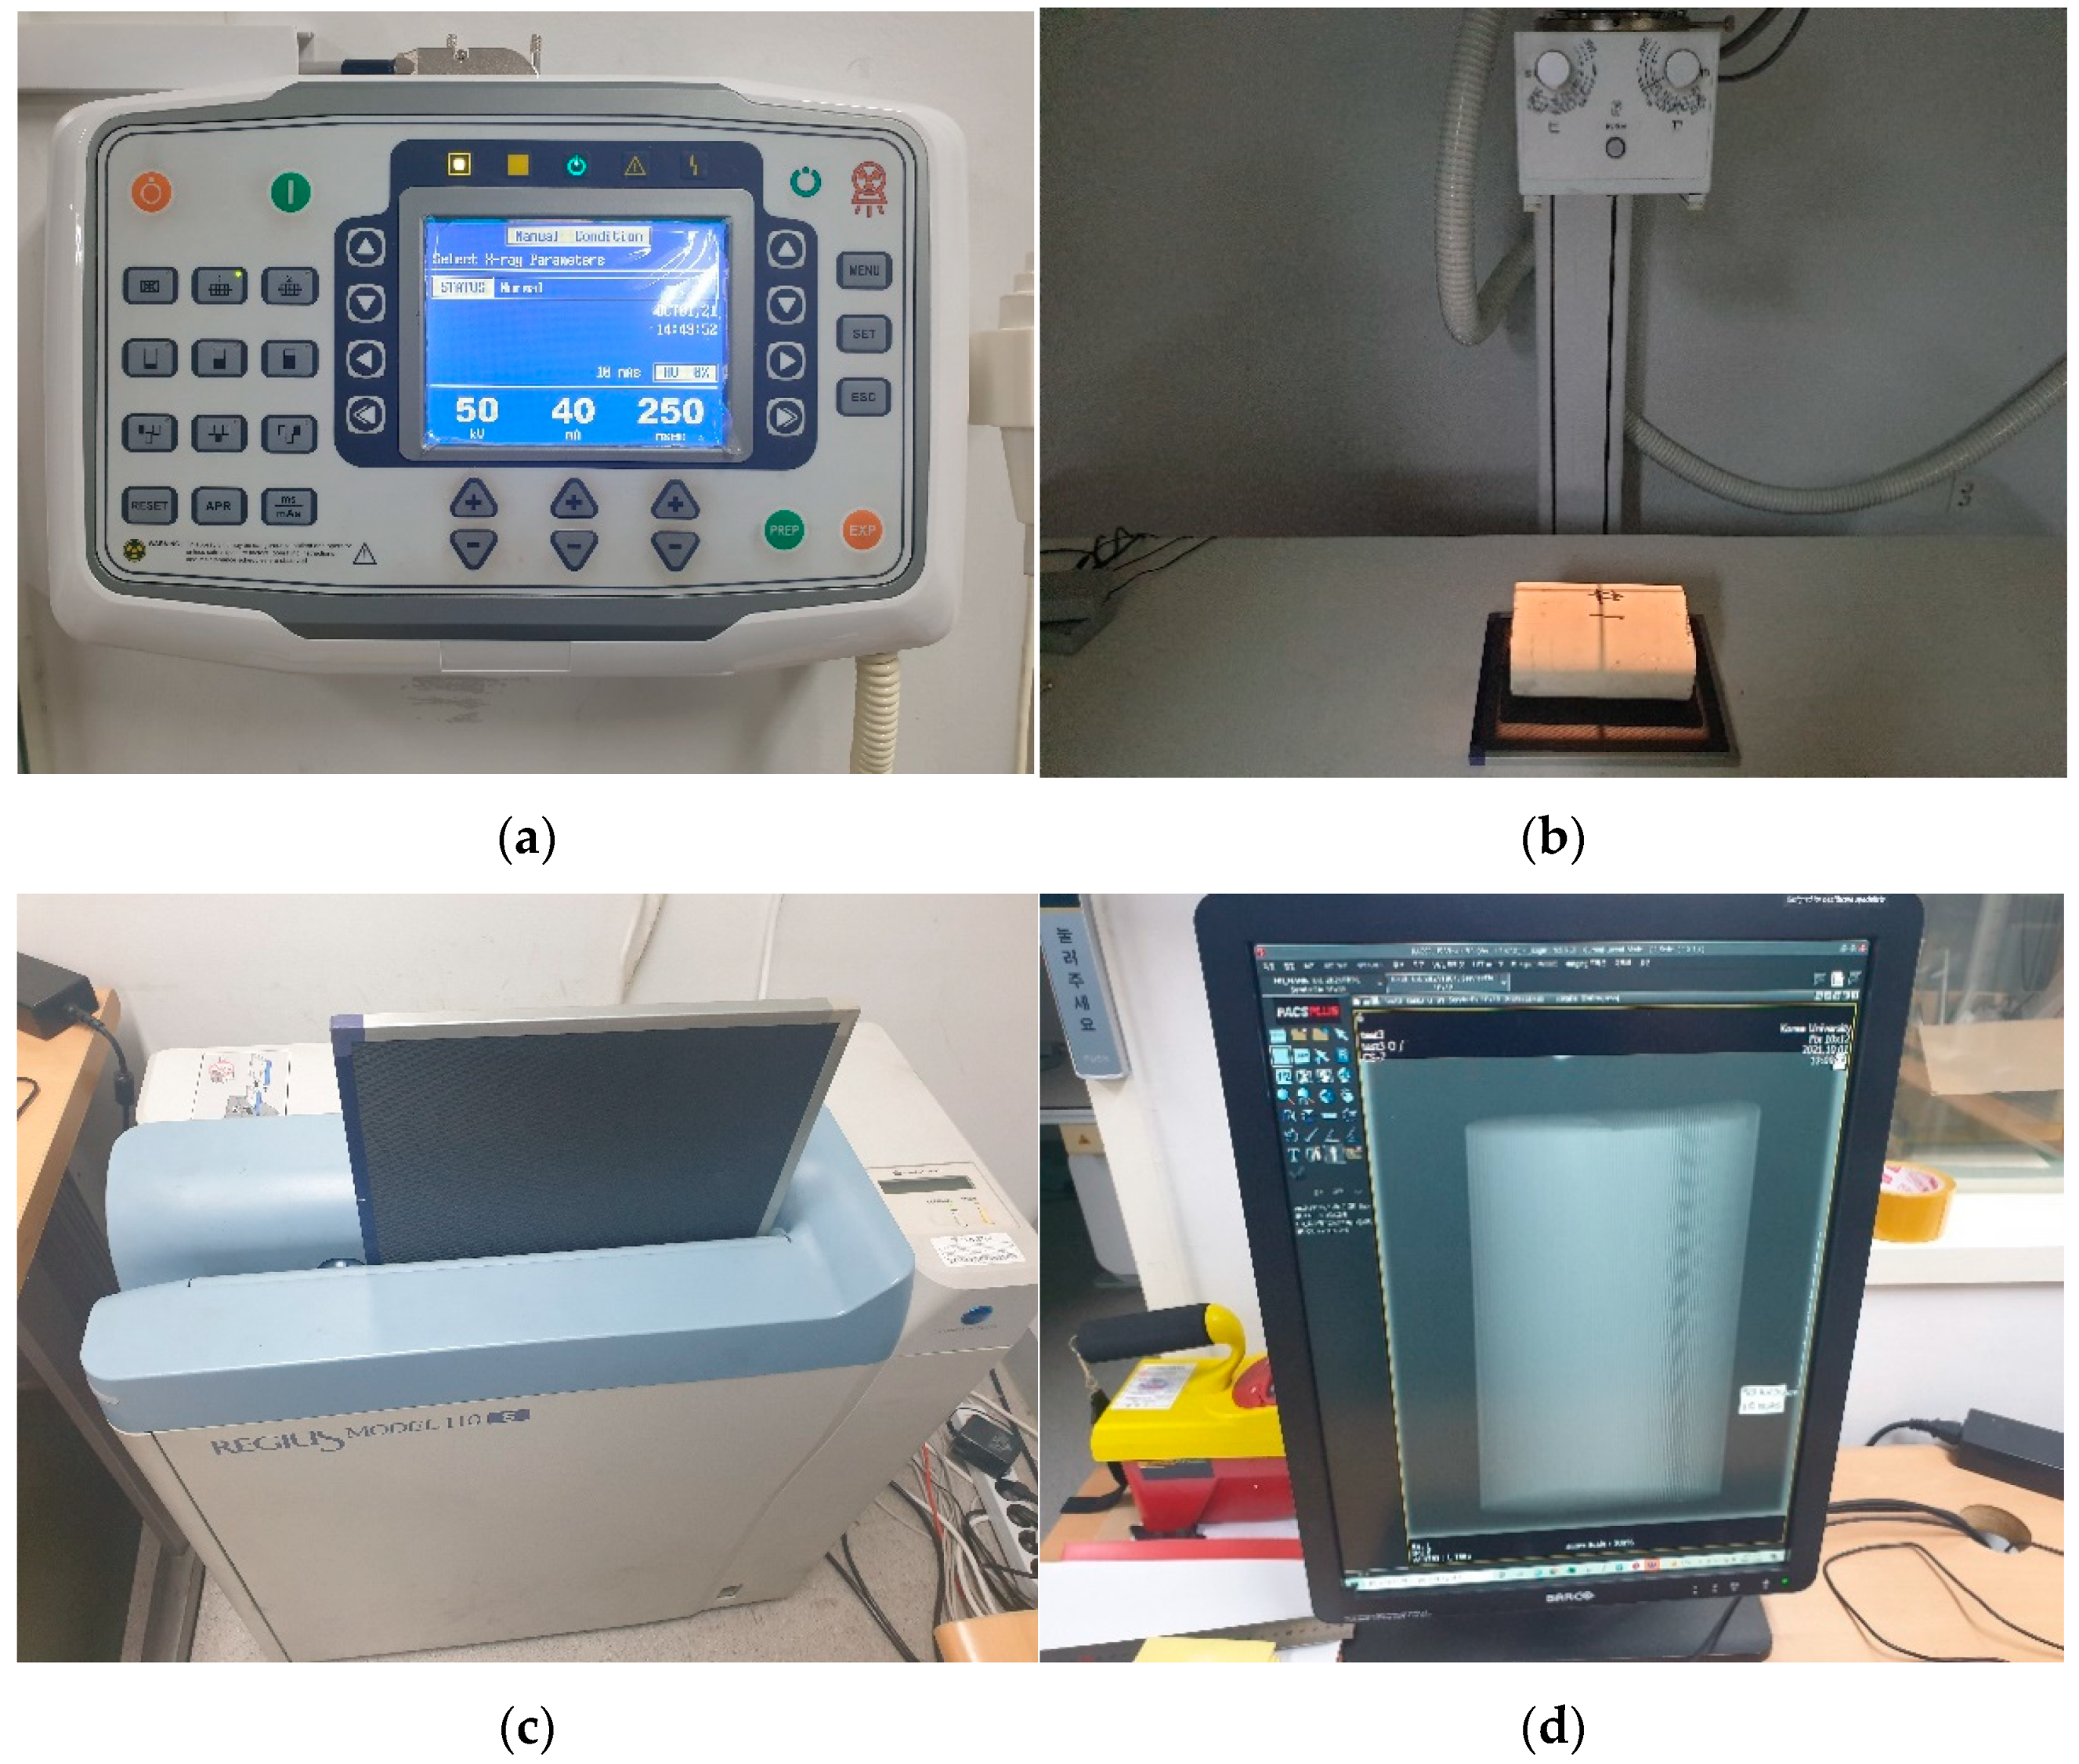
Figure 6.
X-ray experimental setup photos: (a) tube voltage and tube current setting; (b) taking an X-ray; (c) insert IP into CR reader; (d) image output to the computer.
The distance from the DPF substrate to take its image was set at 1 m, which is the same as the CR X-ray imaging requirement for the human body. In addition, to obtain clear substrate images, X-rays were taken while changing the tube current from 5 to 20 mAs at a tube voltage of 40–60 kV. As a result, the clearest image was obtained and selected as a parameter, and when the transmittance and noise were considered, it was the clearest at 50 kV and 10 mAs. Therefore, these were used for the tube voltage and current. In addition, the scan mode of the CR reader was set to the low mode. High mode is usually used to image microscopic tissues, and low mode is used to image human chests. Therefore, it was assumed that the inside of the substrate could be sufficiently photographed even in the low mode. The testing conditions above are listed in Table 4.
Table 4.
The establishment of irradiation conditions.
3. Test Results and Observations
3.1. Accumulation of Carbon Powder and Ash Powder
A test was carried out to check if the ash was accumulated inside the DPF substrate, as it could increase back pressure, reducing the power and specific fuel consumption of an engine as well as affecting the durability of the substrate. As there is not only ash but soot inside the substrate, carbon powder, similar to soot, and ash powder were placed on the new substrate to see if they were accumulated based on a comparison of pixel values.
3.1.1. Results from Images of Substrate with Accumulated Carbon Powder
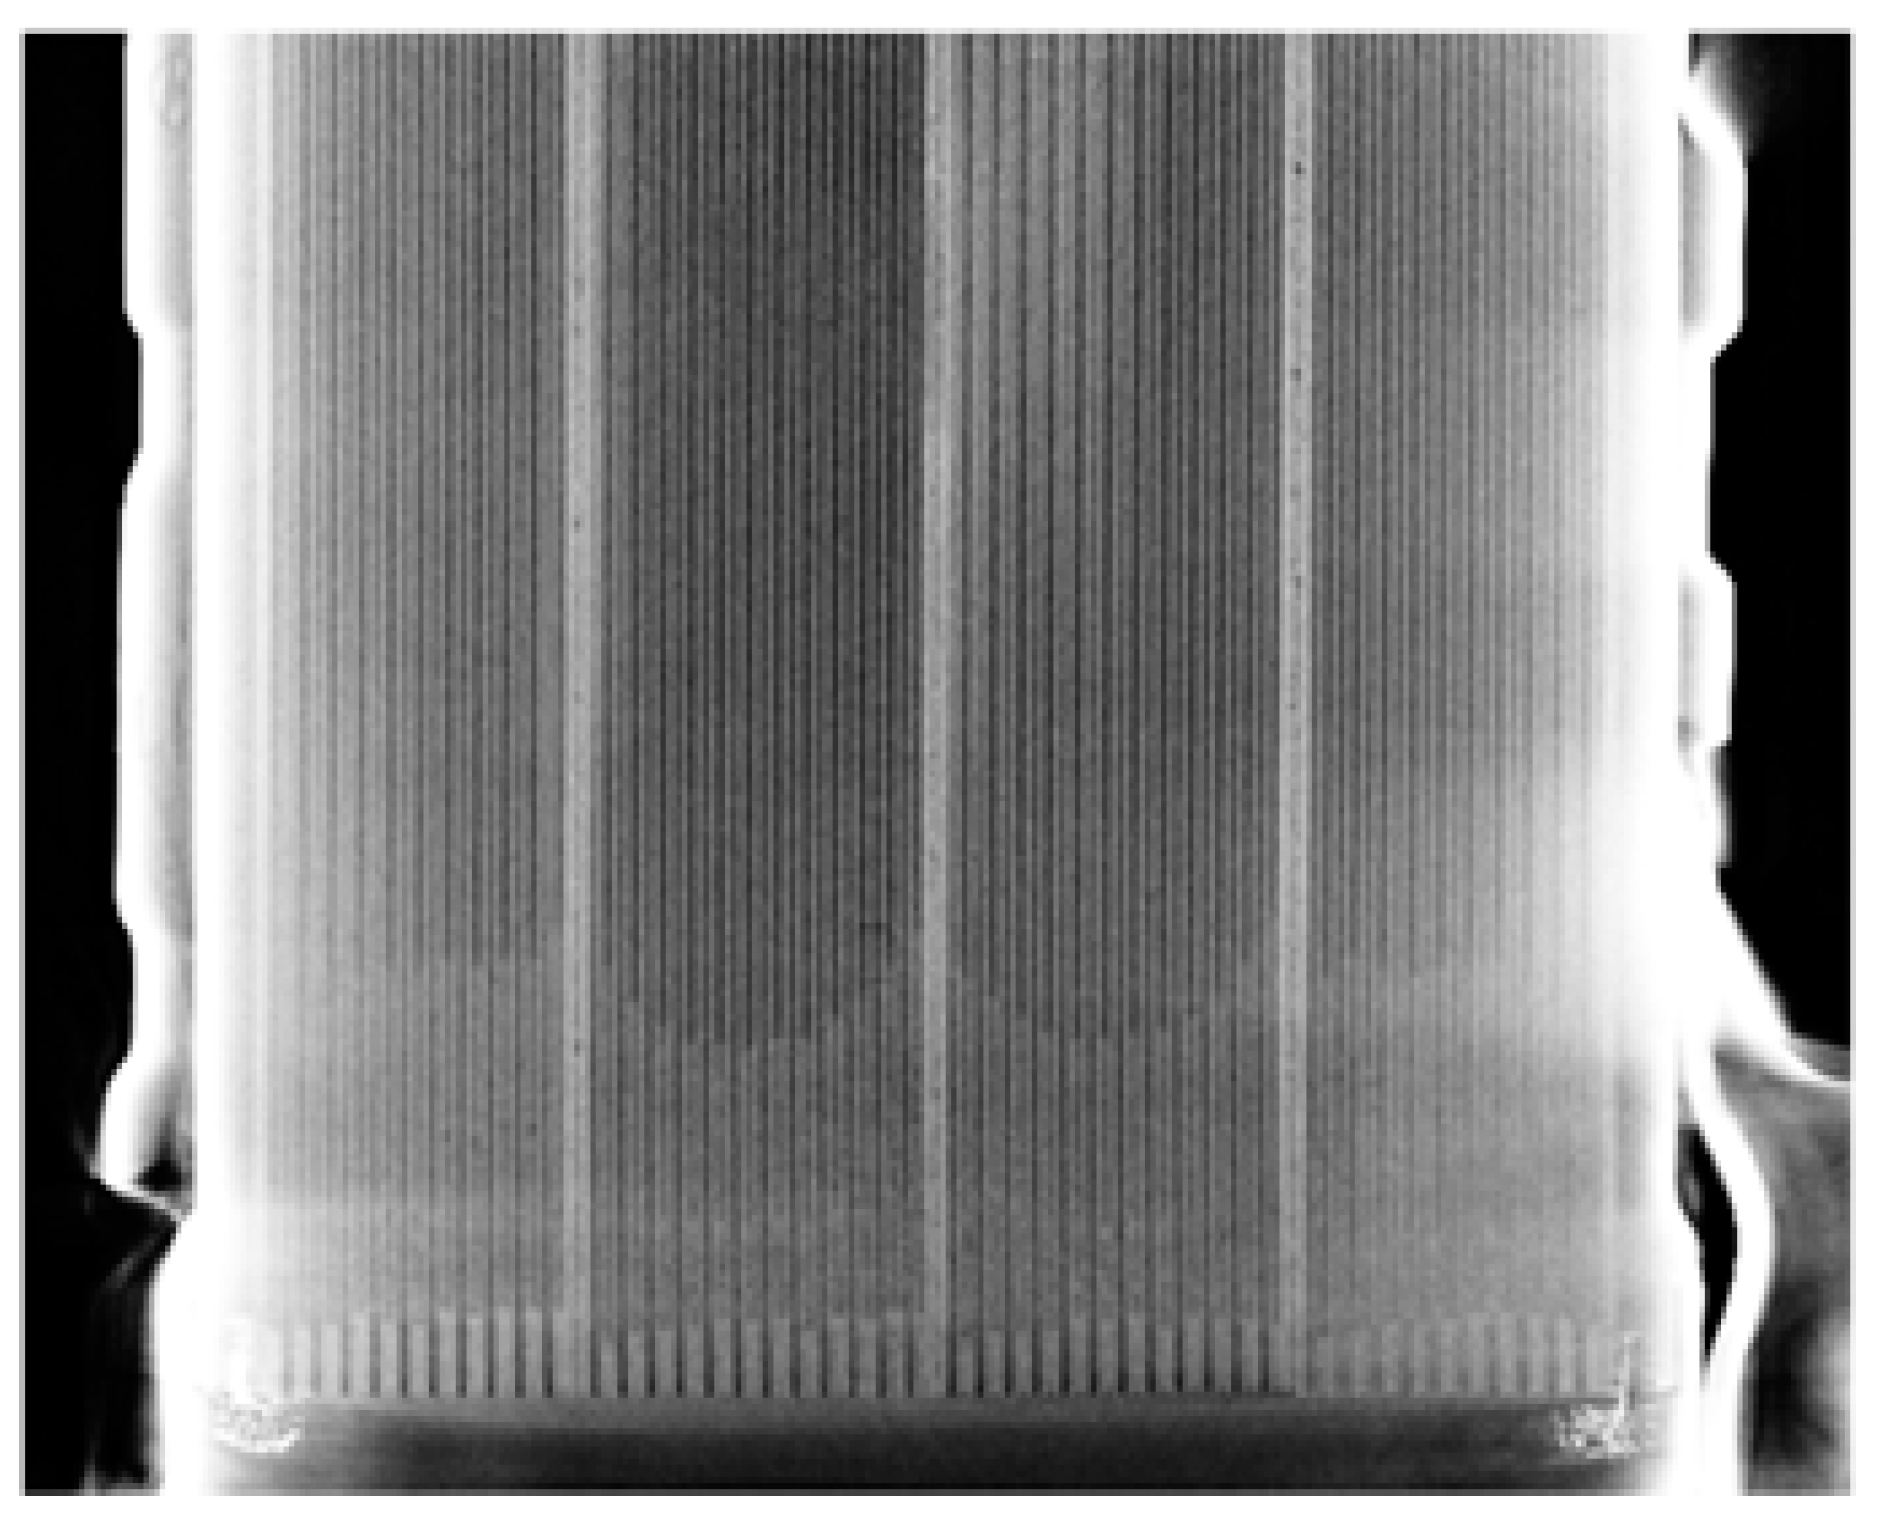
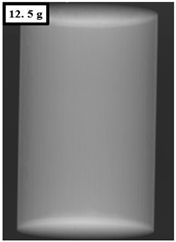
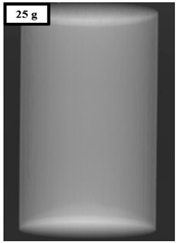
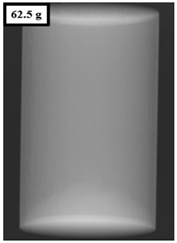
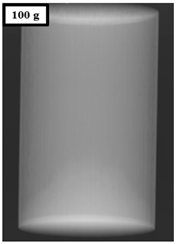
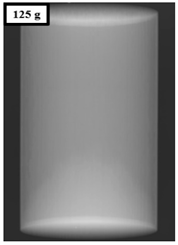
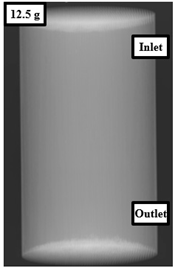
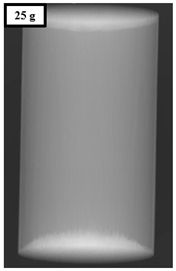
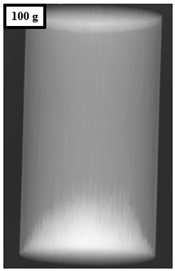
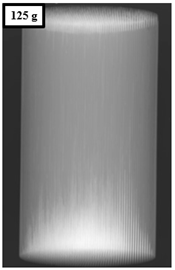
The maximum allowable quantity of soot was assumed to be 6 g/L (mass per volume of substrate) before regeneration, and the volume of the substrate used in the test was calculated to be about 4.12 L based on the standard [16]. Therefore, the maximum allowable quantity of soot in the entire substrate was estimated to be 24.72 g, which was rounded up to 25 g for the convenience of the testing. In this study, contents of carbon powder, which is similar to soot that is accumulated in the substrate, in six different quantities were compared by taking an X-ray. The images of the substrate in these six different conditions are shown in Table 5.
Table 5.
The substrate images of six different conditions (carbon powder from 0 g to 125 g).
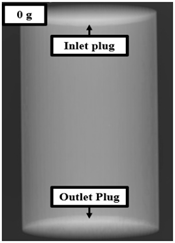
- New substrate (0 g): The new substrate has nothing accumulated inside.
- Accumulation 12.5 g: 50% of the maximum accumulated quantity is accumulated in the substrate.
- Accumulation 25 g: The maximum accumulated quantity of substrate.
- Accumulation 62.5 g, 100 g, and 125 g: Excessively accumulated quantity setting for better visual observation.
In the case of Table 5a, showing the new substrate, the plug on the inlet and the outlet appeared white. As for Table 5b, displaying the substrate with 12.5 g of carbon powder, an area appearing extremely pale white on the upper part of the plug was witnessed as carbon powder was accumulated on the outlet of the substrate. Table 5c, with an image of the substrate with 25 g of carbon powder, shows a larger area colored pale white. In cases of Table 5d, with the substrate with 62.5 g of the powder, Table 5e, with 100 g, and Table 5f, with 125 g, it was visually observed that carbon powder, accumulated in the shape of a mountain on the outlet of the substrate, appeared in pale white.
3.1.2. Analysis of Images of Substrate with Accumulated Carbon Powder
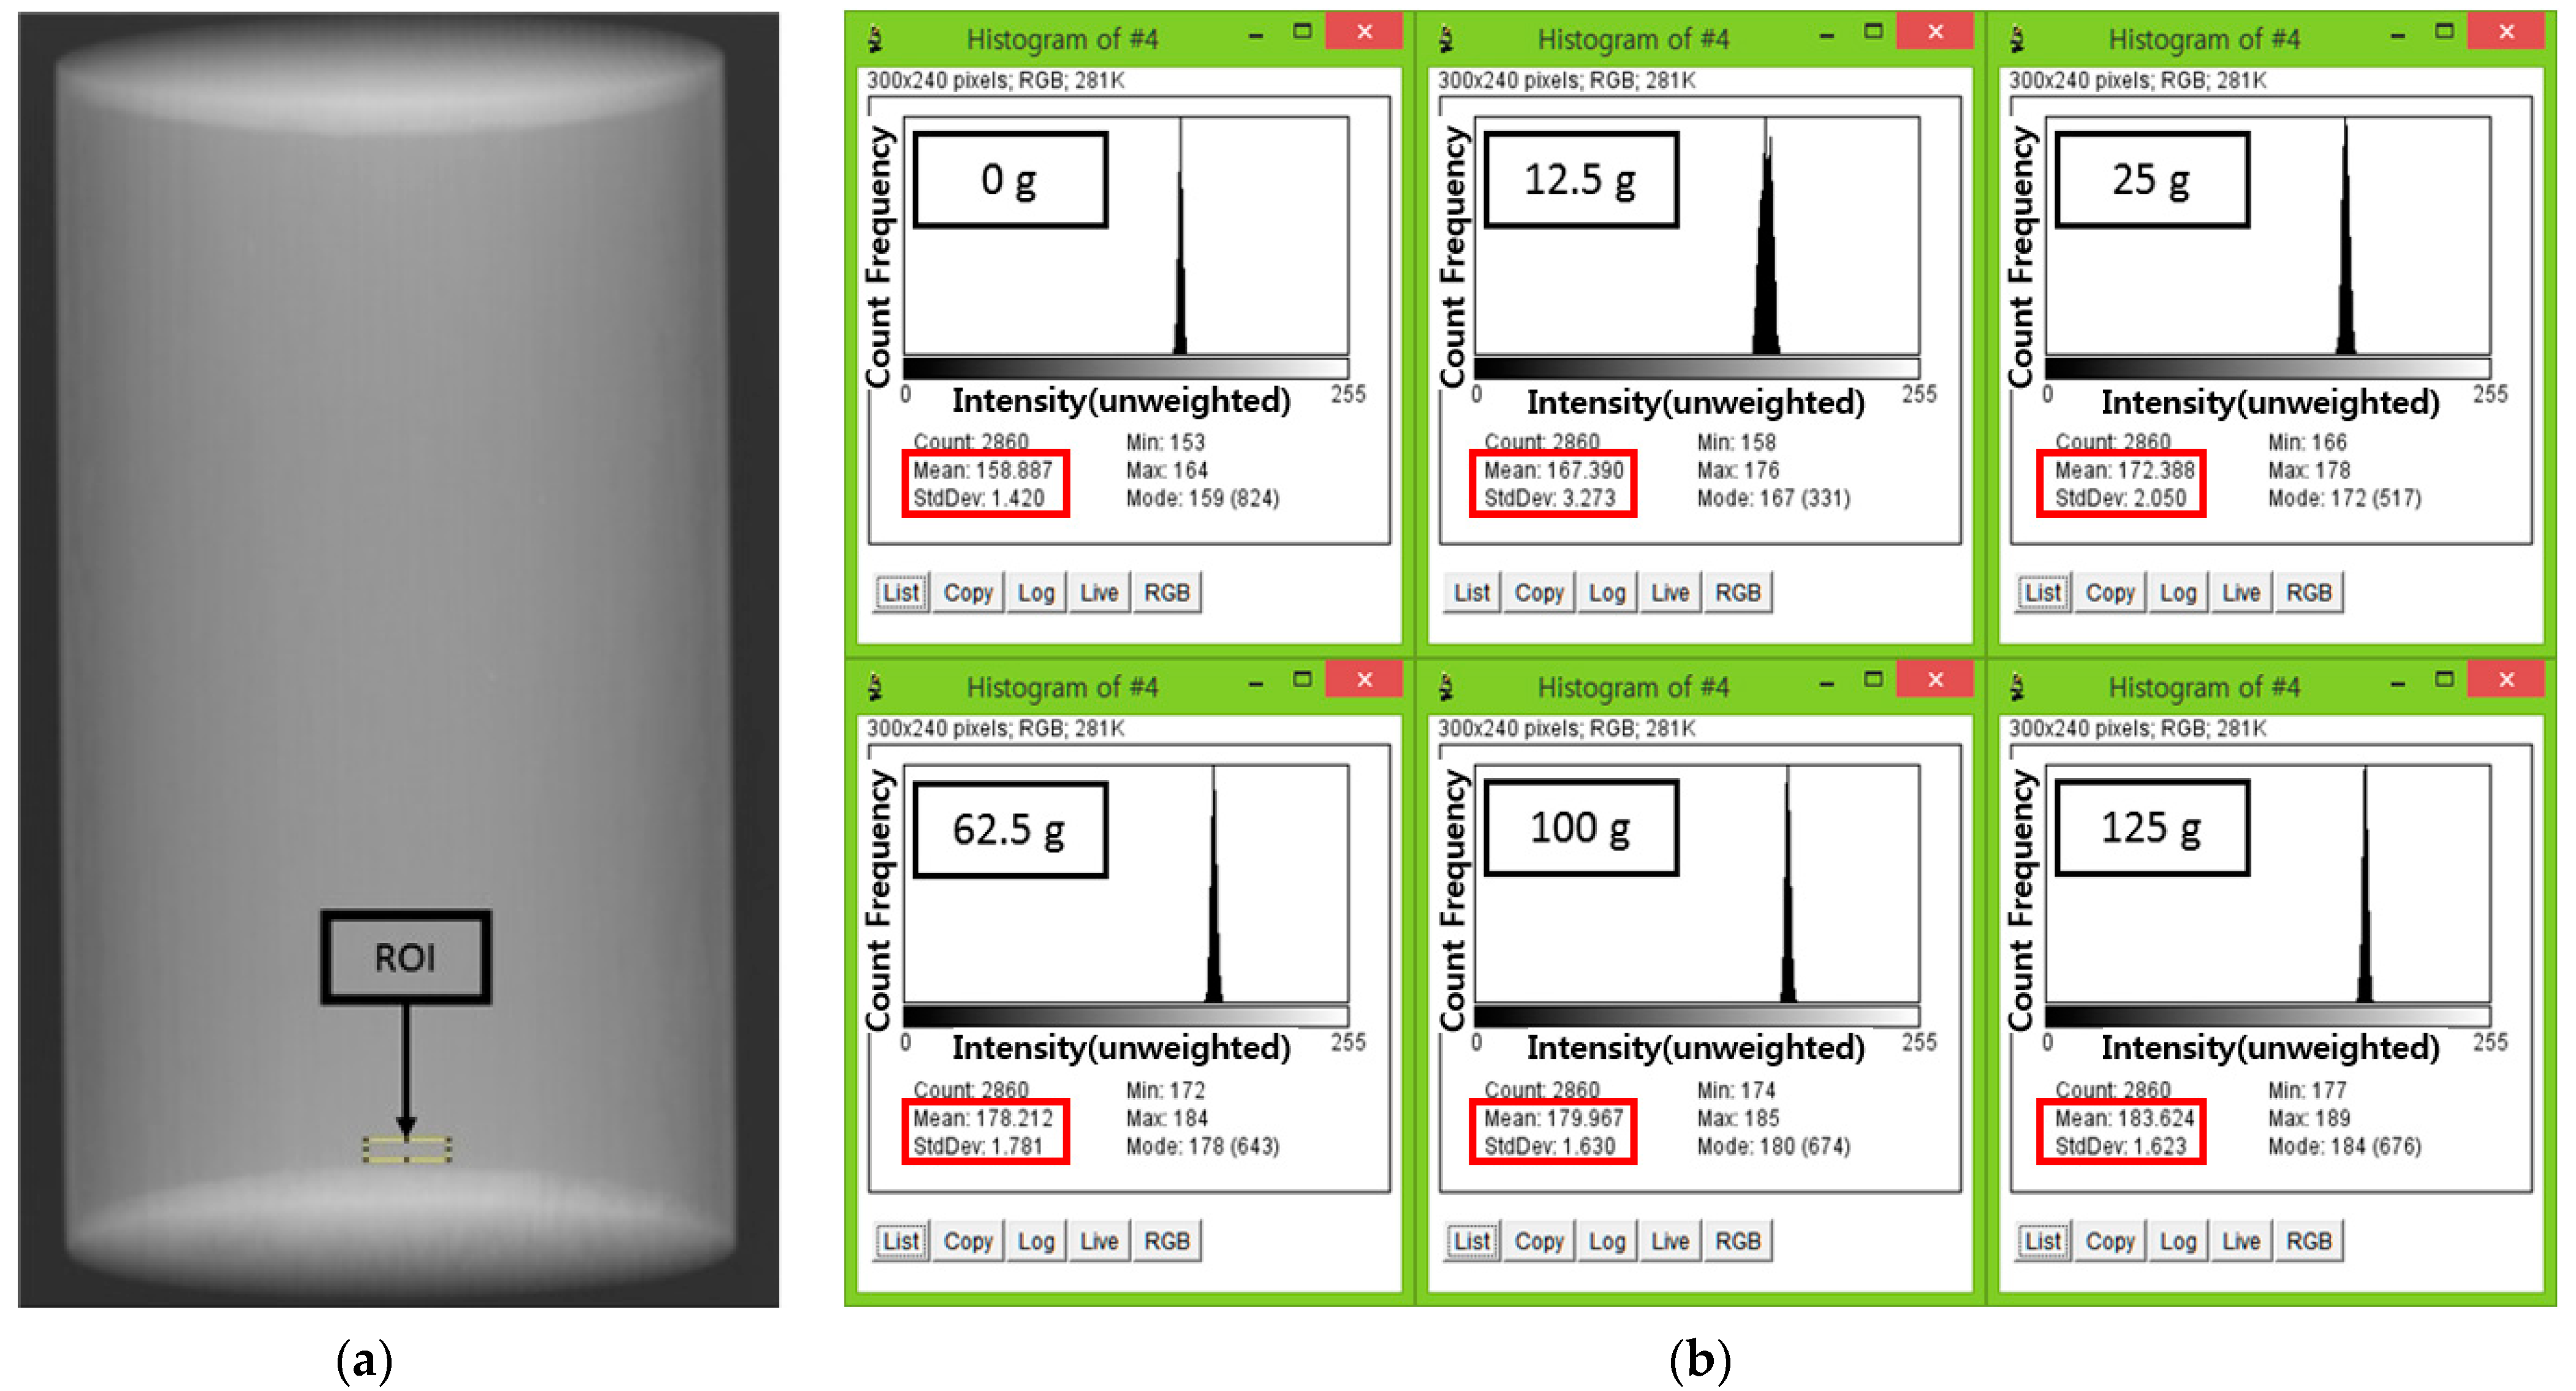
As the area where carbon powder was accumulated was shown in extremely pale white on the images, it is not easy to visually determine whether it was actually accumulated. For this reason, an analysis was attempted to check the accumulation status with the pixel values after setting the center of the outlet of the substrate as the ROI with Image J and comparing the values with those of the new substrate (Figure 7a). Before setting the ROI, it was identified through Image J that the resolution of each carbon powder image was 1430 × 1722 pixels. The identical location and size (300 × 240 pixels) of each image were set as ROI, and the average pixel value and the standard deviation data were produced using the histogram feature (Figure 7b).
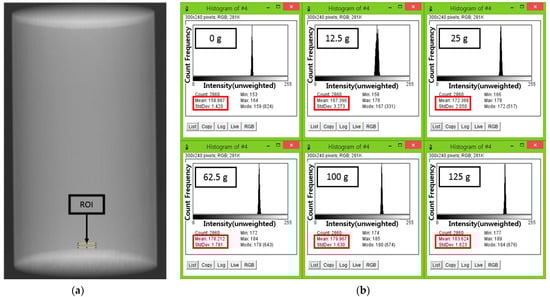
Figure 7.
Images analysis using Image J as (a) the ROI size and position and (b) histograms for each accumulation condition.
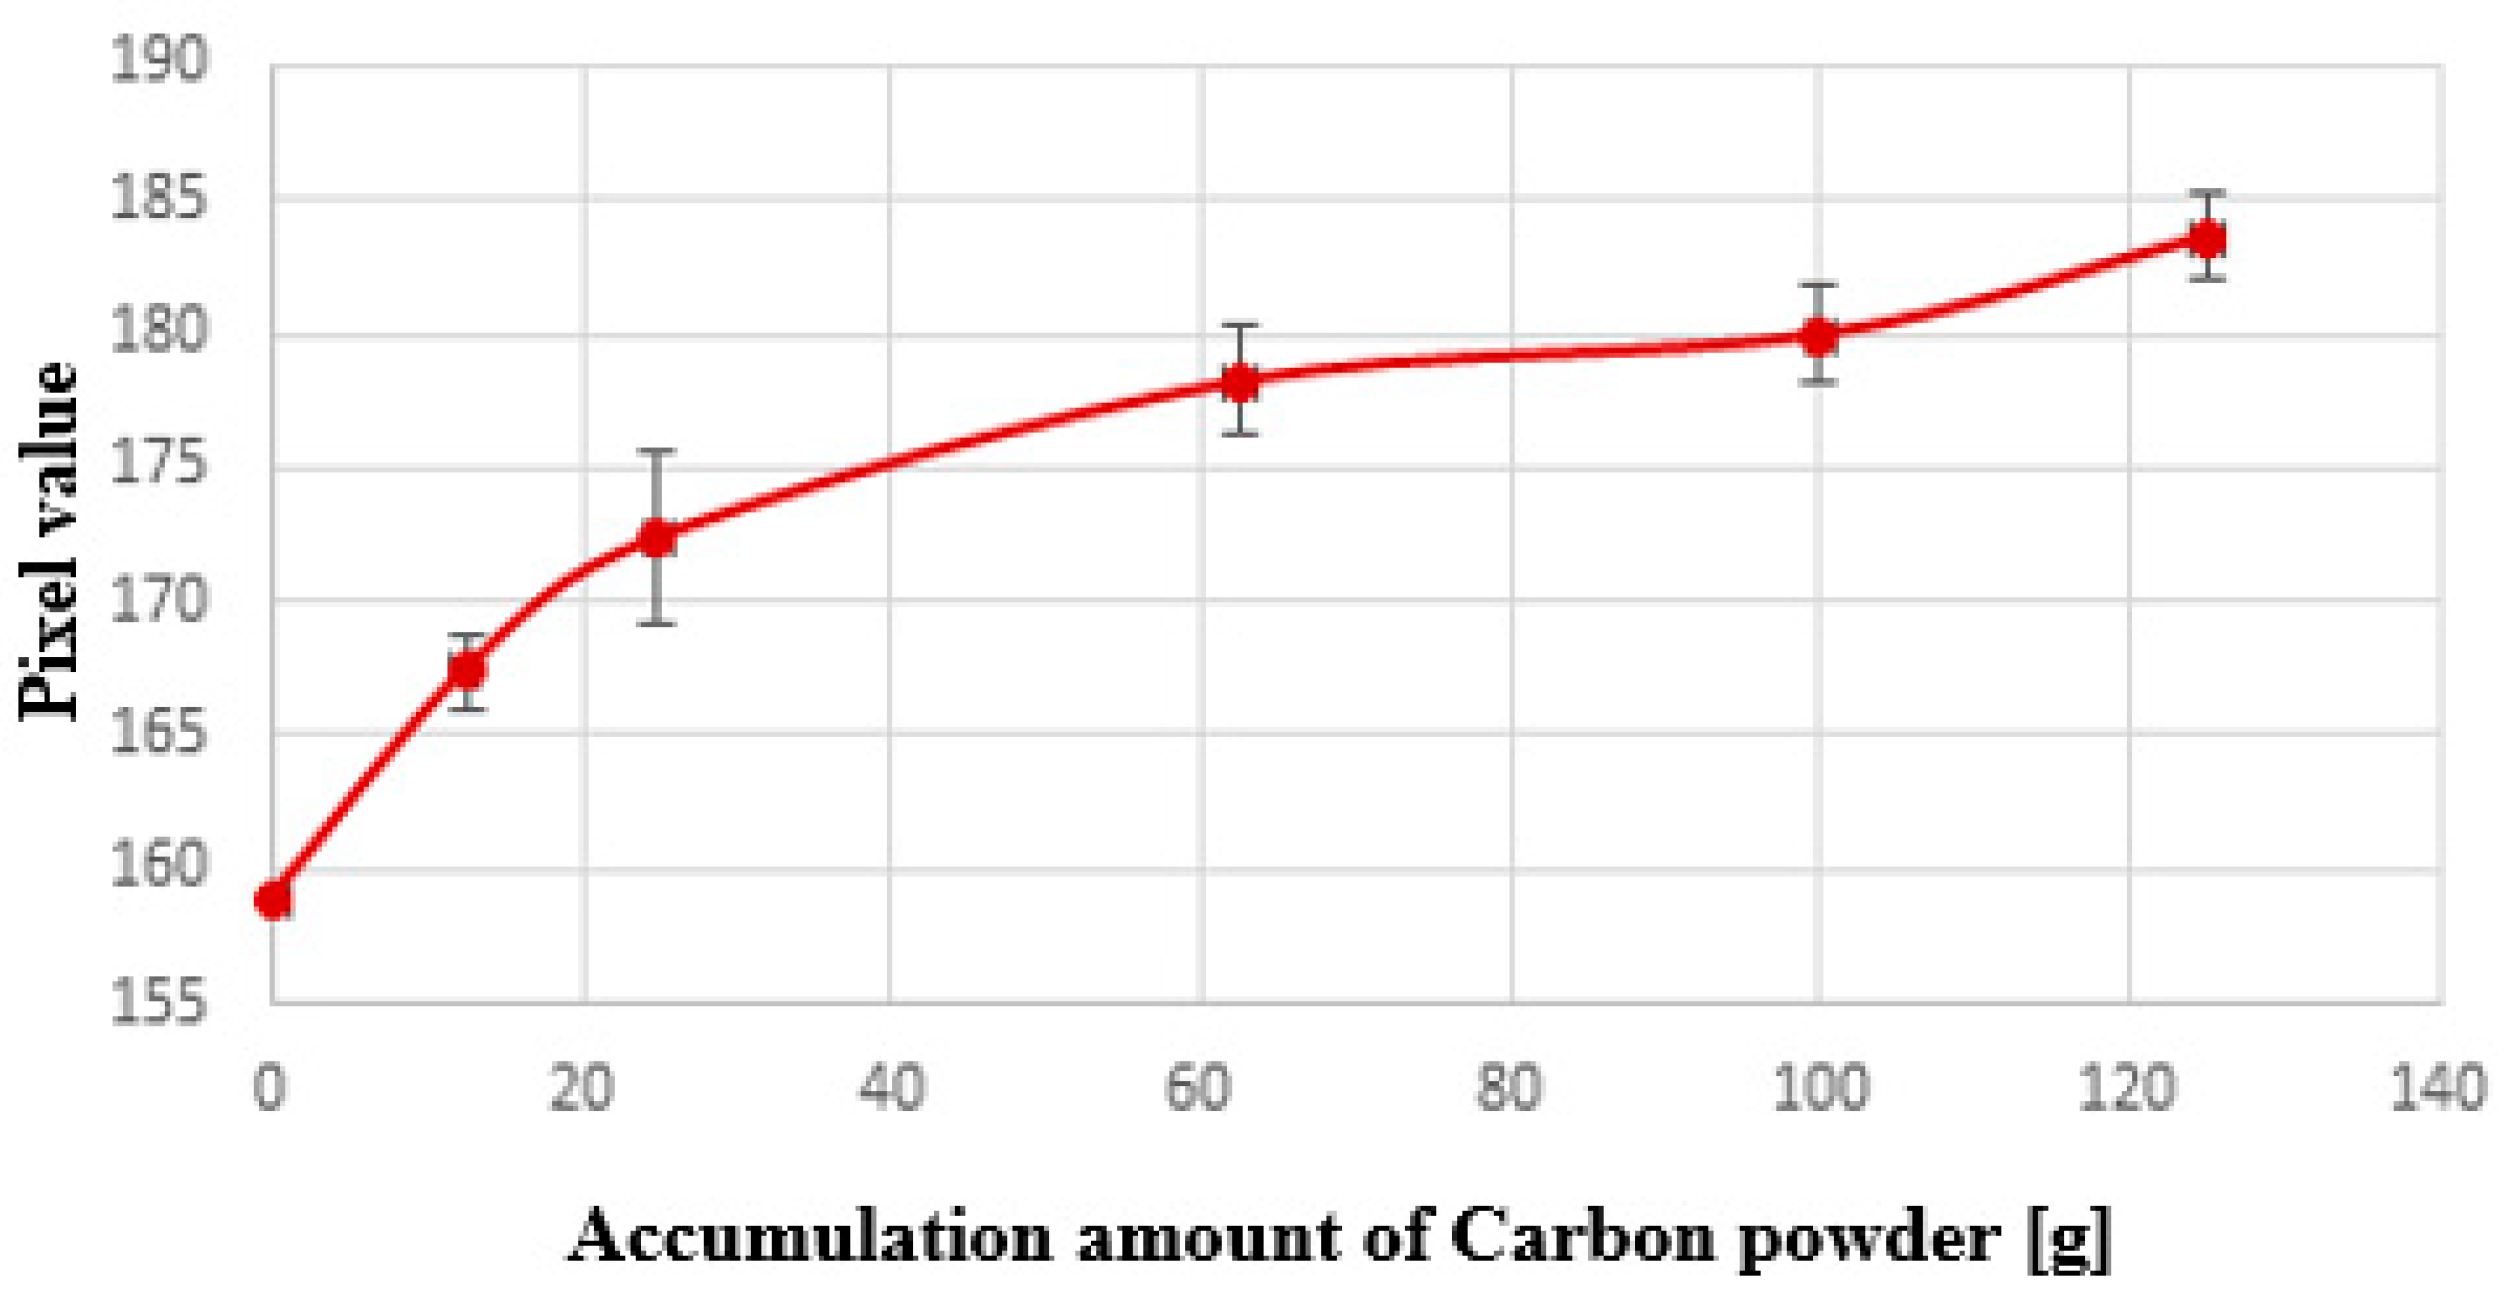
The data are given in Figure 8 and Table 6. The gap between the pixel value of the substrate with 12.5 g of carbon powder, whose accumulation was dimly visible on the image, and that of the new substrate was 8.503, which is deemed valid, given the standard deviation of the pixel value. The larger the accumulated quantity becomes, the higher the gap with the pixel value of the new substrate gets, indicating that it is possible to analyze the accumulation status.

Figure 8.
The graph of pixel values according to carbon powder accumulation condition.
Table 6.
Pixel values according to each accumulation condition (carbon powder).
3.1.3. Results from Images of Substrate with Accumulated Ash Powder
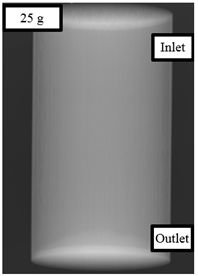
X-ray images of the substrate with ash powder in four different quantities—12.5 g, 25 g, 100 g, and 125 g—were taken to compare their pixel values with those from the images of carbon powder accumulation, and they are shown in Table 7. As for Table 7a, depicting the substrate with 12.5 g of ash powder, the plug and the upper part of the plug are shown in white more than those in Table 5a, displaying the new substrate due to the accumulation of ash powder. In the case of Table 7b, with 25 g of ash powder, the area accumulated with ash powder on the outlet of the substrate appeared white clearly and was easily observable. Even in Table 7c, with 100 g of ash powder, and Table 7d, with 125 g of ash powder, both of which were excessive in quantity, the accumulation status was easily visually identifiable.
Table 7.
The substrate images of four different conditions (ash powder from 12.5 g to 125 g).
3.1.4. Analysis of Images of Substrate with Accumulated Ash Powder
The resolution of each ash powder image was identified to be the same 1430 × 1722 pixels as the carbon powder images. In addition, pixel values, shown in Figure 9 and Table 8, were obtained through histograms by setting the same ROI as in the analysis on the images of carbon powder accumulation. The gap between the pixel value of the substrate with the least accumulated ash powder of 12.5 g and that of the new substrate was 18.998, which is deemed valid considering the standard deviation. Therefore, it is confirmed that it is also possible to analyze the status of ash accumulation, as with carbon powder accumulation.
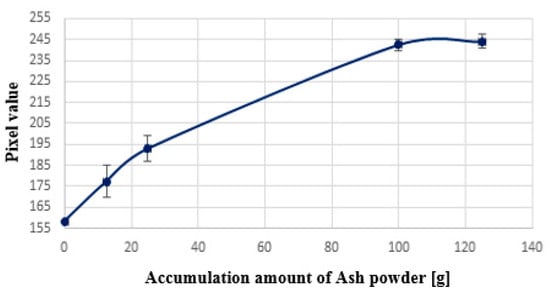
Figure 9.
The graph of pixel values according to ash powder accumulation condition.
Table 8.
Pixel values according to each accumulation condition (ash powder).
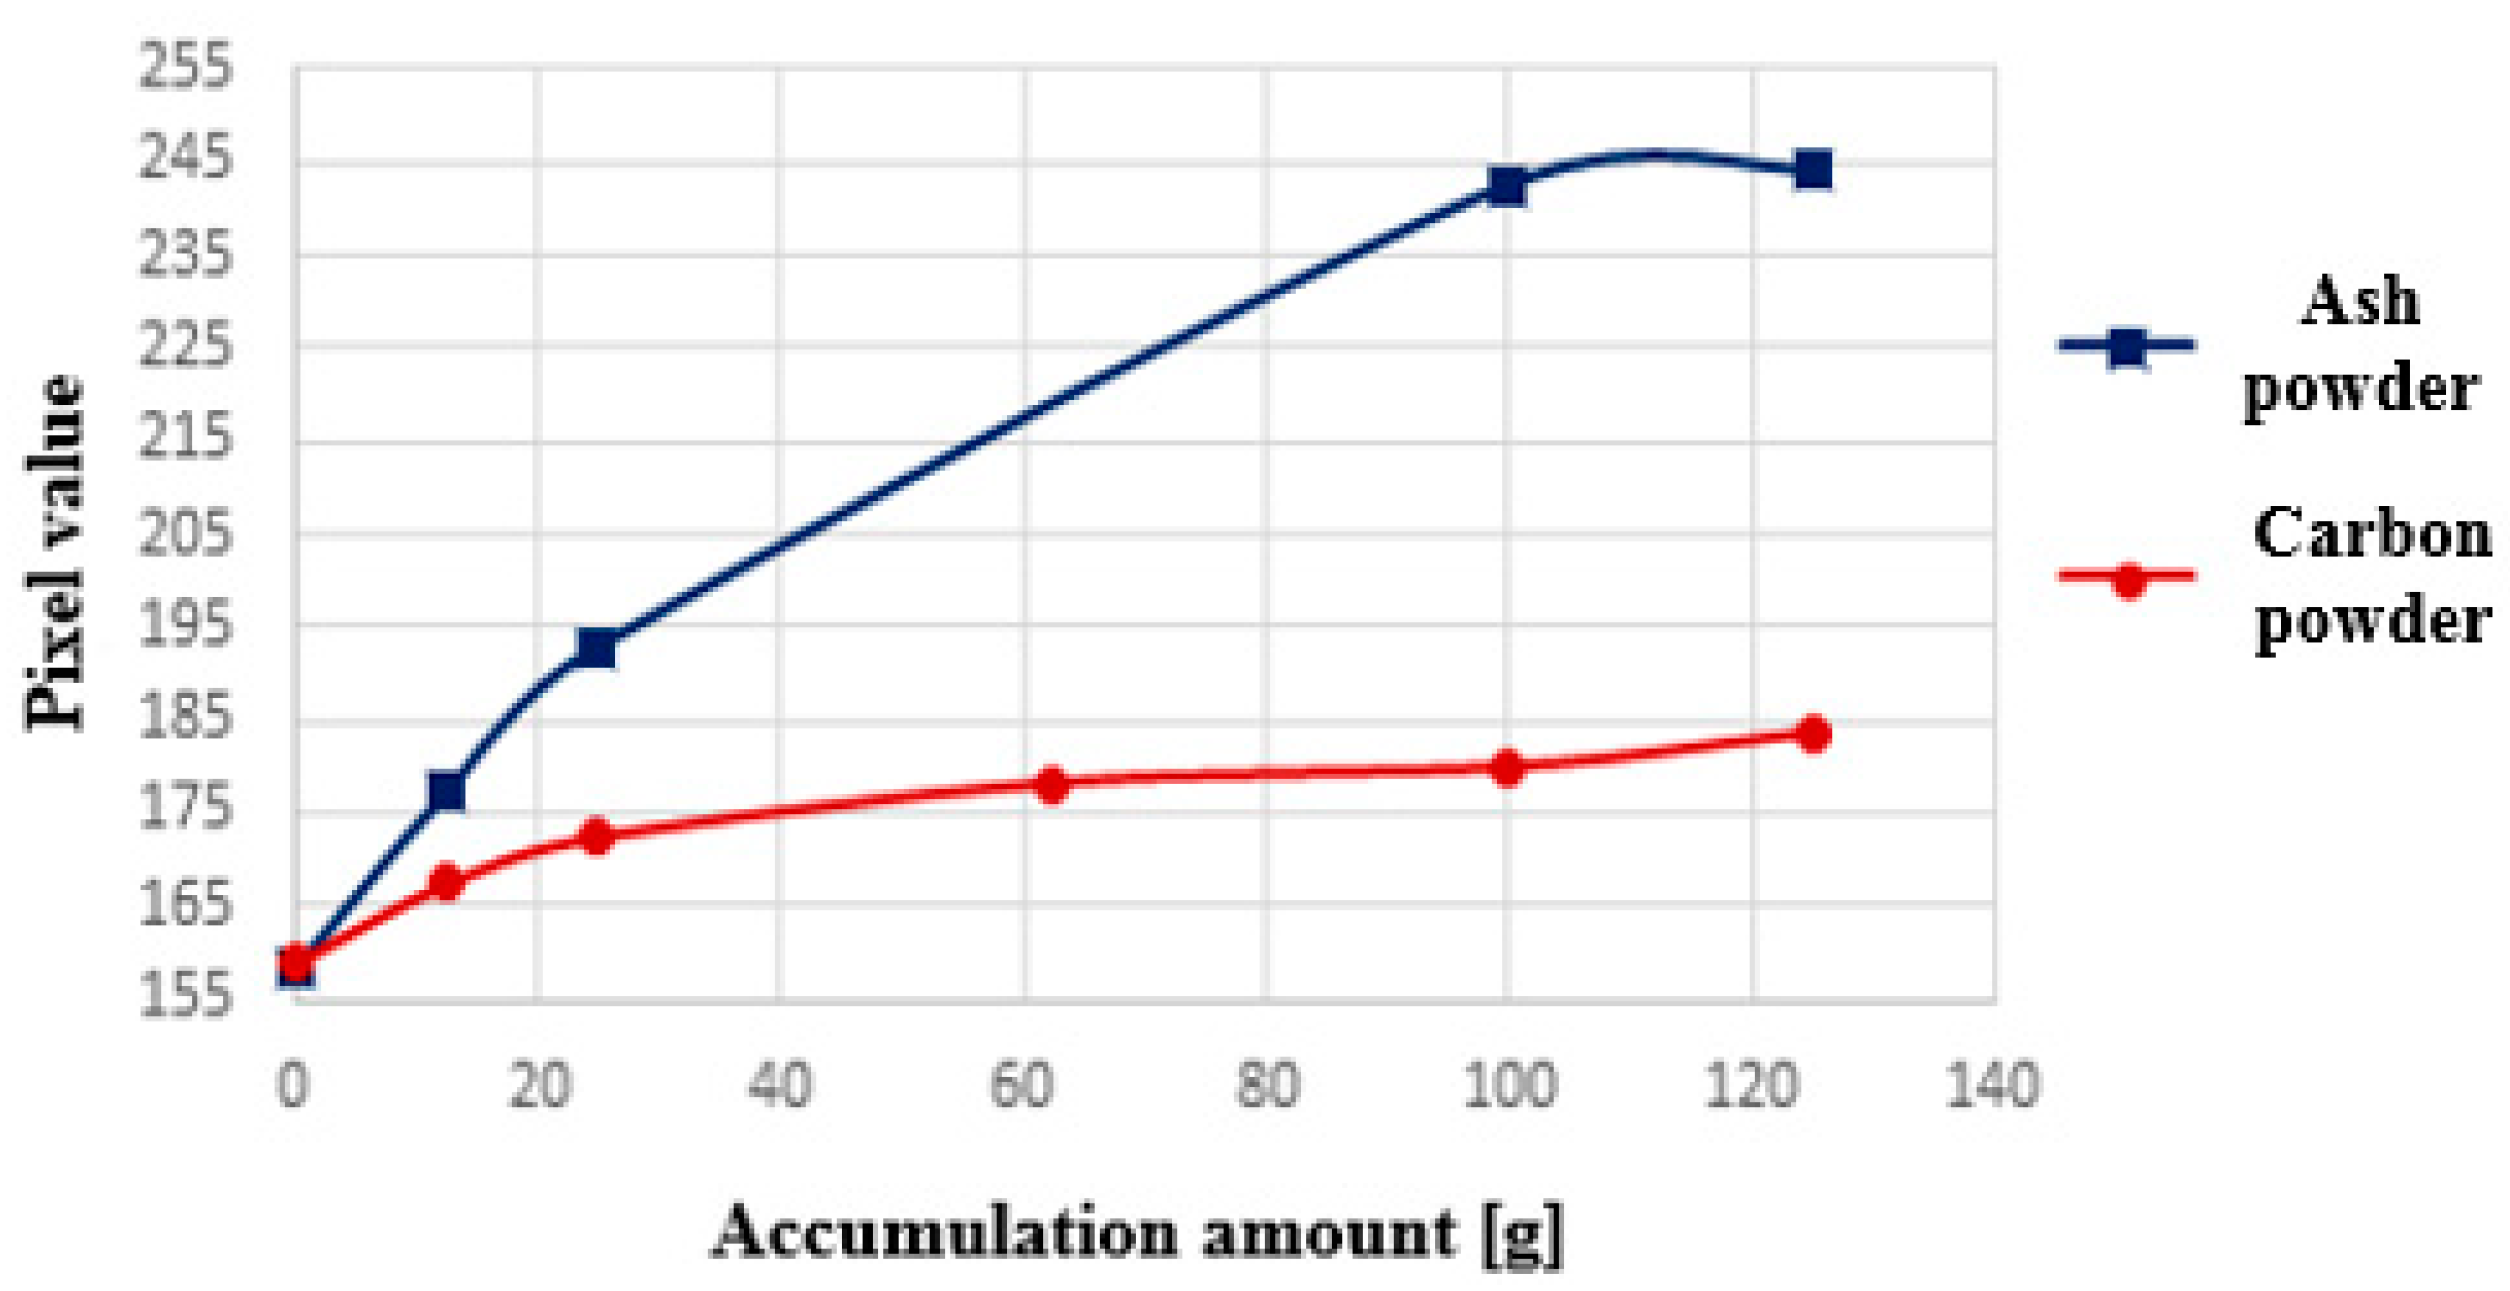
3.2. Comparison between Pixel Values of Carbon Powder and Ash Powder
A comparison between the images of carbon powder accumulation and those of ash powder accumulation through a visual observation indicated that the area of accumulated ash appeared relatively whiter (Table 9). A graph comparing an increase in pixel values upon the accumulation of carbon powder and of ash powder, measured at the same ROI, is given in Figure 10. As for the images of ash powder, when the accumulated quantity gets higher, the pixel value dramatically increases. Ash consists of elements with higher atomic numbers than carbon, as they are generally derived from engine oil. Therefore, it is denser than carbon powder, resulting in a lower X-ray transmittance, which leads to an assumption that a certain area appears whiter in the images.
Table 9.
Visual comparison of carbon powder accumulation and ash powder accumulation.

Figure 10.
Pixel values comparison of carbon powder and ash powder.
It is confirmed that it is possible to analyze the accumulation status through CR X-ray imaging when ash is accumulated on the substrate. Therefore, it is deemed possible to observe the accumulation of ash remnants after the regeneration process by taking a CR X-ray to the DPF equipped with a canister. As for the PM accumulation, it is estimated to be difficult to tell whether it is accumulated through a visual observation as it is mainly made of carbon; however, it is possible to conduct an analysis based on pixel values.
3.3. Summary of Verification Results and Observations
It is confirmed that the area accumulated with carbon powder or with ash powder appeared white based on CR X-ray images and that the color of the area of accumulated ash powder was whiter. In addition, it is verified that it is possible to analyze the accumulation status by comparing pixel values produced by Image J. Therefore, this study shows that it is confirmed to be technically possible to diagnose the accumulation status of soot and ash using the CR X-ray imaging technique and Image J. However, although the qualitative evaluation through CR X-ray images has been sufficiently proven, the numerical values obtained through Image J are only pixel values, so it is not enough to be called a quantitative evaluation. In order for the pixel values obtained to be demonstrated by quantitative evaluation, additional studies are needed, such as uncertainty analysis. In addition, as the substrate without canister was photographed, research is necessary to analyze whether soot and ash are accumulated in the DPF of in-use vehicles, and more thought should be given to the adaptability of the technique.
In recent years, various radiation studies have been conducted, including experiments to evaluate X-ray-radian and gamma-radian-based systems using Monte Carlo radiation transmission tools [17,18,19,20]. The CR X-ray imaging technique is expected to make contributions to the environment by diagnosing whether a DPF is damaged and detecting illegal remodeling at vehicle inspection stations. It is also expected to be used for various purposes, such as for DPF cleaning shops and retrofit manufacturers to determine whether the DPF is sustainably usable after a cleaning process or needs to be repaired. As portable X-ray systems and flexibly bendable IP are produced and sold in mass quantities, the technique is deemed easily accessible.
4. Conclusions
- This study assessed whether it is possible to quantitatively evaluate the accumulation status of soot and ash utilizing the CR X-ray imaging technique and Image J. Respective X-ray images were taken after cumulating carbon powder, similar to soot, on the DPF substrate, in quantities of 12.5 g, 25 g, 62.5 g, 100 g, and 125 g. Later, X-ray images were filmed after placing 12.5 g, 25 g, 100 g, and 125 g of ash powder in a new substrate to conduct a comparative analysis of the produced images.
- As the accumulated carbon powder and ash powder increased in quantity, the images of carbon powder accumulation showed the upper part of the plug of the substrate being colored paler white, whereas those of ash powder displayed deeper white color. An analysis of the pixel values using the histogram and ROI features of Image J confirmed that ash powder had a higher pixel value than carbon powder did. As ash demonstrates a higher density than that of carbon powder due to their composition of components deriving mainly from engine oil, it leads to a lower X-ray transmittance, which is presumed to make the images appear whiter.
- This study confirms that it is possible to identify the accumulation status of soot and ash on the DPF substrate. However, although the qualitative evaluation was verified, additional uncertainty studies are needed to verify the quantitative evaluation. In addition, further research is required on the accumulation analysis of soot and ash on the DPF of an in-use vehicle with canister and verification activities on the economic aspects and safety.
Author Contributions
Conceptualization, S.L.; Methodology, G.P. and M.K.; investigation, M.K. and H.R.; Supervision, S.L.; Writing—original draft, G.P. and H.R.; Writing—review and editing, G.P., H.R. and S.L. All authors have read and agreed to the published version of the manuscript.
Funding
This research was supported partly by the Korea Environment Industry & Technology Institute (KEITI), through the Reduction Management Program of Fine Dust Blind-Spots grant funded by the Korea government (MOE; Ministry of Environment) (No. 2020003070001) and partly by the National Research Foundation (NRF), Korea, through BK21 Program grant funded by the Korea government (MOE; Ministry of Education) (No. 5199990814084).
Institutional Review Board Statement
Not applicable.
Informed Consent Statement
Not applicable.
Data Availability Statement
All necessary data have been reported in this article and there are no other data to share.
Acknowledgments
The authors thank the research scientists at the Korea University Department of Health Safety Convergence Science for their assistance in this study.
Conflicts of Interest
The authors declare no conflict of interest.
Abbreviations
The following abbreviations are used in this manuscript:
| DPF | Diesel Particulate Filter |
| PM | Particulate Matter |
| OBD | On-Board Diagnostics |
| DR | Digital Radiography |
| FPD | Flat Panel Detector |
| CR | Computed Radiography |
| IP | Imaging Plate |
| CT | Computed Tomography |
| CPSI | Cells per Square Inch |
| A/D | Analog to Digital |
| ROI | Region of Interest |
References
- Sin, D.C.; Song, S.S. A data book on the debate forum of automotive particulate matter reduction for the spread of eco-friendly transportation culture. In Proceedings of the 2018 Debate Forum on Automotive Particulate Matter Reduction, The National Assembly, Seoul, Korea, 18 April 2018; p. 42. Available online: https://ampos.nanet.go.kr:7443/materialSeminarDetail.do?control_no=PAMP1000056519 (accessed on 13 January 2021).
- Kim, W.S.; Kim, J.A. Policy Option to Manage High-Pollution On-Road Diesel Vehicles Based on Excessive Emission Grades in Seoul; The Seoul Institute: Seoul, Korea, 2015; pp. 21–27. Available online: https://www.si.re.kr/taxonomy/term/21583 (accessed on 13 January 2021).
- Kwon, M.J.; Park, G.Y.; Lim, H.J.; Kim, J.J.; Kim, K.H.; Song, H.Y.; Lee, S.W. A study on the performance deterioration of SCR for heavy-duty diesel vehicles. SAE Pap. 2019, 1, 2235. [Google Scholar]
- Korea Ministry of Environment (MOE). Comprehensive Plan Report of Measures for Particulate Matter Management. 2019. Available online: http://www.me.go.kr/home/web/policy_data/read.do?pagerOffset=0&maxPageItems=10&maxIndexPages=10&searchKey=title&searchValue=%EB%AF%B8%EC%84%B8%EB%A8%BC%EC%A7%80&menuId=10259&orgCd=&condition.deleteYn=N&seq=7399 (accessed on 13 January 2021).
- Merkel, G.A.; Cutler, W.A.; Warren, C.J. Thermal durability of wall-flow ceramic diesel particulate filters. SAE Pap. 2001, 1, 190. [Google Scholar]
- Rah, W.Y. PM reduction efficiency using metal type DPF. Trans. Korean Soc. Automot. Eng. 2013, 21, 176–180. [Google Scholar]
- Zhang, X.; Tennison, P.; Schram, T. 3D Numerical study of pressure loss characteristics and Soot leakage through a damaged DPF. SAE Pap. 2009, 1, 1267. [Google Scholar] [CrossRef]
- Calzada, E.; Schillinger, B.; Grunauer, F. Construction and assembly of the neutron radiography and tomography facility ANTARES at FRM II. Nucl. Instrum. Methods Phys. Res. A 2005, 542, 38–44. [Google Scholar] [CrossRef]
- Ismail, B.; Ewing, D.; Chang, J.; Cotton, J. Development of a non-destructive neutron radiography technique to measure the three dimensional Soot deposition profiles in diesel engine exhaust systems. J. Aerosol Sci. 2004, 35, 1275–1288. [Google Scholar] [CrossRef]
- Zandhuis, J.A.; Funney, C.E.A.; Toops, T.J.; Partridge, W.P.; Daw, C.S.; Fox, T. Nondestructive X-ray inspection of thermal damage, Soot and Ash distribution in diesel particulate filters. SAE Pap. 2009, 1, 289. [Google Scholar]
- Matsuno, M.; Kitamura, T.; Usui, Y.; Kusaka, J.; Fukuma, T.; Takeda, Y.; Kinoshita, K. Ash accumulation and transport in diesel particulate filters (Second report) –Impact of active Regeneration frequency on Ash distribution. Trans. Soc. Automot. Eng. Jpn. 2018, 49, 1199–1204. [Google Scholar]
- Usui, Y.; Ohashi, Y.; Morimoto, K.; Kusaka, J.; Fukuma, T.; Kitamura, T.; Matsuno, M.; Takeda, Y.; Kinoshita, K. Ash accumulation and transport in diesel particulate filters (First report)–quantification of Ash accumulation density distribution by X-ray CT Imaging–. Trans. Soc. Automot. Eng. Jpn. 2018, 49, 1193–1198. [Google Scholar]
- Jin, D.Y.; Myung, C.L.; Kim, J.H.; Park, S.S. Physicochemical analysis of two aged diesel particulate filters placed at close coupled and under floor positions of the vehicles. Int. J. Automot. Technol. 2019, 20, 327–335. [Google Scholar] [CrossRef]
- Kwon, M.J.; Park, G.Y.; Kim, S.J.; Han, T.H.; Kim, J.M.; Lee, S.W. Feasibility study on nondestructive measurement of damaged DPF using CR X-ray imaging technique. Trans. Korean Soc. Automot. Eng. 2019, 27, 795–801. [Google Scholar]
- Abramoff, M.D.; Magalhães, P.J.; Ram, S.J. Image processing with ImageJ. Biophotonics Int. 2003, 11, 36–42. [Google Scholar]
- Sappok, A.; Wong, V. Ash effects on diesel particulate filter pressure drop sensitivity to Soot and implications for Regeneration frequency and DPF control. SAE Pap. 2010, 1, 811. [Google Scholar] [CrossRef]
- Roshani, M.; Phan, G.; Roshani, G.H.; Hanus, R.; Nazemi, B.; Corniani, E.; Nazemi, E. Combination of X-ray tube and GMDH neural network as a nondestructive and potential technique for measuring characteristics of gas-oil–water three phase flows. Measurement 2021, 168, 108427. [Google Scholar] [CrossRef]
- Tomaru, R.; Done, C.; Ohsuga, K.; Odaka, H.; Takahashi, T. The thermal-radiative wind in low-mass X-ray binary H1743− 322–II. Iron line predictions from Monte Carlo radiation transfer. Mon. Not. R. Astron. Soc. 2020, 494, 3413–3421. [Google Scholar] [CrossRef]
- Roshani, M.; Phan, G.; Jammal, P.; Ali, M.; Roshani, G.H.; Hanus, R.; Duong, T.; Corniani, E.; Nazemi, E.; Kalmoun, E.M. Evaluation of flow pattern recognition and void fraction measurement in two phase flow independent of oil pipeline’s scale layer thickness. Alex. Eng. J. 2021, 60, 1955–1966. [Google Scholar] [CrossRef]
- Salgado, W.L.; Dam, R.S.D.F.; Teixeira, T.P.; Conti, C.C.; Salgado, C.M. Application of artificial intelligence in scale thickness prediction on offshore petroleum using a gamma-ray densitometer. Radiat. Phys. Chem. 2020, 168, 108549. [Google Scholar] [CrossRef]

Publisher’s Note: MDPI stays neutral with regard to jurisdictional claims in published maps and institutional affiliations. |
© 2021 by the authors. Licensee MDPI, Basel, Switzerland. This article is an open access article distributed under the terms and conditions of the Creative Commons Attribution (CC BY) license (https://creativecommons.org/licenses/by/4.0/).