Article

Buckling Test of Composite Cylindrical Shells with Large Radius Thickness Ratio

1
Department of Mechanical Engineering, Kanagawa University, 3-27-1, Rokkakubashi, Kanagawa-ku, Yokohama 221-8686, Japan
2
Research Institute for Engineering, Kanagawa University, 3-27-1, Rokkakubashi, Kanagawa-ku, Yokohama 221-8686, Japan
3
Graduate School of Engineering, Kanagawa University, 3-27-1, Rokkakubashi, Kanagawa-ku, Yokohama 221-8686, Japan
*
Author to whom correspondence should be addressed.
Appl. Sci. 2021, 11(2), 854; https://doi.org/10.3390/app11020854
Submission received: 9 December 2020 / Revised: 10 January 2021 / Accepted: 14 January 2021 / Published: 18 January 2021
(This article belongs to the Special Issue Selected Papers from IMETI 2020)

Abstract

:

Featured Application

Thin-walled composite cylindrical shells, due to their light weight, high stiffness and strength, can be applied to ultra-light weight rockets, fuselages of airplanes, satellites, and spacecraft.

Abstract

A buckling test of composite cylindrical shells with a radius–thickness ratio (r/t) = 893 under axial compression was conducted to investigate the effects of the radius–thickness ratio (r/t). It is known that the buckling load of cylinders shows large differences and scatter between theory and experiment. The ratio of the experimental buckling load and theoretical buckling load is called the knockdown factor (KDF). Many investigations have been conducted to find the cause of the degradation and scatter in the KDF, but as yet, no cause has been found. In 1968, NASA’s buckling design criterion, NASA SP-8007, gave an empirical KDF curve that decreased with the increasing r/t (up to 2000) for metal cylinders. The same curve has been applied to composite cylinders. Recently, Takano derived a flat lower-bound KDF in terms of A- and B-basis values (99% and 90% probability with a 95% confidence level) through a statistical analysis of experimental buckling loads. The result, however, based on experimental results up to r/t = 500 and, thus, the dependency on a large range of r/t, is not clear. Thus, the authors focused on a larger range of r/t. Cylindrical shells made from carbon fiber-reinforced plastic (CFRP) were tested. The nominal radius, thickness, and length were r = 100.118 mm, t = 0.118 mm, and L = 200 mm and, thus, the r/t = 848 and length-to-radius ratio (L/r) = 2.0. Shape imperfections were also measured by using in-house laser displacement equipment. The buckling load was slightly affected by the r/t, but the reduction in the KDF was insignificant.

1. Introduction

The scatter and deviation of the buckling load between theory and experiment have been studied since the 1960s, but the cause of the scatter and deviation has yet to be revealed. One potential cause is thought to be shape imperfection. Studies using a nonlinear finite element analysis, including of the measured shape imperfection, have given 5–10% larger results than the experimental buckling loads [1]. The method, however, cannot be used for prediction, because it requires the manufacturing of a cylinder and measurement of the shape imperfection. Regression analyses have further shown that various factors, including layup overlaps or gaps, the radius-to-thickness ratio (r/t), the length-to-radius ratio (L/r) [2], layup stiffness, and oval shape imperfection, are not statistically significant [3]. The authors investigated the effect of axisymmetric shape imperfections on the ratio of the experimental buckling load and theoretical buckling load, which is called the knockdown factor (KDF), and found that it increases with the amplitude of drum-type shape imperfections [4]. The investigation was conducted on nine cylinders; however, they were of the same radius r = 75 mm, and their r/t values were similar, i.e., from 460 to 670. On the other hand, many metal cylinders were investigated over a wide range of r/t (the data summarized in Reference [5]), and it was found that the KDF decreased with the increasing r/t [6], as shown in Figure 1.
Composite cylinders, however, show a constant relation between the KDF and r/t in a narrow range of r/t [7] (as shown later). Recently, several studies for the KDF of cylinders have been published; however, there was no study for a composite cylinder with the range of a r/t over 670 [8,9,10,11,12,13,14]. Wagner et al. [8] investigated the KDF of metal cylinders with single boundary perturbation approach. Wagner and Hühne’s [9] discussion about that led to new, improved knockdown factors for the design of cylindrical metal shells under axial compression. Tobias and Dieter [10] investigated the relationship between geometric imperfection and the KDF. Wagner et al. [11] presented a numerical design approach based on the reduced stiffness method for the buckling of shell structures. Although a lot of effort has gone into developing novel manufacturing and the production of composites [15,16,17,18], there has been no investigation into the KDF of composite tubes. Thus, the aim of the current study was to investigate the KDF over a large range of a r/t through buckling tests with r = 100 mm, t = 0.112 mm, and r/t = 893. Moreover, the effect of the shape imperfections was measured before and after the buckling tests, and the relationship between the shape imperfections and the KDF was investigated.

2. Test Specimens

2.1. Materials and Properties

Two cylindrical specimens (No. 191 and No. 192) were made from carbon fiber-reinforced plastic (CFRP) pre-preg HSX350C075S (Mitsubishi Chemical Co. Ltd., Hong Kong, China). Table 1 shows the material properties, and Table 2 shows the configurations of the specimens.

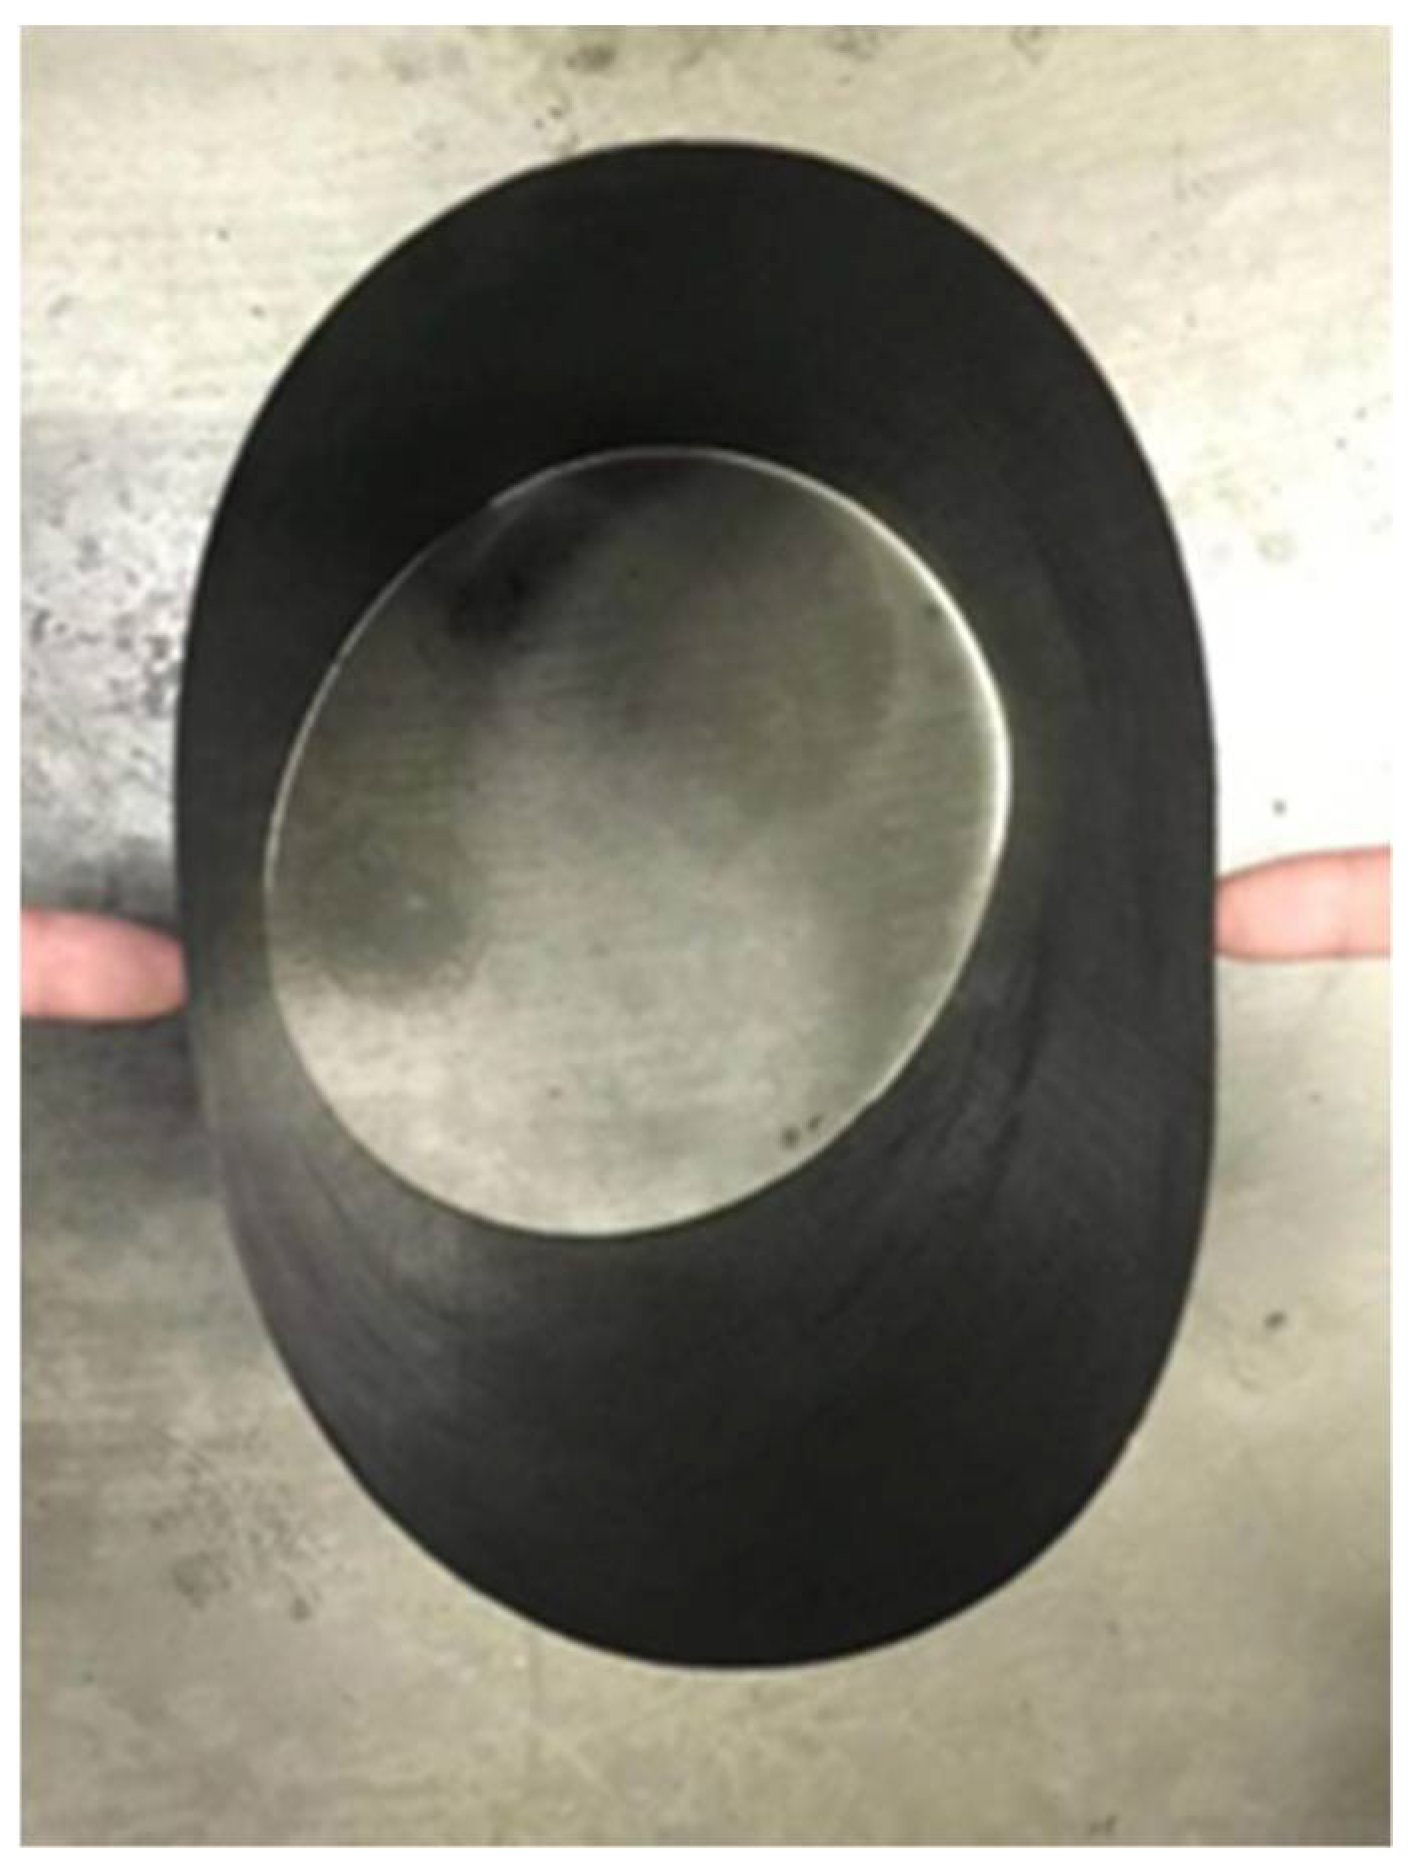
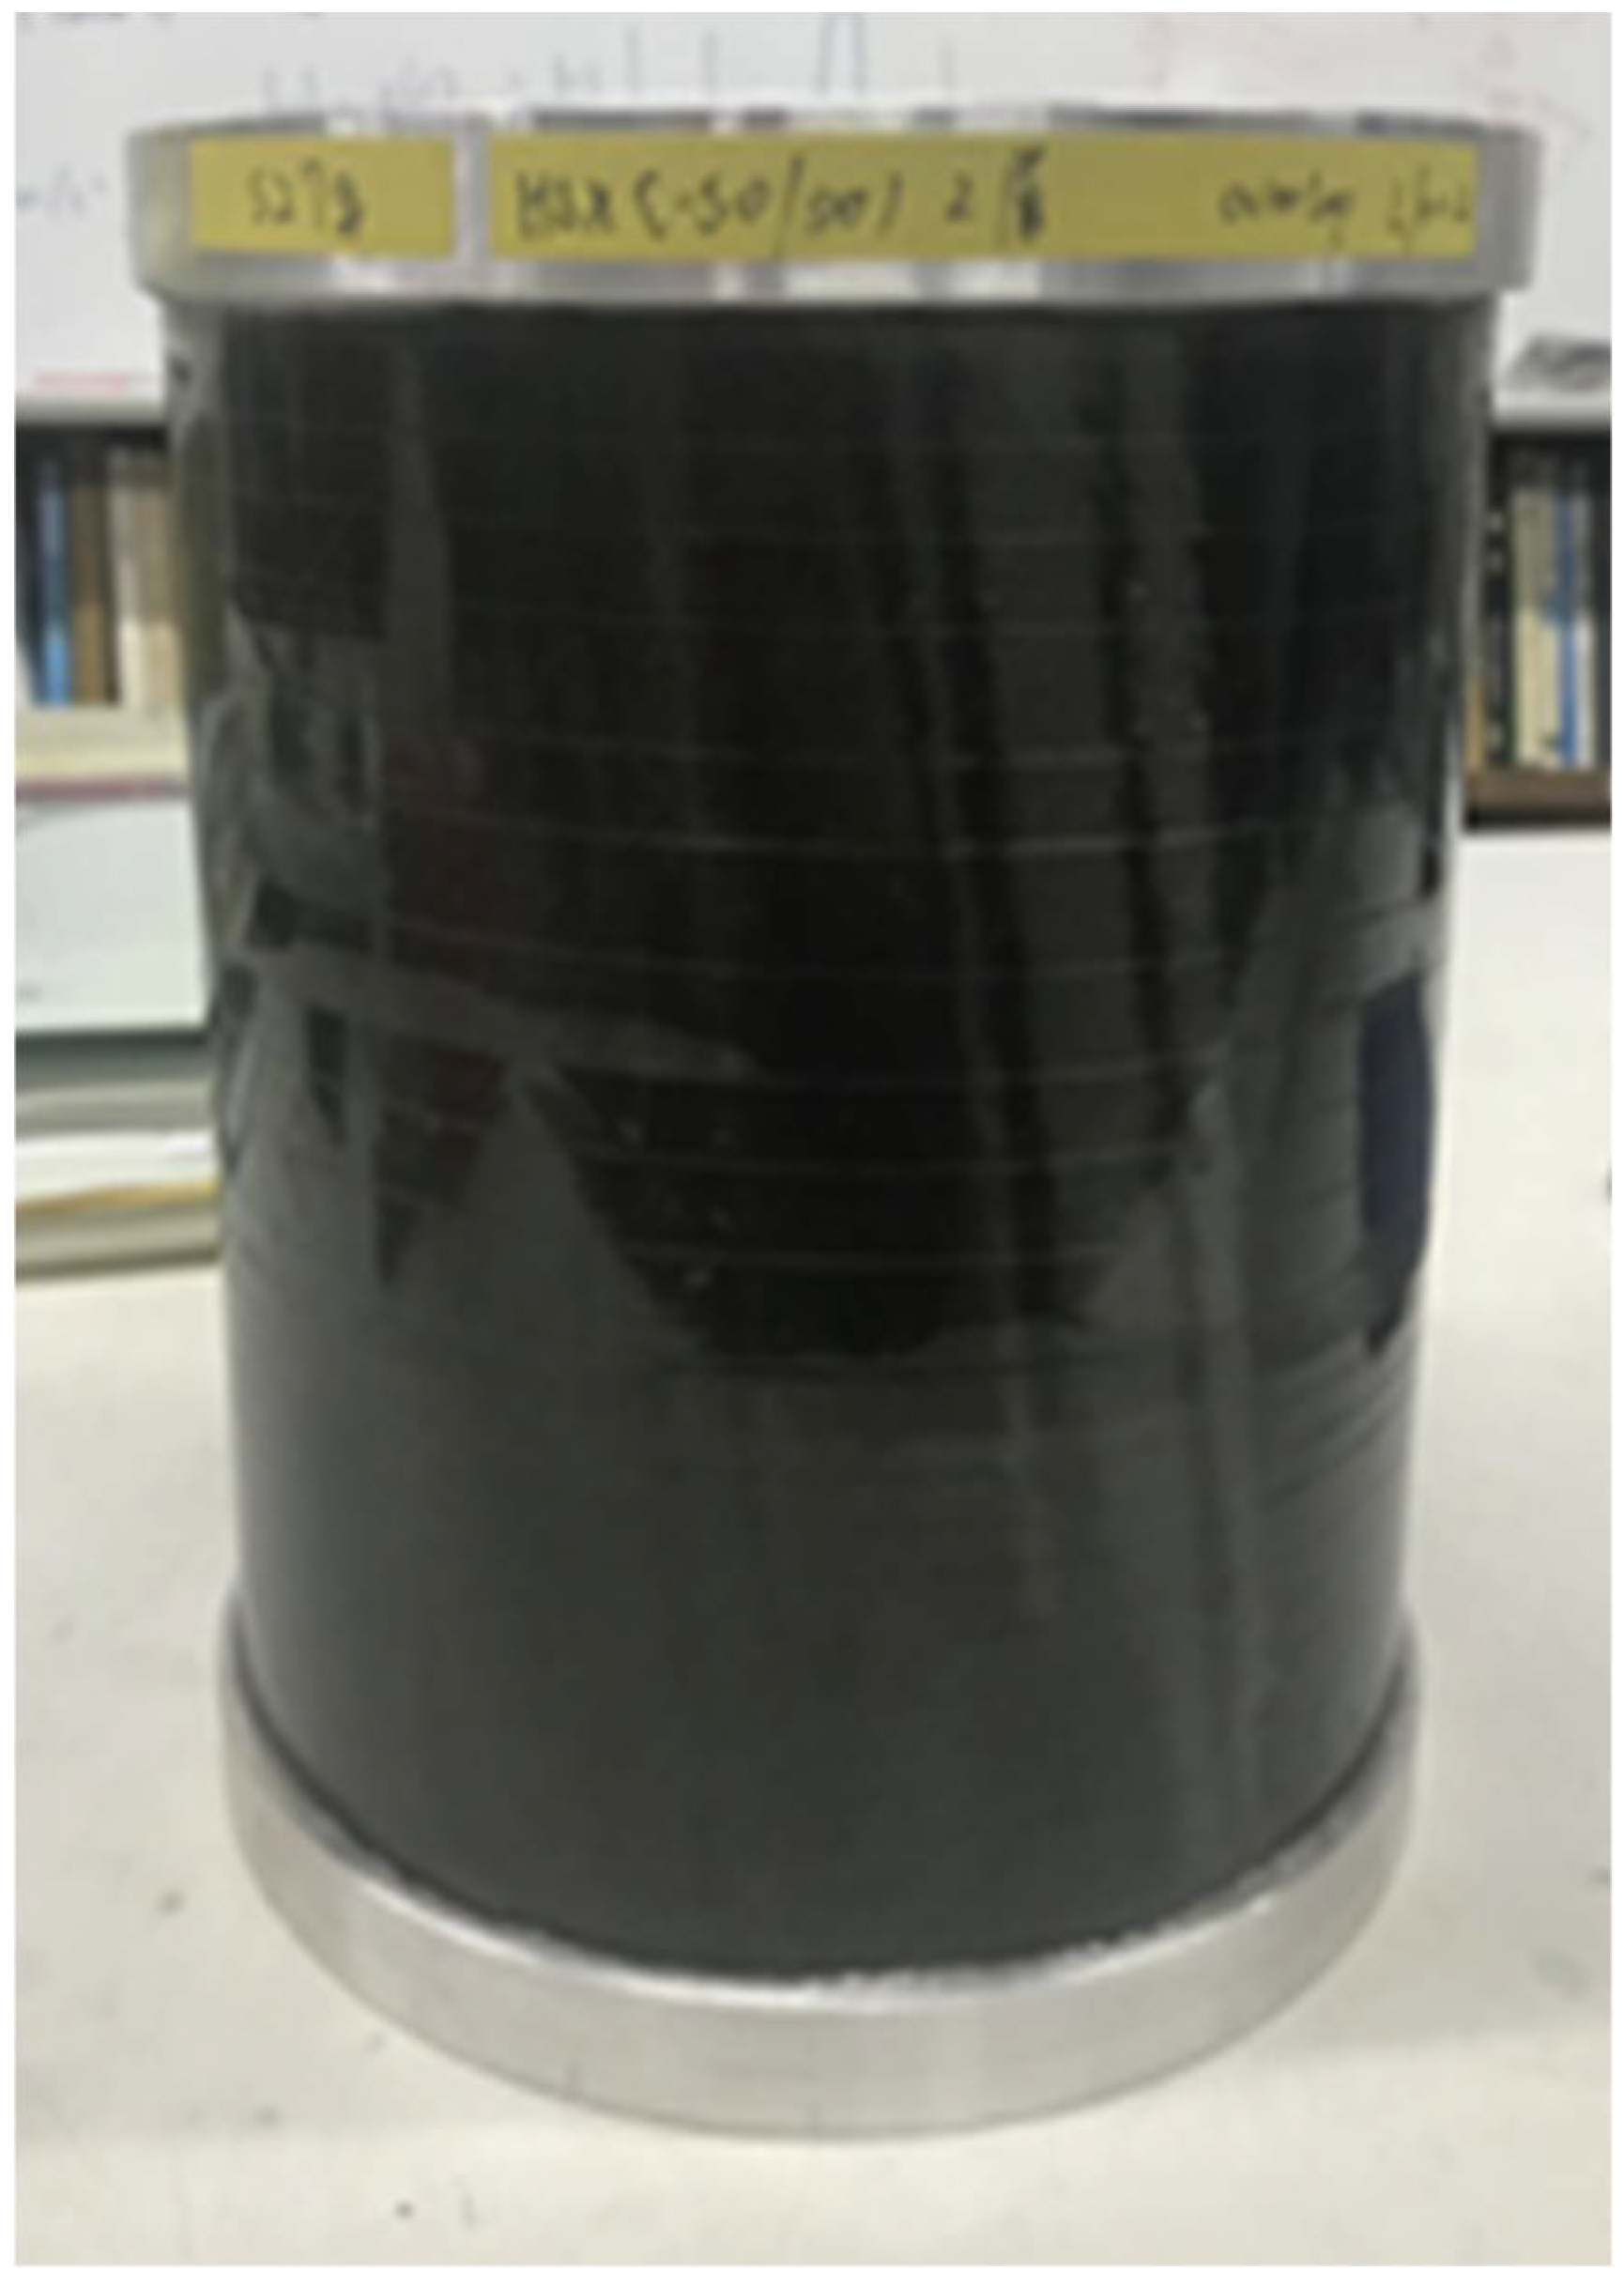
2.2. Manufacturing of Cylindrical Specimens

As shown in Figure 2, the cylinders were highly flexible and easily deformed by touch. Thus, to apply a compression load and keep the cylindrical shape, aluminum alloy end rings were bonded to the cylinders by using a bonding fixture, as shown in Figure 3. The bonding fixture aligned the center axis of both end rings without inclination. First, a fixture ring was set on the baseplate of the fixture, and then, the cylindrical specimen was set into the 2-mm-wide slot of the end ring, as shown in Figure 4. The cylindrical specimen was fixed using the alignment ring, as shown in Figure 5, and then, adhesive (AW106/HY953) was applied by syringe. To prevent thermal residual stress, the adhesive was cured at room temperature. After curing, the specimen with the bonded ring was removed, and the other end ring was set on the baseplate of the bonding fixture. Then, the other end of the specimen was inserted into the slot of the ring on the baseplate, and the bonded ring was fixed to the alignment plate, as shown in Figure 6. Adhesive was then applied to the ring on the baseplate by syringe, and it was cured at room temperature. The cylindrical specimen with both end rings is shown in Figure 7.

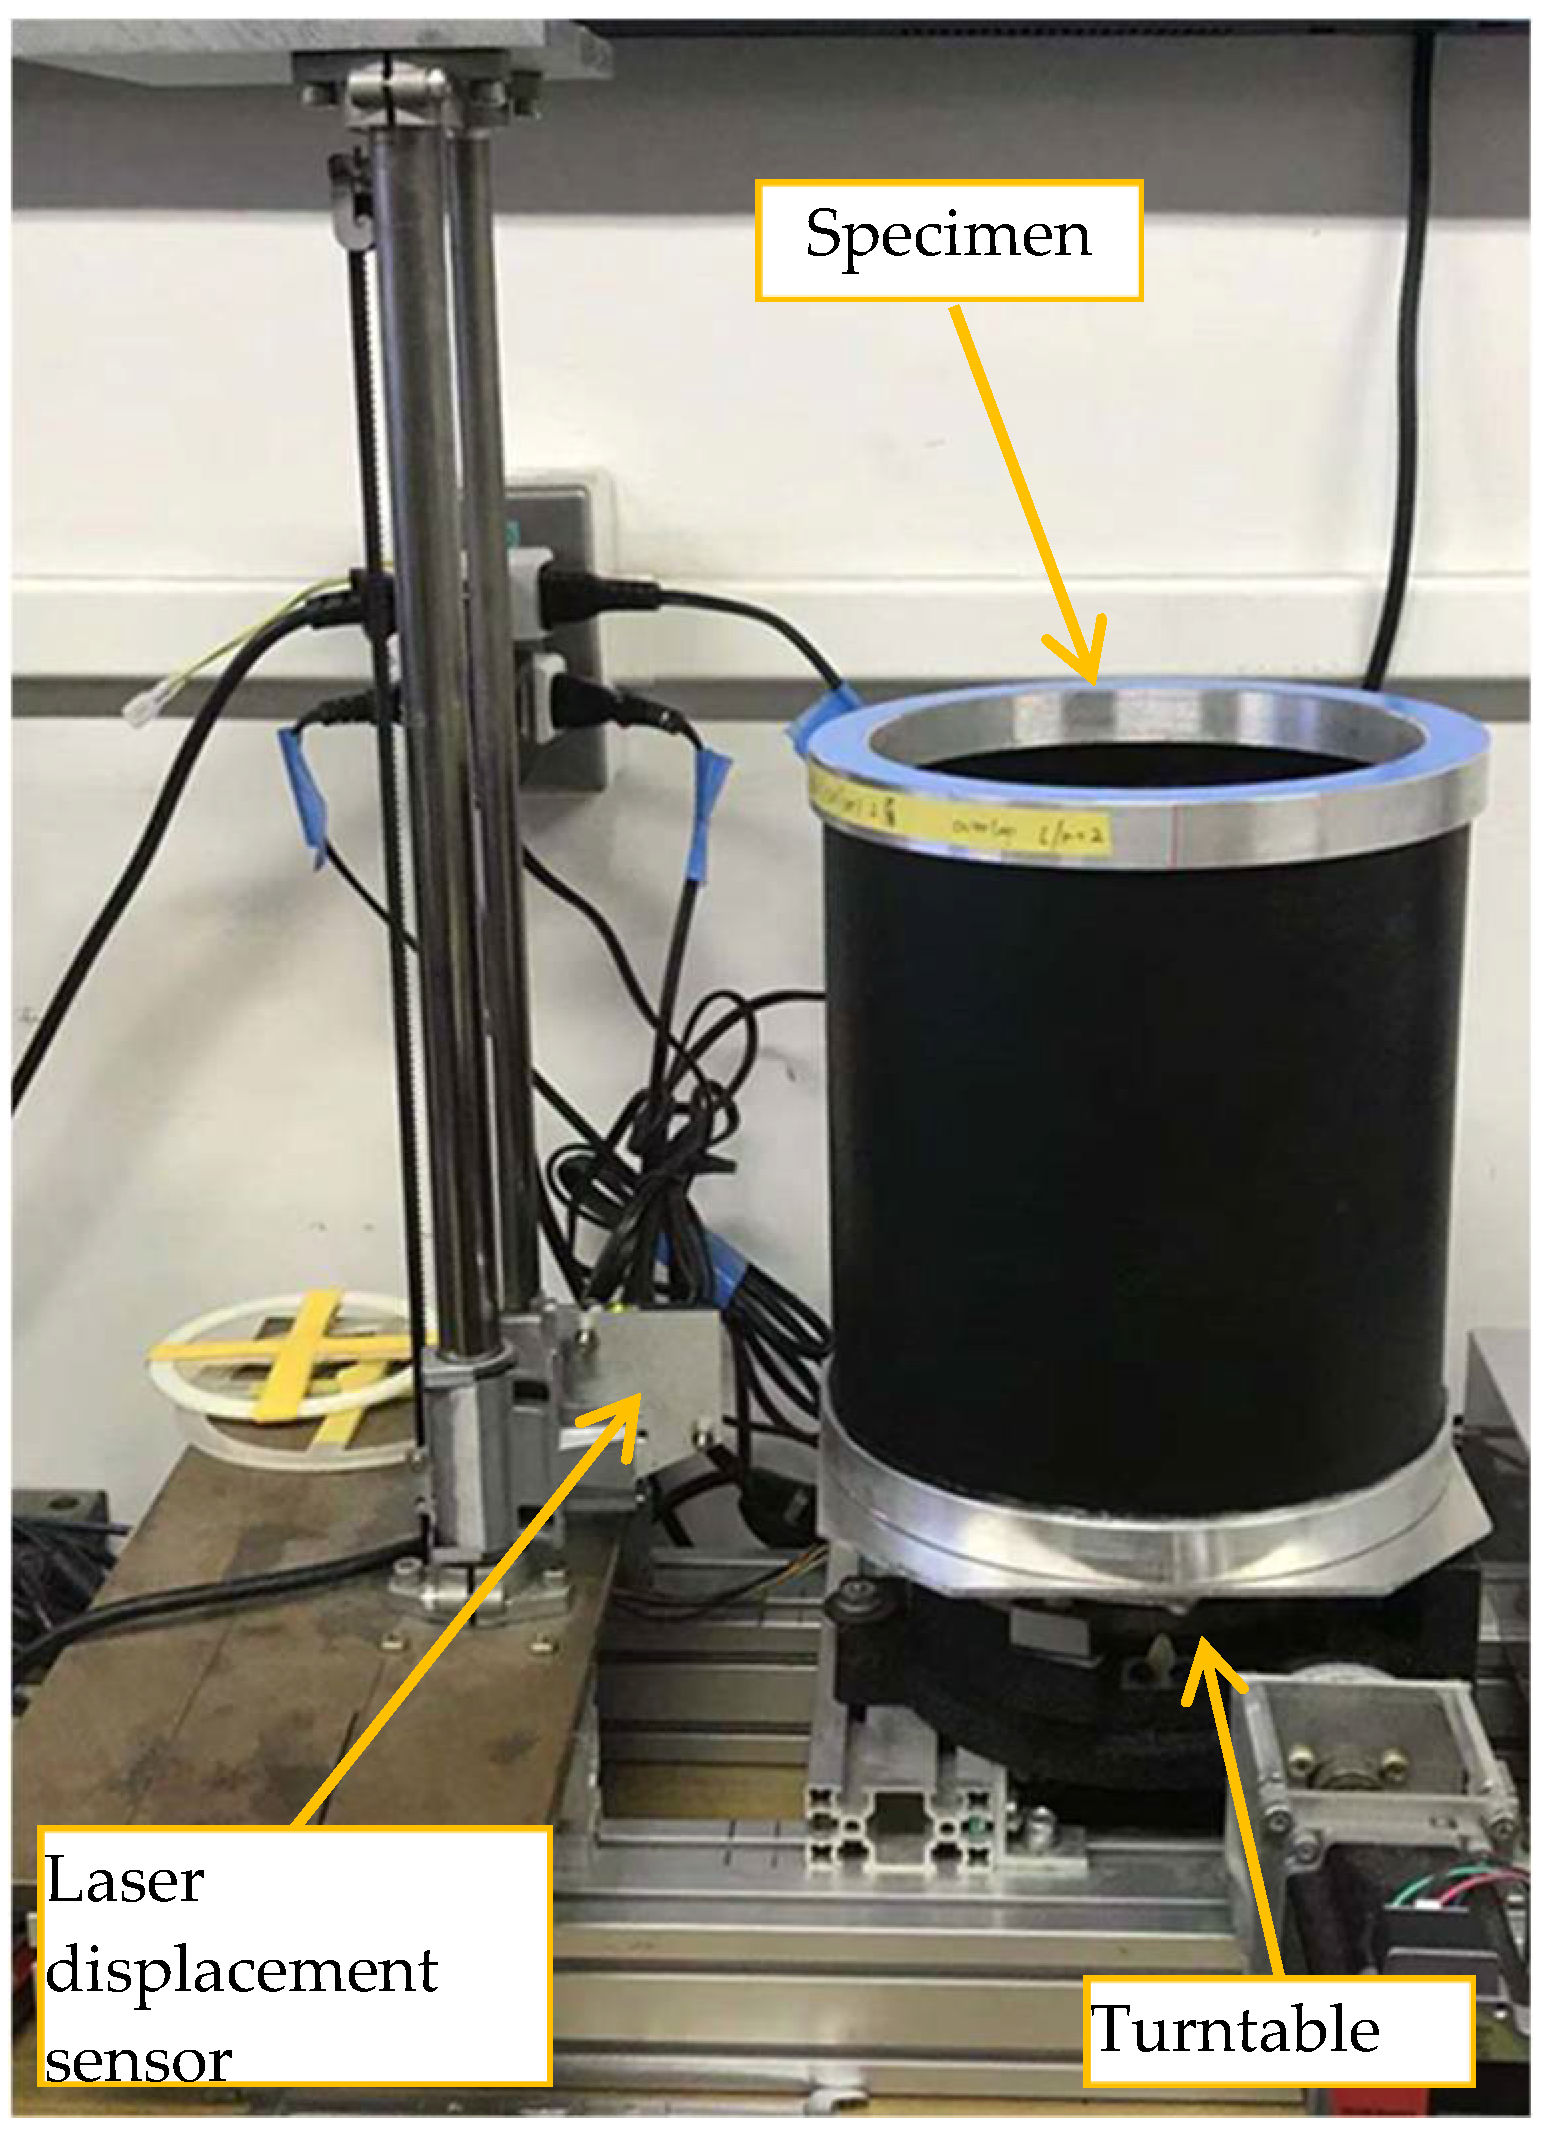
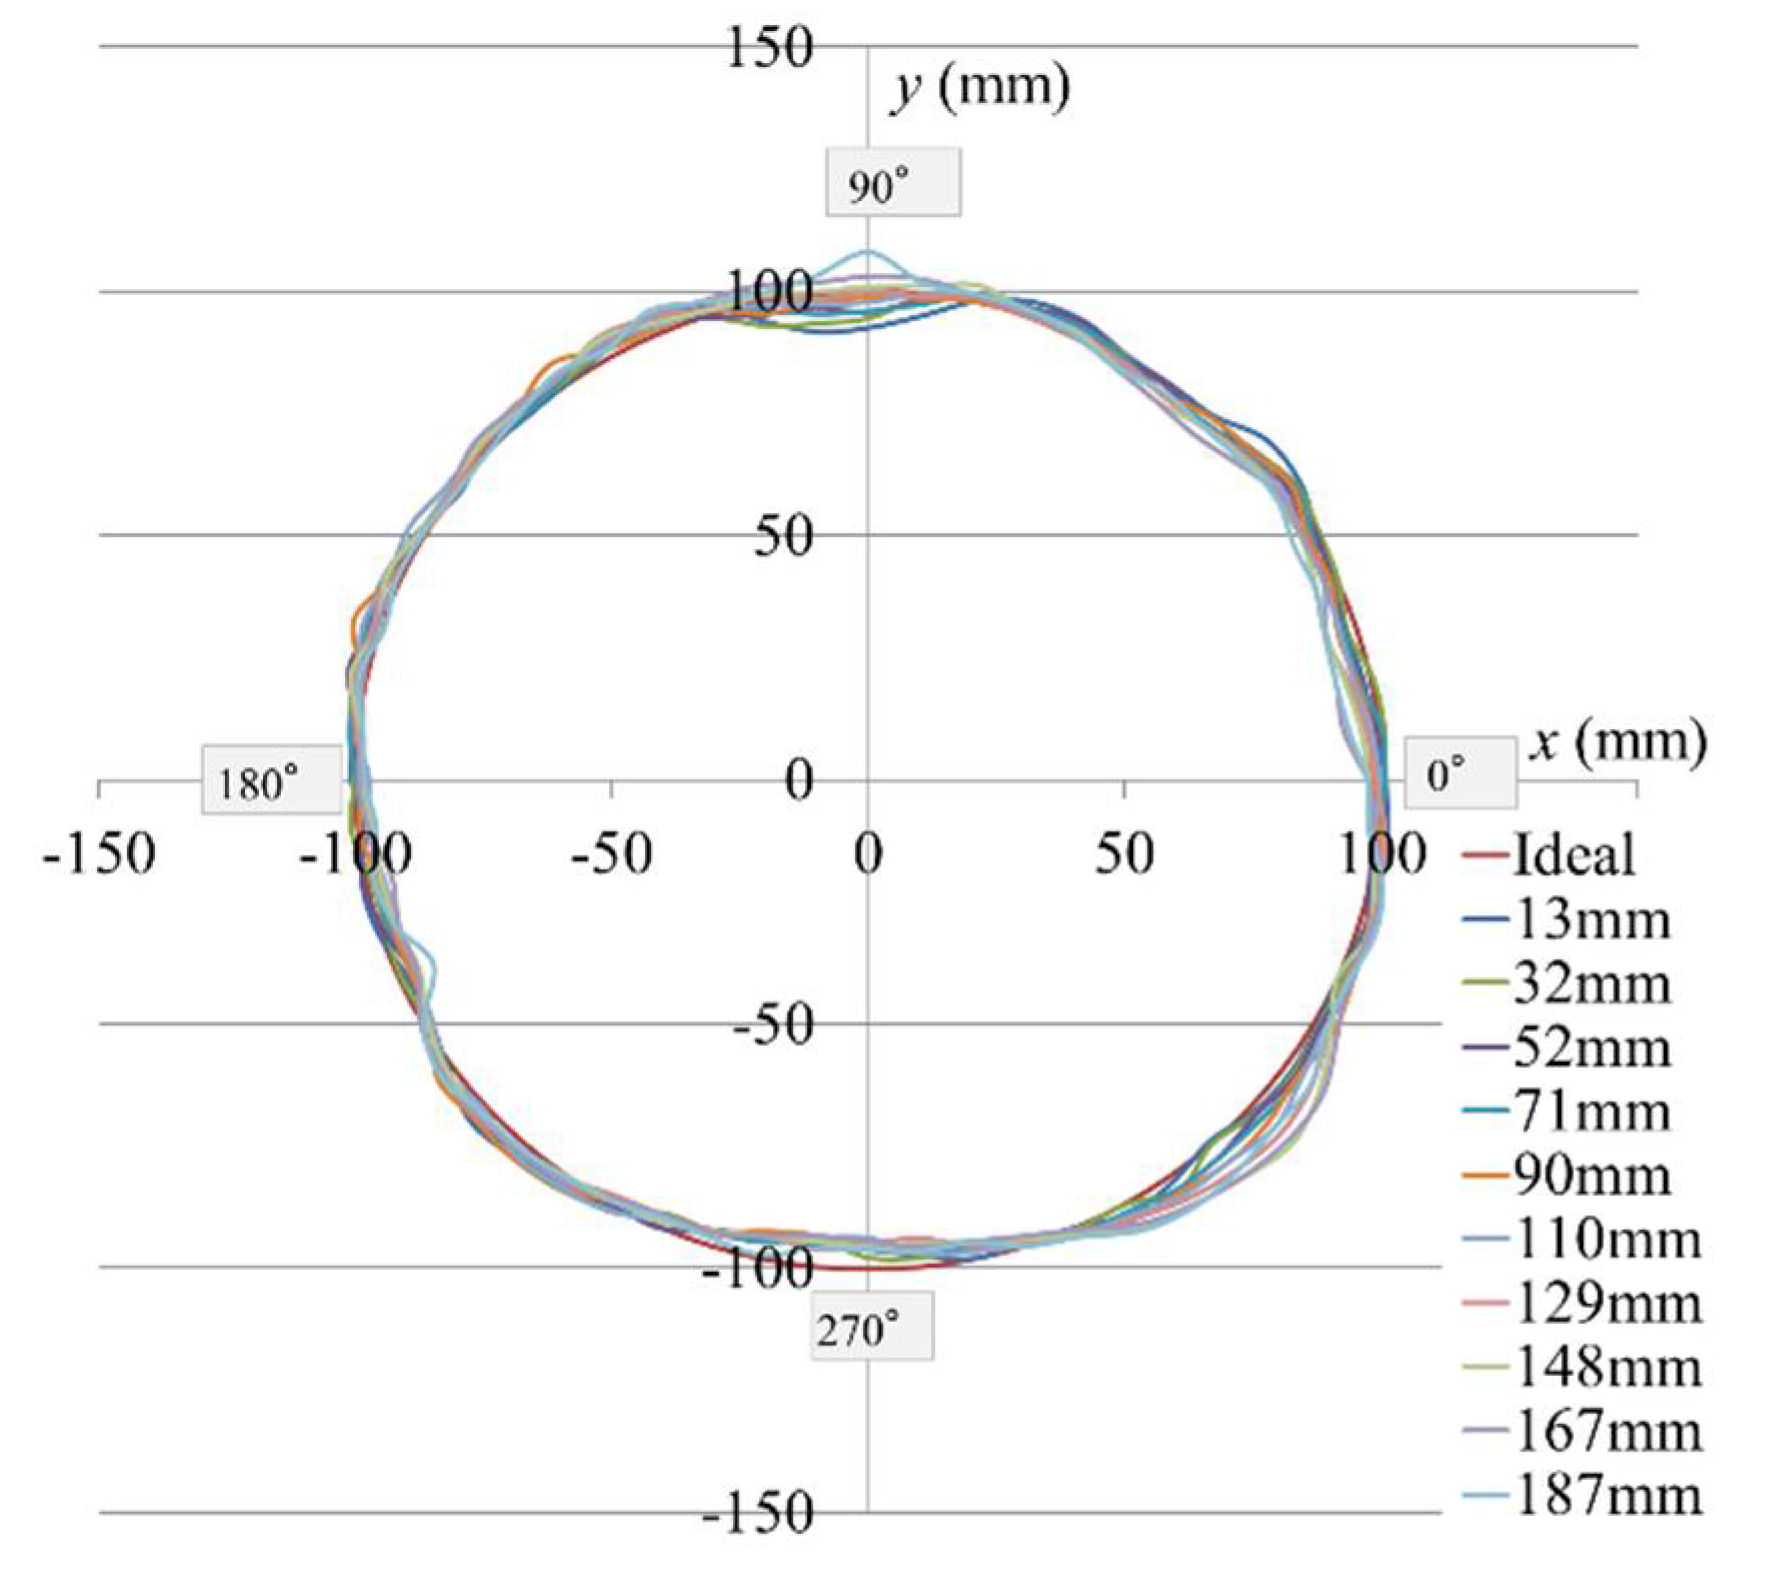
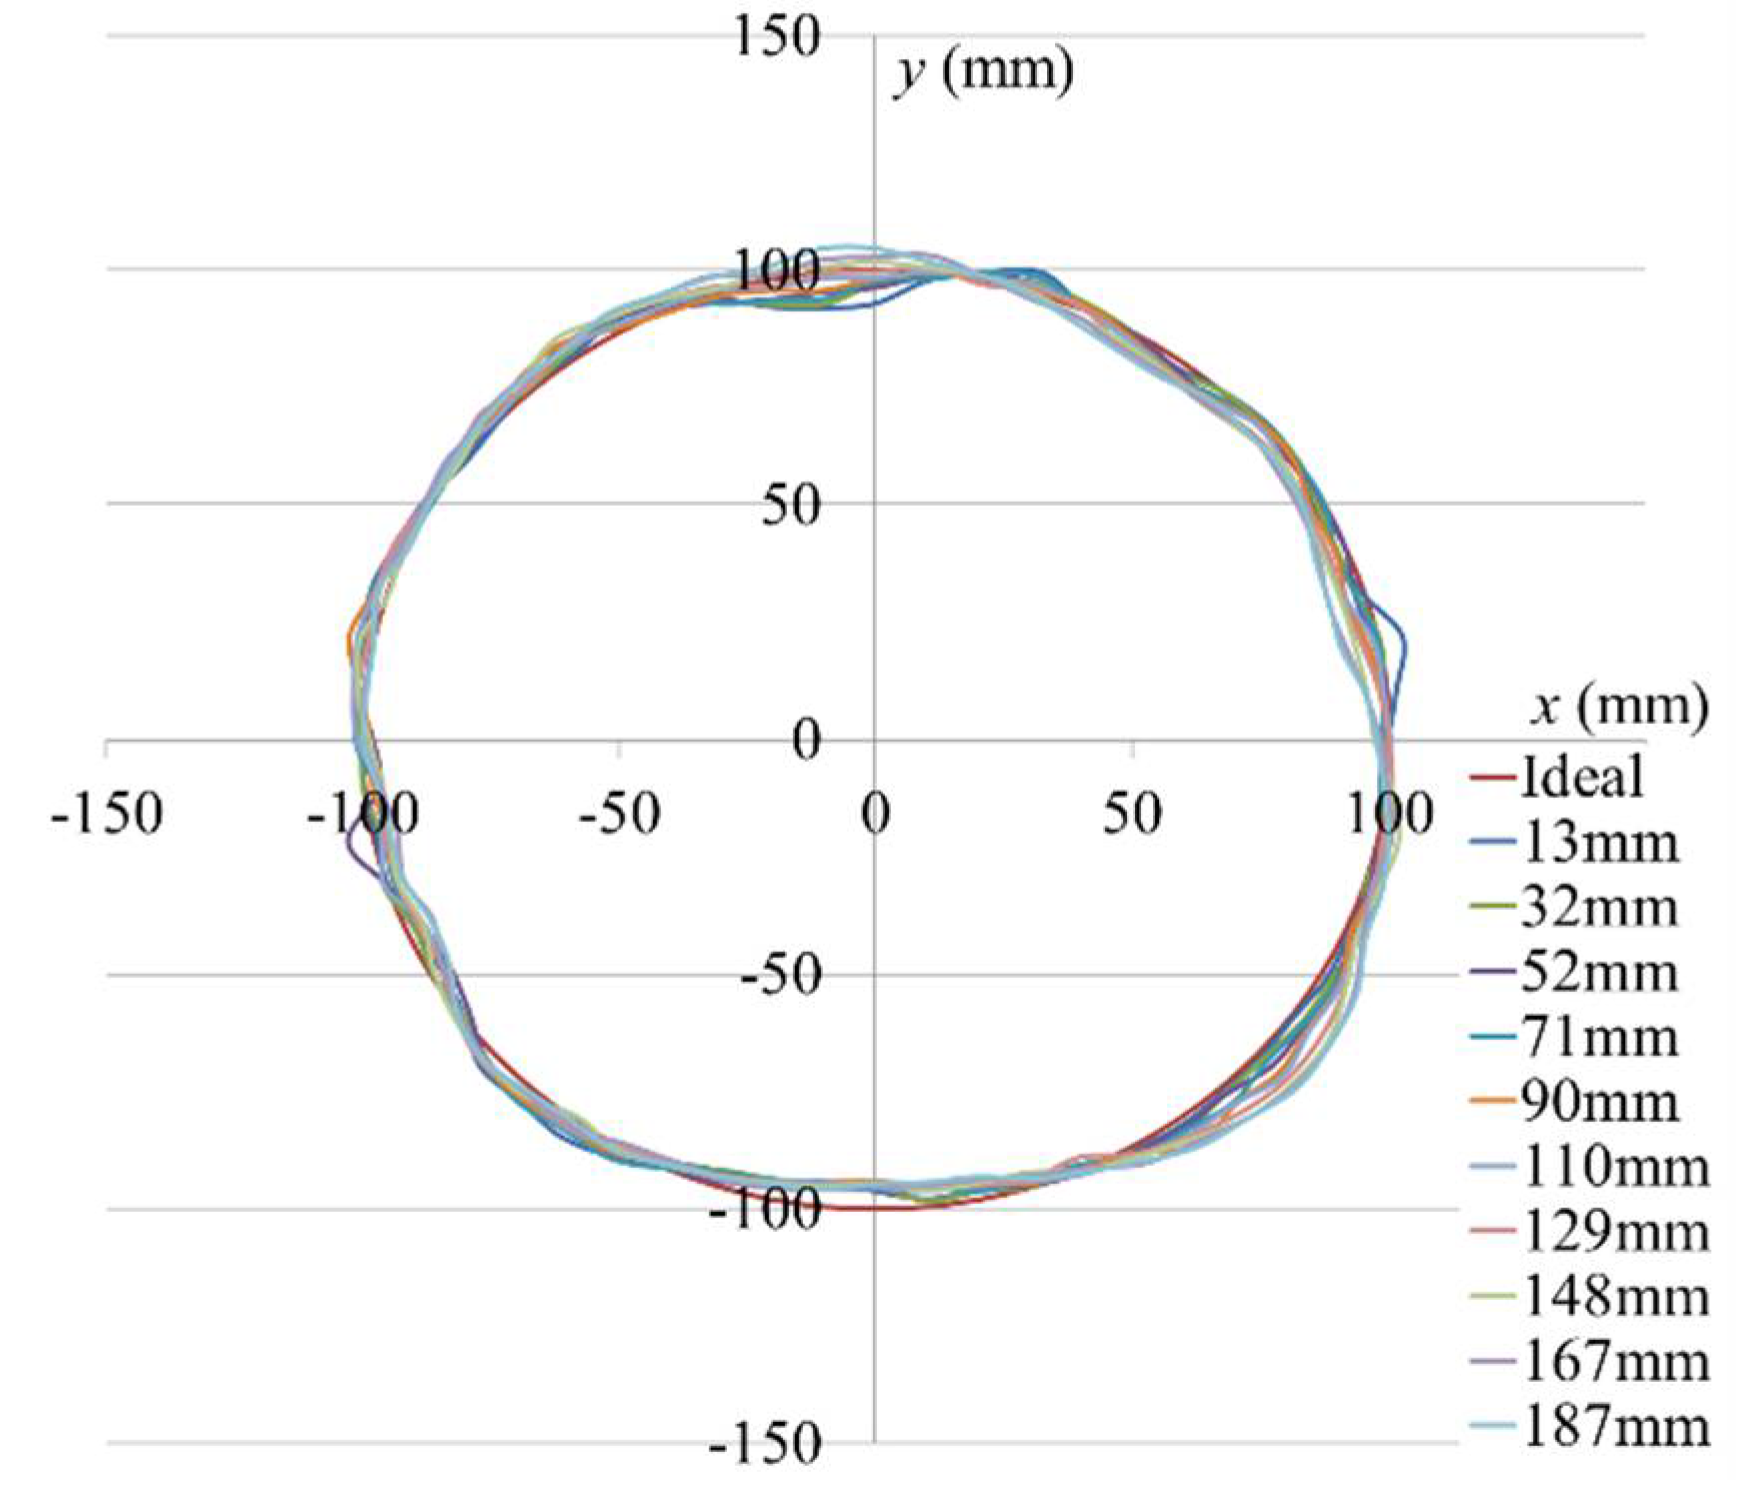
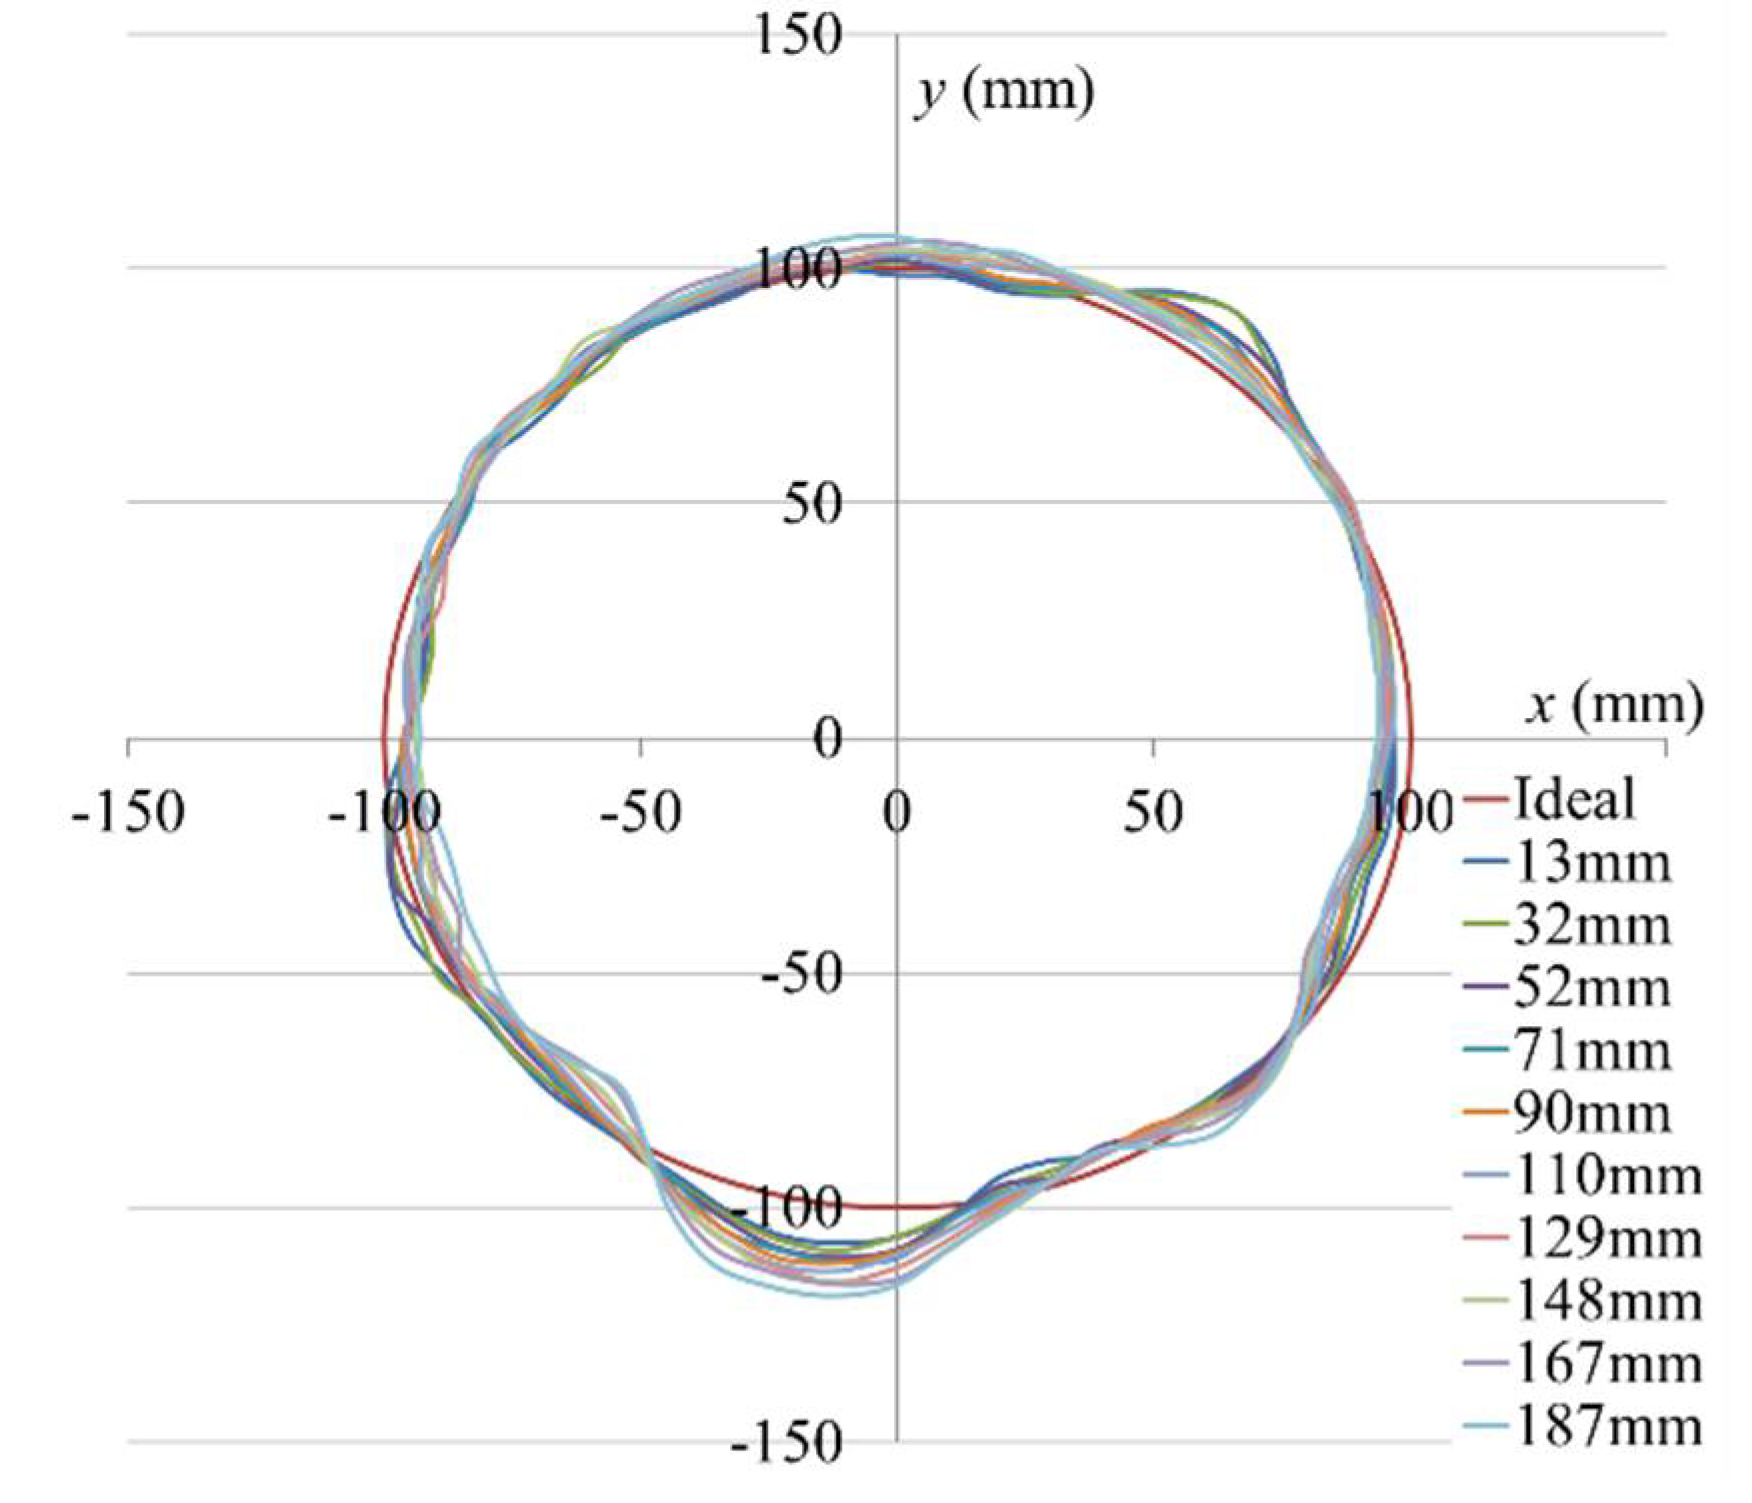
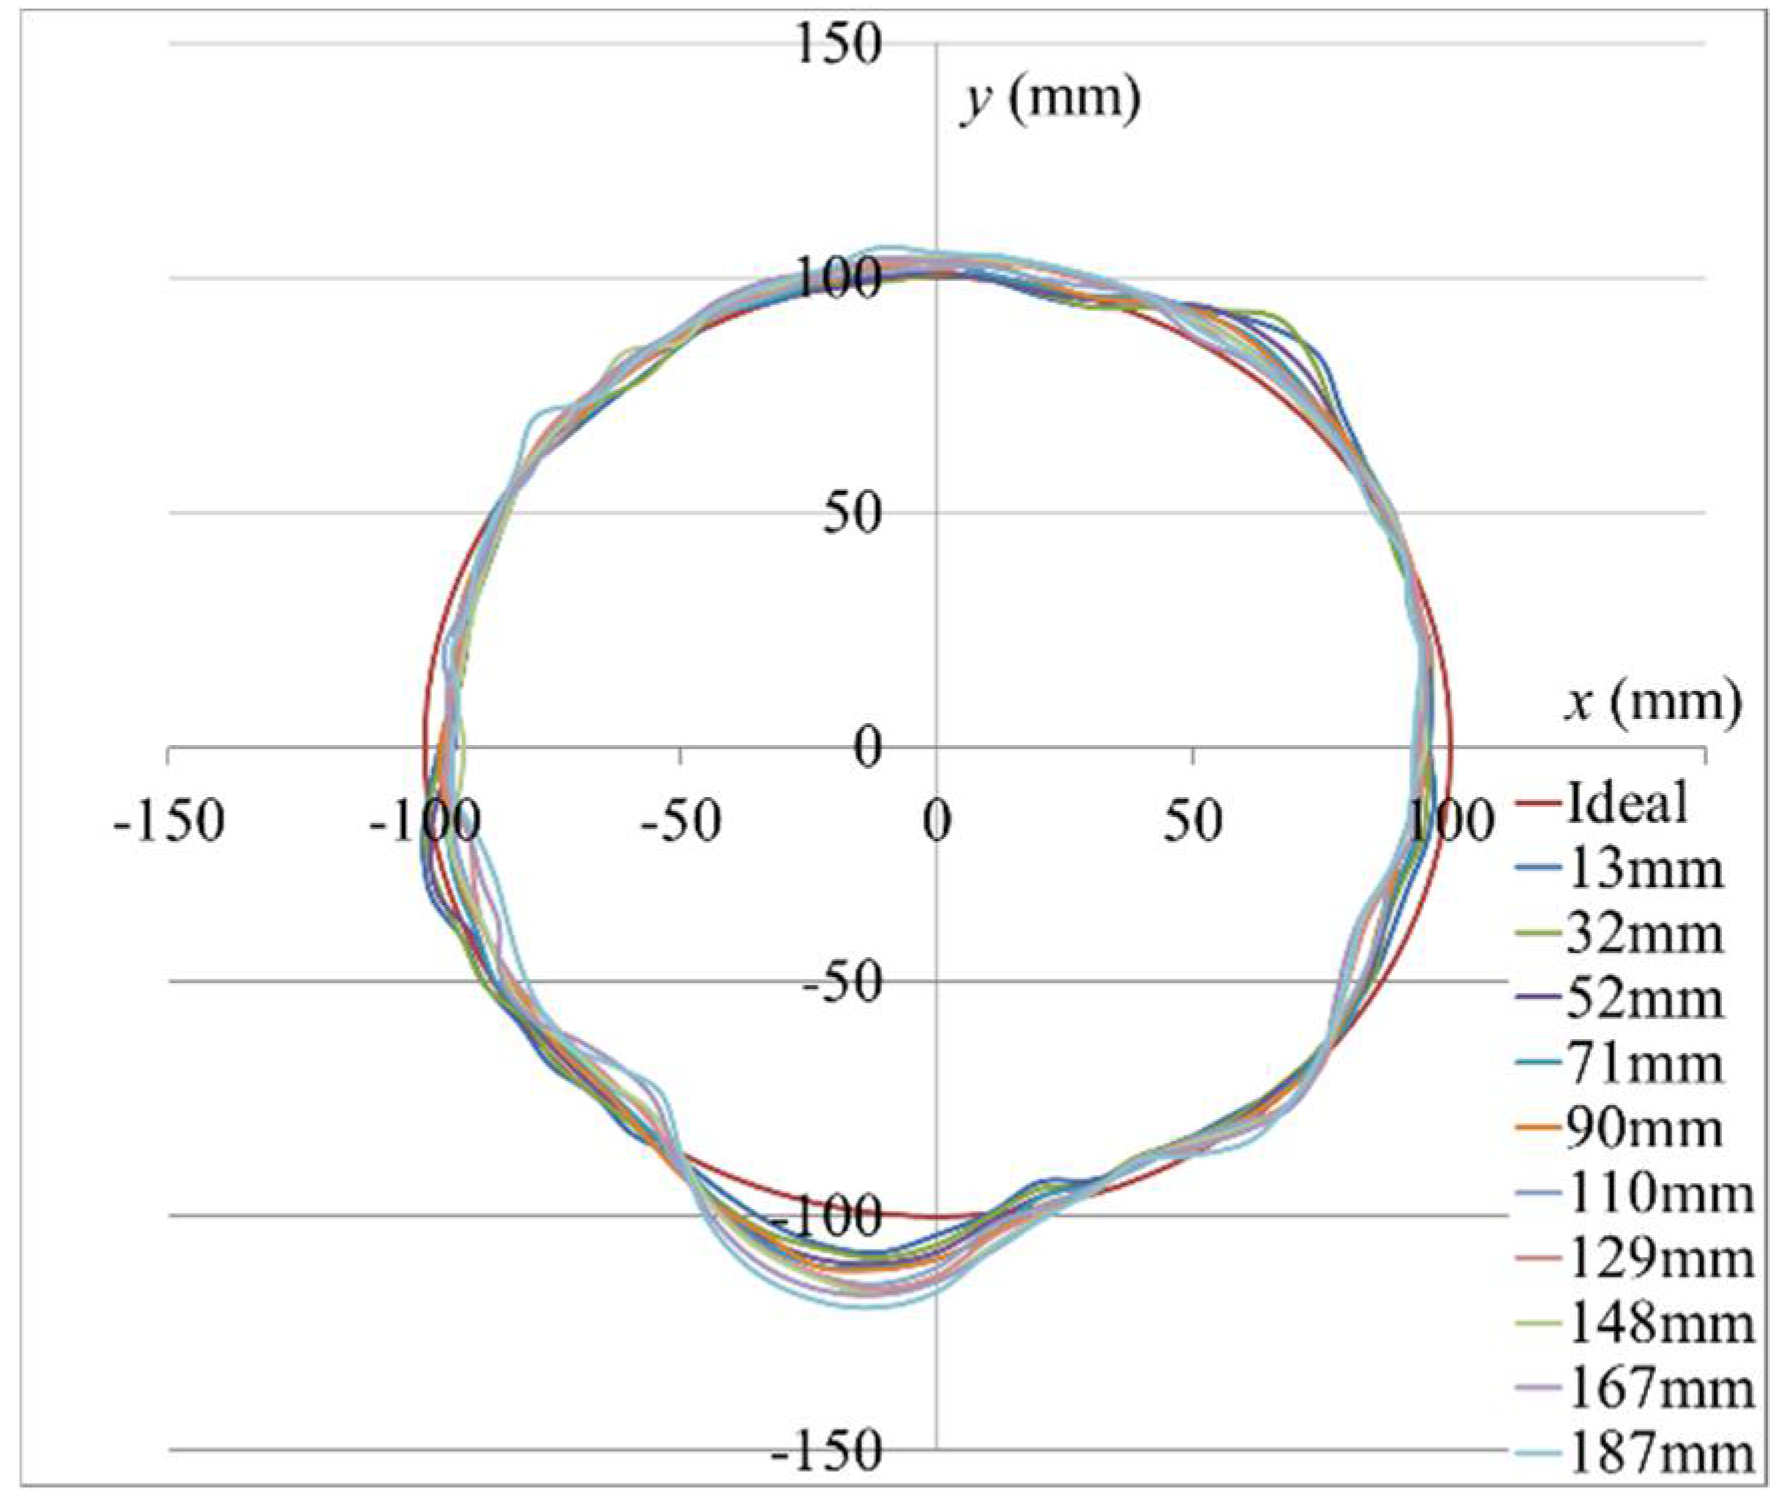
3. Shape Measurement Equipment
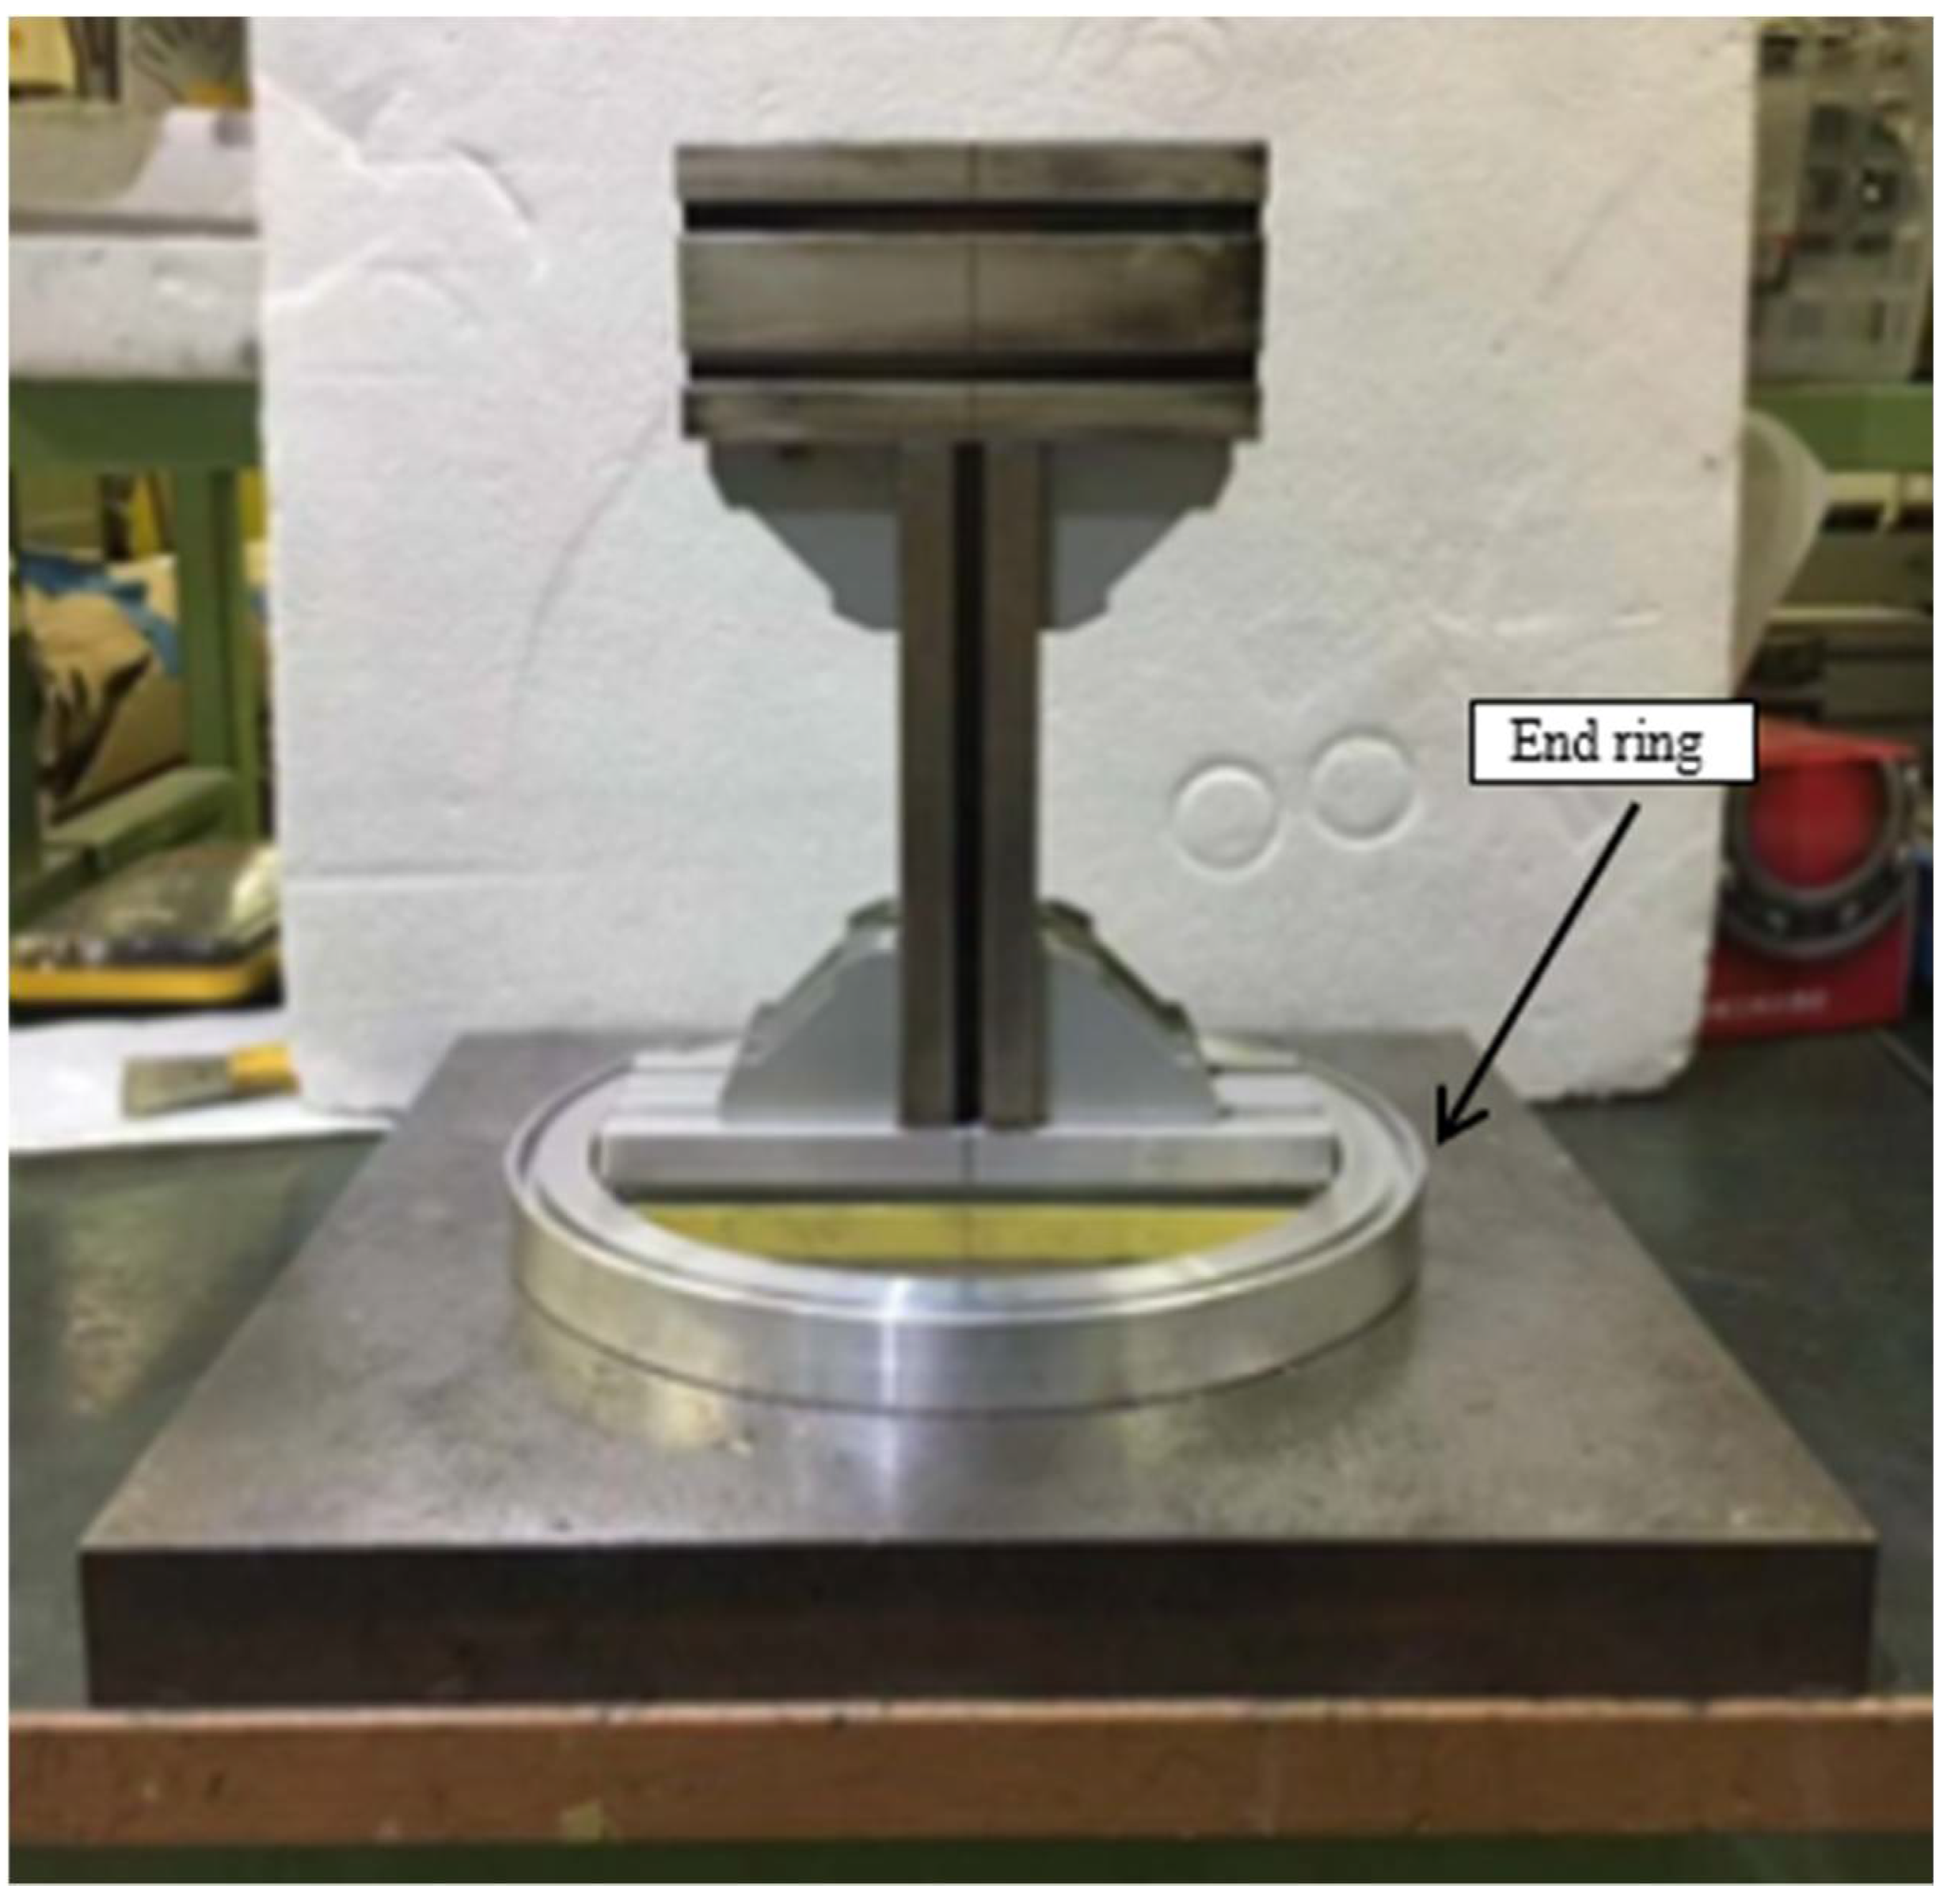
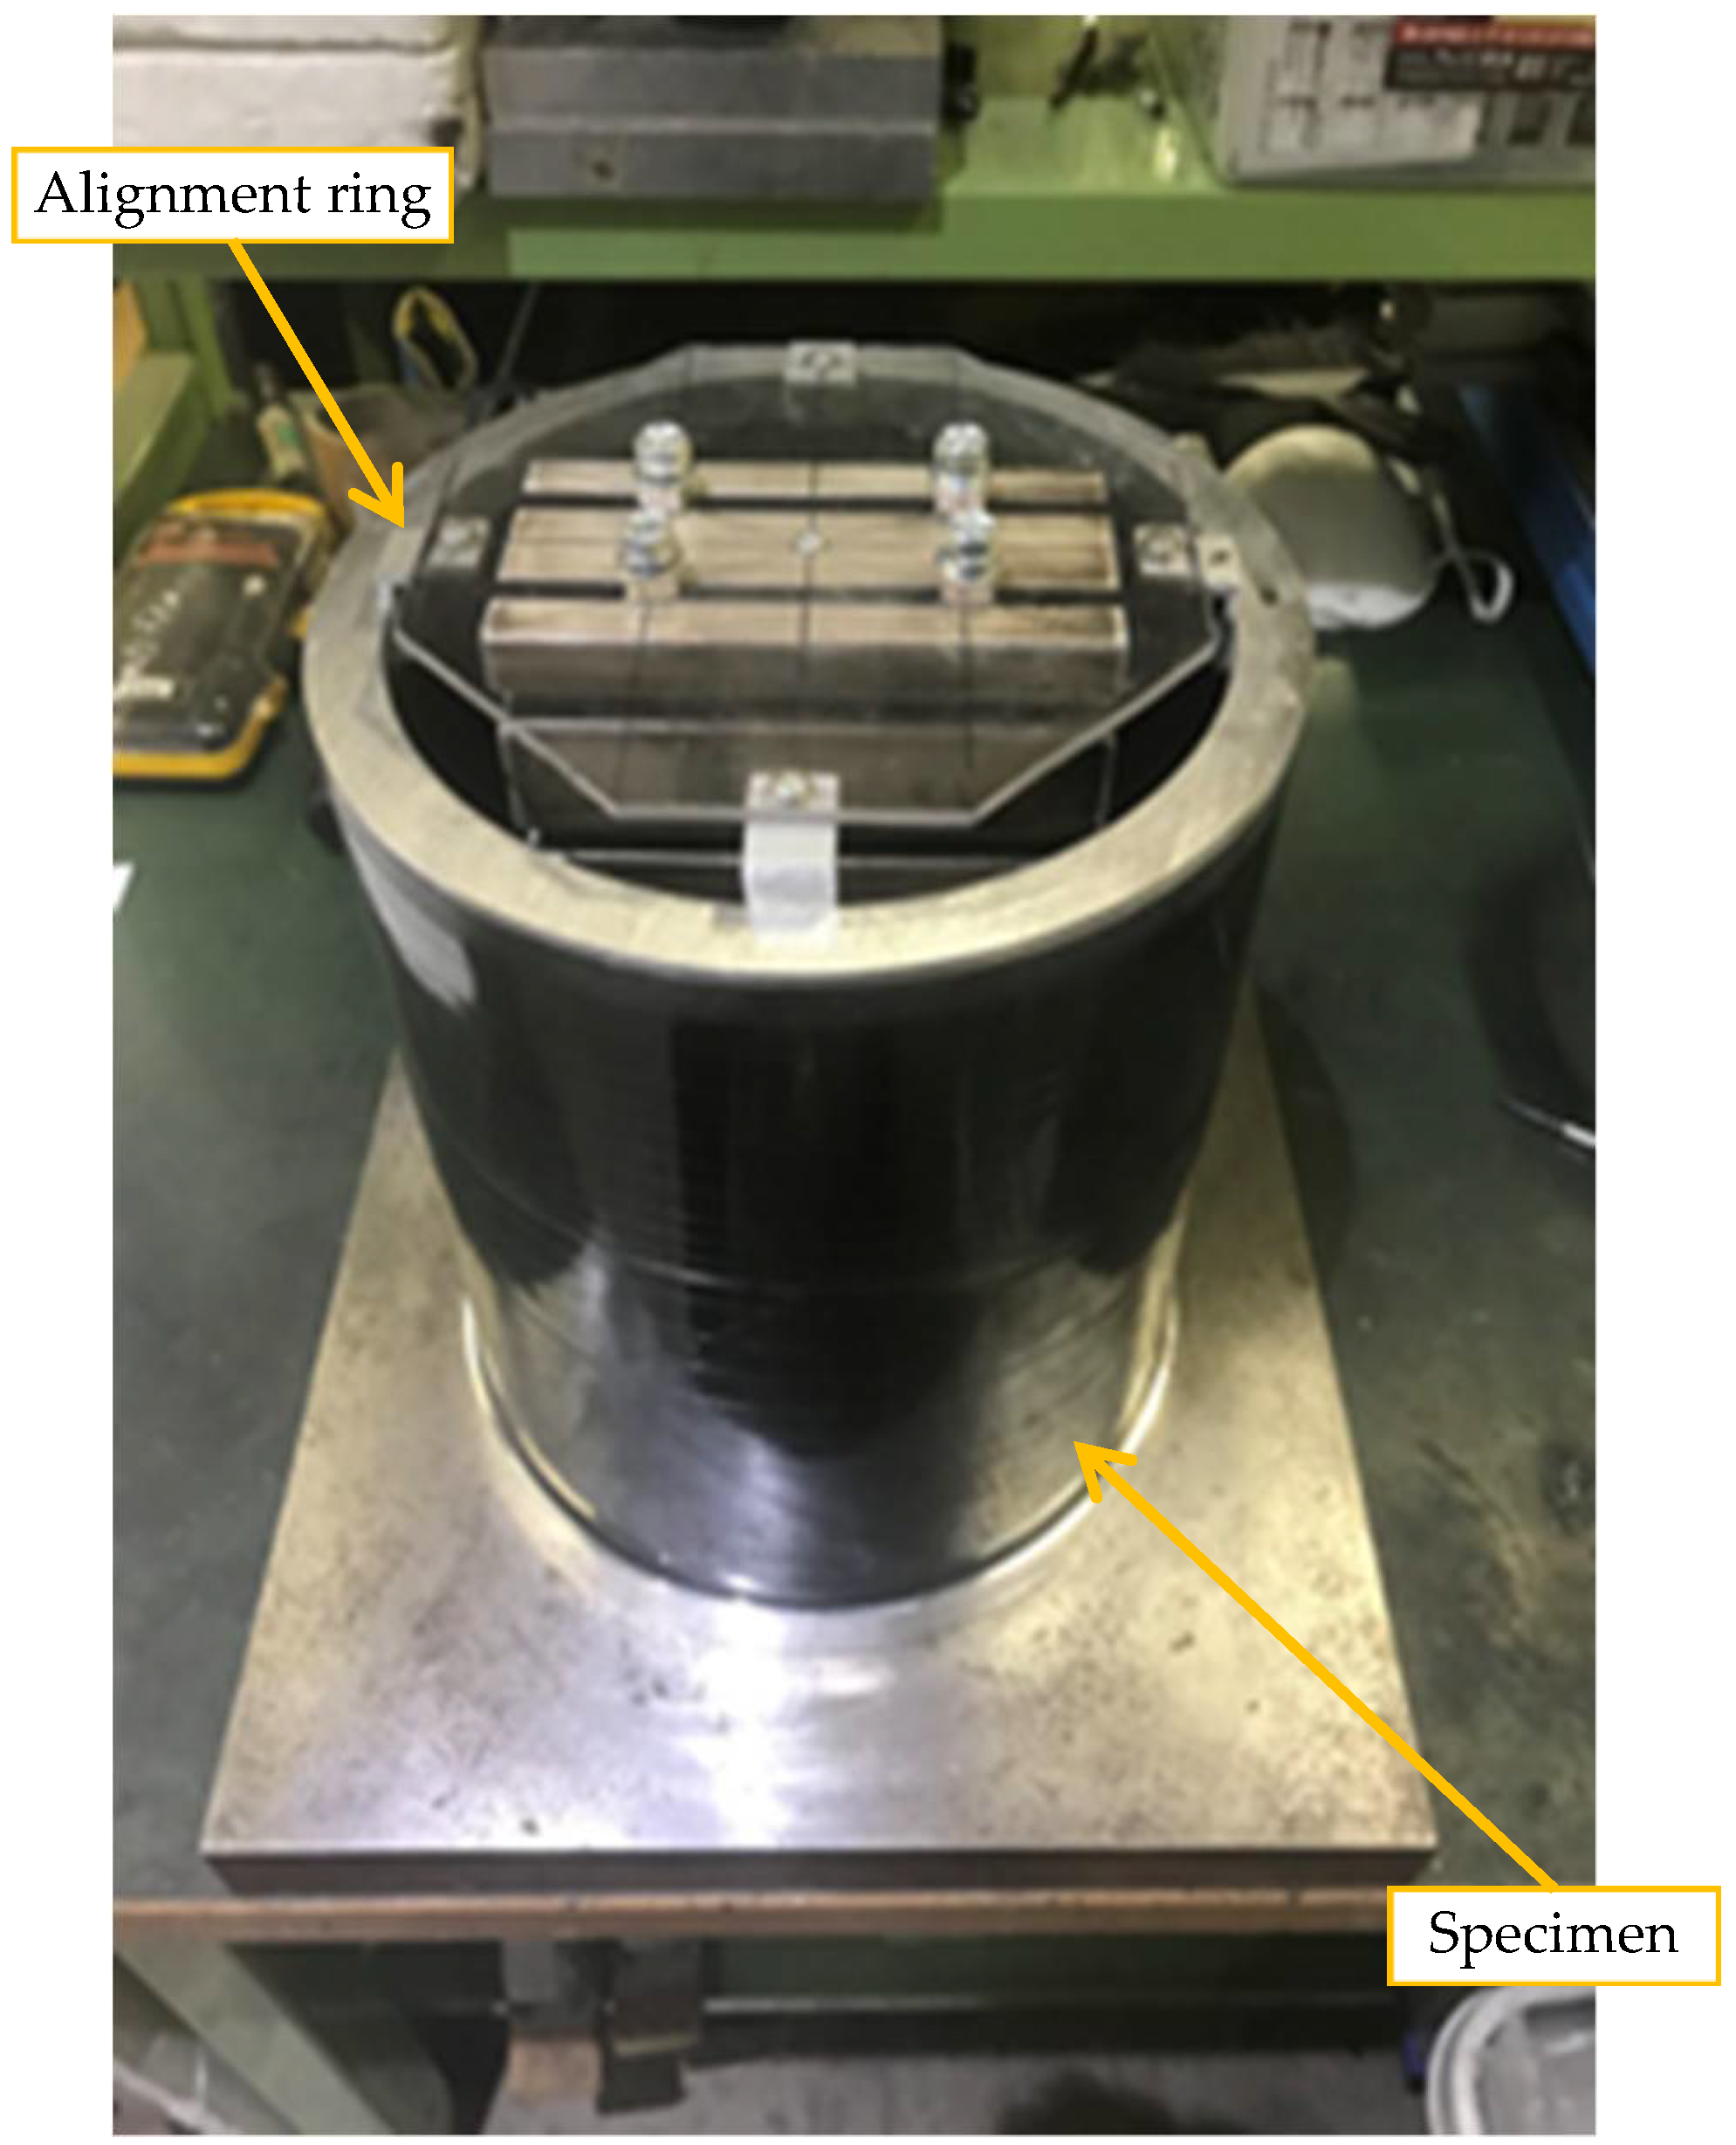
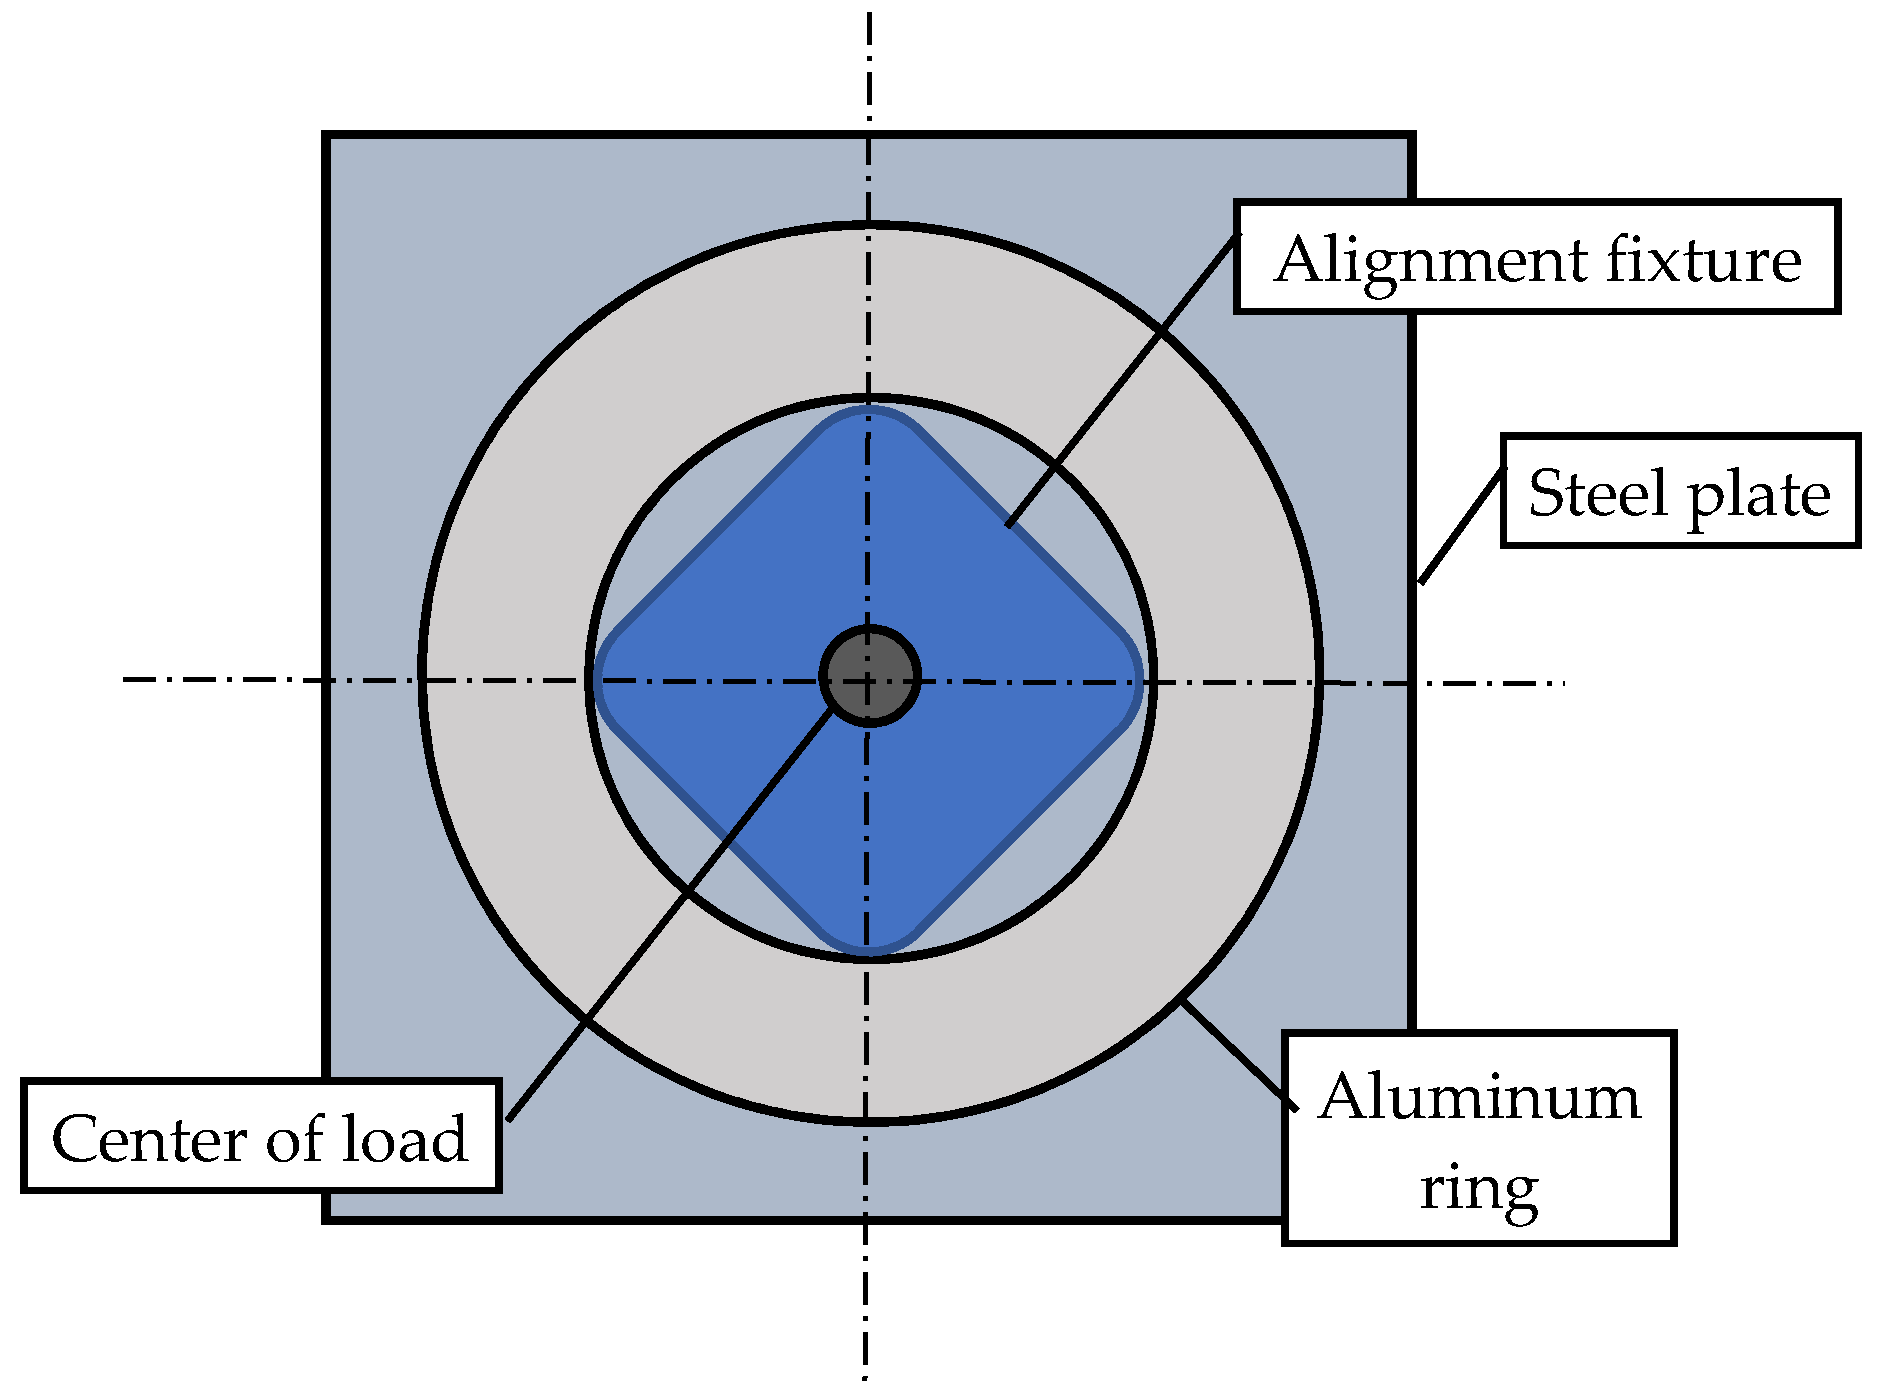
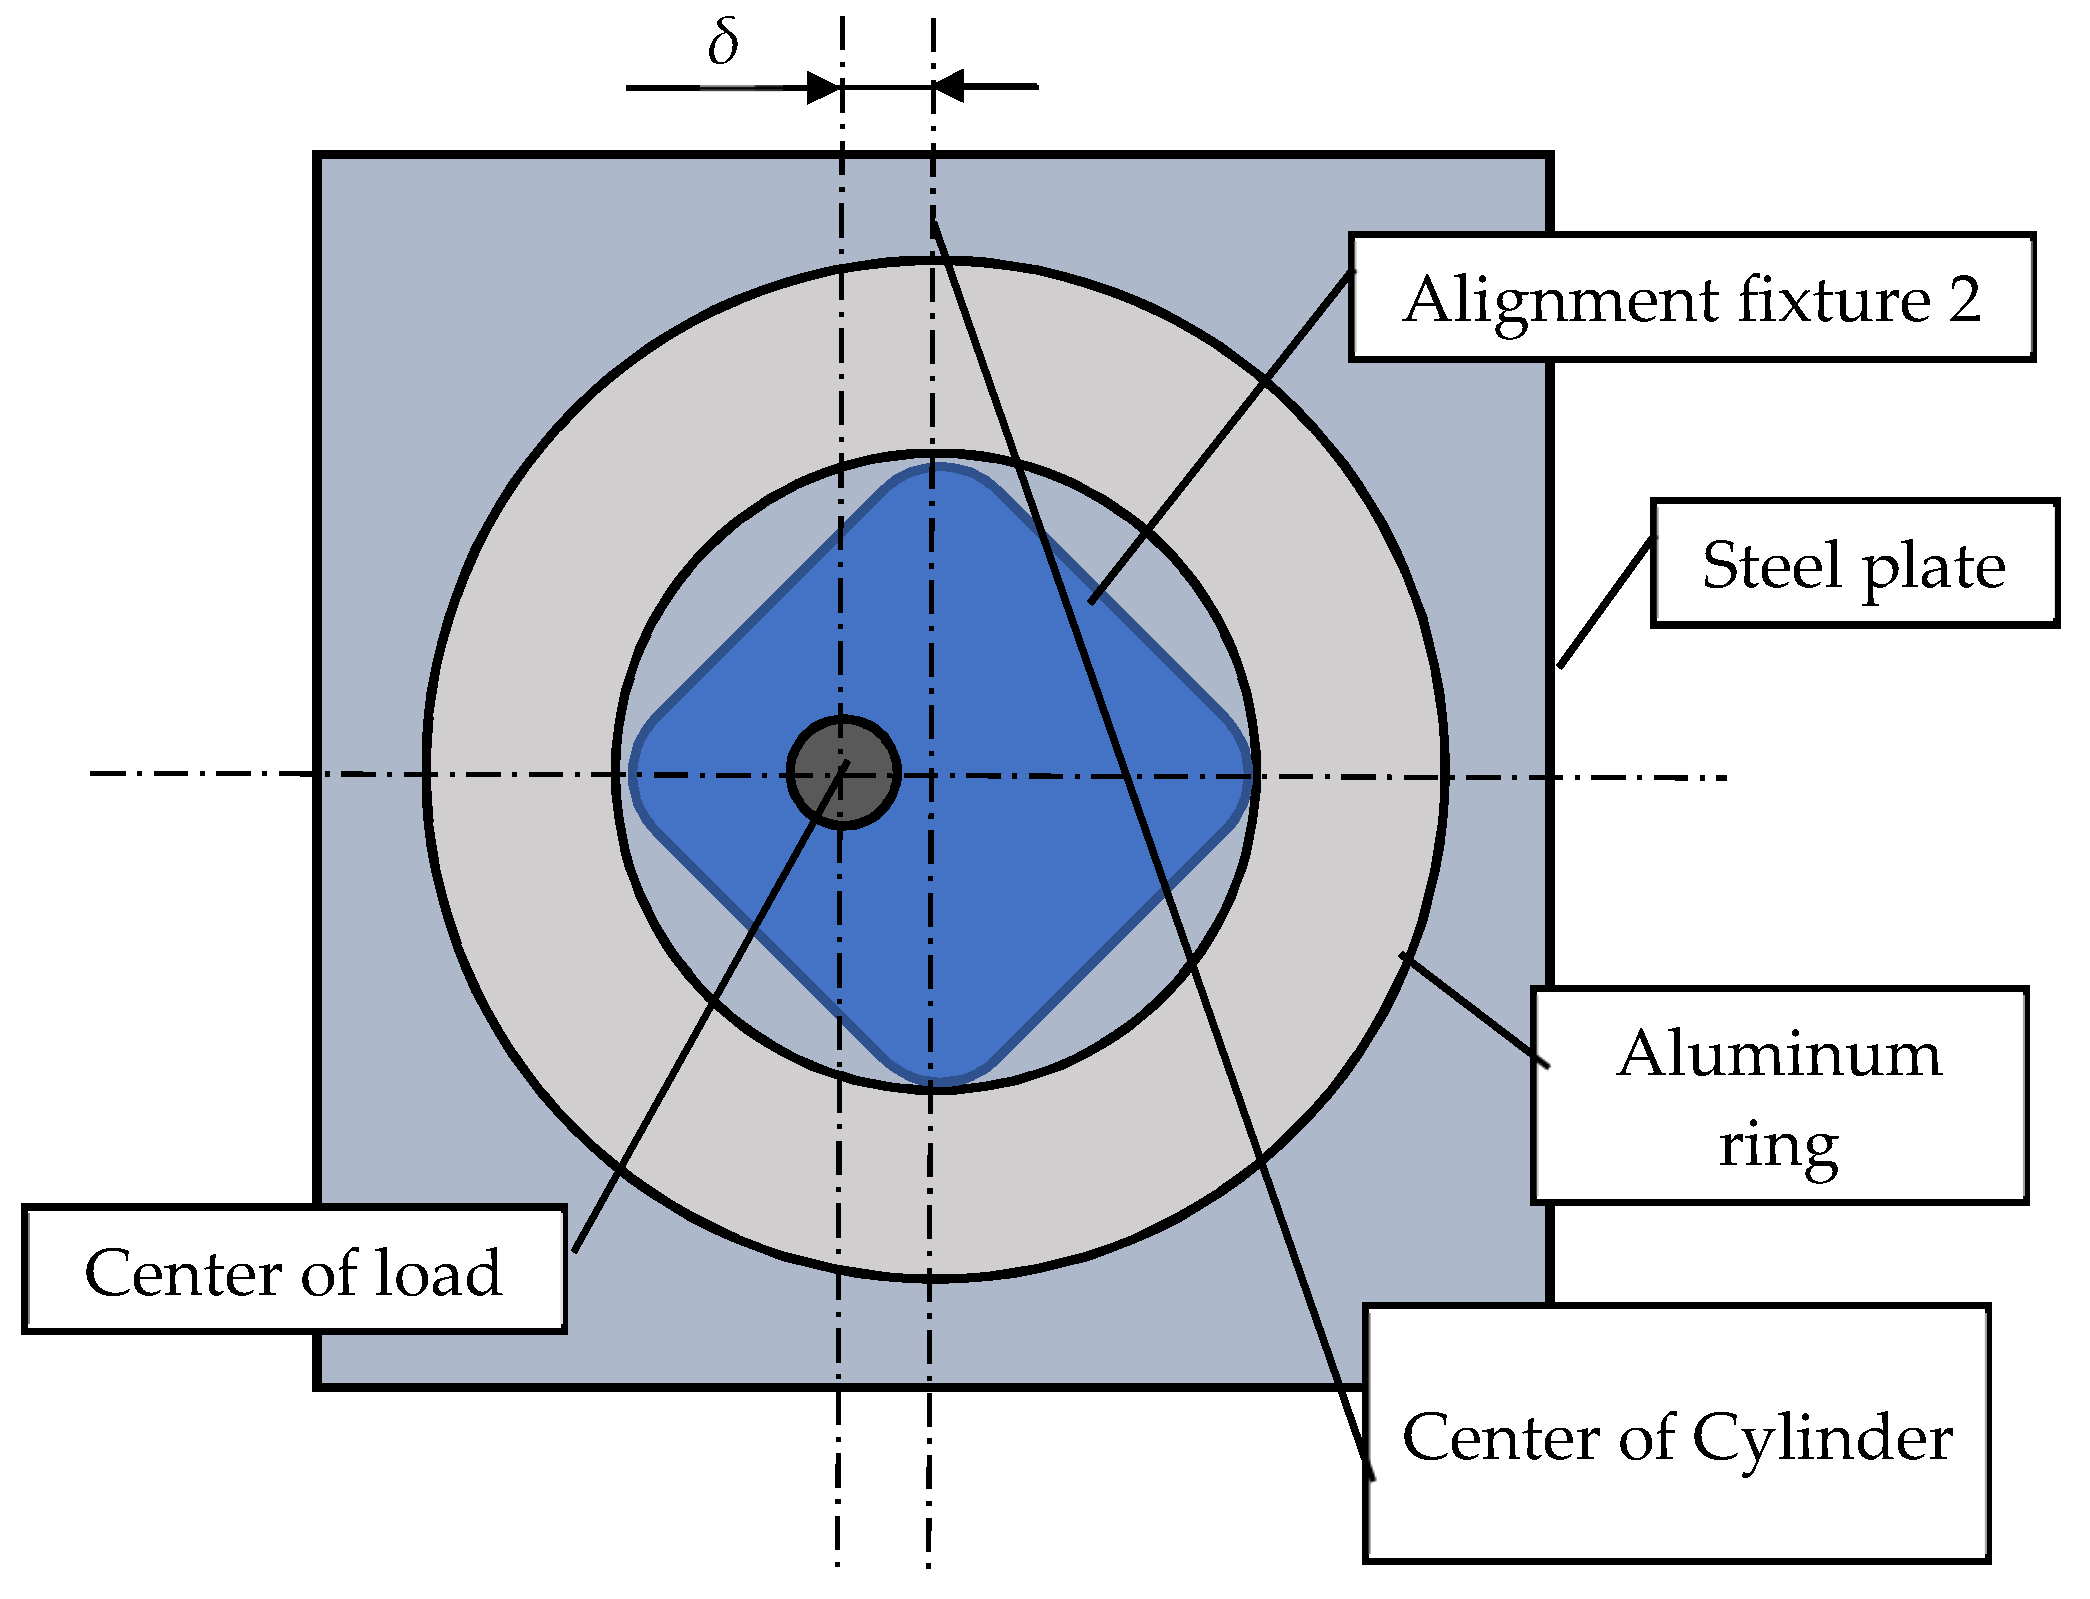
Figure 8 shows the shape measurement equipment; the major specifications are listed in Table 3. The equipment consisted of a turntable and a vertical movement head with a laser displacement sensor (LDS). The cylindrical specimen was turned on the turntable and measured by the sensor at different vertical levels. The measurements and movements were controlled by a personal computer. Measurements were taken at 61 points (one point per 6°) on ten vertical levels.

4. Buckling Test

The buckling test was conducted on the universal testing instrument (Shimadzu AG-I 100 kN, load accuracy within ±1% for an indicated value). To achieve a uniform load, a steel ball and adjustment fixture were used, and the load was applied via a steel plate, as shown in Figure 9. The alignment between the center of the cylindrical specimen and the crosshead of the universal testing instrument was conducted by the crosshead moving down to alignment fixture 1 and checking the offset between the steel ball and the hole of alignment fixture 1. To easily adjust the cylindrical specimen, fluororesin tape was applied to the baseplate of the universal testing instrument. After adjustment, a 150-N compression load, which is a sufficiently small buckling load, was applied and then removed. The load and displacement curve were then checked, and readjustments were conducted when an anomaly was observed. When an anomaly was not observed, the compression test for buckling was conducted. A crosshead displacement was applied until it reached 1.1 times the buckling displacement; after which, the load was removed. In total, seven buckling load tests were conducted, one without offset (the first test); four with offset (0°, 90°, 180°, and 270°); and two without offset (the last test twice for confirming reproducibility). Two offset amplitudes, δ/t = 14.6 and δ/t = 7.3, were tested. The cylindrical specimens were thin enough that they were undamaged after they buckled, which enabled the tests to be repeated on them. For the test without an offset, the alignment fixture in Figure 10 was used, while, for the test with an offset, the alignment fixture in Figure 11 was used. To check that there was no anomaly in the inclination of the top of the cylindrical specimen, the displacements of the four corners of the steel plate were measured by using laser displacement sensors (LDSs), as shown in Figure 12. Figure 13 shows an overview of the buckling test.

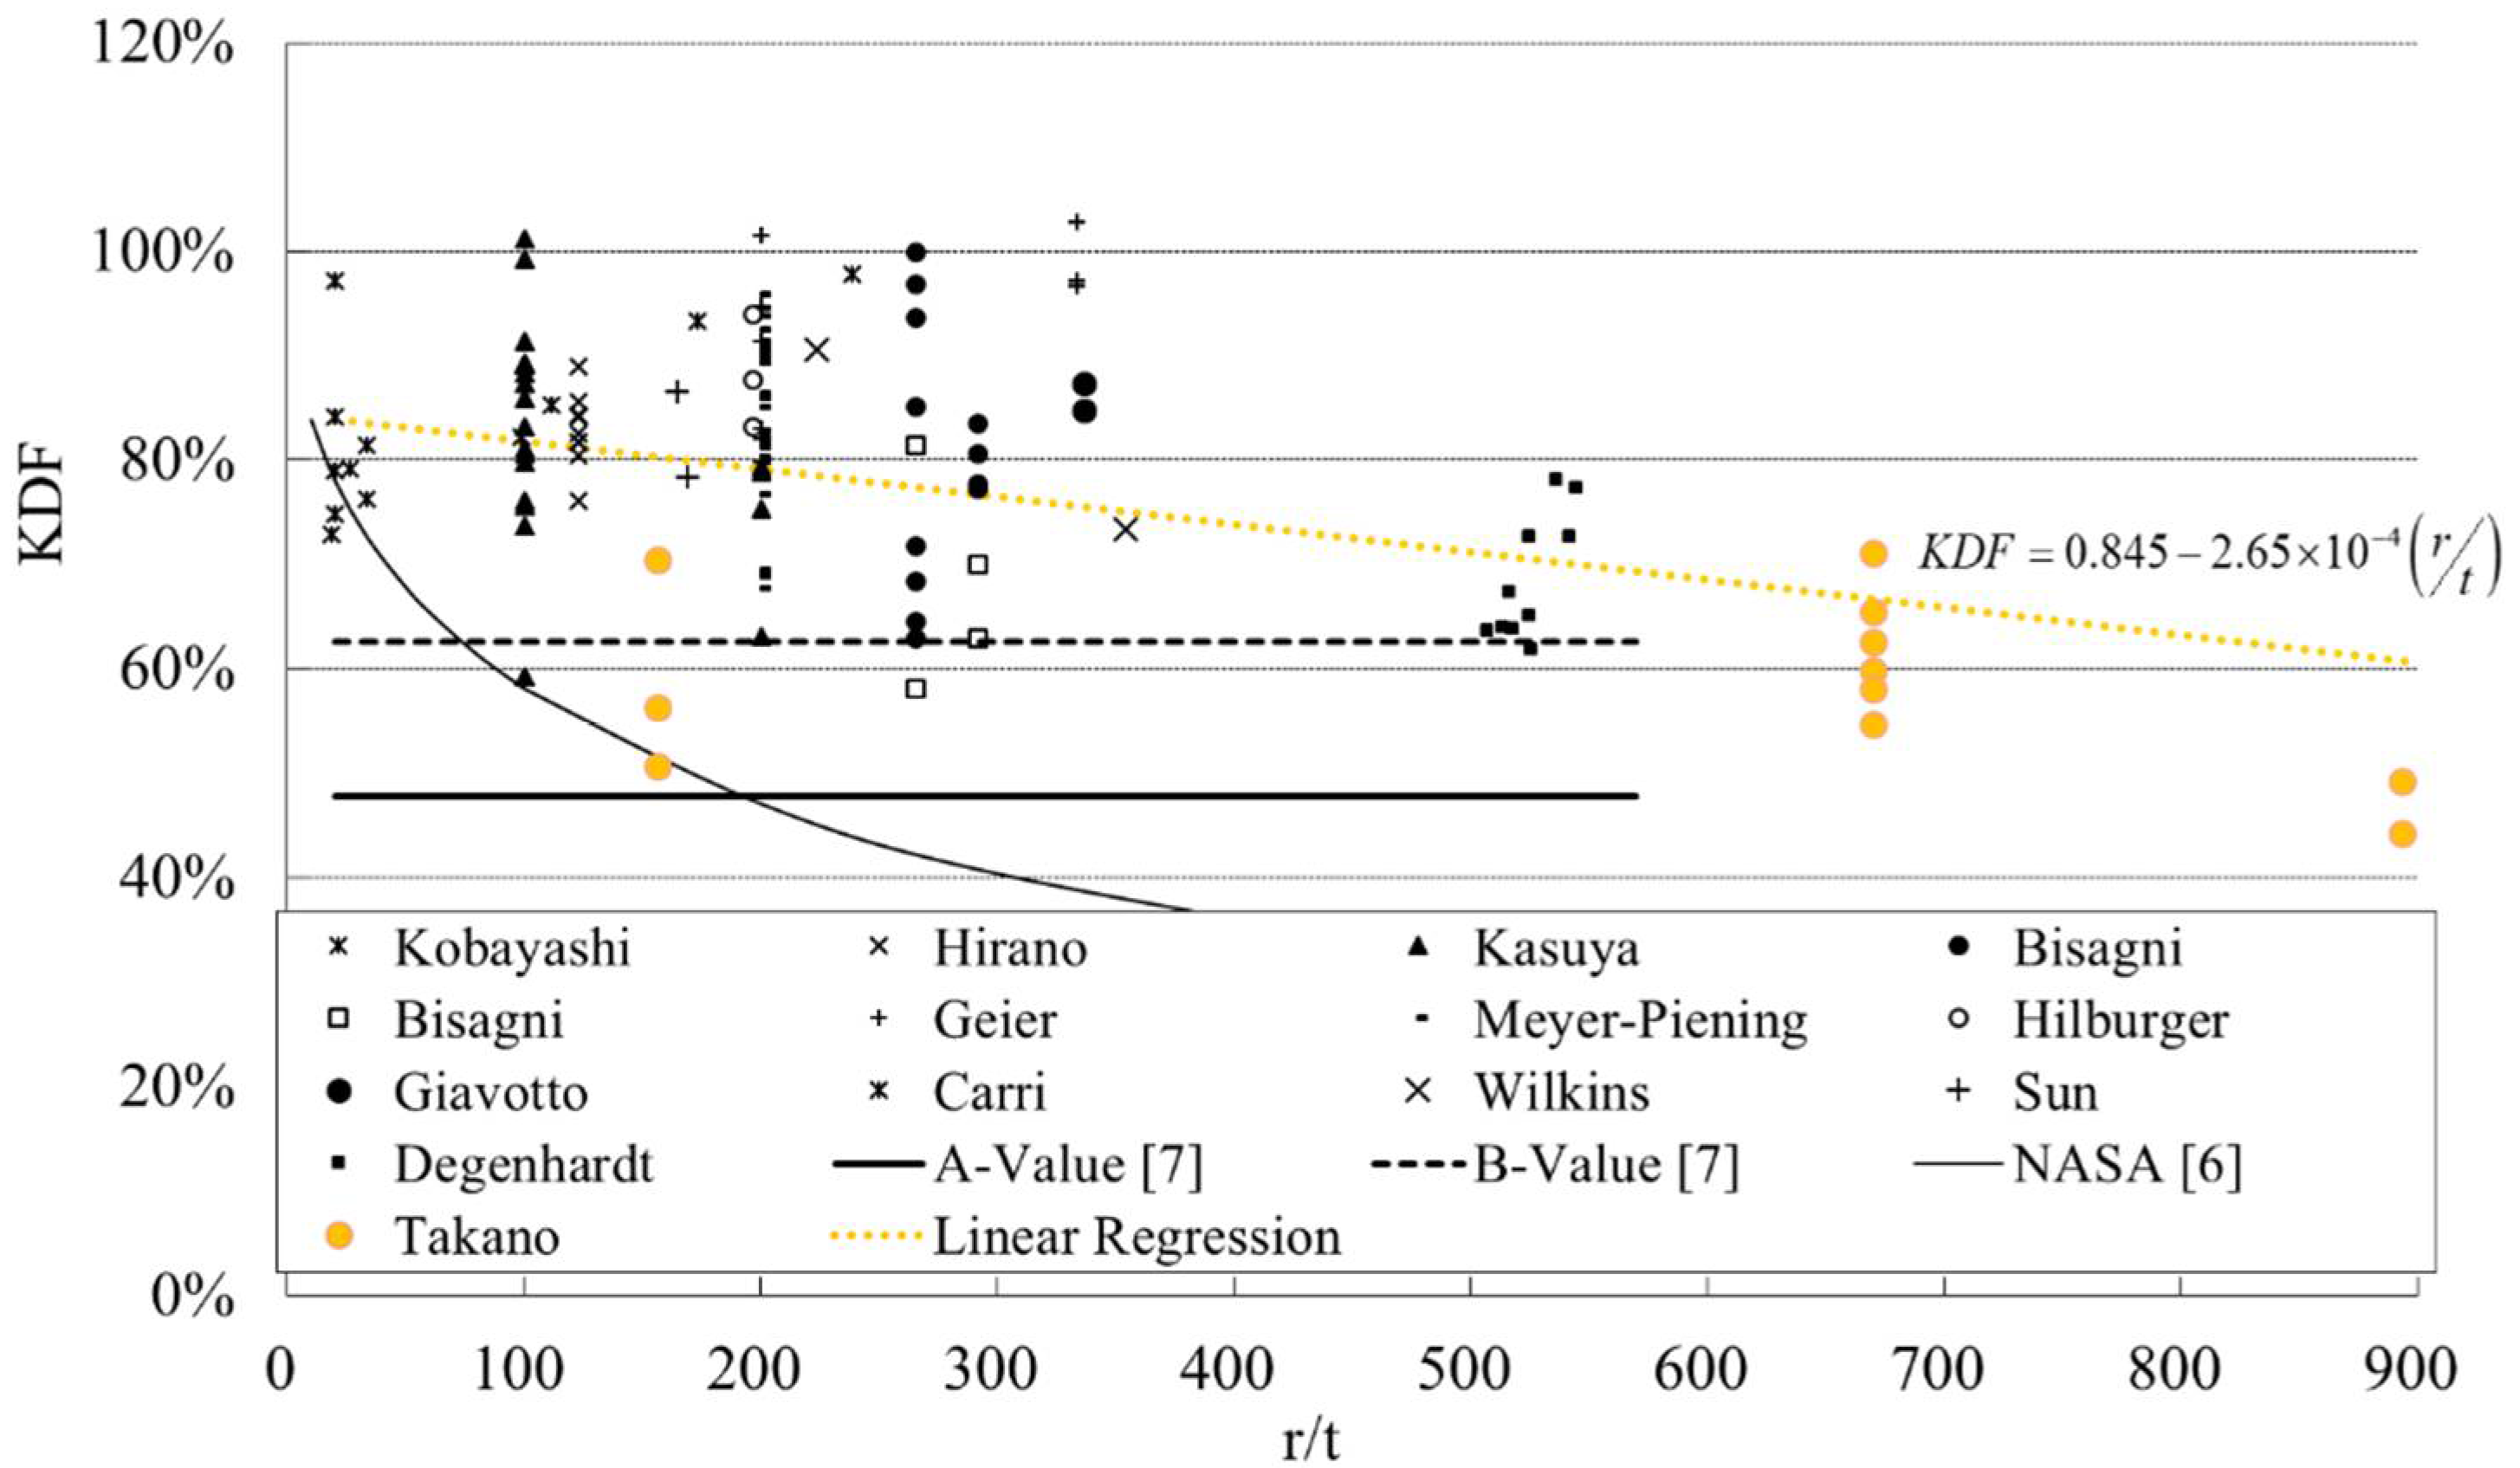
5. Test Comparison between the Mathematical Model and the Test Results and Evaluation

Figure 14, Figure 15, Figure 16 and Figure 17 plot buckling loads for the offset and no offset of the load center. The locations of the offset angles 0°, 90°, 180°, and 270° are shown in Figure 18. The origin of the offset angle, 0° was decided arbitrarily. The theoretical buckling load was calculated by the linear bifurcation theory, including layup anisotropy and transverse shear deformation [19]. The theory was for ideal composite cylinders without shape imperfection. A nonlinear finite element analysis, including the measured shape imperfection [1], can evaluate the effect of the shape imperfection; however, it cannot be used for the prediction of the design use, because it requires the manufacture of a cylinder and measurement of the shape imperfection. Thus, the theoretical method for an ideal cylinder [19] was chosen in this study. The calculated theoretical buckling load was 936 N; thus, the KDFs were 0.43–0.52. The offset affected the buckling load; however, it was not the main reason for the reduction in the KDF. The buckling load in the cases without offset showed good reproducibility, except for No. 192 with δ/t = 7.3 (Figure 17). The first test without offset showed a lower load than in the second and third tests; thus, that was not caused by the degradation of the specimen. Particular angles increased the buckling load: at 180° in the case of No. 191 with δ/t = 14.6 and δ/t = 7.3 (Figure 14 and Figure 15) and at 0° and 270° in the case of No. 192 with δ/t = 14.6 (Figure 16). Figure 18, Figure 19, Figure 20 and Figure 21 show the shape imperfections on each vertical level of the cylinders before and after the buckling test. No significant changes can be seen between before and after; this also indicates that no damage occurred during the test. Figure 22, Figure 23, Figure 24 and Figure 25 show the shape measurements after the offset buckling test together with the corresponding buckling load. Figure 22 (for No. 191 with δ/t = 14.6) shows that the minimum buckling load was obtained at 0°, but Figure 23 (for No. 191 with δ/t = 7.3) shows that it was obtained at 90°. Similarly, Figure 24 (for No. 192 with δ/t = 14.6) shows that the minimum buckling load was obtained at 180°, but Figure 25 (for No. 192 with δ/t = 7.3) shows it was obtained at 90°. These results show that the buckling load was affected not only by the offset direction and shape imperfection but, also, by the offset amplitude. In addition, the minimum buckling load was not always obtained in the offset direction in the case of a large-amplitude shape imperfection, as shown in Figure 25 for the 270° direction.
Figure 26 plots the KDF over a wide range of r/t. The yellow dots at the r/t = 156 and r/t = 670 are the previous results [2,3]. The KDFs at the r/t = 893 are the present results, and they are equal to or lower than the A-basis value obtained by Takano [7], assuming that the KDF is independent from the r/t. The following linear regression was used to evaluate the dependency of the KDF on the r/t by using an analysis of variance (ANOVA):
K D F = K F D 0 + a ( r t ) ,
Table 4 shows the results of the ANOVA. The coefficient of the r/t is −2.65 × 10⁻⁴. It seems small, but the p-value is 0.001%, which indicates a statistical significance, because it is much smaller than 1%. Usually, a p-value smaller than 1% indicates a high statistical significance. The linear regression is plotted in Figure 26. The line is higher than the KDFs at the r/t = 893; thus, it cannot be used as the design criterion. A statistically lower-bound curve with linear regression can be easily plotted, but a suitable regression form should reflect the physical reason behind the reduction. A reason could not be obtained in this study, because only two specimens were tested; thus, more tests will be required.

6. Conclusions

Buckling tests were performed on composite cylindrical shells with large radius-to-thickness ratios. The shape imperfections before and after the tests were measured, and the buckling loads in the case of an offset load or no offset to the load were measured. The KDFs ranged from 0.43 through 0.52 in the tests; however, the reduction in the KDF by the offset was insignificant. In addition, the relationship between the offset amplitude and offset direction was also insignificant. These results indicate that the major reason for the reduction in the KDF was not load offset or local shape imperfection. The obtained KDFs for the r/t = 893 indicated a dependency between the KDF and r/t. An ANOVA by linear regression indicated that the KDF decreased with the increasing r/t. Thus, to obtain a lower-bound curve of the KDF, the major reason for reduction in the KDF remains to be revealed.

Author Contributions

Conceptualization, A.T.; methodology, A.T.; software, A.T.; validation, A.T. and J.B.; formal analysis, A.T. and J.B.; investigation, J.B.; writing—original draft preparation, A.T.; and writing—review and editing, R.K. and T.M. All authors have read and agreed to the published version of the manuscript.

Funding

This research received no external funding.

Institutional Review Board Statement

Not applicable.

Informed Consent Statement

Not applicable.

Data Availability Statement

The data presented in this study are available on request from the corresponding author.

Conflicts of Interest

The authors declare no conflict of interest.

References

  1. Hilburger, M.W.; Nemeth, M.P.; Starnes, J.H., Jr. Shell Buckling Design Criteria Based on Manufacturing Imperfection Signatures. AIAA J. 1999, 37, 276–278. [Google Scholar]
  2. Takano, A. Buckling Experiment on Anisotropic Long and Short Cylinders. Adv. Technol. Innov. 2016, 1, 25–27. [Google Scholar]
  3. Takano, A. Buckling Test Composite Cylindrical Shells with Oval Imperfection Under Axial Compression. In Proceedings of the European Conference on Spacecraft Structures, Materials and Environmental Testing (ECSSMET), NoordwijK, The Netherlands, 28 May–1 June 2018. [Google Scholar]
  4. Bao, J.; Takano, A. Influence on Buckling Strength by the Axial Shape Imperfection of the CFRP Cylinder. In Proceedings of the JSASS/JSME/JAXA Structures Conference, Nagano, Japan, 7–9 August 2019. 1B09. (In Japanese). [Google Scholar]
  5. Wagner, H.N.R.; Hühne, C.; Elishakoff, I. Probabilistic and Deterministic Lower-Bound Design Benchmarks for Cylindrical Shells under Axial Compression. Thin Walled Struct. 2020, 146, 106451. [Google Scholar] [CrossRef]
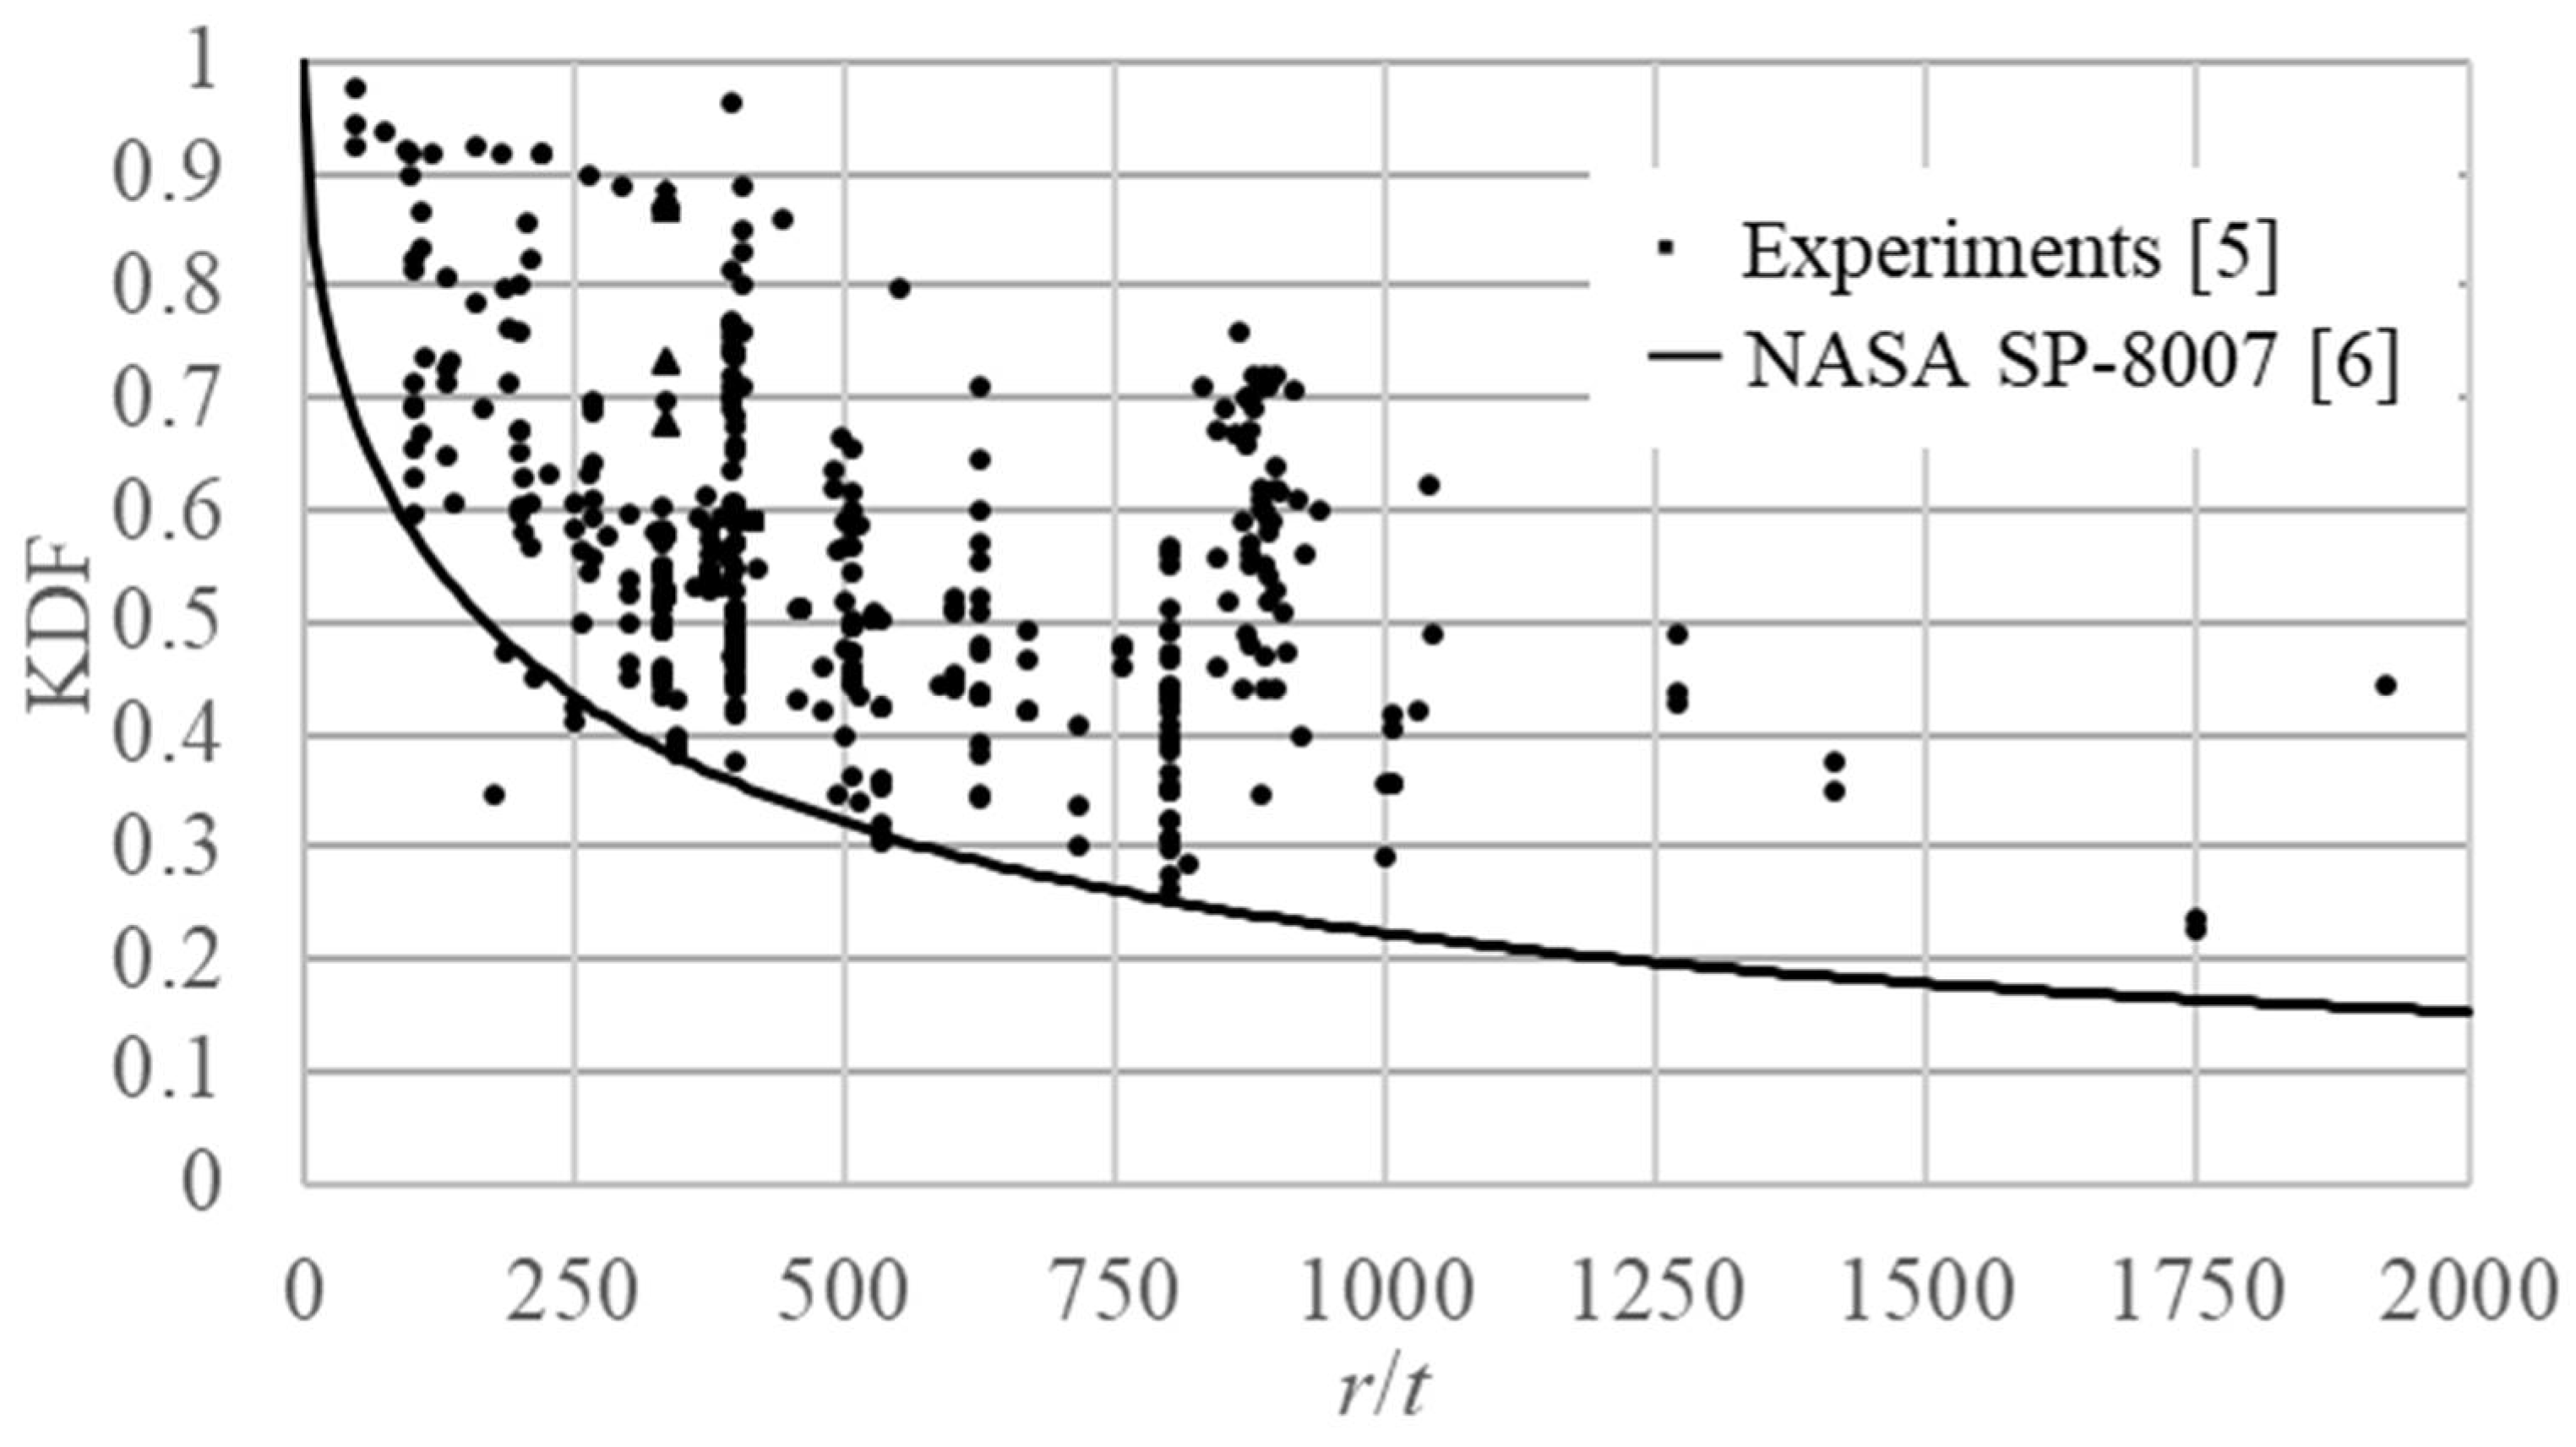
  6. National Aeronautics and Space Administration. Buckling of Thin–Walled Circular Cylinders; NASA SP–8007; NASA: Washington, DC, USA, 1968.
  7. Takano, A. Statistical Knockdown Factors of Buckling Anisotropic Cylinders Under Axial Compression. J. Appl. Mech. 2012, 79, 051004. [Google Scholar] [CrossRef]
  8. Wagner, R.H.N.; Hühne, C.; Niemann, S.; Khakimova, R. Robust design criterion for axially loaded cylindrical shells—Simulation and Validation. Thin Walled Struct. 2017, 115, 154–162. [Google Scholar] [CrossRef]
  9. Wagner, R.H.N.; Hühne, C. Robust knockdown factors for the design of cylindrical shells under axial compression—potentials, practical application and reliability analysis. Int. J. Mech. Sci. 2018, 135, 410–430. [Google Scholar] [CrossRef]
  10. Tobias, S.H.; Dieter, K. The Influence of Geometric Imperfections of Different Tolerance Levels on the Buckling Load of Unstiffened CFRP Cylindrical Shells. In Proceedings of the Twenty-Second International Conference on Composite Materials (ICCM22), Melbourne, Australia, 11–16 August 2019. [Google Scholar]
  11. Wagner, H.N.R.; Sosa, E.M.; Ludwig, T.; Croll, J.G.A.; Hühne, C. Robust design of imperfection sensitive thin-walled shells under axial compression, bending or external pressure. Int. J. Mech. Sci. 2019, 156, 205–220. [Google Scholar] [CrossRef]
  12. Arbelo, M.A.; Zimmermann, R.; Castro, S.G.P.; Degenhardt, R. Comparison of new Design Guidelines for Composite Cylindrical Shells prone to Buckling. In Proceedings of the 9th International Conference on Composite Science and Technology, Sorrento, Italy, 24–26 April 2013. [Google Scholar]
  13. Wagner, H.N.R.; Petersen, E.; Khakimova, R.; Hühne, C. Buckling Analysis of an Imperfection-Insensitive Hybrid Composite Cylinder under axial Compression—Numerical Simulation, Destructive and Nondestructive Experimental Testing. Compos. Struct. 2019, 225, 111152. [Google Scholar] [CrossRef]
  14. Khakimova, R.; Castro, S.G.P.; Wilckens, D.; Rohwer, K.; Degenhardt, R. Buckling of Axially Compressed CFRP Cylinders with and without Additional Lateral load: Experimental and Numerical Investigation. Thin Walled Struct. 2017, 19, 178–189. [Google Scholar] [CrossRef]
  15. Sahu, V.; Gayathri, V. Strength Studies of Dadri Fly Ash Modified with Lime Sludge—A Composite Material. Int. J. Eng. Technol. Innov. 2014, 4, 161–169. [Google Scholar]
  16. Liu, C.M.; Chiang, M.S.; Chuang, W.C. Lean Transformation for Composite-Material Bonding Processes. Int. J. Eng. Technol. Innov. 2012, 2, 48–62. [Google Scholar]
  17. Chang, C.Y. Segmented Compression Molding for Composite Manufacture. Proc. Eng. Technol. Innov. 2017, 5, 41–44. [Google Scholar]
  18. Chang, C.Y.; Chen, W.R. Experimental Study of Progressive Compression Method of Resin Delivery in Liquid Composite Molding. Proc. Eng. Technol. Innov. 2016, 2, 23–25. [Google Scholar]
  19. Takano, A. Simple Closed-Form Solution for the Buckling of Moderately Thick Anisotropic Cylinders. Trans. Jpn. Soc. Aeronaut. Space Sci. Aerosp. Technol. Jpn. 2012, 10, 17–26. [Google Scholar] [CrossRef]
Figure 1. The knockdown factor (KDF) of the metal cylinders. r/t: radius-to-thickness ratio [5,6].
Applsci 11 00854 g001
Figure 2. Cylindrical specimen deformed by touch.
Applsci 11 00854 g002
Figure 3. Bonding fixture.
Applsci 11 00854 g003
Figure 4. Setting the specimen in the end ring.
Applsci 11 00854 g004
Figure 5. Setting the alignment ring.
Applsci 11 00854 g005
Figure 6. Setting the alignment plate.
Applsci 11 00854 g006
Figure 7. Cylindrical specimen with both end rings.
Applsci 11 00854 g007
Figure 8. Shape measurement equipment.
Applsci 11 00854 g008
Figure 9. Test setup with the adjustment fixture.
Applsci 11 00854 g009
Figure 10. Test without offset.
Applsci 11 00854 g010
Figure 11. Test with offset.
Applsci 11 00854 g011
Figure 12. Test setup with the adjustment fixture. LDS: laser displacement sensor.
Applsci 11 00854 g012
Figure 13. Overview of the buckling test.
Applsci 11 00854 g013
Figure 14. Buckling loads for the offset and no offset for No. 191 with an offset amplitude δ/t = 14.6.
Applsci 11 00854 g014
Figure 15. Buckling loads for the offset and no offset for No. 191 with an δ/t = 7.3.
Applsci 11 00854 g015
Figure 16. Buckling loads for the offset and no offset for No. 192 with an δ/t = 14.6.
Applsci 11 00854 g016
Figure 17. Buckling loads for the offset and no offset for No. 192 with an δ/t = 7.3.
Applsci 11 00854 g017
Figure 18. Shape imperfections on each vertical level of No. 191 before the buckling test.
Applsci 11 00854 g018
Figure 19. Shape imperfections on each vertical level of No. 191 after the buckling test.
Applsci 11 00854 g019
Figure 20. Shape imperfections on each vertical level of No. 192 before the buckling test.
Applsci 11 00854 g020
Figure 21. Shape imperfections on each vertical level of No. 192 after the buckling test.
Applsci 11 00854 g021
Figure 22. The relationship between the shape imperfection amplitude and buckling load of No. 191; the buckling load on the δ/t = 14.6.
Applsci 11 00854 g022
Figure 23. The relationship between the shape imperfection amplitude and buckling load of No. 191; the buckling load on the δ/t = 7.3.
Applsci 11 00854 g023
Figure 24. The relationship between the shape imperfection amplitude and buckling load of No. 192; the δ/t = 14.6.
Applsci 11 00854 g024
Figure 25. The relationship between the shape imperfection amplitude and buckling load of No. 192; the δ/t = 7.3.
Applsci 11 00854 g025
Figure 26. KDF values for a large range of r/t.
Applsci 11 00854 g026
Table 1. Material properties of HSX350C075S carbon fiber-reinforced plastic (CFRP).
PropertyValue
Ply thickness (mm)0.056
Young modulus of fiber direction EL (GPa)257.4
Young modulus of transverse direction ET (GPa)6.770
Shear modulus, GLT (MPa)4.495
Poisson’s ratio νLT(–)0.33
Table 2. Configuration of the cylindrical specimens. L/r: length-to-radius ratio and r/t: radius-to-thickness ratio.
PropertyValue
Laminate sequence(−50/50)
Radius, r (mm)100
Thickness, t (mm)0.112
Length, L (mm)200
L/r2
r/t893
Table 3. Major specifications.
Measurement range (vertical)388 mm
Laser displacement equipmentResolution2 μm
Range±10 mm
Stepper motorVertical0.201 mm/step
Rotational0.02°/step
Table 4. Analysis of variance (ANOVA).
TermCoef.Std. Dev.p-Value
Intercept, KDF00.8450.0157290.000%
r/t, a−2.65 × 10−45.88 × 10−50.001%
Publisher’s Note: MDPI stays neutral with regard to jurisdictional claims in published maps and institutional affiliations.

