Meta-Analysis and Systematic Review of the Application of Machine Learning Classifiers in Biomedical Applications of Infrared Thermography


Abstract
1. Introduction
2. Materials and Methods
2.1. Information Sources
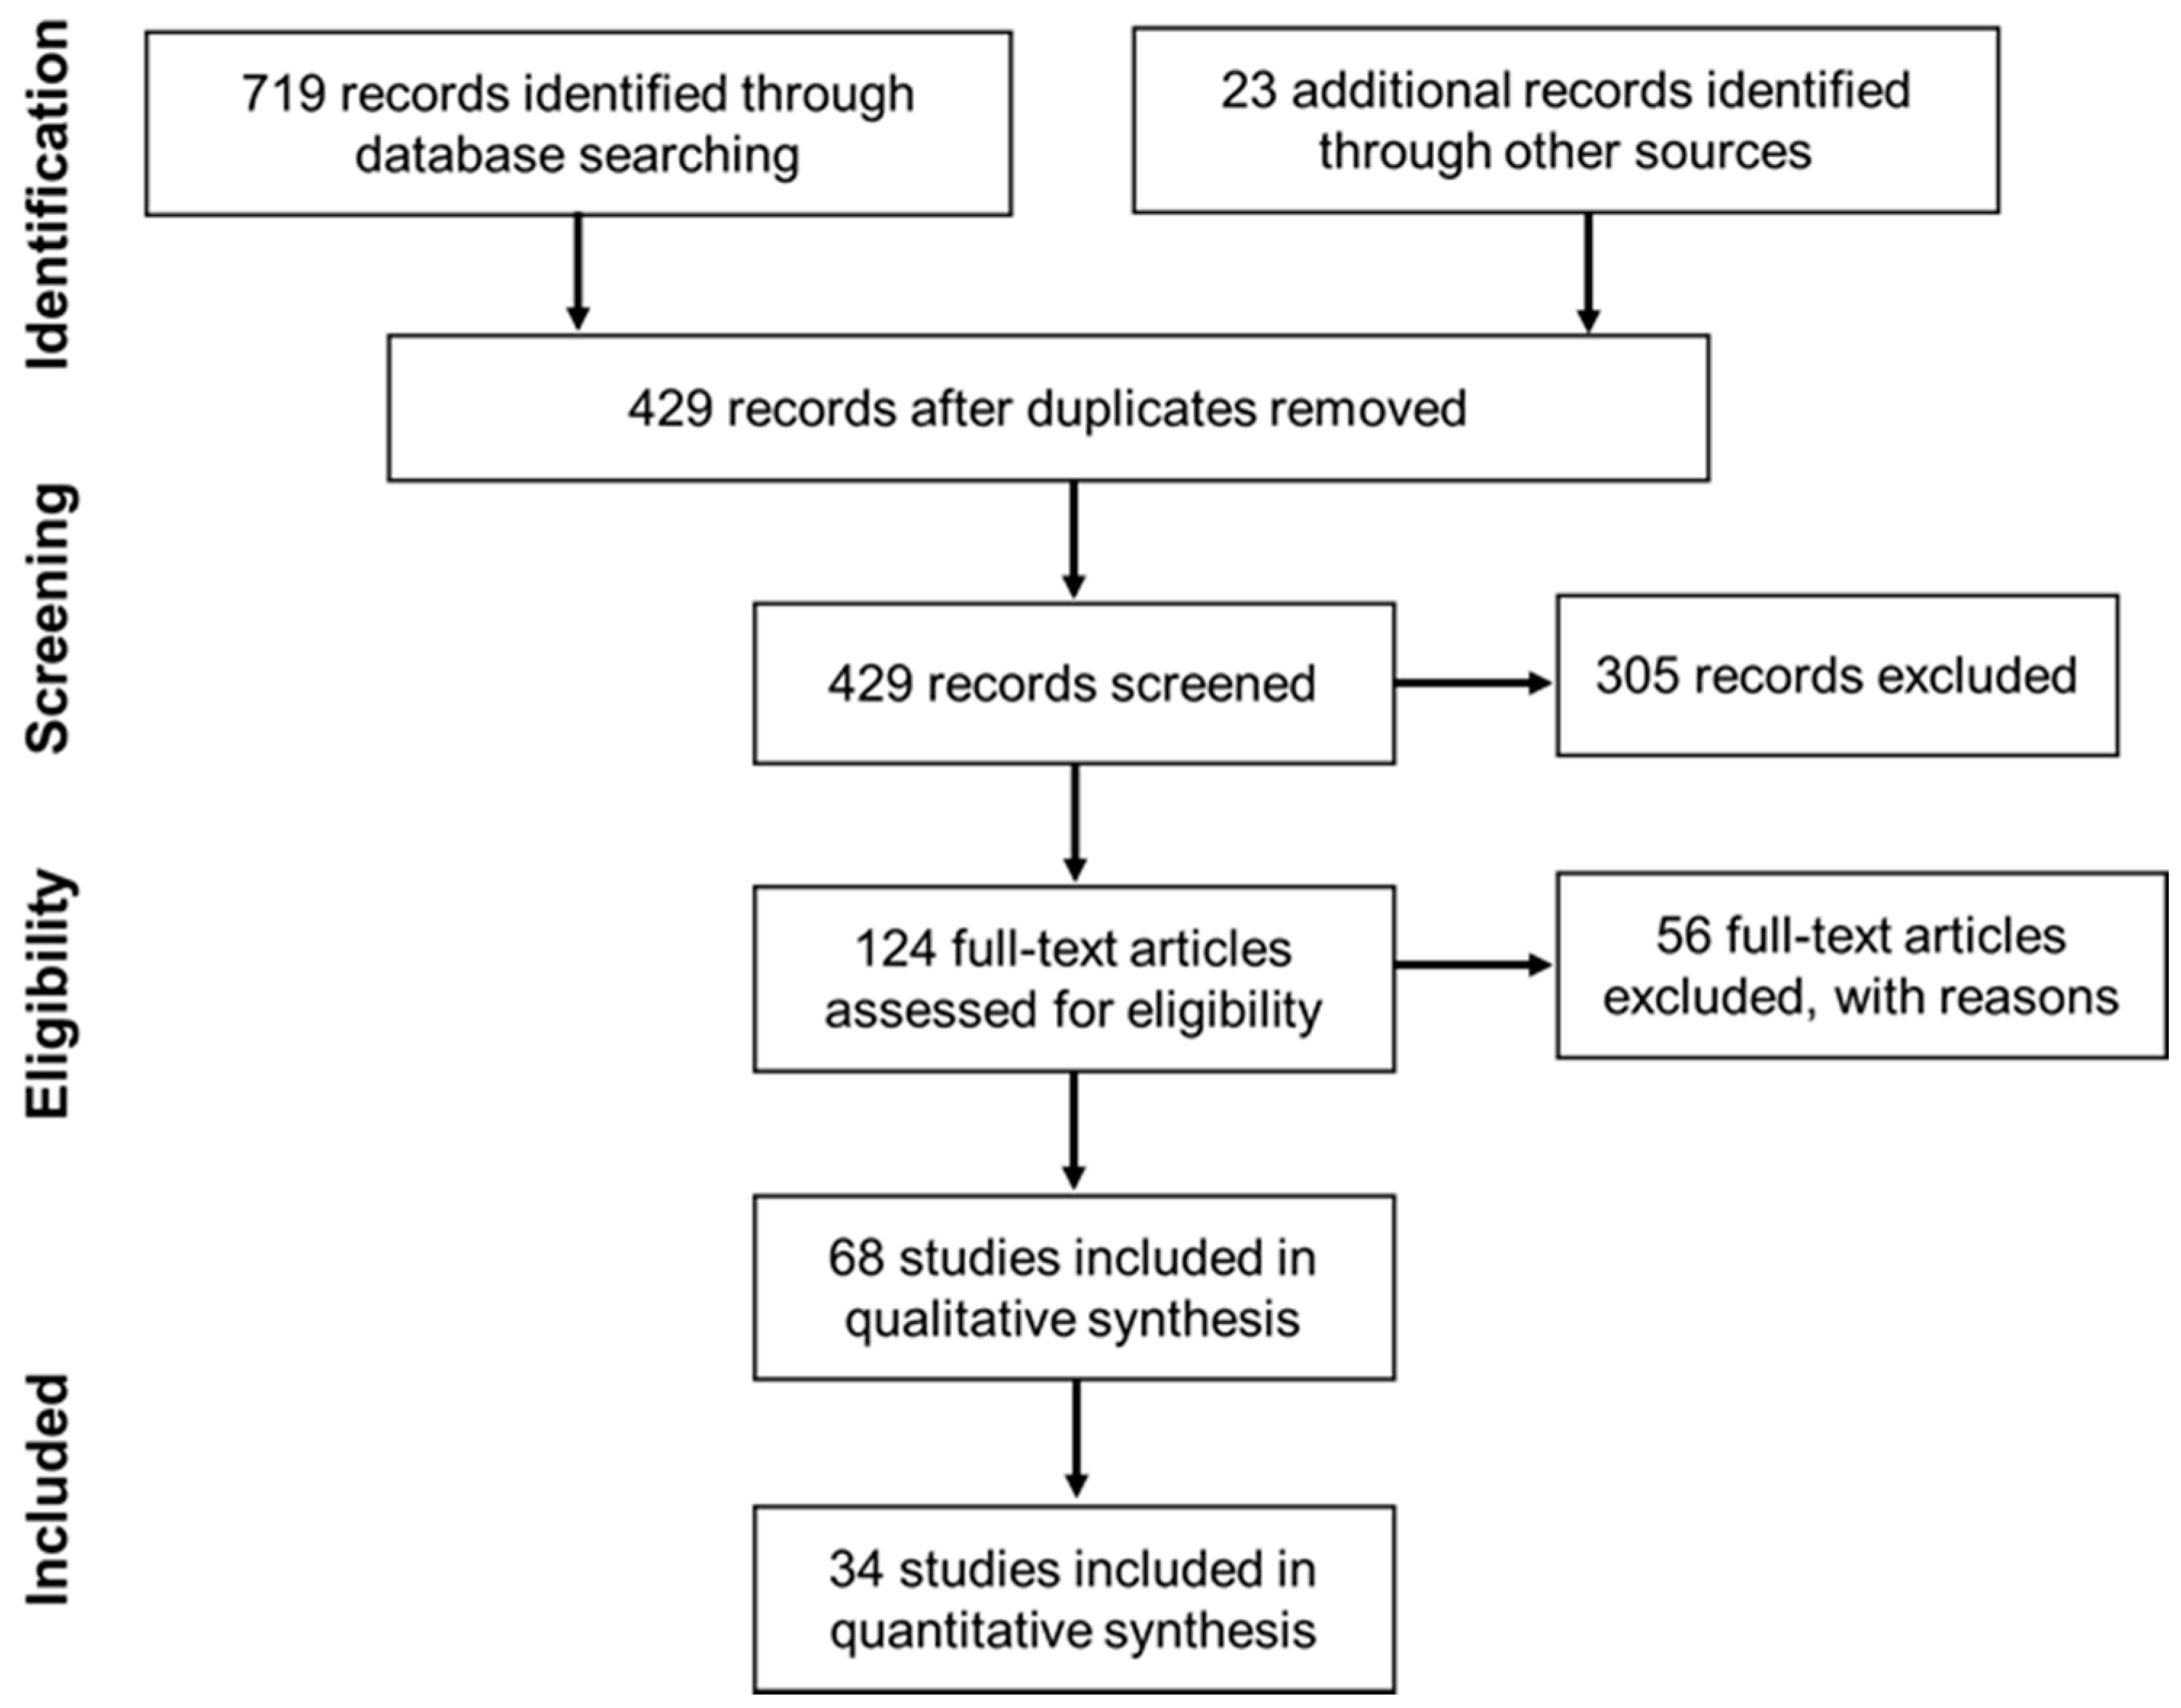
2.2. Eligibility Criteria and Screening
3. Results
3.1. Qualitative Synthesis
3.1.1. Breast Cancer
3.1.2. Diabetes Disease
3.1.3. Skin Cancer
3.1.4. Other Conditions
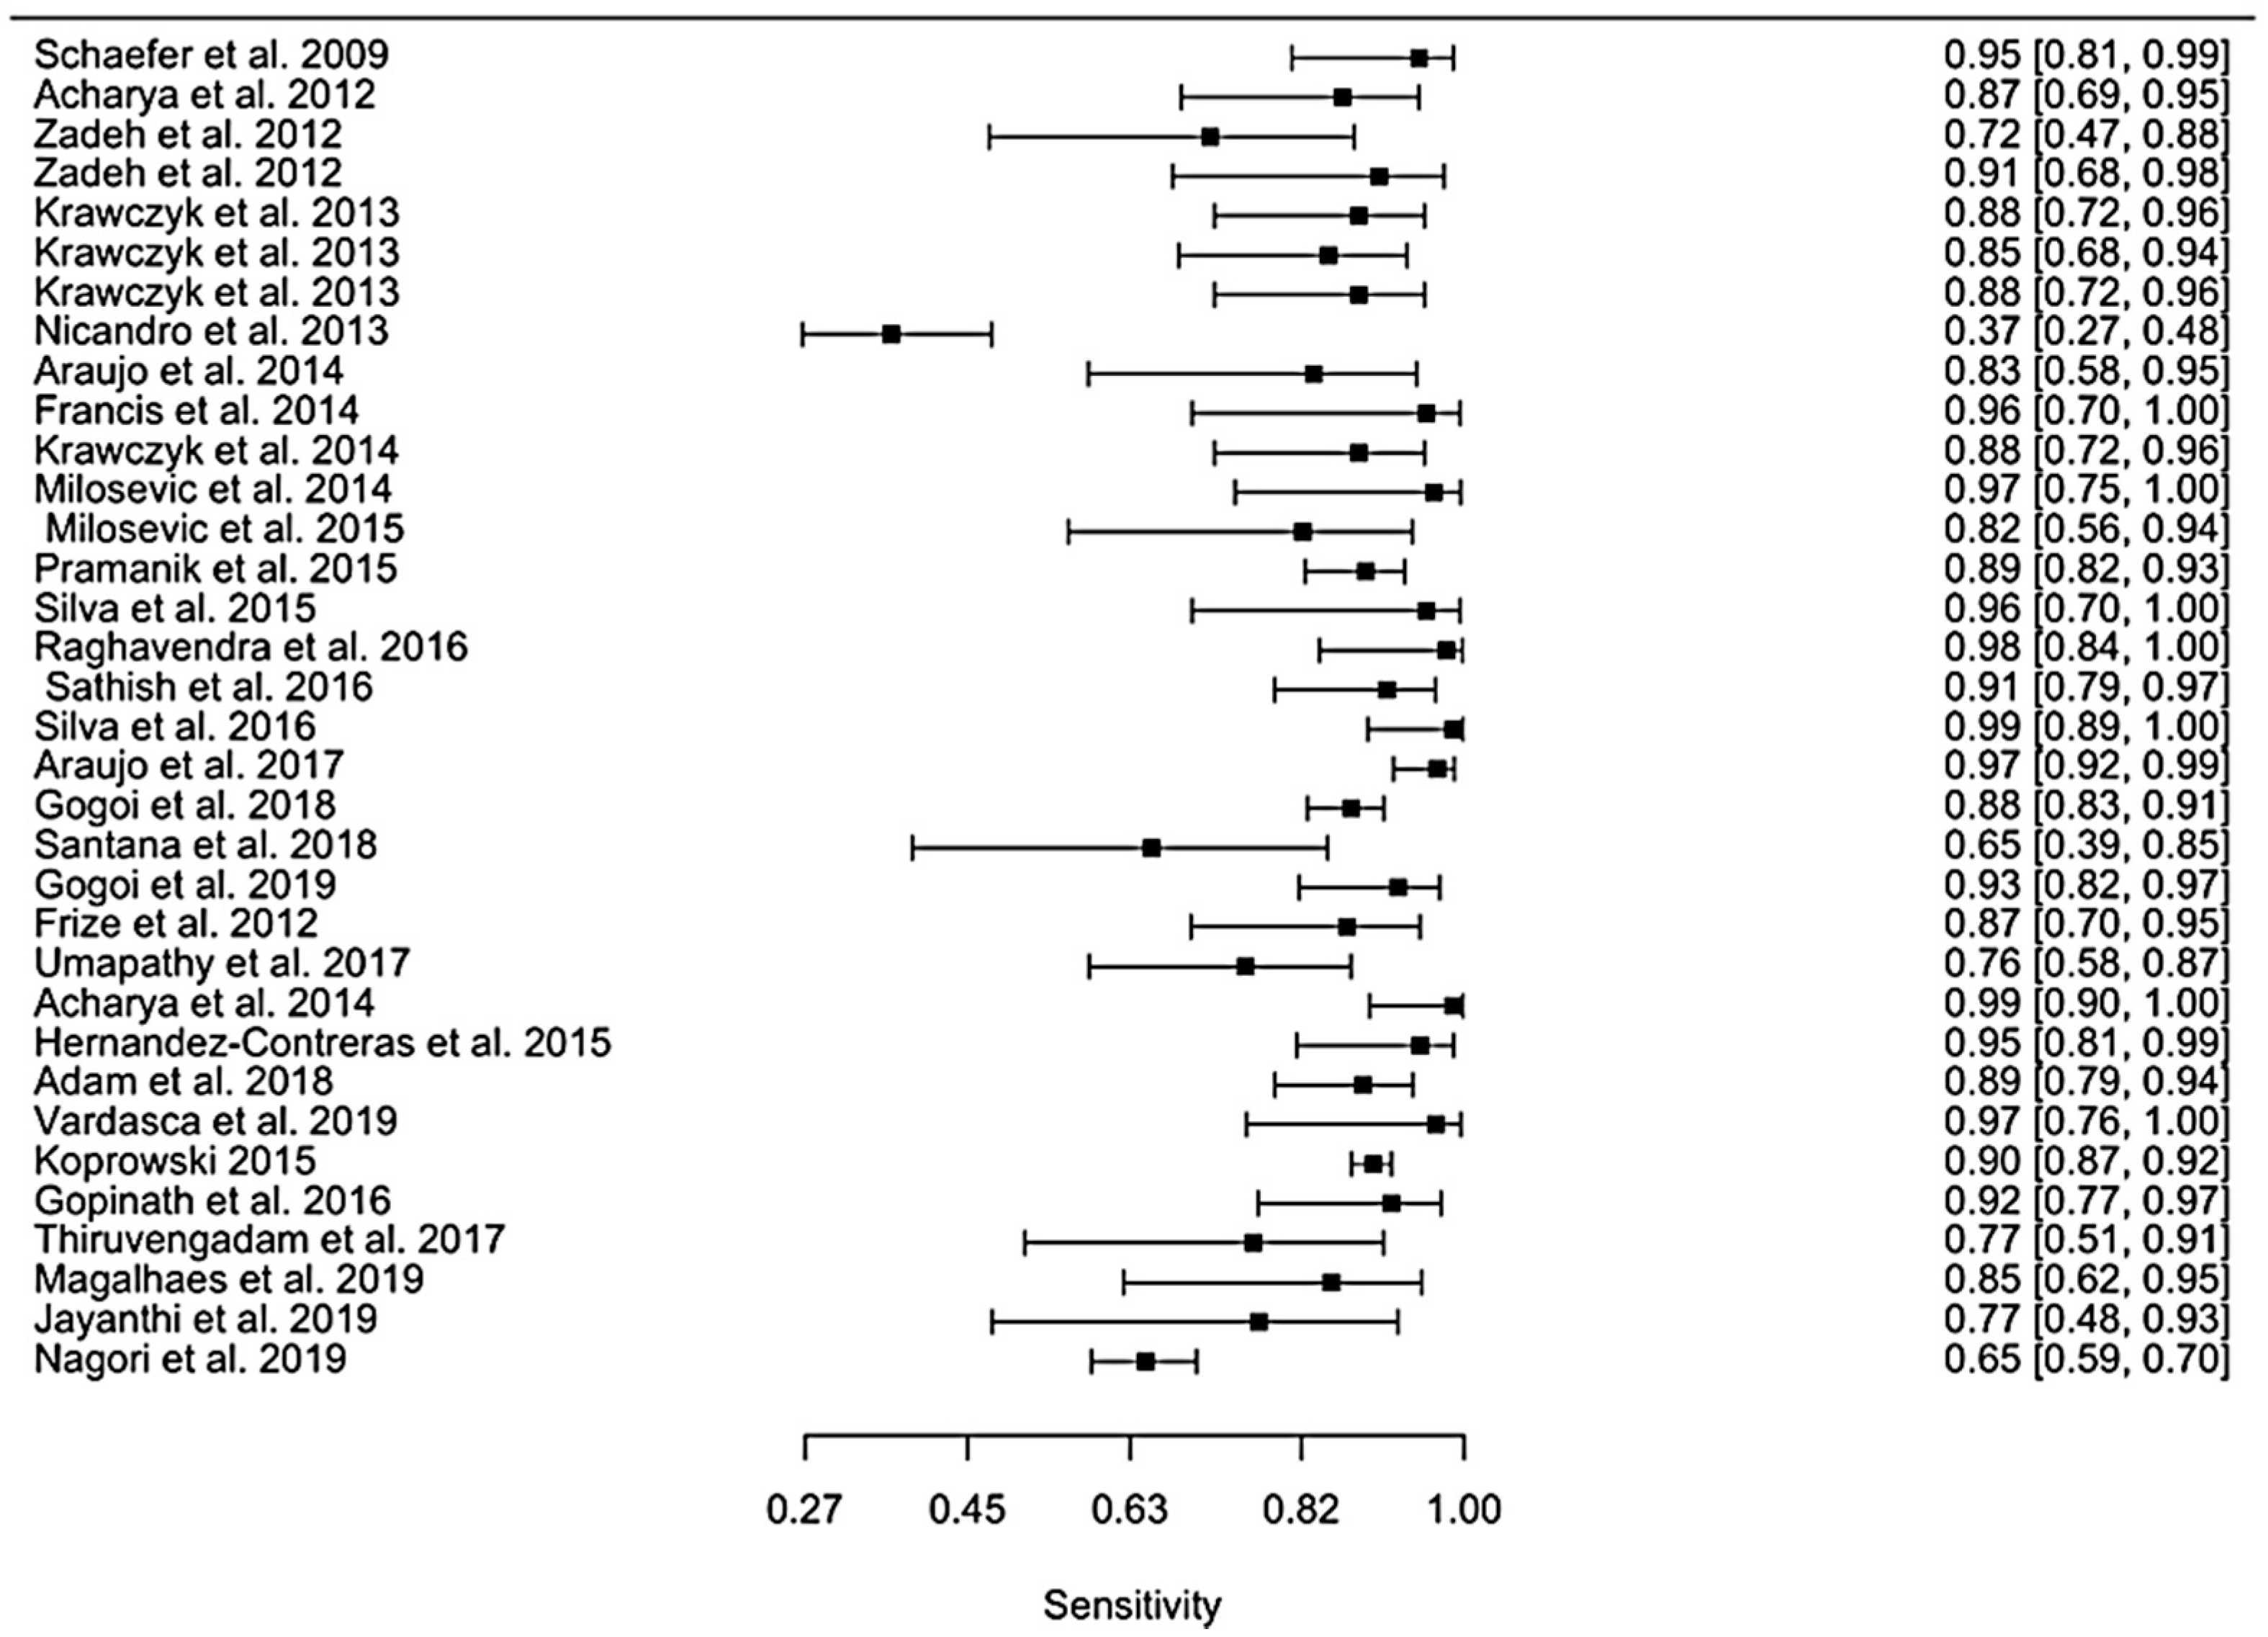
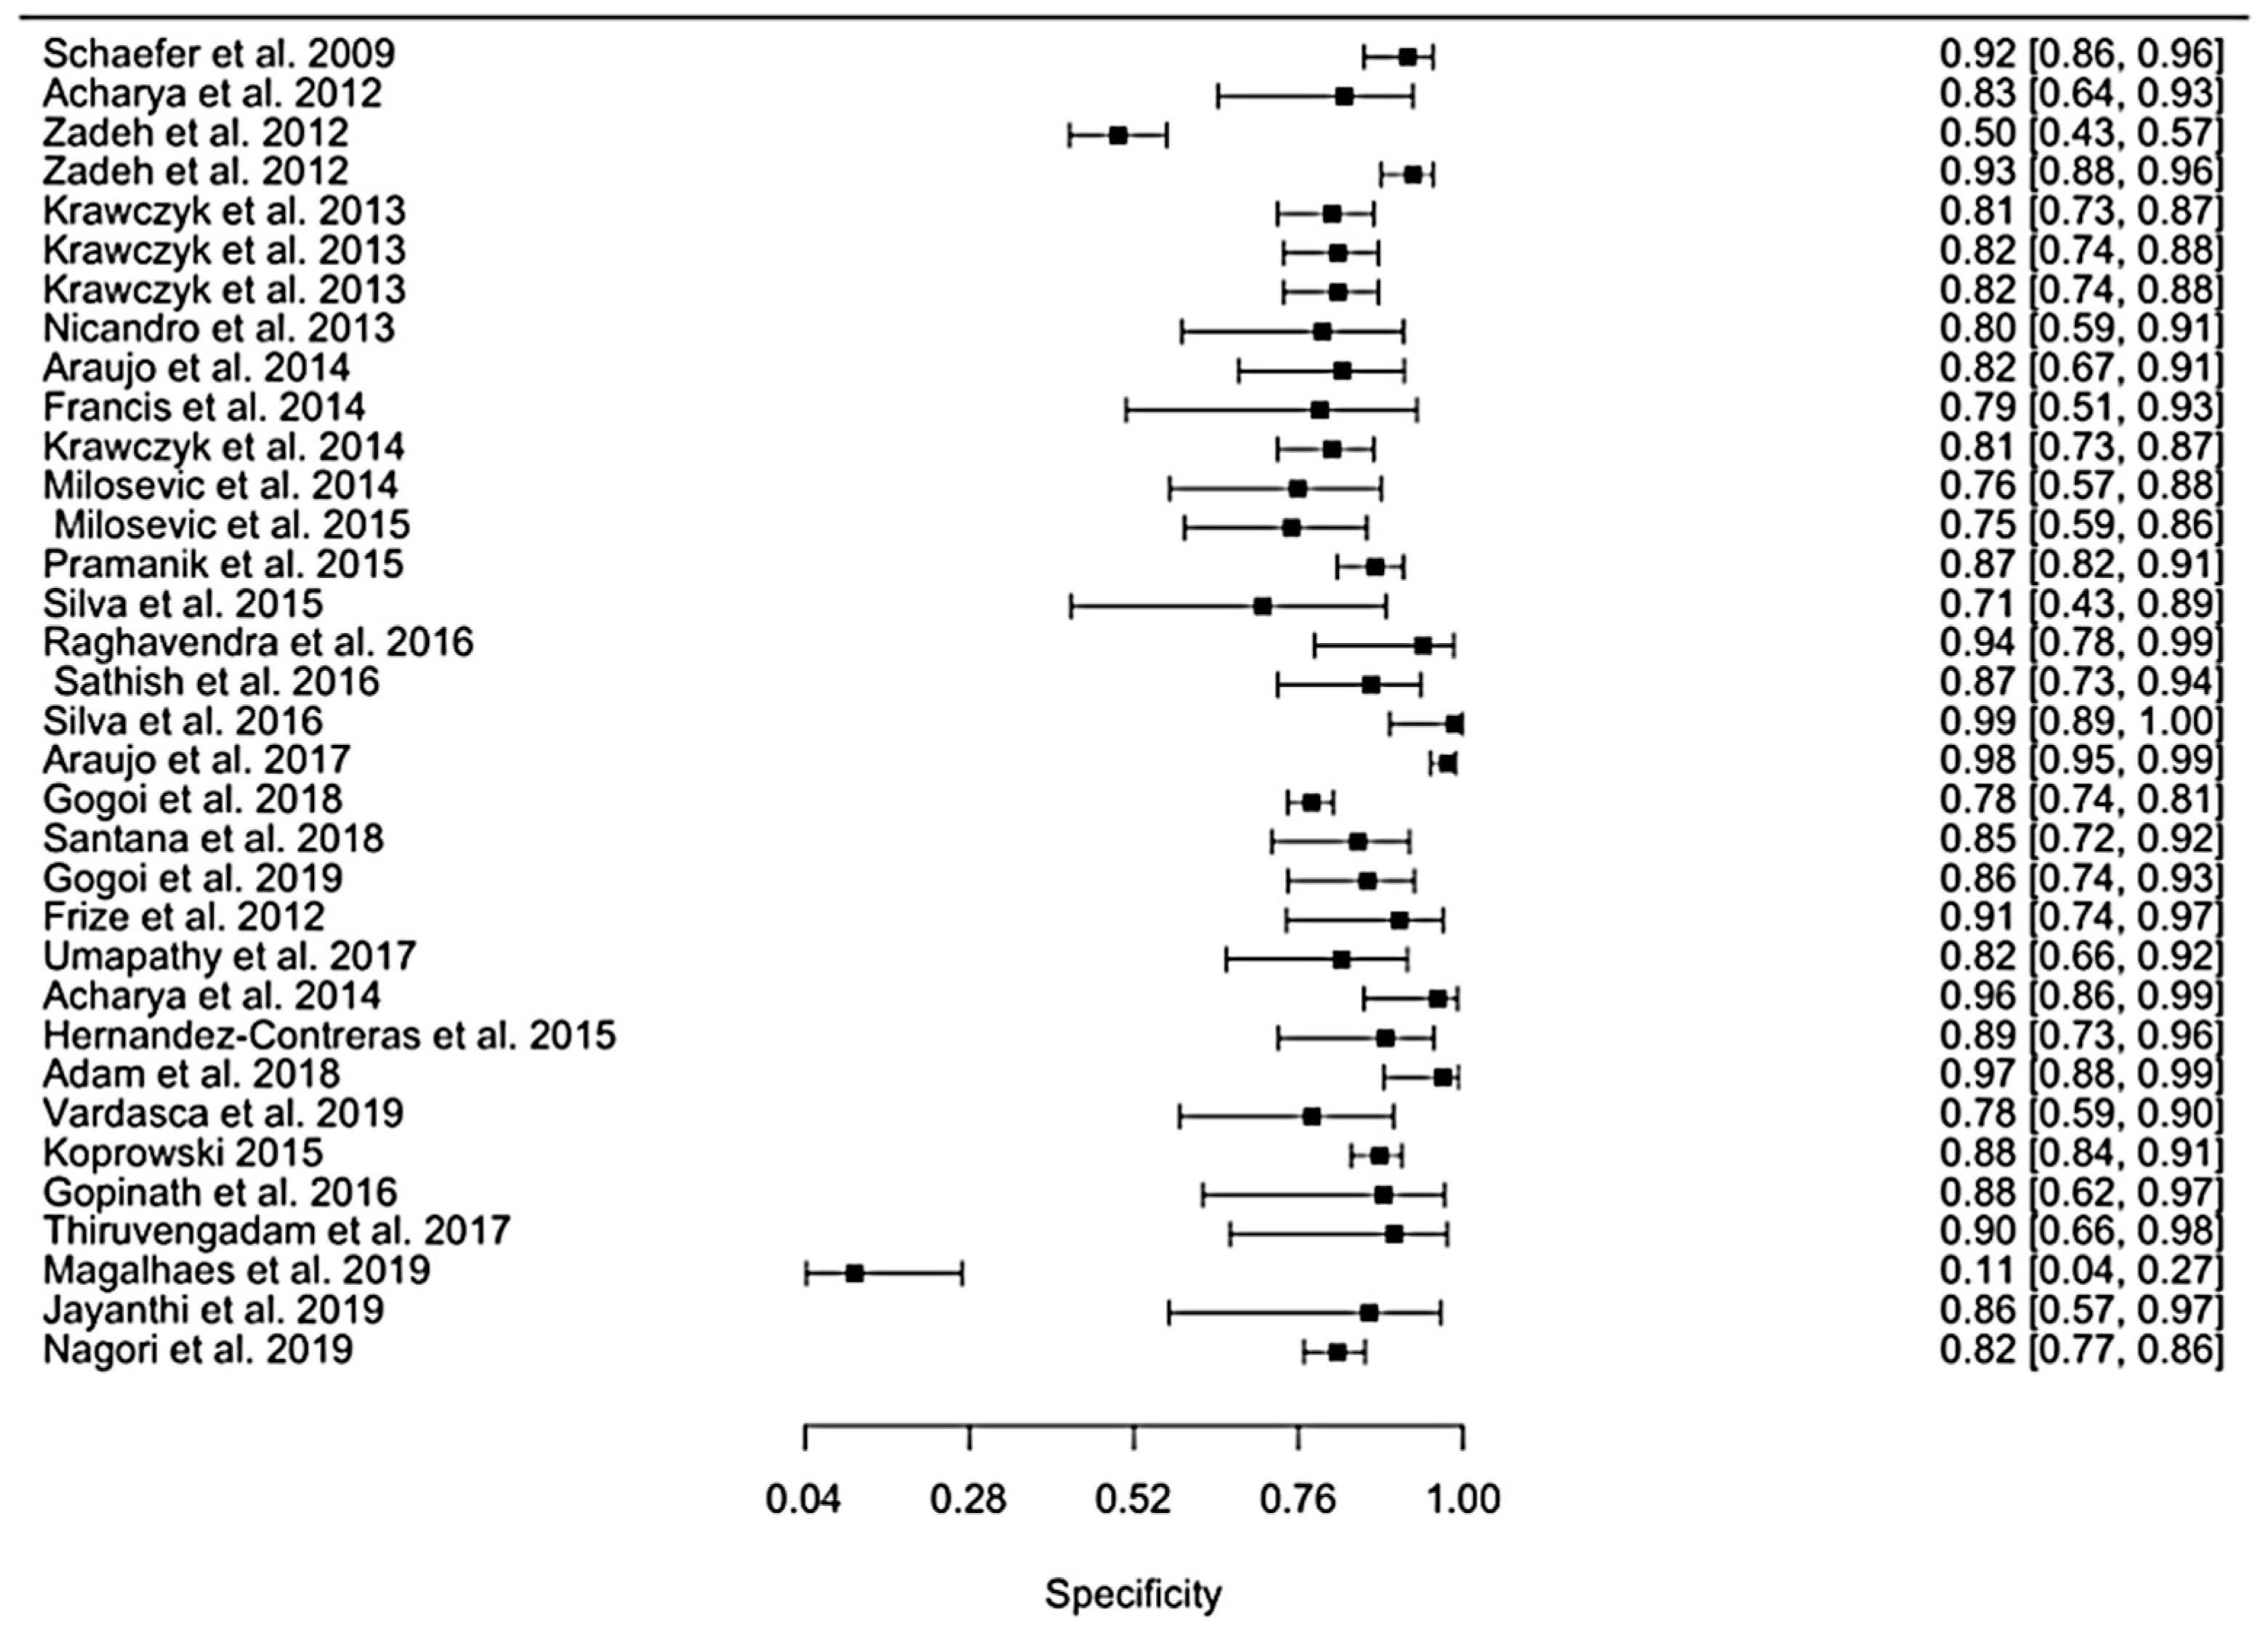
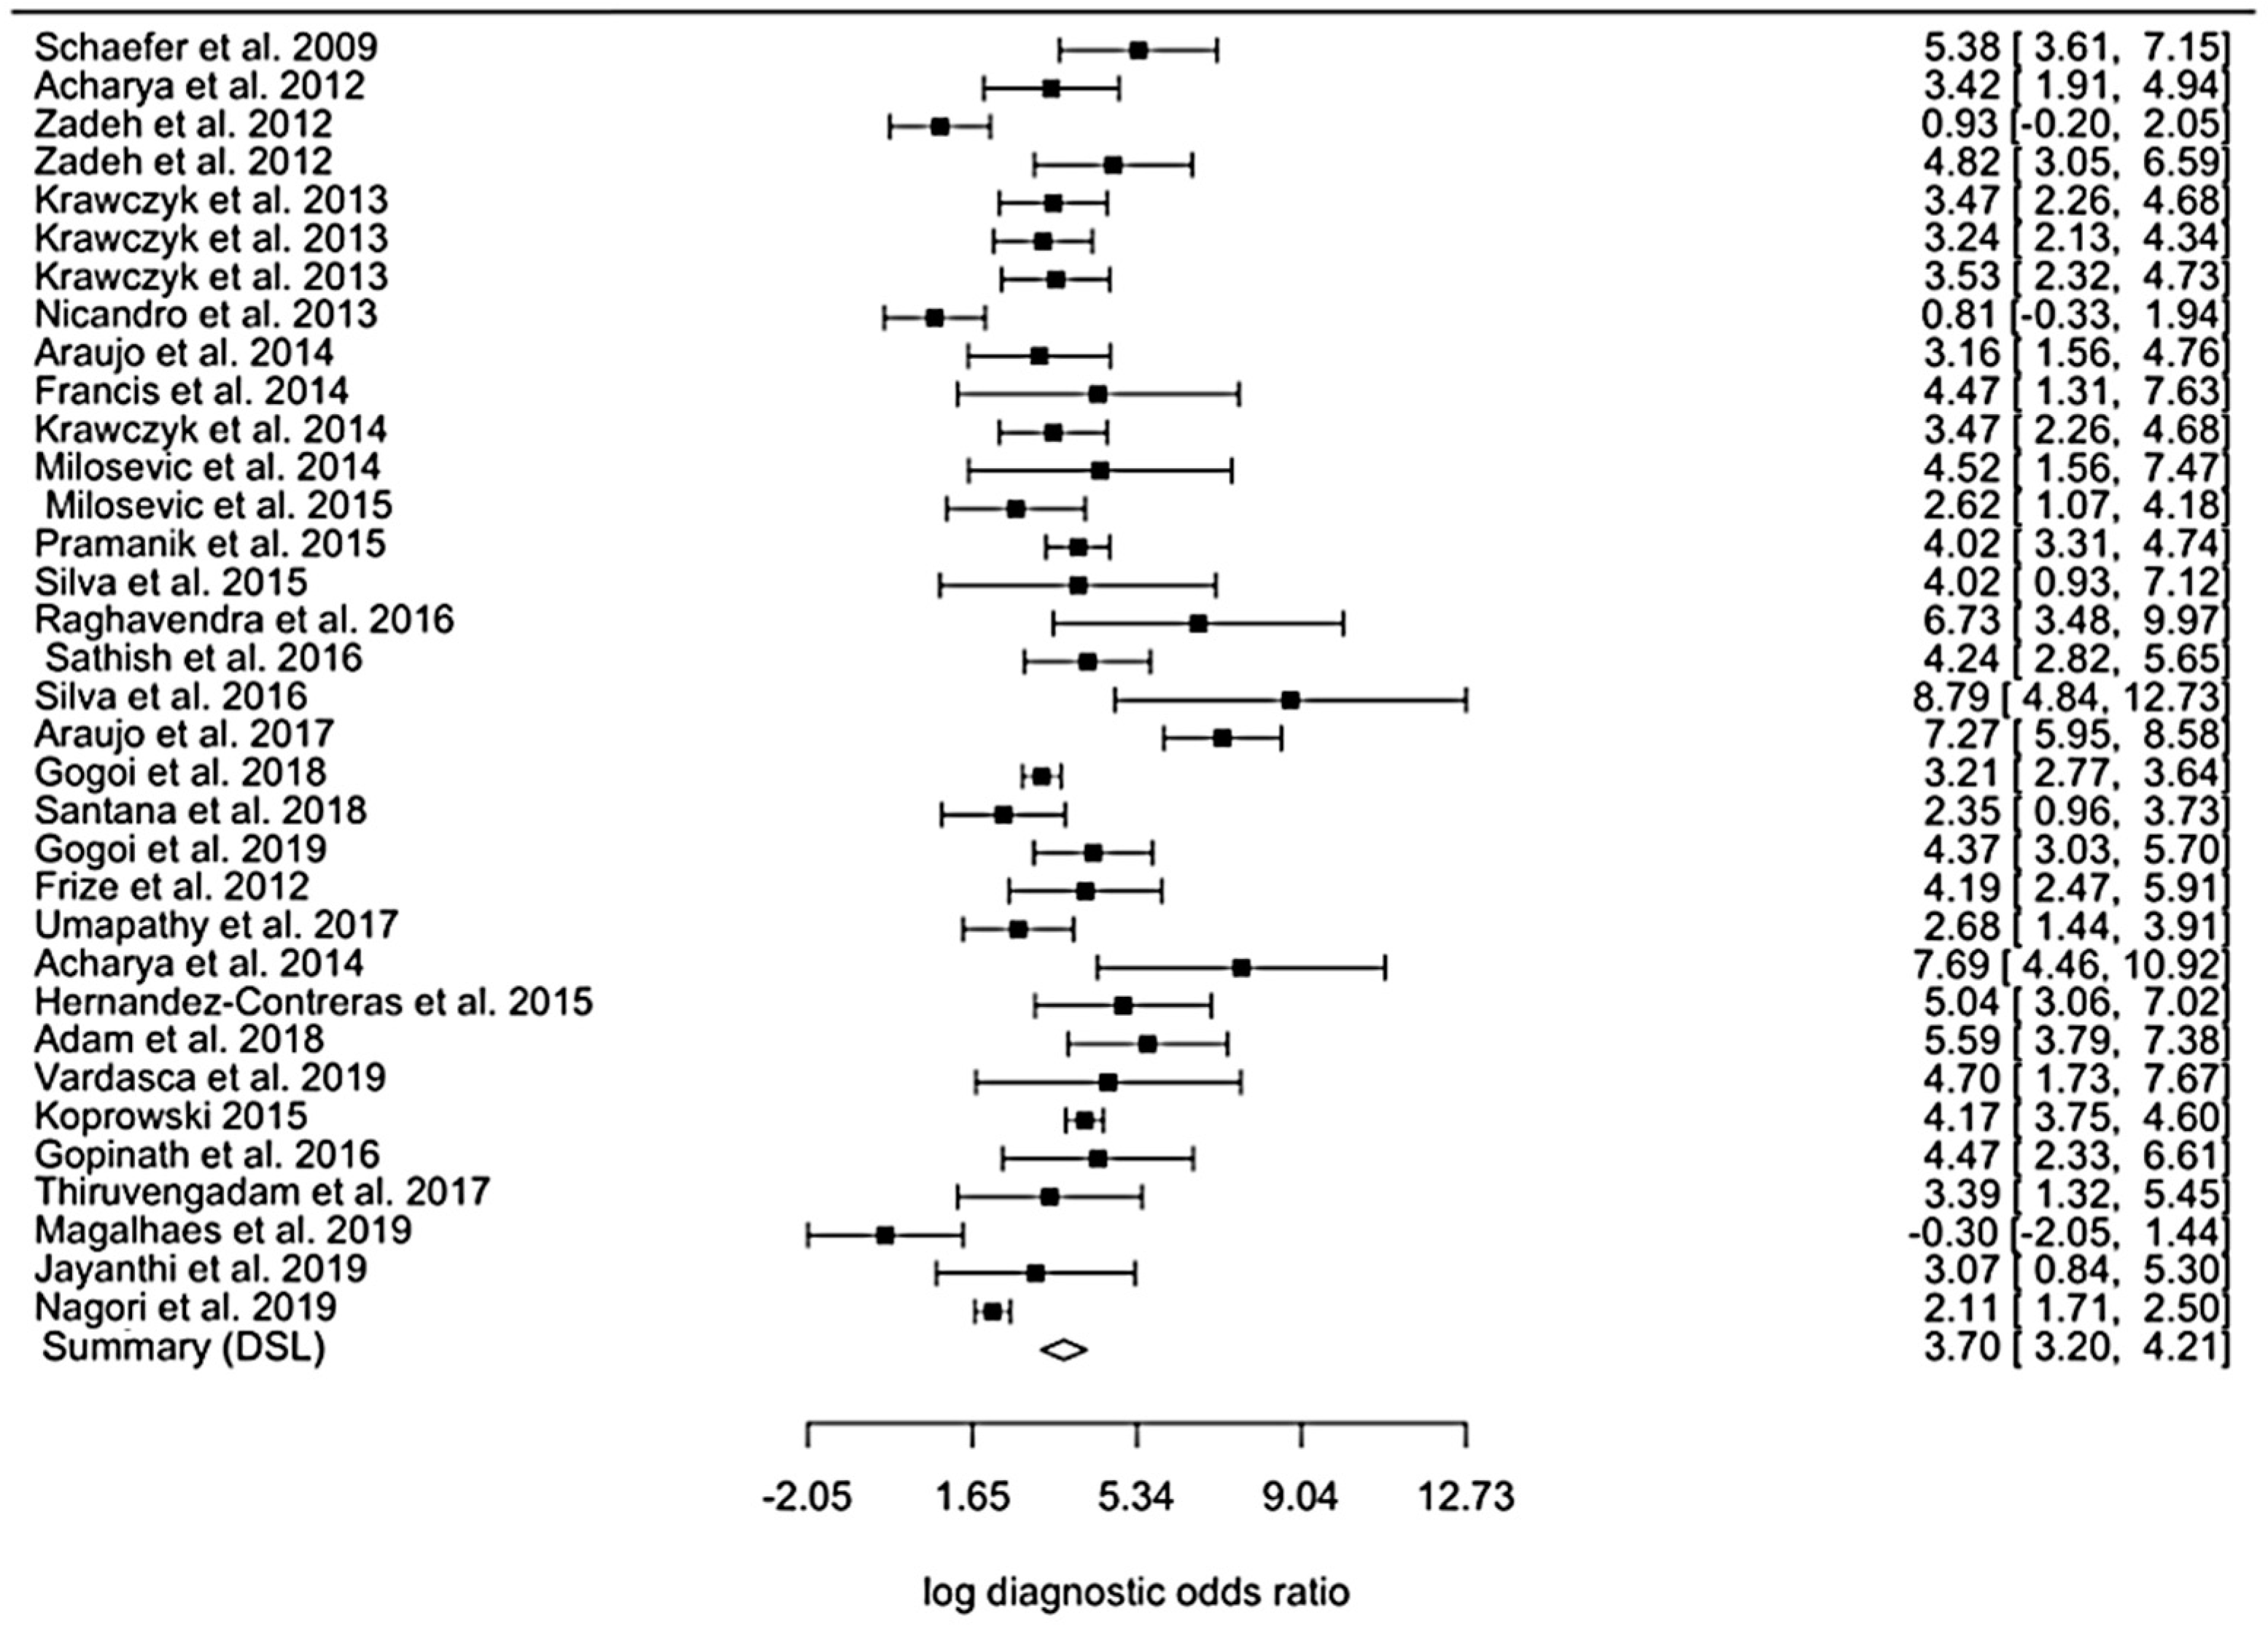
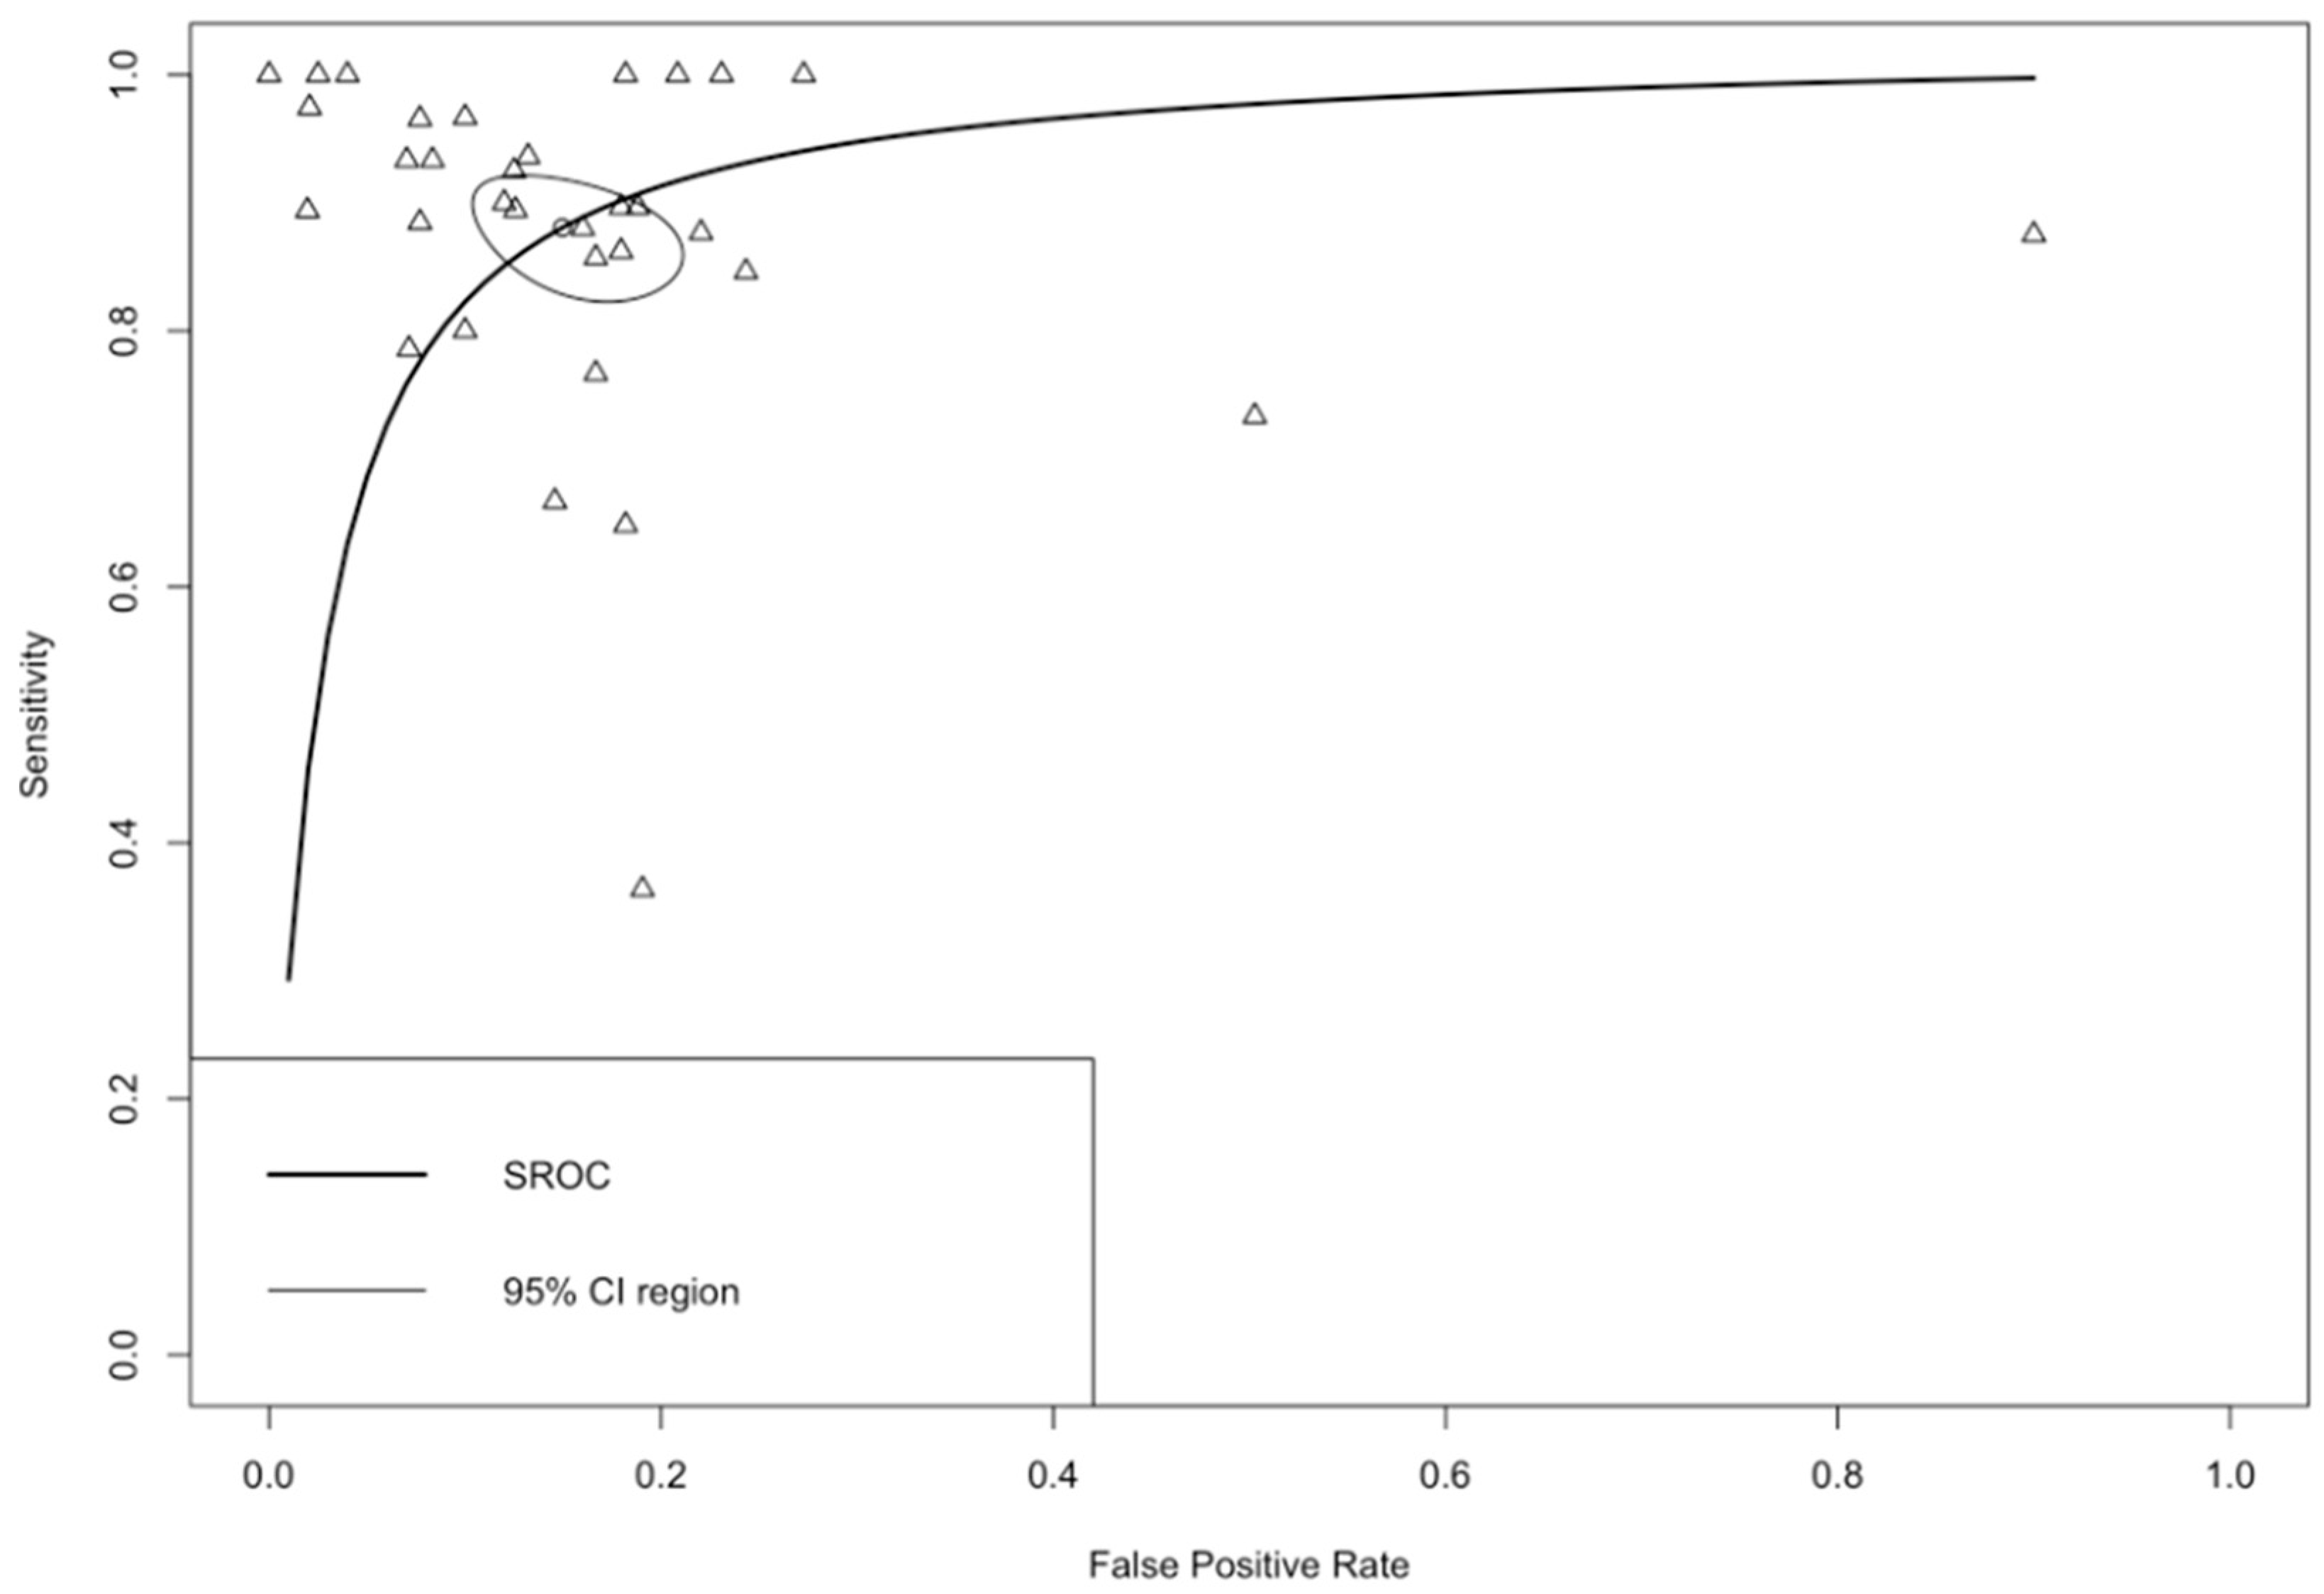
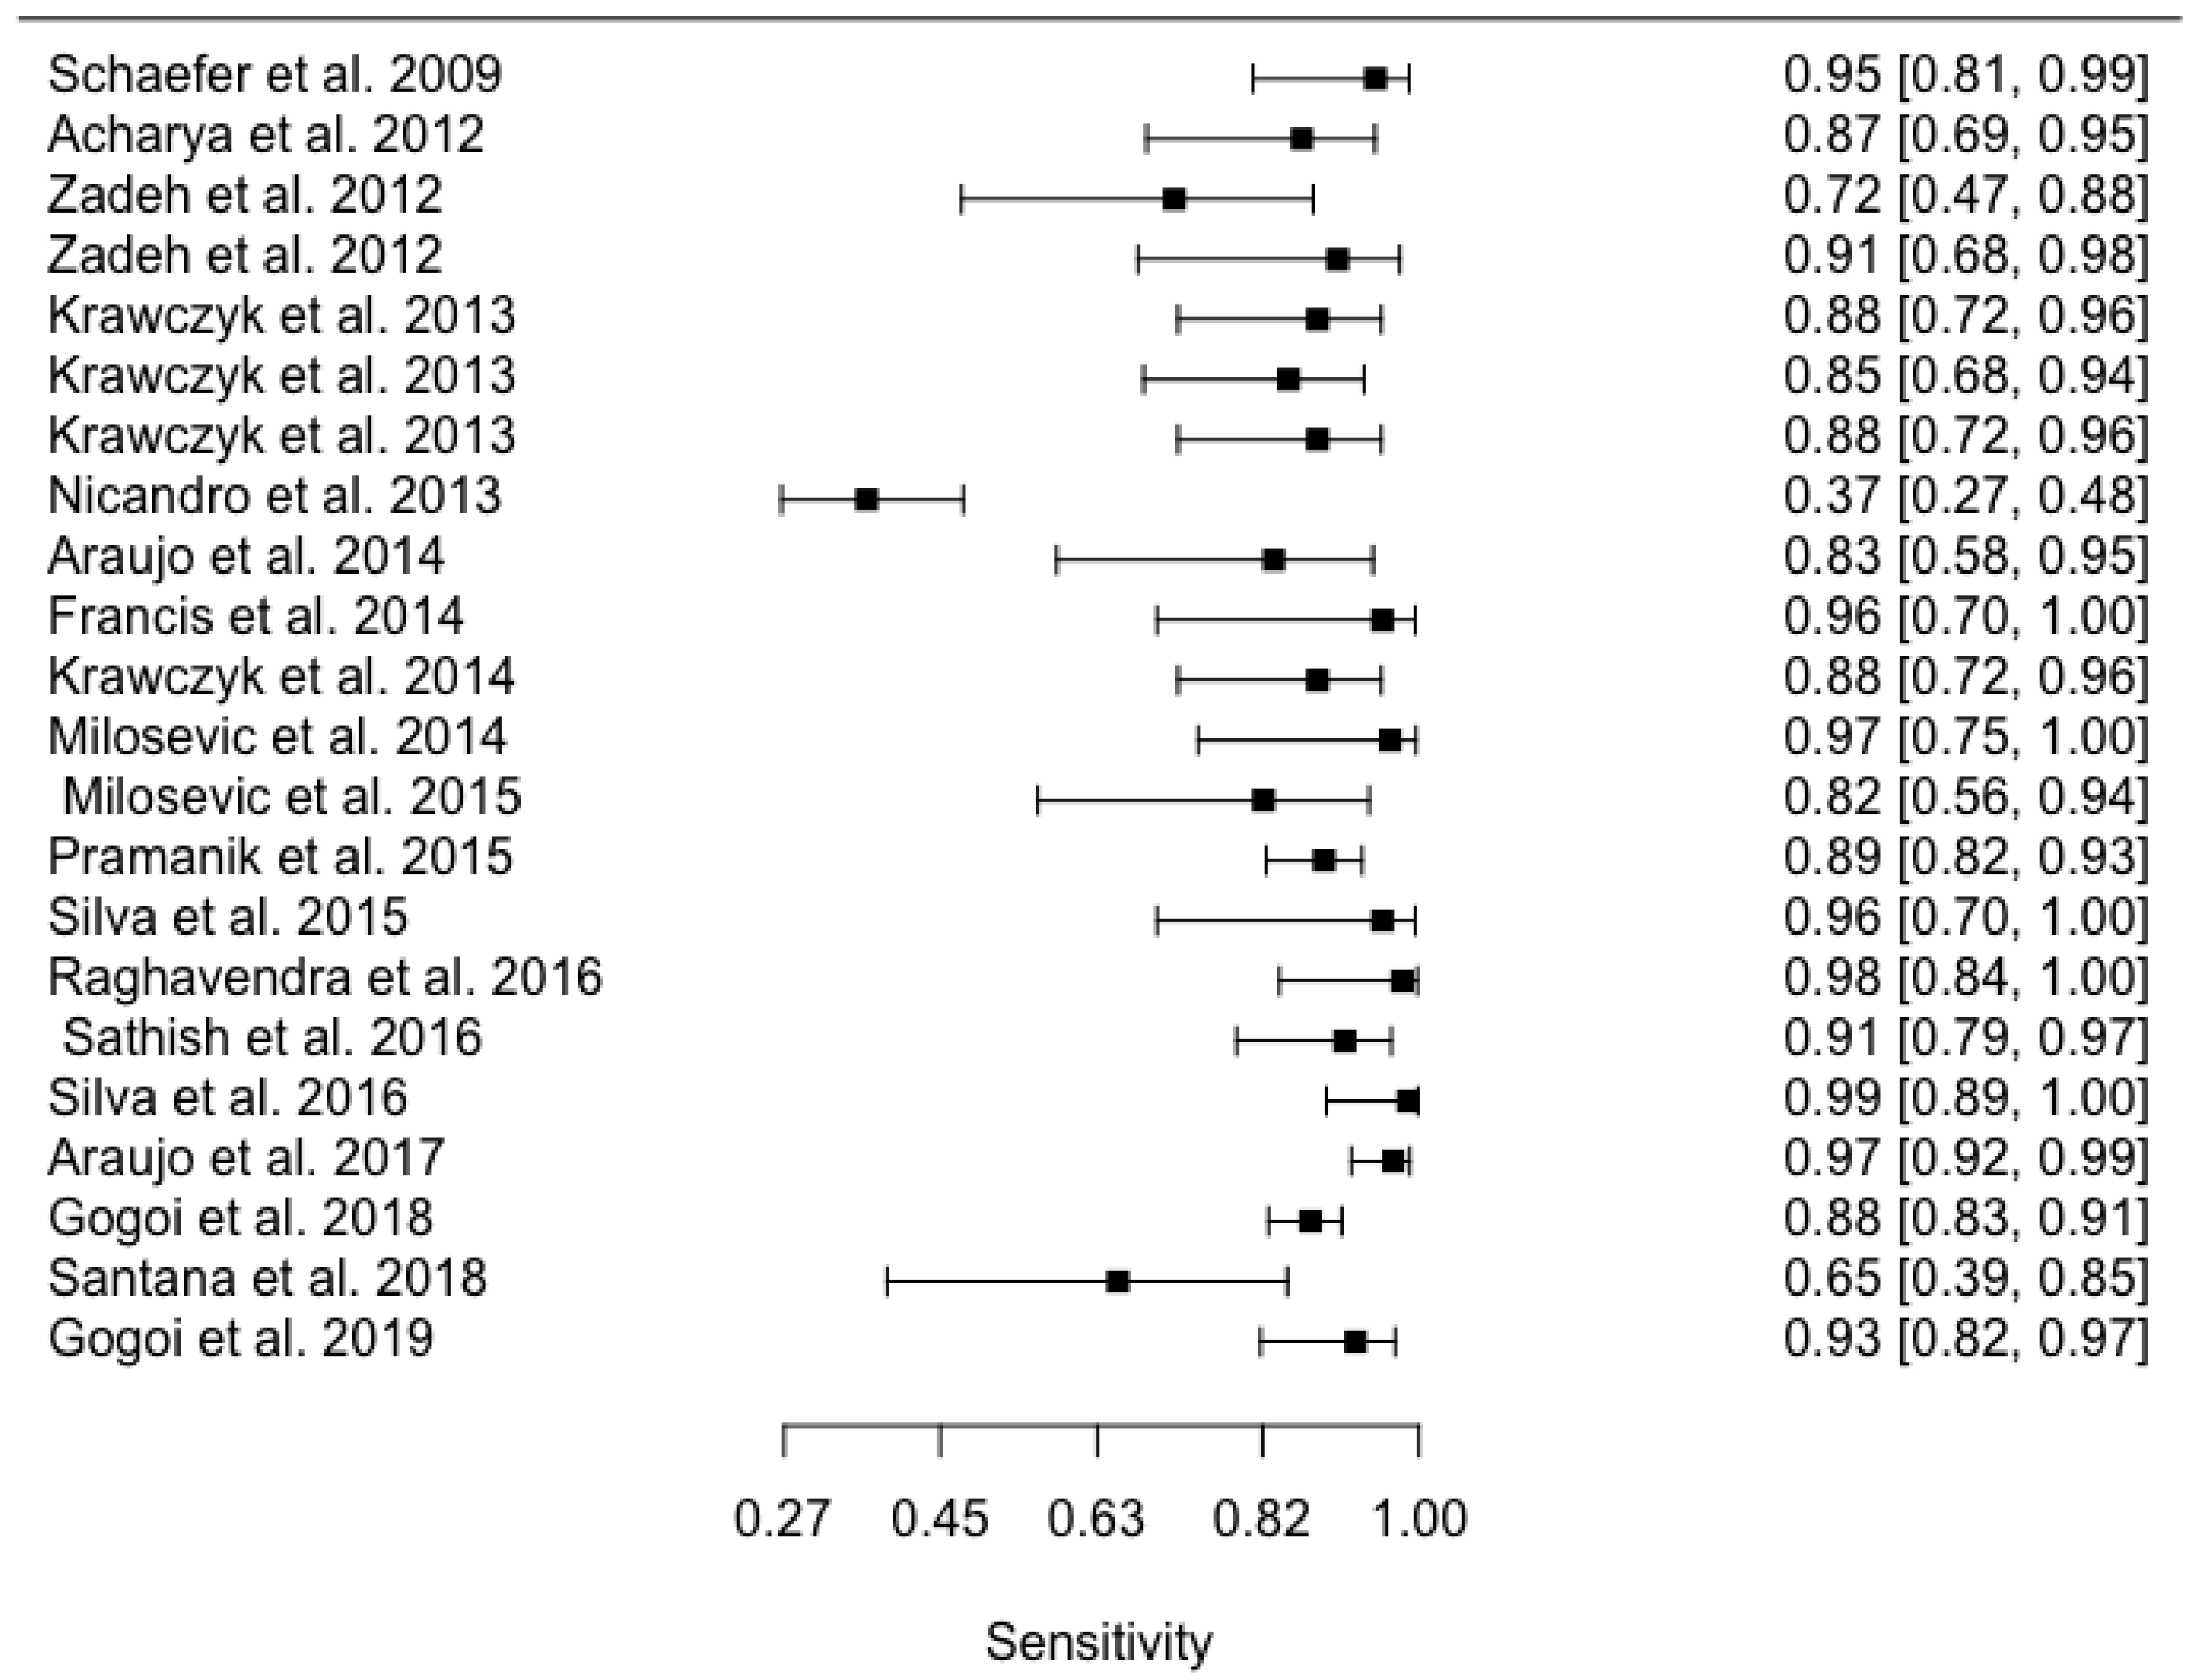
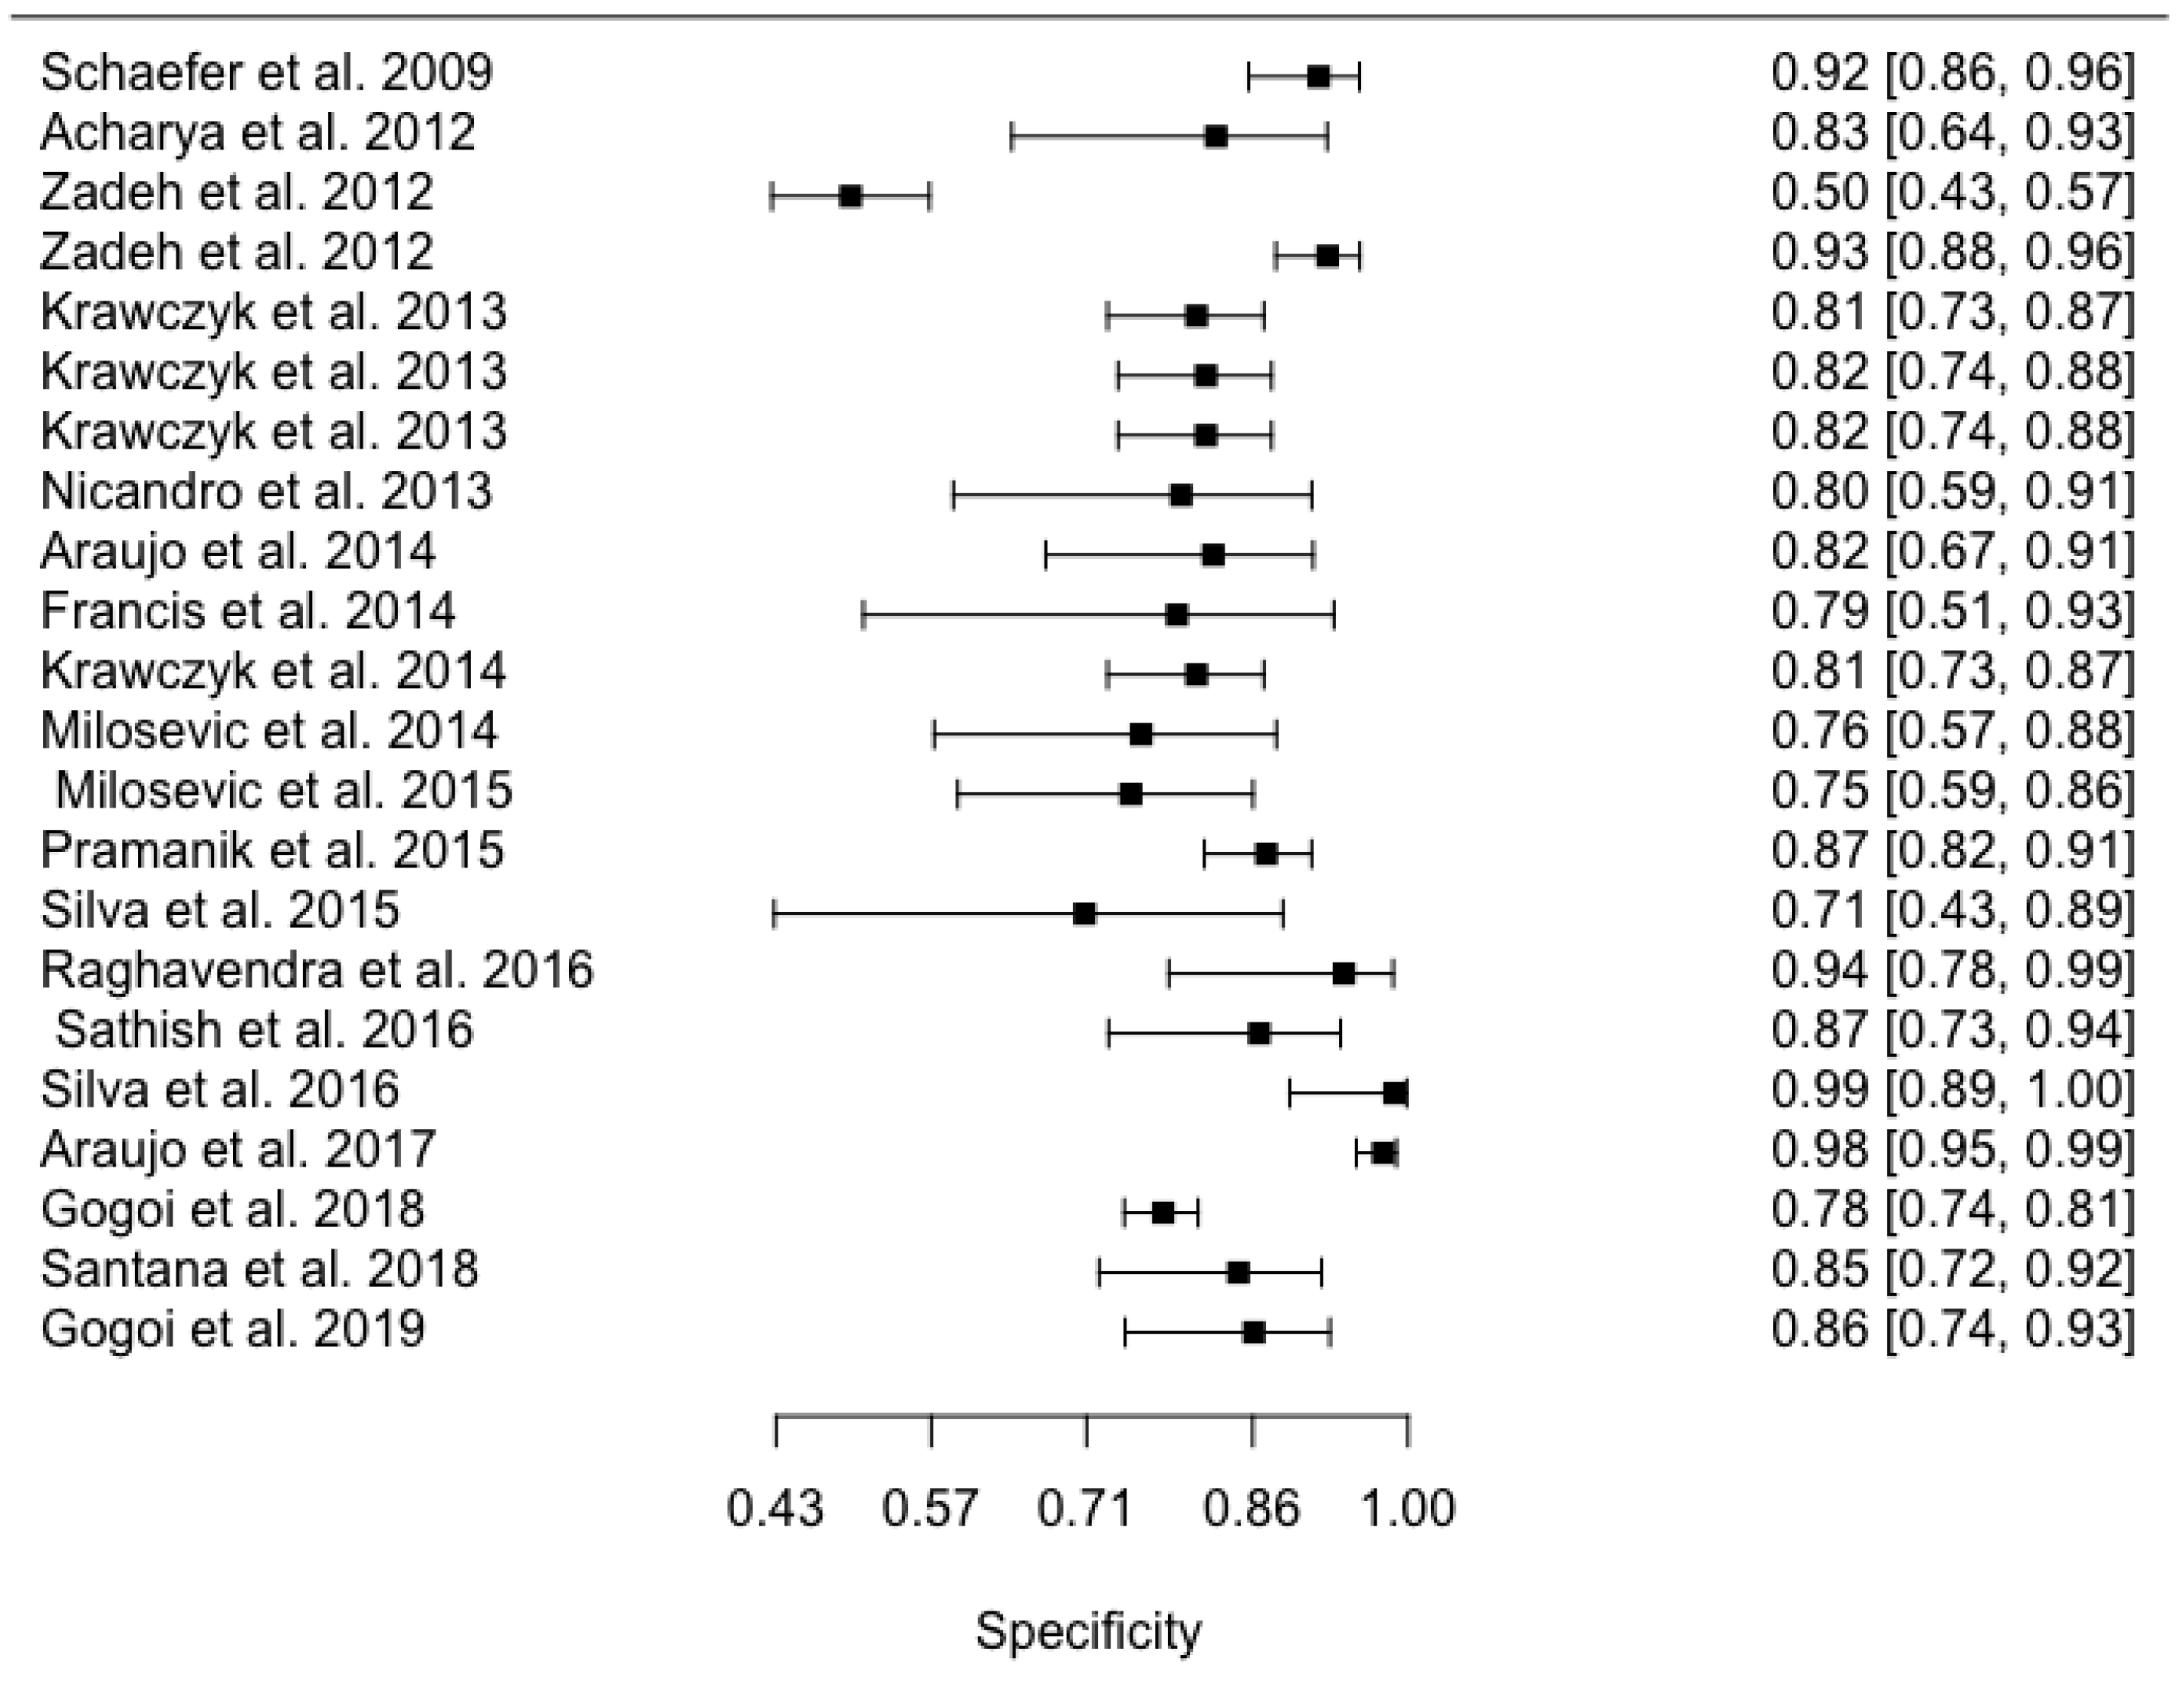
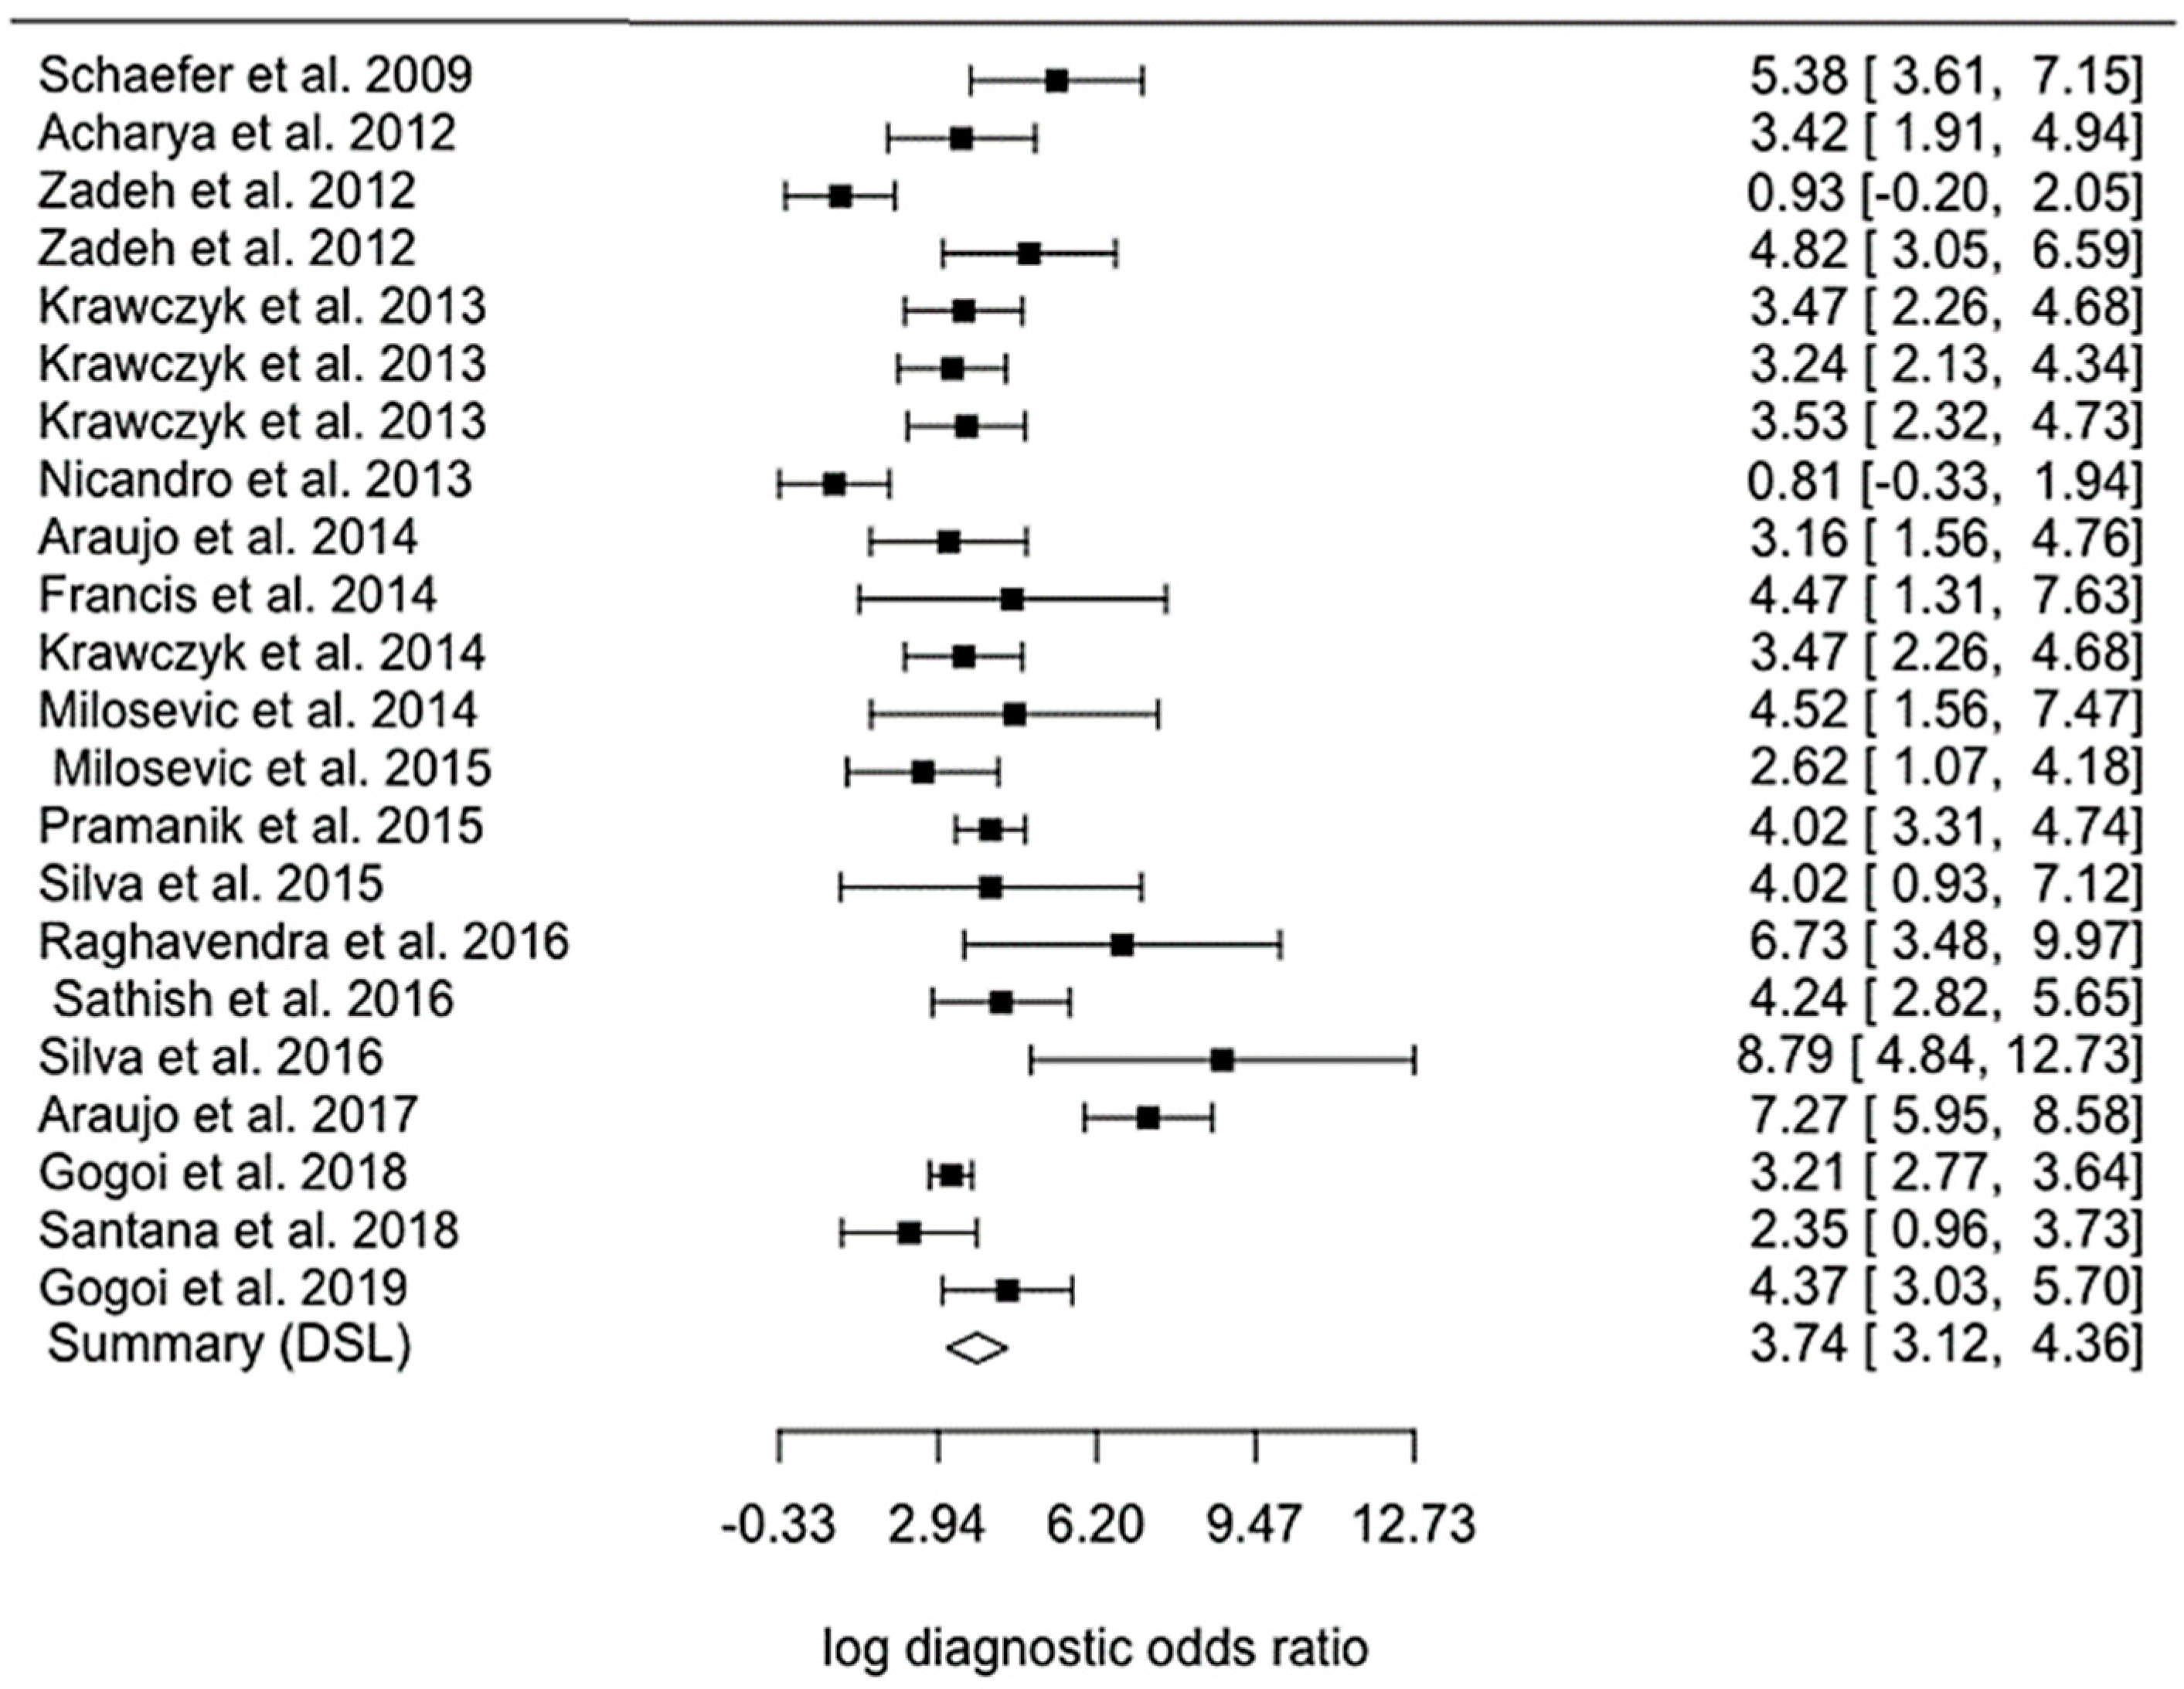
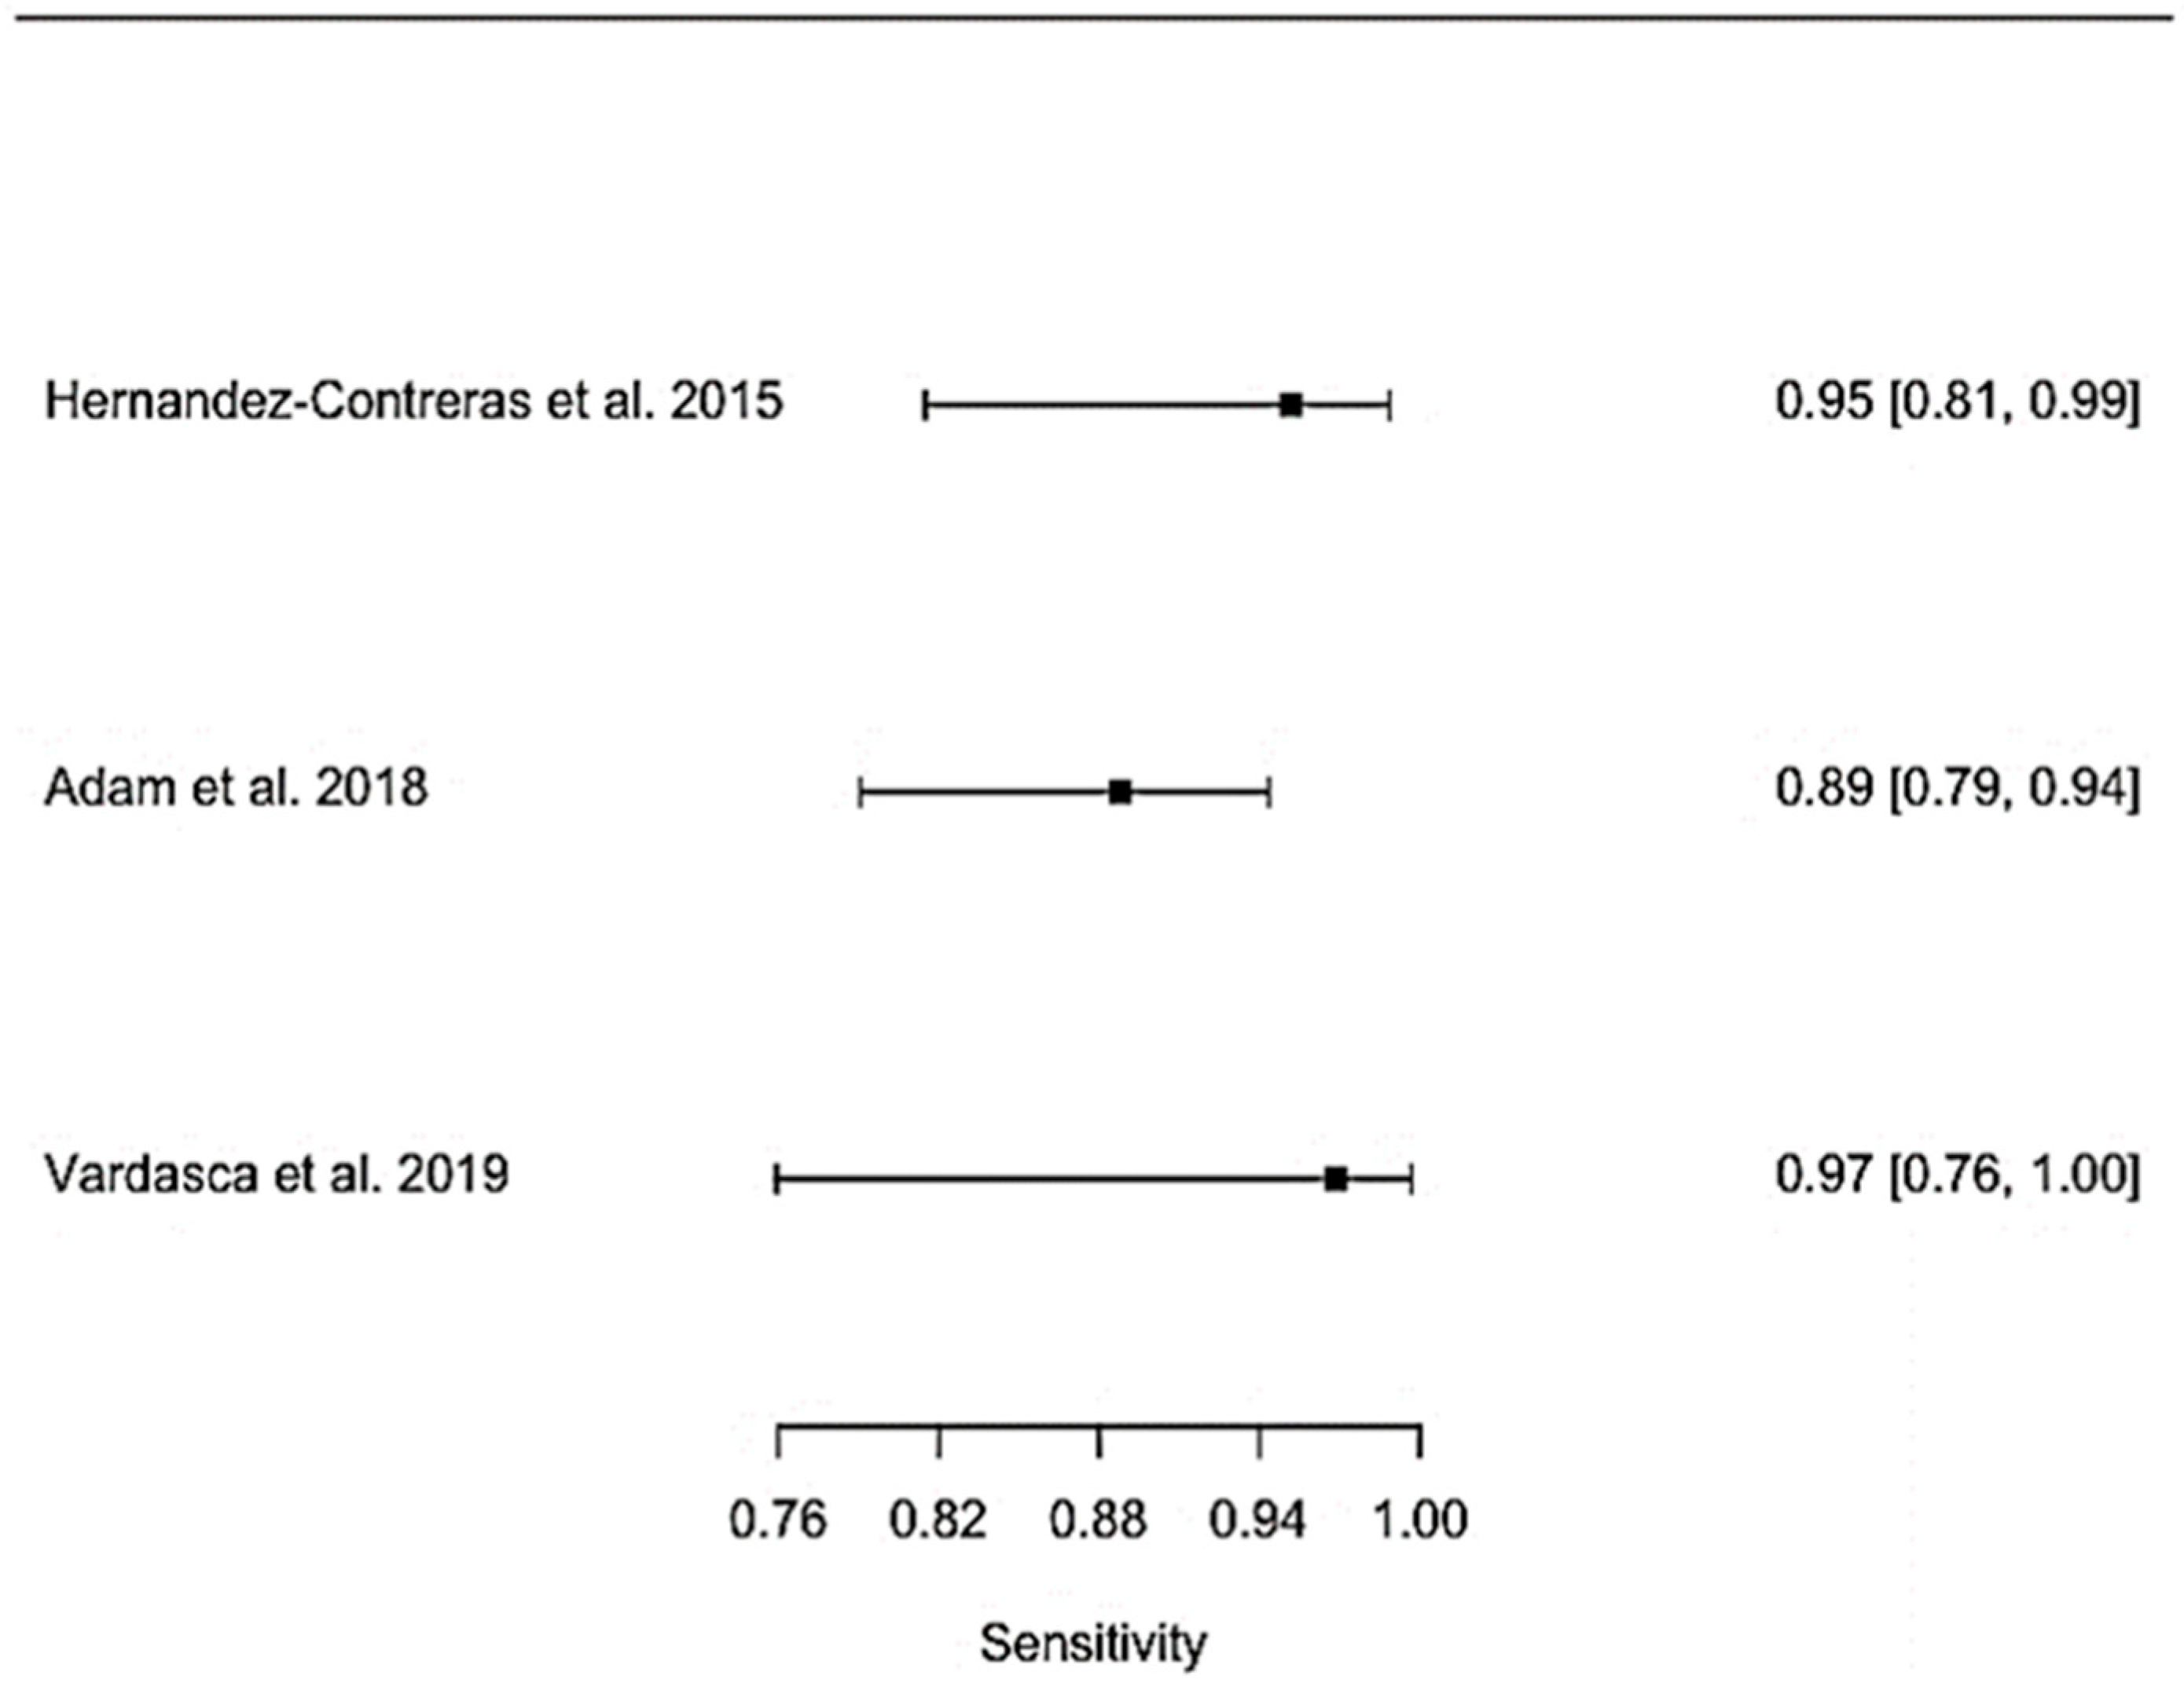
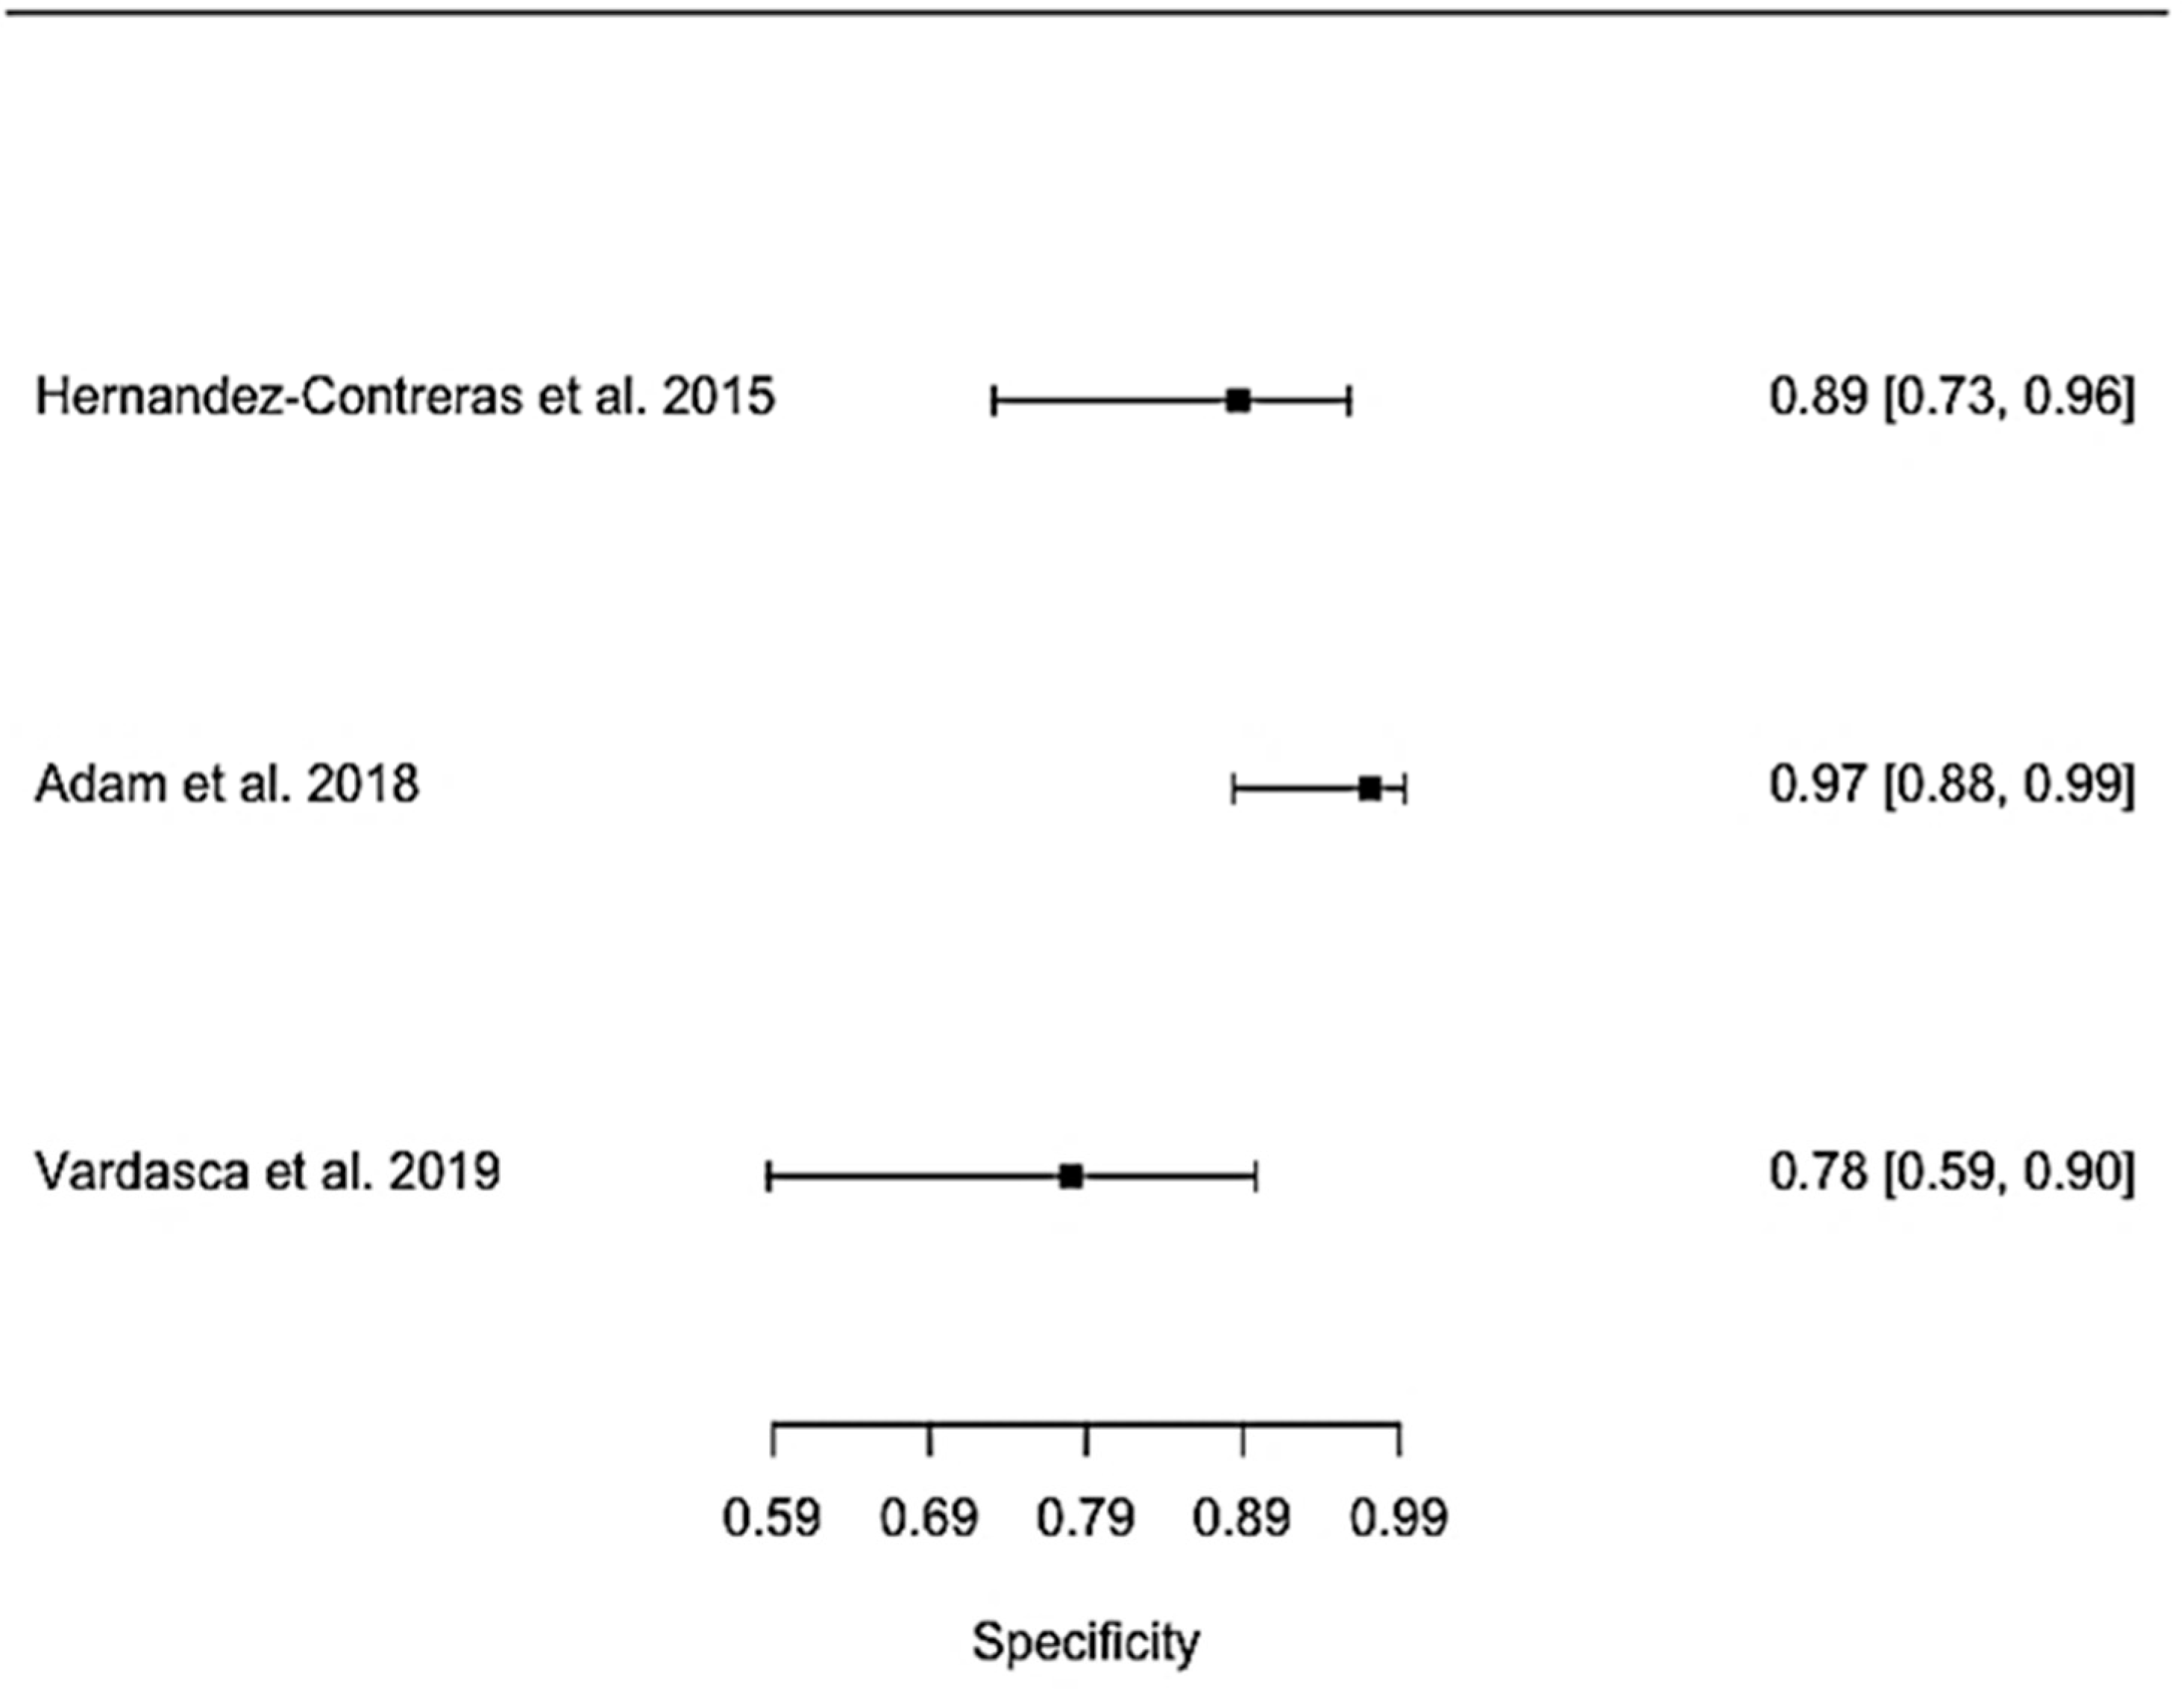
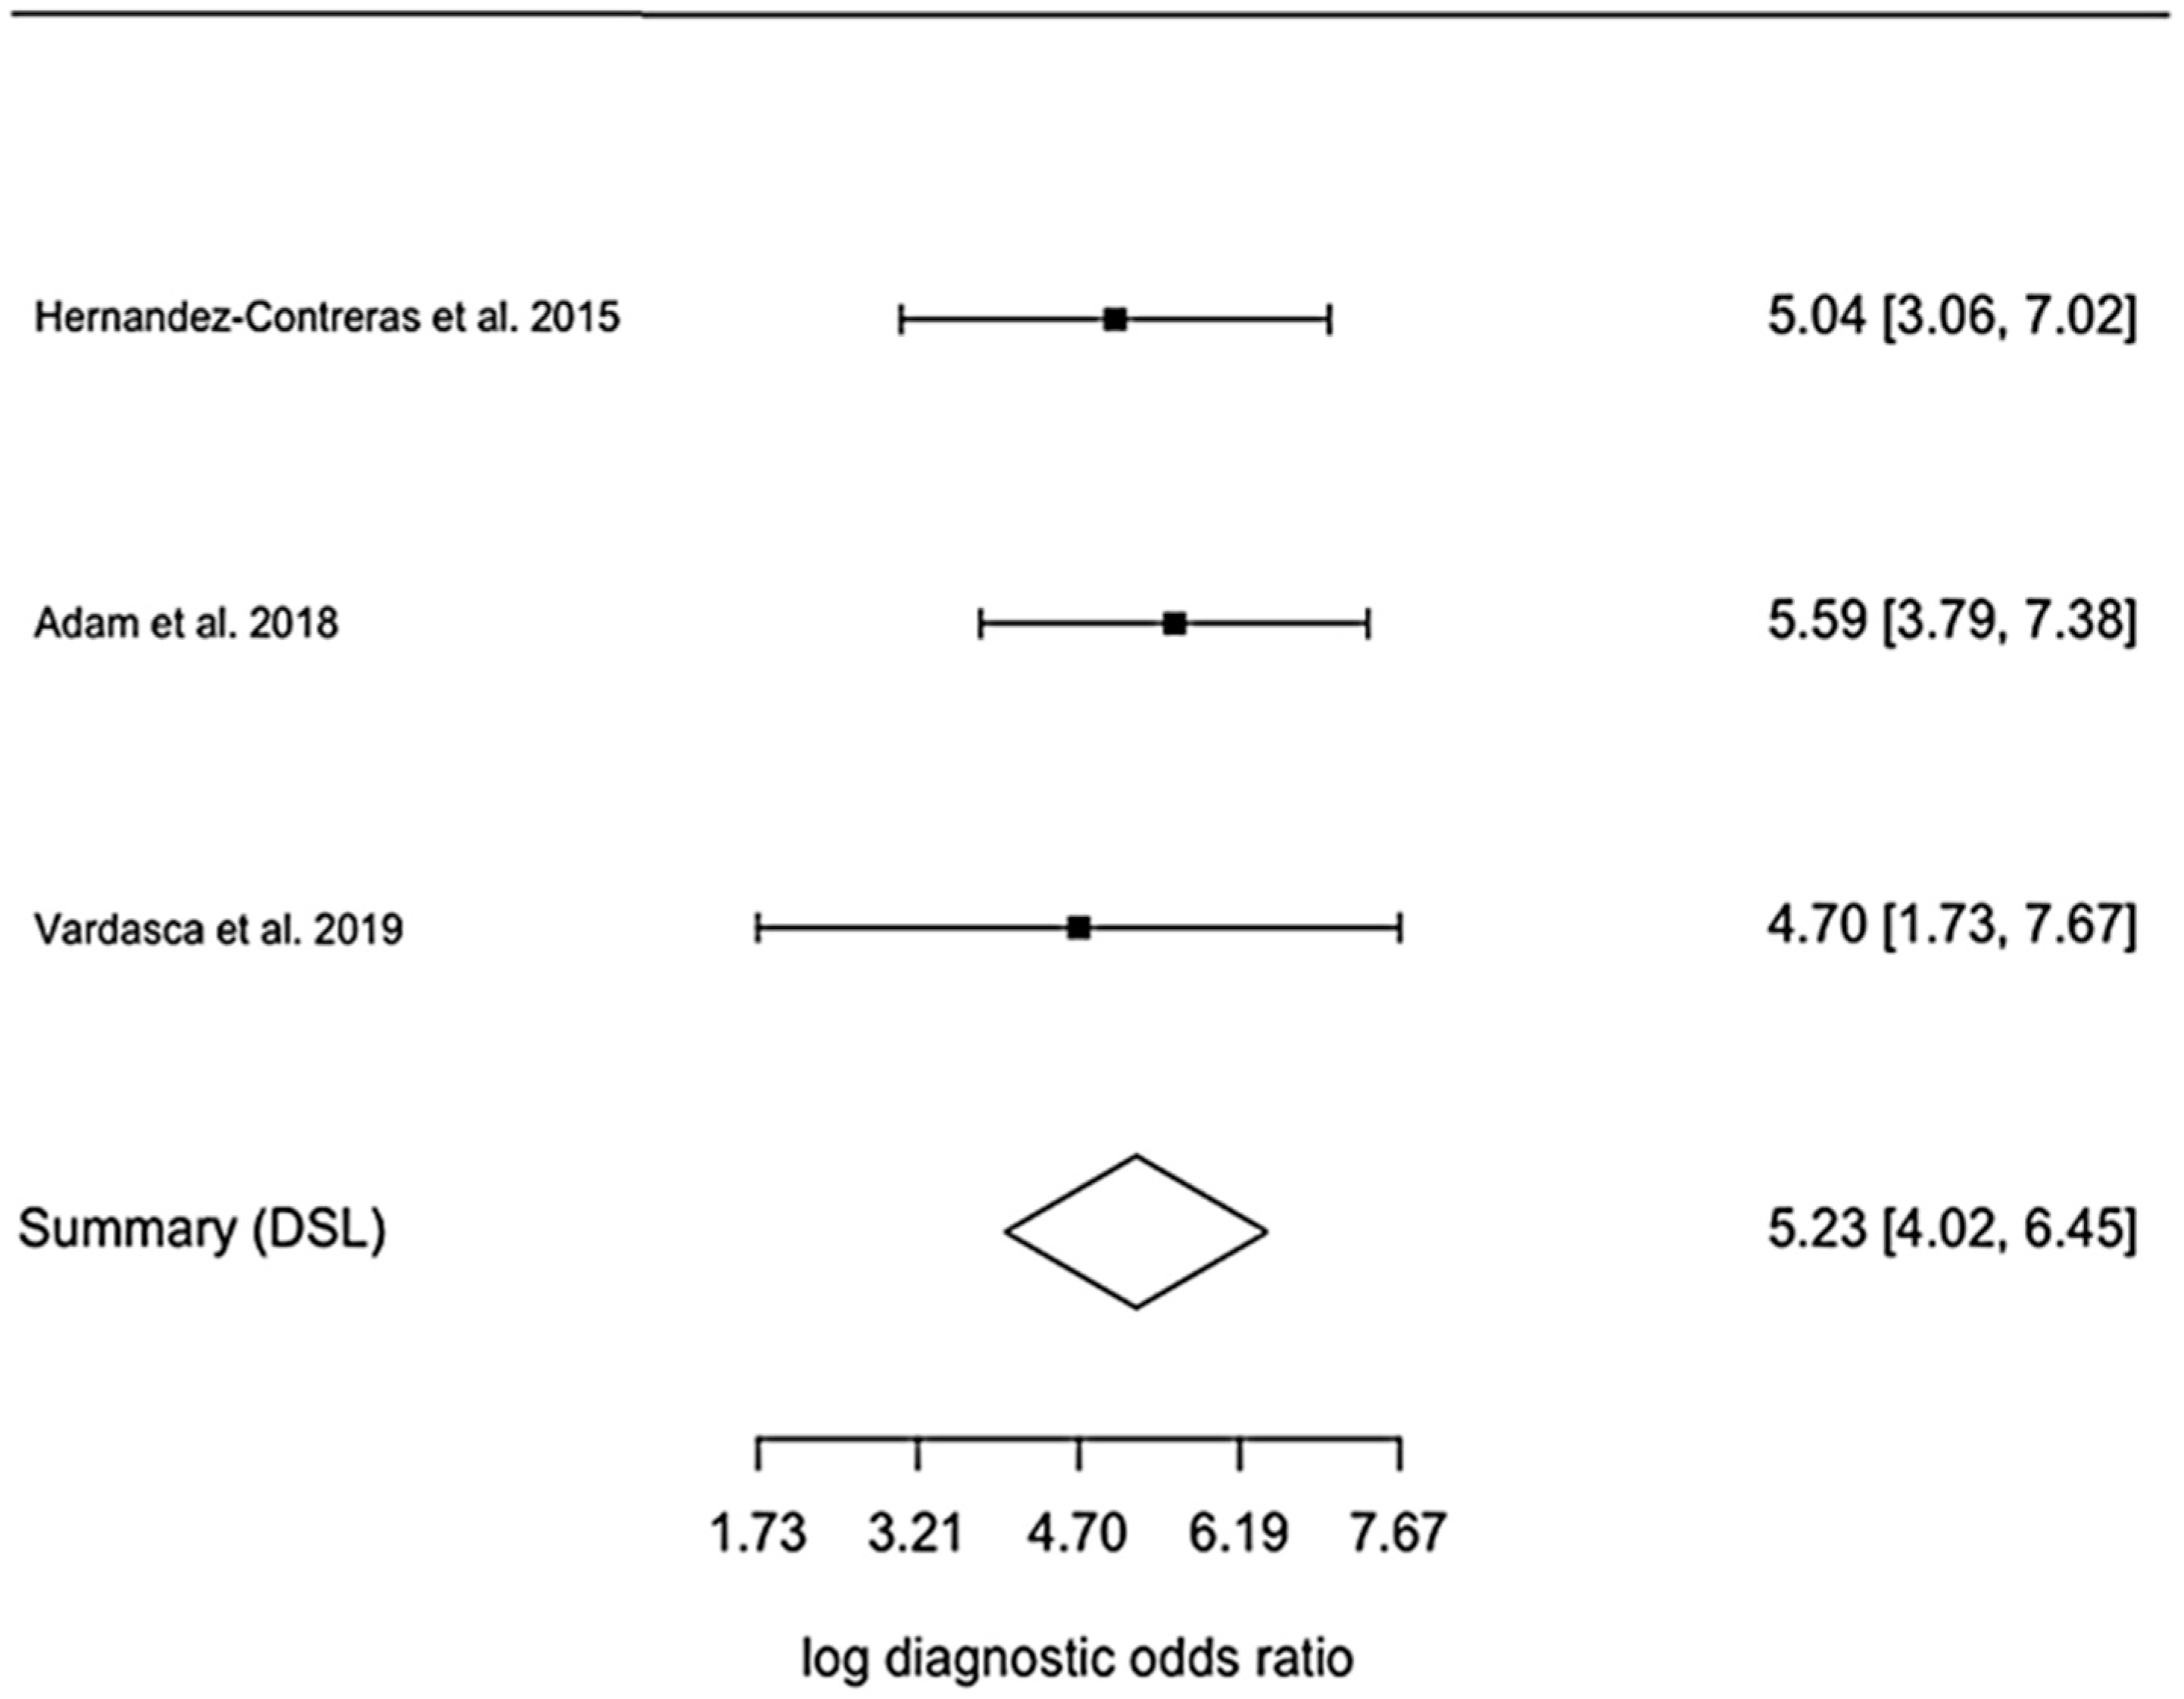
3.2. Quantitative Synthesis
4. Discussion
5. Conclusions
Author Contributions
Funding
Informed Consent Statement
Data Availability Statement
Conflicts of Interest
Appendix A

| Year (Ref.) | Biomedical Application | Best Overall Classifier | Sample Size | ACC (%) | SN (%) | SP (%) |
|---|---|---|---|---|---|---|
| 1990 [65] | Whiplash injury | ANN | 20 | 90 | 80 | 100 |
| 2001 [15] | Breast cancer | ANN | 83 | 58.5 | 54 | 67 |
| 2002 [16] | Breast cancer | ANN | 200 | 40 | 62 | 67 |
| 2007 [18] | Breast cancer | ANN + fuzzy rules | 78 (28 healthy, 43 benign, 7 cancer) | - | 100 | 60 |
| 2007 [21] | Breast cancer | Fuzzy-rules | 146 thermograms | 98 | ||
| 2008 [17] | Breast cancer | ANN | 90 | 81.2 | 88.2 | |
| 2008 [60] | Carpal tunnel syndrome | ANN | 56 patients (34 hands) | 82.5 | ||
| 2009 [22] | Breast cancer | Fuzzy-rules | 146 (29 malignant, 117 benign) | 97.9 | 93.1 | 99.1 |
| 2009 [61] | Carpal tunnel syndrome | ANN | 251 hands (132 healthy, 119 pathological) | 72.2 | ||
| 2012 [29] | Breast cancer | SVM | 50 (25 healthy, 25 malignant) | 88.1 | 85.7 | 90.4 |
| 2012 [40] | Breast cancer | SVM | 34 thermograms | 88.2 | ||
| 2012 [20] | Breast cancer | ANN | 200 (15 abnormal cases) | 70 | 50 | 75 |
| 2012 [19] | Breast cancer | ANN | 200 (15 abnormal cases) | 97.5 | 93 | 97 |
| 2012 [64] | Rheumatoid arthritis | Decision Trees | 52 (26 healthy, 26 ill) | 96 | 92 | |
| 2013 [36] | Breast cancer | AdaBoost | 32 (9 malignant, 12 benign, 11 normal) | 95 | ||
| 2013 [30] | Breast cancer | SVM | 63 (29 healthy, 34 malignant) | 100 | ||
| 2013 [47] | Breast cancer | Ensemble classifier | 146 (29 malignant, 117 benign) | 88.7 | 81.3 | 95.5 |
| 2013 [48] | Breast cancer | Ensemble classifier | 146 (29 malignant, 117 benign) | 87.4 | 82.1 | 88.7 |
| 2013 [50] | Breast cancer | Ensemble classifier | 146 (29 malignant, 117 benign) | 90.0 | 82.5 | 91.8 |
| 2013 [37] | Breast cancer | Naive-Bayes | 98 (77 malignant, 21 healthy) | 71.8 | 82 | 37 |
| 2014 [42] | Breast cancer | Euclidean Distance | 50 (14 malignant, 19 benign, 17 cysts) | 84 | 85.7 | 86.5 |
| 2014 [27] | Breast cancer | SVM | 22 (11 normal, 11 abnormal) | 90.9 | 81.8 | 100 |
| 2014 [28] | Breast cancer | SVM | 36 (24 normal, 12 malignant) | 83.3 | ||
| 2014 [49] | Breast cancer | Ensemble classifier | 146 (29 malignant, 117 benign) | 89.0 | 81.9 | 90.8 |
| 2014 [43] | Breast cancer | k-NN | 40 (26 normal, 14 abnormal) | 92.0 | 78.6 | 100 |
| 2014 [62] | Dry-eye disease | k-NN | 81 (40 responded and 41 not responded) | 99.8 | 99.7 | 100 |
| 2015 [66] | Back Pain | SVM | 1000 (300 healthy, 200 faulty posture and 500 lateral spinal curvature) | 90 | 88 | |
| 2015 [31] | Breast cancer | SVM | 63 (29 healthy, 34 malignant) | 100 | ||
| 2015 [52] | Diabetic Foot | ANN | 60 (30 non-diabetic, 30 diabetes) | 94.3 | 97.3 | 91.3 |
| 2015 [38] | Breast cancer | k-NN | 18 (9 normal, 9 abnormal) | 99.4 | ||
| 2015 [41] | Breast cancer | SVM | 50 (37 normal, 13 abnormal) | 88 | 76.9 | 91.9 |
| 2015 [25] | Breast cancer | ANN | 306 thermograms of 102 individuals (123 unhealthy, 183 healthy) | 90.4 | 87.6 | 89.7 |
| 2015 [44] | Breast cancer | ANN | 22 (11 normal, 11 cancer) | 90.9 | 81.8 | 100 |
| 2015 [26] | Breast cancer | ANN | 240 | 92.8 | ||
| 2015 [63] | Dry-eye disease | k-NN | 104 (83 ill, 21 healthy) | 99.8 | 99.8 | 99.8 |
| 2016 [23] | Breast cancer | AdaBoost | 67 | 87.4 | ||
| 2016 [24] | Breast cancer | Fuzzy C-Means | 67 | 75 | ||
| 2016 [46] | Breast cancer | Decision Trees | 50 (25 malignant, 25 normal) | 98 | 96.6 | 100 |
| 2016 [32] | Breast cancer | SVM | 80 (40 normal, 40 abnormal) | 90 | 87.5 | 92.5 |
| 2016 [39] | Breast cancer | k-NN | 80 (40 normal, 40 abnormal) | 100 | 100 | 100 |
| 2016 [81] | Breast cancer | Fuzzy active contours | 60 | 91.8 | 85 | |
| 2016 [67] | Thyroid tumour | Decision Trees | 51 (30 abnormal, 21 normal) | 98 | 95 | 99 |
| 2017 [68] | Breath analysis | ANN | 1 subject (25 experiments) | 100 | ||
| 2017 [69] | Drunkenness state | SVM | 41 | 100 | ||
| 2017 [33] | Breast cancer | SVM | 240 (100 normal, 66 Benign, 78 Cancer) | 94.8 | ||
| 2017 [70] | Exercise induced-fatigue | Ensemble classifier | 19 | 81.5 | ||
| 2017 [71] | Hypertension | ANN | 28 (14 hypertensive, 14 normal) | 89 | 85.7 | 92.9 |
| 2017 [7] | Rheumatoid arthritis | k-means | 60 (30 arthritis rheumatoid, 30 healthy) | 83 | 86.6 | 79 |
| 2017 [72] | Schizophrenia | SVM | 35 (18 moderately ill, 17 markedly ill) | 94.3 | ||
| 2018 [73] | Burn wounds | Random Forest | 34 | 85.3 | ||
| 2018 [74] | Facial recognition | ANN | 3561 from 22 subjects (2124 positive, 1437 negative) | 85.5 | ||
| 2018 [53] | Diabetic Foot | k-NN | 107 (51 healthy, 66 diabetic-33 neuropathic, 33 non-neuropathic) | 93.1 | 90.3 | 98.0 |
| 2018 [35] | Breast cancer | SVM | 407 (117 abnormal, 290 normal) | 98 | 98 | 98 |
| 2018 [58] | Skin neoplasms | k-NN | 85 (68 malignant, 17 benign) | 60 | ||
| 2018 [45] | Breast cancer | Ensemble classifier | 725 (219 cyst, 371 benign, 235 malignant) | 73.3 | 78 | 88 |
| 2018 [82] | Diabetic Foot | k-NN | 56 | 92.5 | ||
| 2019 [75] | Cardiovascular Disease (CVD) | Naive-Bayes | 20 (10 non-CDV, 10 CVD) | 90 | 80 | 90 |
| 2019 [76] | Hemodynamic shock | RF | 539 (253 continuous intra-arterial blood pressure) | 73 | 65 | 82 |
| 2019 [77] | Stress Recognition | ANN | 93 sets of data from 17 (9 males, 8 females) | 78.3 | ||
| 2019 [34] | Breast cancer | SVM | 60 (25 healthy, 23 benign, 12 malignant) | 83.2 | 85.5 | 73.2 |
| 2019 [6] | Diabetic Foot | ANN | 246 (150 diabetics without complications, 36 with complications, 60 healthy) | 91 | ||
| 2019 [59] | Skin neoplasms | SVM | 320 (51 SCC, 118 BCC, 16 melanomas, 29 AK, 30 nevi, 14 SK, 11 cysts, 29 other benign neoplasia and 22 scar tissue lesions) | 84 | 91 | |
| 2019 [9] | Skin neoplasms | SVM | 46 (16 melanoma, 30 nevi) cooling | 84.2 | 91.3 | 11 |
| 2019 [51] | Breast cancer treatment sequels | RF | 90 (75 training, 15 testing) | 87 | ||
| 2019 [8] | Breast cancer | SVM | 100 (47 abnormal, 53 normal) | 91 | 87.2 | 94.3 |
| 2019 [55] | Diabetic Foot Ulcer (DFU) | k-NN | 39 (15 DFU ischemic or infected) | 81.2 | 80 | 100 |
| 2020 [57] | Type II Diabetes Mellitus (DM) | ANN | 140 (70 normal, 70 type 2 DM) | 94.2 | ||
| 2020 [56] | Diabetic Foot | ANN | 110 | 85.3 | 91.67 |
Appendix B
| χ2 | p-Value | I2 (%) | |
|---|---|---|---|
| All studies | 185.559 | <0.001 | 86.66 |
| Breast cancer | 96.474 | <0.001 | 82.81 |
| Diabetic foot | 0.520 | 0.771 | 0.00 |
Appendix C


Appendix D


References
- Ring, F.; Ammer, K. Infrared thermal imaging in medicine. Physiol. Meas. 2012, 33, R33–R46. [Google Scholar] [CrossRef] [PubMed]
- Arens, E.; Zhang, H.A. The Skin’s Role in Human Thermoregulation and Comfort. In Thermal and Moisture Transport in Fibrous Materials; Pan, N., Gibson, P., Eds.; Woodhead Publishing Limited: Cambridge, UK, 2006; pp. 560–602. [Google Scholar]
- Vardasca, R.; Ramalhão, C.; Gabriel, J. Bases da Termografia: Enquadramento da Termografia Com Outras Técnicas de Imagem Médica. In Termografia: Imagem Médica e Síndromes Dolorosas, 1st ed.; Lidel: Lisbon, Portugal, 2016; pp. 3–10. [Google Scholar]
- Ring, F.; Ring, E.F.J.; Ammer, K. The technique of infrared imaging in medicine. Infrared Imaging 2014, 2015, 1–10. [Google Scholar] [CrossRef]
- Ammer, K. The Glamorgan Protocol for recording and evaluation of thermal images of the human body. Thermol. Int. 2008, 18, 125–129. [Google Scholar]
- Gururajarao, S.B.; Venkatappa, U.; Shivaram, J.M.; Sikkandar, M.Y.; Al Amoudi, A. Infrared Thermography and Soft Computing for Diabetic Foot Assessment; Elsevier BV: Amsterdam, The Netherlands, 2019; pp. 73–97. [Google Scholar]
- Umapathy, S.; Vasu, S.; Gupta, N. Computer Aided Diagnosis Based Hand Thermal Image Analysis: A Potential Tool for the Evaluation of Rheumatoid Arthritis. J. Med. Biol. Eng. 2017, 38, 666–677. [Google Scholar] [CrossRef]
- Sathish, D.; Kamath, S.; Prasad, K.; Kadavigere, R. Role of normalization of breast thermogram images and automatic classification of breast cancer. Vis. Comput. 2017, 35, 57–70. [Google Scholar] [CrossRef]
- Magalhaes, C.; Vardasca, R.; Rebelo, M.; Valenca-Filipe, R.; Ribeiro, M.; Mendes, J. Distinguishing melanocytic nevi from melanomas using static and dynamic infrared thermal imaging. J. Eur. Acad. Dermatol. Venereol. 2019, 33, 1700–1705. [Google Scholar] [CrossRef] [PubMed]
- Deo, R.C. Machine Learning in Medicine. Circulation 2015, 132, 1920–1930. [Google Scholar] [CrossRef]
- Vardasca, R.; Magalhaes, C.; Mendes, J. Biomedical Applications of Infrared Thermal Imaging: Current State of Machine Learning Classification. Proceedings 2019, 27, 46. [Google Scholar] [CrossRef]
- Catal, C. Performance Evaluation Metrics for Software Fault Prediction Studies. Acta Polytech. Hungarica 2012, 9, 193–206. [Google Scholar]
- Moher, D.; Liberati, A.; Tetzlaff, J.; Altman, D.G. The PRISMA Group. Preferred reporting items for systematic reviews and meta-analyses: The PRISMA statement. PLoS Med. 2009, 6, e1000097. [Google Scholar] [CrossRef]
- Liberati, A.; Altman, D.G.; Tetzlaff, J.; Mulrow, C.; Gøtzsche, P.C.; Ioannidis, J.P.; Clarke, M.; Devereaux, P.J.; Kleijnen, J.; Moher, D. The PRISMA statement for reporting systematic reviews and meta-analyses of studies that evaluate health care interventions: Explanation and elaboration. PLoS Med. 2009, 6, e1000100. [Google Scholar] [CrossRef] [PubMed]
- Ng, E.Y.K. Statistical analysis of healthy and malignant breast thermography. J. Med. Eng. Technol. 2001, 25, 253–263. [Google Scholar] [CrossRef] [PubMed]
- Ng, E.Y.K.; Fok, S.C.; Peh, Y.; Ng, F.; Sim, L. Computerized detection of breast cancer with artificial intelligence and thermograms. J. Med. Eng. Technol. 2002, 26, 152–157. [Google Scholar] [CrossRef] [PubMed]
- Ng, E.Y.K.; Kee, E.C. Advanced integrated technique in breast cancer thermography. J. Med. Eng. Technol. 2008, 32, 103–114. [Google Scholar] [CrossRef]
- Tan, T.; Quek, C.; Ng, G.; Ng, E. A novel cognitive interpretation of breast cancer thermography with complementary learning fuzzy neural memory structure. Expert Syst. Appl. 2007, 33, 652–666. [Google Scholar] [CrossRef]
- Zadeh, H.G.; Pakdelazar, O.; Haddadnia, J. Diagnosing Breast Cancer with the Aid of Fuzzy Logic Based on Data Mining of a Genetic Algorithm in Infrared Images. Middle East J. Cancer 2012, 3, 119–129. [Google Scholar]
- Zadeh, H.G.; Haddadnia, J.; Hashemian, M.; Hassanpour, K. Diagnosis of breast cancer using a combination of genetic algo-rithm and artificial neural network in medical infrared thermal imaging. Iran J Med. Phys. 2012, 9, 265–274. [Google Scholar] [CrossRef]
- Schaefer, G.; Nakashima, T.; Zavisek, M.; Yokota, Y.; Drastich, A.; Ishibuchi, H. Breast Cancer Classification Using Statistical Features and Fuzzy Classification of Thermograms. In Proceedings of the 2007 IEEE International Fuzzy Systems Conference, London, UK, 23–26 July 2007; pp. 1–5. [Google Scholar] [CrossRef]
- Schaefer, G.; Závišek, M.; Nakashima, T. Thermography based breast cancer analysis using statistical features and fuzzy classification. Pattern Recognit. 2009, 42, 1133–1137. [Google Scholar] [CrossRef]
- Lashkari, A.; Pak, F.; Firouzmand, M. Full Intelligent Cancer Classification of Thermal Breast Images to Assist Physician in Clinical Diagnostic Applications. J. Med. Signals Sensors 2016, 6, 12–24. [Google Scholar] [CrossRef]
- Lashkari, A.E.; Firouzmand, M. Early breast cancer detection in thermogram images using AdaBoost classifier and fuzzy C-Means clustering algorithm. Middle East J. Cancer 2016, 7, 113–124. [Google Scholar]
- Pramanik, S.; Bhattacharjee, D.; Nasipuri, M. Wavelet Based Thermogram Analysis for Breast Cancer Detection. In Proceedings of the 2015 International Symposium on Advanced Computing and Communication (ISACC), Silchar, India, 14–15 September 2015; Volume 2016, pp. 205–212. [Google Scholar]
- Wahab, A.A.; Salim, M.I.M.; Yunus, J.; Aziz, M.N.C. Tumor localization in breast thermography with various tissue compositions by using Artificial Neural Network. In Proceedings of the 2015 IEEE Student Conference on Research and Development (SCOReD), Kuala Lumpur, Malaysia, 13–14 December 2015; Volume 2015, pp. 484–488. [Google Scholar]
- Francis, S.V.; Sasikala, M.; Saranya, S. Detection of Breast Abnormality from Thermograms Using Curvelet Transform Based Feature Extraction. J. Med. Syst. 2014, 38, 1–9. [Google Scholar] [CrossRef] [PubMed]
- Francis, S.V.; Sasikala, M.; Bharathi, G.B.; Jaipurkar, S.D. Breast cancer detection in rotational thermography images using texture features. Infrared Phys. Technol. 2014, 67, 490–496. [Google Scholar] [CrossRef]
- Acharya, U.R.; Ng, E.Y.K.; Tan, J.-H.; Sree, S.V. Thermography Based Breast Cancer Detection Using Texture Features and Support Vector Machine. J. Med. Syst. 2012, 36, 1503–1510. [Google Scholar] [CrossRef] [PubMed]
- Gaber, T.; Ismail, G.; Anter, A.; Soliman, M.; Ali, M.; Semary, N.; Hassanien, A.E.; Snasel, V. Thermogram Breast Cancer Prediction Approach based on Neutrosophic Sets Ther-mogram Breast Cancer Prediction Approach based on Neutrosophic Sets and Fuzzy C-Means Algorithm. In Proceedings of the 2015 37th Annual International Conference of the IEEE Engineering in Medicine and Biology Society, Milano, Italy, 25–29 August 2015. [Google Scholar]
- Ali, M.; Sayed, G.I.; Gaber, T.; Hassanien, A.E.; Snášel, V.; Silva, L.F. Detection of Breast Abnormalities of Thermograms based on a New Segmentation Method. In Proceedings of the 2015 Federated Conference on Computer Science and Information Systems, Lodz, Poland, 13–16 September 2015; Volume 5, pp. 255–261. [Google Scholar]
- Sathisha, K.; Kamath, S.; Prasad, K.; Kadavigere, R.; Martis, R.J. Asymmetry analysis of breast thermograms using automated segmentation and texture features. Signal Image Video Process. 2017, 11, 745–752. [Google Scholar] [CrossRef]
- Araujo, A.D.S.; Conci, A.; Resmini, R.; Montenegro, A.; Araujo, C.; Lebon, F. Computer Aided Diagnosis for Breast Diseases Based on Infrared Images. In Proceedings of the 2017 IEEE/ACS 14th International Conference on Computer Systems and Applications (AICCSA), Hammamet, Tunisia, 30 October–3 November 2017; pp. 172–177. [Google Scholar]
- Gogoi, U.R.; Majumdar, G.; Bhowmik, M.K.; Ghosh, A.K. Evaluating the efficiency of infrared breast thermography for early breast cancer risk prediction in asymptomatic population. Infrared Phys. Technol. 2019, 99, 201–211. [Google Scholar] [CrossRef]
- Gogoi, U.R.; Bhowmik, M.K.; Bhattacharjee, D.; Ghosh, A.K. Singular value based characterization and analysis of thermal patches for early breast abnormality detection. Australas. Phys. Eng. Sci. Med. 2018, 41, 861–879. [Google Scholar] [CrossRef]
- EtehadTavakol, M.; Chandran, V.; Ng, E.; Kafieh, R. Breast cancer detection from thermal images using bispectral invariant features. Int. J. Therm. Sci. 2013, 69, 21–36. [Google Scholar] [CrossRef]
- Nicandro, C.-R.; Efrén, M.-M.; Yaneli, A.-A.M.; Enrique, M.-D.-C.-M.; Gabriel, A.-M.H.; Nancy, P.-C.; Alejandro, G.-H.; De Jesús, H.-R.G.; Erandi, B.-M.R. Evaluation of the Diagnostic Power of Thermography in Breast Cancer Using Bayesian Network Classifiers. Comput. Math. Methods Med. 2013, 2013, 1–10. [Google Scholar] [CrossRef]
- Mejia, T.M.; Pérez, M.G.; Andaluz, V.H.; Conci, A. Automatic Segmentation and Analysis of Thermograms Using Texture Descriptors for Breast Cancer Detection. In Proceedings of the 2015 Asia-Pacific Conference on Computer Aided System Engineering, Quito, Ecuador, 14–16 July 2015; pp. 24–29. [Google Scholar]
- Silva, L.F.; Santos, A.A.S.; Bravo, R.S.; Silva, A.C.; Muchaluat-Saade, D.C.; Conci, A. Hybrid analysis for indicating patients with breast cancer using temperature time series. Comput. Methods Programs Biomed. 2016, 130, 142–153. [Google Scholar] [CrossRef]
- Resmini, R.; Borchartt, T.B.; Conci, A.; Lima, R.C.F. Auxílio ao Diagnóstico Precoce de Patologias da Mama Usando Imagens Térmicas Câncer de mama. Anais Comput. Beach 2013, 1, 305–314. [Google Scholar]
- Milosevic, M.; Jankovic, D.; Peulic, A. Comparative analysis of breast cancer detection in mammograms and thermograms. Biomed. Tech. Eng. 2014, 60, 49–56. [Google Scholar] [CrossRef] [PubMed]
- Araújo, M.C.; Lima, R.C.; De Souza, R.M. Interval symbolic feature extraction for thermography breast cancer detection. Expert Syst. Appl. 2014, 41, 6728–6737. [Google Scholar] [CrossRef]
- Milosevic, M.; Jankovic, D.; Peulic, A. Thermography based breast cancer detection using texture features and minimum variance quantization. EXCLI J. 2014, 13, 1204–1215. [Google Scholar] [PubMed]
- Silva, L.F.; Sequeiros, G.O.; Santos, M.L.O.; Fontes, C.A.P.; Muchaluat-Saade, D.C.; Conci, A. Thermal Signal Analysis for Breast Cancer Risk Verification. Stud. Health Technol. Inform. 2015, 216, 746–750. [Google Scholar] [PubMed]
- De Santana, M.A.; Pereira, J.M.S.; Da Silva, F.L.; De Lima, N.M.; De Sousa, F.N.; De Arruda, G.M.S.; Lima, R.D.C.F.D.; Da Silva, W.W.A.; Dos Santos, W.P. Breast cancer diagnosis based on mammary thermography and extreme learning machines. Res. Biomed. Eng. 2018, 34, 45–53. [Google Scholar] [CrossRef]
- Raghavendra, U.; Acharya, U.R.; Ng, E.Y.K.; Tan, J.-H.; Gudigar, A. An integrated index for breast cancer identification using histogram of oriented gradient and kernel locality preserving projection features extracted from thermograms. Quant. Infrared Thermogr. J. 2016, 13, 195–209. [Google Scholar] [CrossRef]
- Krawczyk, B.; Schaefer, G. A pruned ensemble classifier for effective breast thermogram analysis. In Proceedings of the 2013 35th Annual International Conference of the IEEE Engineering in Medicine and Biology Society (EMBC), Osaka, Japan, 3–7 July 2013; pp. 7120–7123. [Google Scholar]
- Krawczyk, B.; Schaefer, G.; Woźniak, M. Combining one-class classifiers for imbalanced classification of breast thermogram features. In Proceedings of the 2013 Fourth International Workshop on Computational Intelligence in Medical Imaging (CIMI), Osaka, Japan, 3–7 July 2013; Volume 2013, pp. 36–41. [Google Scholar]
- Krawczyk, B.; Schaefer, G. A hybrid classifier committee for analysing asymmetry features in breast thermograms. Appl. Soft Comput. 2014, 20, 112–118. [Google Scholar] [CrossRef]
- Krawczyk, B.; Schaefer, G.; Zhu, S.Y. Breast Cancer Identification Based on Thermal Analysis and a Clustering and Selection Classification Ensemble. In Lecture Notes in Computer Science; Springer: Berlin, Germany, 2013; Volume 8211, pp. 256–265. [Google Scholar]
- Saednia, K.; Tabbarah, S.; Lagree, A.; Wu, T.; Klein, J.; Garcia, E.; Hall, M.; Chow, E.; Rakovitch, E.; Childs, C.; et al. Quantitative Thermal Imaging Biomarkers to Detect Acute Skin Toxicity From Breast Radiation Therapy Using Supervised Machine Learning. Int. J. Radiat. Oncol. 2020, 106, 1071–1083. [Google Scholar] [CrossRef]
- Hernandez-Contreras, D.; Peregrina-Barreto, H.; Rangel-Magdaleno, J.; Ramirez-Cortes, J.; Renero-Carrillo, F. Automatic classification of thermal patterns in diabetic foot based on morphological pattern spectrum. Infrared Phys. Technol. 2015, 73, 149–157. [Google Scholar] [CrossRef]
- Adam, M.; Ng, E.Y.; Oh, S.L.; Heng, M.L.; Hagiwara, Y.; Tan, J.-H.; Tong, J.W.; Acharya, U.R. Automated detection of diabetic foot with and without neuropathy using double density-dual tree-complex wavelet transform on foot thermograms. Infrared Phys. Technol. 2018, 92, 270–279. [Google Scholar] [CrossRef]
- Vardasca, R.; Vaz, L.; Magalhaes, C.; Seixas, A.; Mendes, J. Towards the Diabetic Foot Ulcers Classification with Infrared Thermal Images. In Proceedings of the 14th Quantitative Infrared Thermography Conference, Berlin, Germany, 25–29 June 2018. [Google Scholar] [CrossRef]
- Vardasca, R.; Magalhaes, C.; Seixas, A.; Carvalho, R.; Mendes, J. Diabetic foot monitoring using dynamic thermography and AI classifiers. In Proceedings of the 3rd Quantitative InfraRed Thermography Asia Conference (QIRT Asia 2019), Tokyo, Japan, 1–5 July 2019. [Google Scholar] [CrossRef]
- Cruz-Vega, I.; Hernandez-Contreras, D.; Peregrina-Barreto, H.; Rangel-Magdaleno, J.D.J.; Ramirez-Cortes, J.M. Deep Learning Classification for Diabetic Foot Thermograms. Sensors 2020, 20, 1762. [Google Scholar] [CrossRef] [PubMed]
- Thirunavukkarasu, U.; Umapathy, S.; Krishnan, P.T.; Janardanan, K. Human Tongue Thermography Could Be a Prognostic Tool for Prescreening the Type II Diabetes Mellitus. Evid. Based Complement. Altern. Med. 2020, 2020, 1–16. [Google Scholar] [CrossRef] [PubMed]
- Magalhaes, C.; Vardasca, R.; Mendes, J. Classifying Skin Neoplasms with Infrared Thermal Images. In Proceedings of the 14th Quantitative InfraRed Thermography Conference (QIRT 2018), Berlin, Germany, 25–29 June 2018. [Google Scholar] [CrossRef]
- Magalhaes, C.; Mendes, J.; Filipe, R.V.; Vardasca, R. Skin neoplasms dynamic thermal assessment. In Proceedings of the 2019 IEEE 6th Portuguese Meeting on Bioengineering (ENBENG), Lisbon, Portugal, 22–23 February 2019; Volume 2019, pp. 1–4. [Google Scholar]
- Papež, B.J.; Palfy, M.; Turk, Z. Infrared Thermography Based on Artificial Intelligence for Carpal Tunnel Syndrome Diagnosis. J. Int. Med. Res. 2008, 36, 1363–1370. [Google Scholar] [CrossRef] [PubMed]
- Papež, B.J.; Palfy, M.; Mertik, M.; Turk, Z. Infrared Thermography Based on Artificial Intelligence as a Screening Method for Carpal Tunnel Syndrome Diagnosis. J. Int. Med. Res. 2009, 37, 779–790. [Google Scholar] [CrossRef] [PubMed]
- Acharya, U.R.; Tan, J.-H.; Vidya, S.; Yeo, S.; Too, C.L.; Lim, W.J.E.; Chua, K.C.; Tong, L. Diagnosis of response and non-response to dry eye treatment using infrared thermography images. Infrared Phys. Technol. 2014, 67, 497–503. [Google Scholar] [CrossRef]
- Acharya, U.R.; Tan, J.H.; Koh, J.E.; Vidya, K.S.; Yeo, S.; Too, C.L.; Chua, C.K.; Ng, E.; Tong, L. Automated diagnosis of dry eye using infrared thermography images. Infrared Phys. Technol. 2015, 71, 263–271. [Google Scholar] [CrossRef]
- Frize, M.; Ogungbemile, A. Estimating rheumatoid arthritis activity with infrared image analysis. Stud. Health Technol. Inform. 2012, 180, 594–598. [Google Scholar] [PubMed]
- Egbert, D.; Kaburlasos, V.; Goodman, P. Neural Network Discrimination of Sublte Image Patterns. In Proceedings of the 1990 IJCNN International Joint Conference on Neural Networks, San Diego, CA, USA, 17–21 June 1990; pp. 517–524. [Google Scholar]
- Koprowski, R. Automatic analysis of the trunk thermal images from healthy subjects and patients with faulty posture. Comput. Biol. Med. 2015, 62, 110–118. [Google Scholar] [CrossRef]
- Gopinath, M.P.; Prabu, S. Classification of thyroid Abnormalities on thermal image: A study and approach. IIOAB J. 2016, 7, 41–57. [Google Scholar]
- Procházka, A.; Charvátová, H.; Vyšata, O.; Kopal, J.; Chambers, J.A. Breathing Analysis Using Thermal and Depth Imaging Camera Video Records. Sensors 2017, 17, 1408. [Google Scholar] [CrossRef]
- Koukiou, G.; Anastassopoulos, V. Fusion of Dissimilar Features from Thermal Imaging for Improving Drunk Person Identification. Int. J. Signal Process. Syst. 2017, 5, 106–111. [Google Scholar] [CrossRef]
- Lopez, M.B.; Del-Blanco, C.R.; Garcia, N. Detecting Exercise-Induced Fatigue Using Thermal Imaging and Deep Learning. In Proceedings of the 2017 Seventh International Conference on Image Processing Theory, Tools and Applications (IPTA), Montreal, QC, Canada, 28 November–1 December 2017; Volume 2017, pp. 1–6. [Google Scholar]
- Thiruvengadam, J.; Mariamichael, A. A preliminary study for the assessment of hypertension using static and dynamic IR thermograms. Biomed. Tech. Eng. 2017, 63, 197–206. [Google Scholar] [CrossRef] [PubMed]
- Jian, B.-L.; Chen, C.-L.; Chu, W.-L.; Huang, M.-W. The facial expression of schizophrenic patients applied with infrared thermal facial image sequence. BMC Psychiatry 2017, 17, 1–7. [Google Scholar] [CrossRef] [PubMed]
- Martínez-Jiménez, M.A.; Ramirez-GarciaLuna, J.L.; Kolosovas-Machuca, E.S.; Drager, J.; González, F.J. Development and validation of an algorithm to predict the treatment modality of burn wounds using thermographic scans: Prospective cohort study. PLoS ONE 2018, 13, e0206477. [Google Scholar] [CrossRef]
- Wang, S.; Pan, B.; Chen, H.; Ji, Q. Thermal Augmented Expression Recognition. IEEE Trans. Cybern. 2018, 48, 2203–2214. [Google Scholar] [CrossRef]
- Jayanthi, T.; Anburajan, M. Model-based computer-aided method for diagnosis of cardiovascular disease using IR thermogram. Biomed. Res. 2019, 30, 95–101. [Google Scholar] [CrossRef][Green Version]
- Nagori, A.; Dhingra, L.S.; Bhatnagar, A.; Lodha, R.; Sethi, T. Predicting Hemodynamic Shock from Thermal Images using Machine Learning. Sci. Rep. 2019, 9, 1–9. [Google Scholar] [CrossRef]
- Cho, Y.; Julier, S.J.; Bianchi-Berthouze, N. Instant Stress: Detection of Perceived Mental Stress Through Smartphone Photoplethysmography and Thermal Imaging. JMIR Ment. Health 2019, 6, e10140. [Google Scholar] [CrossRef]
- Shim, S.; Kim, S.-J.; Lee, J. Diagnostic test accuracy: Application and practice using R software. Epidemiol. Health 2019, 41, e2019007. [Google Scholar] [CrossRef]
- Higgins, J.P.T.; Thompson, S.G.; Deeks, J.J.; Altman, D.G. Measuring inconsistency in meta-analyses. BMJ 2003, 327, 557–560. [Google Scholar] [CrossRef]
- Gourd, E. Breast thermography alone no substitute for mammography. Lancet Oncol. 2017, 18, e713. [Google Scholar] [CrossRef]
- Zadeh, H.G.; Haddadnia, J.; Seryasat, O.R.; Isfahani, S.M.M. Segmenting breast cancerous regions in thermal images using fuzzy active contours. EXCLI J. 2016, 15, 532–550. [Google Scholar]
- Silva, P.; Vardasca, R.; Mendes, J.; Restivo, M.T. Towards an Automated Analysis of Forearm Thermal Images During Handgrip Exercise. In International Conference on Remote Engineering and Virtual Instrumentation; Springer: Cham, Germany, 2018; Volume 2, pp. 498–506. [Google Scholar]


Publisher’s Note: MDPI stays neutral with regard to jurisdictional claims in published maps and institutional affiliations. |
© 2021 by the authors. Licensee MDPI, Basel, Switzerland. This article is an open access article distributed under the terms and conditions of the Creative Commons Attribution (CC BY) license (http://creativecommons.org/licenses/by/4.0/).
Share and Cite
Magalhaes, C.; Mendes, J.; Vardasca, R. Meta-Analysis and Systematic Review of the Application of Machine Learning Classifiers in Biomedical Applications of Infrared Thermography. Appl. Sci. 2021, 11, 842. https://doi.org/10.3390/app11020842
Magalhaes C, Mendes J, Vardasca R. Meta-Analysis and Systematic Review of the Application of Machine Learning Classifiers in Biomedical Applications of Infrared Thermography. Applied Sciences. 2021; 11(2):842. https://doi.org/10.3390/app11020842
Chicago/Turabian StyleMagalhaes, Carolina, Joaquim Mendes, and Ricardo Vardasca. 2021. "Meta-Analysis and Systematic Review of the Application of Machine Learning Classifiers in Biomedical Applications of Infrared Thermography" Applied Sciences 11, no. 2: 842. https://doi.org/10.3390/app11020842
APA StyleMagalhaes, C., Mendes, J., & Vardasca, R. (2021). Meta-Analysis and Systematic Review of the Application of Machine Learning Classifiers in Biomedical Applications of Infrared Thermography. Applied Sciences, 11(2), 842. https://doi.org/10.3390/app11020842