Abstract
Emergency departments in hospitals are having many difficulties in achieving the performance levels required by health regulators and society. The waiting times as well as the total throughput time are examples of performance indicators that emergency departments need to improve in order to provide a better service to the community. To achieve improvement of performance, the present paper shows a methodology to assist the design process of an emergency department using simulation techniques. In this study, the emergency department of a hospital located in the northern region of Portugal was considered to test the proposed simulation technique. The emergency department initial state was assessed, in terms of patient flow, as well as the human resources needed at every stage of the service. In order to understand in depth the process that a patient goes through during an emergency episode, a comprehensive study was performed on the hospital database. This allowed the analytical description of an emergency episode, which was further used as an input to the simulation model. After developing the simulation model with the information obtained by the hospital’s database, a validation stage was performed. Finally, in order to achieve an optimized design for the emergency department several variant scenarios were considered and evaluated. This methodology proved to be very useful in determining an optimized operation for complex, and non-linear systems.
1. Introduction
The intensification of competition in the industrial sector, namely the automobile sector, has launched companies in search of new and more effective production organization and management methods. In the mid-twentieth century, a new productive ideology was born within Toyota, capable of breaking the productive paradigms rooted at the time. Contrary to the concept of mass production developed by Henry Ford, with which production lines are associated, the Toyota Production System (TPS) intends to achieve the same objective, continuous production flow, with more limited resources [1] when producing low-volume and high-variety products. This production philosophy became known with the publication of the book “The machine that changed the world” as lean manufacturing [2]. Despite the interest of the academic-scientific community in Japanese productive strategies, which increased between 1977 and 1983, with the publication of the first article in English [3], only years later did it become more accentuated in the business sphere, deriving from a crisis in the automotive sector [4]. Associated with the publication of the famous book “The machine that changed the world” a global proliferation of the Toyota Production System occurred in the automotive sector all around the world. The benefits resulting by TPS or lean production principles and concepts, such as reducing costs and increasing product quality, quickly led to its expansion to different areas [5]. This expansion process was intensified when several industrial segments, besides the automobile segment, achieved prominent results with the its adoption in their production processes [6]. According to Hines et al. [7], delivering products with value to customers passed not only through the application of lean principles at the operational level, but also at the strategic level. Disseminating the principles recommended by the lean philosophy (initially addressed to production) to the remaining levels of a company gave rise to a new concept, lean enterprise [1]. This philosophy excels in identifying the processes and tasks that truly add value to the service provided to customers throughout the company. Thus, by implementing lean to the whole enterprise, it is expected to reduce operating costs, improve the quality of the service provided, as well as the reduction of its lead time.
The gains made possible by the lean philosophy quickly aroused curiosity in different sectors. There has been an increasing tendency to transport lean principles to the public sector in order to reduce costs and, at the same time, improve the efficiency of government operations [8]. However, although lean philosophy represents a set of principles and not tools, transposing it directly to the government sector presents multiple obstacles. Both labour law codes, as well as the potential conflict between management and workers, may make it impossible to adopt lean government policies [8]. Nevertheless, the health sector has been demonstrating a great capacity to adapt to the principles of the philosophy originated in Toyota in what can called lean healthcare, which is a very recent concept [9]. To advocate a management policy based on lean healthcare concepts means a constant search to provide improved patient services using a lower number of resources. It should also be noted that lean healthcare presents an antagonistic perspective to traditional management policies, based on the dismissal of personnel or compromising the quality of the service provided [10]. The exact beginning of the application of the lean healthcare concept is somewhat diffuse, however pioneering work stands out [11], where the author transports productive technology to the hospital context in order to reduce inventories. Since then, multiple publications have appeared in the scientific community [9], addressing several applications of different Lean tools in healthcare services, such as the application of SMED techniques to reduce the setup time of an operating room [12], the application of performance indicators such as the overall equipment effectiveness of operating rooms [13], or the application of the methodology 5S in a hospital establishment [14]. Research in lean healthcare has been growing almost exponentially; however, according to Proudlove et at. [15] and D’Andreamatteo et al. [16], lean healthcare is still in an early stage of development, with countless opportunities yet to be explored [9].
Although the lean approach was initially inspired for the automotive segment, some of its associated tools can be applied to all sectors. From these tools are analysis techniques, and against current prejudice, the simulation of discrete events is one of the techniques that stands out. The constant technological advancement has enhanced the development of simulation software that is increasingly robust and capable of numerically translating a real scenario. This fact made it possible to test changes to existing processes without the need to implement them on a real scale [17,18]. Despite representing a theme that has been cherished in academia since 1950, its use as a tool to analyse issues related to production only proliferated from 1986 onwards [19]. Since then, the adoption of simulation as an analysis technique has gained notoriety, with a multitude of studies published in sharp detail in different contexts to date [20]. Just as lean has expanded to different sectors, so has simulation. The application of this technique as a problem analysis technique and support to the decision-making process quickly spread in the health sector, highlighting the adoption of themes such as the study of surgical procedures, intensive care unit design, among others [21]. Both the discrete event simulation technique and the lean healthcare principles share the objective of improving the analysed process. An example of integration between these two concepts was proposed in 2012 by Stewart Robinson [22]. Thus, testing the various scenarios resulting from the adoption of measures based on lean healthcare concepts became possible with the use of discrete event simulation [23,24].
Based on the succinct historical framework presented, it can be easily understood that both the application of the lean philosophy to the health sector, as well as the use of the simulation technique as an aid to the improvement of hospital services, represent a remarkably recent theme in the scientific community. Thus, in terms of scientific research, answering the question if is possible to achieve an improved design in healthcare services by using innovative simulation techniques was the foundation for the study presented here. In this context, the authors’ willingness to answer the question with the need for improvement of a hospital emergency department located in the north region of Portugal culminated in the research plan presented. The main goal was to develop a new operation parameterization for the hospital’s emergency department, through the association of simulation techniques with the lean healthcare philosophy. In this way, several variant scenarios, optimized according to a lean healthcare philosophy, can be studied without the need for scale tests.
2. Methods
As mentioned previously, a Portuguese hospital was used as a case study to develop the research presented in this paper. In this case study, firstly, a diagnosis phase was performed in which the main resources, information, processes, and flows were identified, and the relevant data of the system was collected and processed. Secondly, the discrete-event simulation model of the emergency department was developed. In this phase various key performance indicators were assessed to confirm the simulation model validation. The third phase consisted in generating functional variations of the emergency department, in terms of medical staff and room capacities, using the simulation model in order to evaluate and foresee different operational behaviors of the emergency department. In this phase an in-depth analysis of the results was performed, and a set of improvements were proposed to confidently proceed to the emergency department redesign.
2.1. Case Study Overview
The case study research in this paper was developed is an emergency department of a hospital located in the north of Portugal. The main objective was to assess the operation of the emergency department and take the opportunity that it was undergoing a structural redesign to optimize its structure and operation. A total of three meetings were performed to gain insight on how the emergency department operates, and understand the main difficulties felt by the working staff (doctors, nurses, and operational assistants). Along with five in-field observations taken by the authors to detailed assess procedures in the emergency department, the hospital also provided the entire database of 2018 admissions and treatments. This allowed advanced data treatment to be performed, as well as data probabilistic fitting to be achieved with very high confidence levels, in order to describe emergency episodes analytically. The emergency department was modelled considering all types of emergency episode and several results were obtained from the scenarios generated with the simulation model. Several guidelines were proposed for an improved redesign and operation of the emergency department.
2.1.1. Triage Procedure
One major drawback associated with increasing demand in emergency departments is overcrowding, which leads to lengthy waiting times and, consequently, to potential security issues due to those waiting times. In an attempt to minimize this impact, triage procedures are essential, as they diagnose the patient’s clinical state severity leading to the establishment of organized flows. The hospital under study follows the Manchester triage protocol in which the patient receives a color in accordance with the severity state exhibited. Although the color received represents a severity in the patient’s clinical condition, it also represents the target waiting time until the first medical intervention, which can be seen in Figure 1.
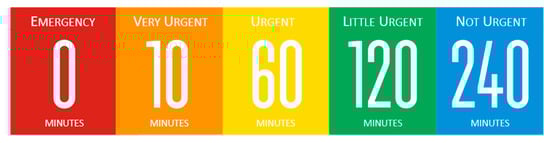
Figure 1.
Manchester triage colors with the corresponding target waiting time.
The standard maximum waiting time established by the Manchester triage protocol will be one of the most important key performance indicators to assess in the several scenarios generated by the simulation model as it directly represents how well the system is performing and also because it represents a guideline imposed by the national health regulator. In fact, regarding the inherent magnitude of such an indicator, in Portugal the financing of the emergency department depends on compliance with the times specified by the Manchester triage protocol.
2.1.2. Process Stages
An emergency episode can be generically described by three procedures: (1) Admission, where the patient fills out the necessary forms to be admitted to the emergency department; (2) Triage, where a screening process assigns priorities to patients based on their clinical condition; (3) Treatment, which conjugates all the necessary actions to solve the patient’s clinic condition. To better clarify the patients’ flow through all process stages an illustrative scheme is presented in Figure 2. As can be seen, every arriving patient will pass firstly by the admission process, being then directed to the triage stage. Concluding this stage, the patient follows to the respective treatment area assigned in the triage process.
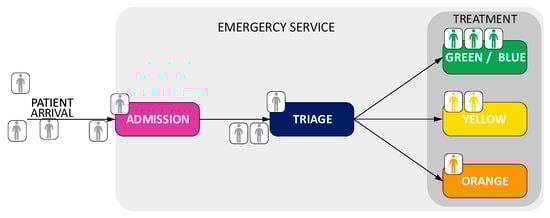
Figure 2.
Illustrative scheme of emergency process stages for an episode.
In the following section, it will be shown how every process was analytically modelled using data from the database provided by the hospital.
2.1.3. Layout
To better understand and simulate the patient flow during an emergency episode it is important to consider the exact morphology of the emergency department. Figure 3 illustrates an overview of the emergency department plant, with different colors highlighting all relevant areas to the study. For consistency purposes, the color scheme used will be maintained throughout the rest of the article. The first stage on an emergency episode is the admission, which in this case occurs in the purple area. After being admitted, the patient will undergo the triage process (blue area), where a priority level is assigned, which determines the treatment area the patient will be placed. This case study will consider three priorities, green, yellow, and orange, and the corresponding treatment areas, as explained in the section triage procedures. Each of the rooms has a limited capacity in terms of treatment places, being 22 places in the green area, 15 places in the yellow area and 20 places for the orange area. Figure 3 illustrates the real emergency department layout after the structural redesign. The real plant (including areas, distances, and treatment places) was uploaded to the simulation model.
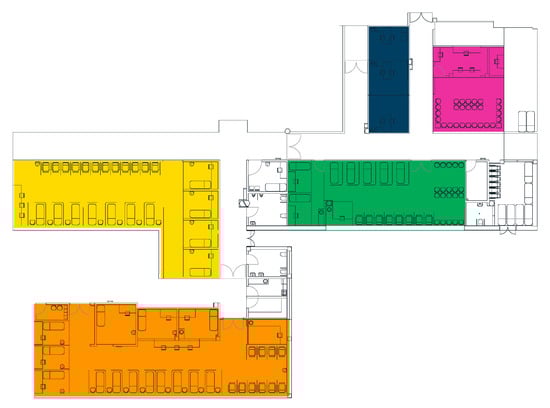
Figure 3.
Overview of the future emergency department.
2.1.4. Staff and Shifts
In Portugal all the public emergency departments have similar operating policies, and it is very common for the emergency department to be divided into two shifts, a day and a night shift. In the hospital of this case study, each shift lasts 12 h, the daily shift being between 09:00 and 21:00, and the night shift between 21:00 and 09:00. Since the night demand is considerably lower in comparison to the daily demand, a smaller team of professionals is considered. Such reduction is compensated with a reinforcement period between 21:00 and 00:00. Usually, the staff teams are organized according to the demand patterns per shift as presented in Table 1.

Table 1.
Medical staff per shift.
As one can see, the red priority does not have a corresponding team which can be justified by two main reasons: red patients represent less than 1% of all cases, and, when a red patient arrives to the emergency department medical staff from the other teams are instantaneously moved to treat that patient. In fact, red patients never suffer from resource shortage, meaning they never wait to be observed and treated and that is the reason why those patients are not included in this study. A similar philosophy is considered for the night staff for the green/blue treatment room. Since this type of patient is not considered urgent, during 21:00 to 09:00 they are assigned to the yellow treatment area. In this study, green will include both areas, green and blue.
2.2. Data Collecting and Analysis
Bearing in mind that the case study is developed in an emergency department of a hospital, most of the data used in this study, refers to one full year of information provided by the hospital. The key information, provided by the hospital, used in this study was:
- -
- Patient admission time.
- -
- Starting time of the triage process.
- -
- Total duration time of the triage process.
- -
- Time between triage and the first medical observation.
- -
- Treatment time, which represents the time between the first medical observation and medical discharge.
Figure 4 shows a typical flow for an emergency episode, with the indicators that the authors had access to being highlighted. Superimposed, it was also mentioned what were the purpose that the indicators assumed in the present study. As can easily be seen, although the authors do not have some measurements, they can easily be determined using the indicators provided by the hospital.
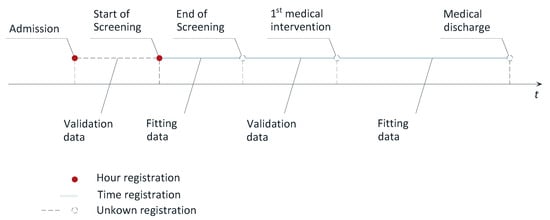
Figure 4.
Patient flow schematic with the indicators, provided by the hospital, used in the present study.
Admission time was used to discover how patient arrival is distributed along every day of the week, which is easy to establish by sorting the data. Validation data, as the name states, were used to validate the simulation model, which was done by comparing the average values of the database with those achieved by the model. Lastly, the fitting data were used to describe a processing time in the simulation model, being the probabilistic adjustment of data, to theoretical distributions, made using the maximum likelihood method. This method determines the input parameters of the theoretical distribution according to the database, later used as inputs in the simulation model.
3. Analytical Description of an Episode
The use of simulation models to predict the behaviour of the system requires an analytical description of all the constituent stages which a patient will go through during an emergency episode [22]. For that purpose, and after being able to identify how the emergency department works, the authors used the hospital’s database to describe the process mentioned in Figure 2. As easily perceived the current section presents the analytical study conducted to every stages of an emergency episode, which will be used as inputs to the simulation model.
3.1. Patient Arrival
Emergency departments have to deal with unknown and unbalanced demand. Knowing the demand’s distribution along every day of the week and the respective Manchester’s priorities represent a key factor for planning purposes [25]. Moreover, having an overview of the behavior of arrivals to the emergency department allows for better resource planning and preventive preparation of the system [16].
The hospital monitors the emergency episode for every patient by registering the times when changes occur in the episode state. For investigating the patient arrival distribution, it is only necessary to know the time when each patient was admitted to the emergency department, which is the first record in the hospital database. Therefore, the authors had access to the 2018 database which contained 92,978 entries referencing 0.2% red priorities, 8.2% orange priorities, 46.9% yellow priorities, 41.2% green priorities and 3.5% blue priorities, as can be seen by the pie chart presented in Figure 5.
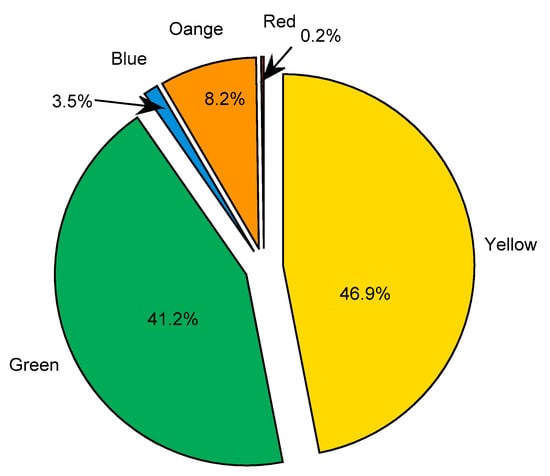
Figure 5.
Pie chart representing the distribution of entries per priority assigned in the triage process.
Orange, yellow and green priorities are the most common patient type that arrives in the emergency department. Since green and blue patients are not usually considered urgent episodes, they are treated together in the same area, and so treated as only one type of patient medical state in this study. Red patients (for brevity, the patient priority state will be referred by the color) have a distinct flow inside the emergency departments not being considered in the study here presented.
Despite the unknown nature of the arrivals, it is important to describe the arrival pattern per priority (based on historic records) in order to identify how the demand is distributed throughout the day. For that purpose, the arrival pattern was determined for each hour of every weekday per priority, as shown in Figure 6.
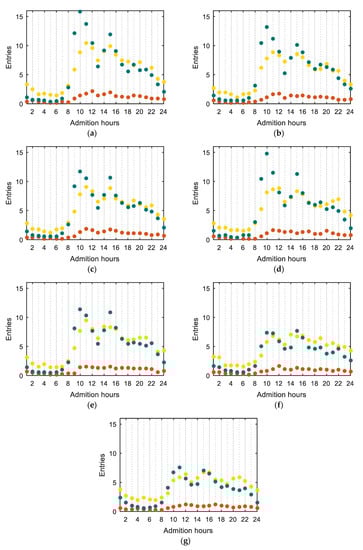
Figure 6.
Average arrival rates for every hour per priority for: (a) Monday; (b) Tuesday; (c) Wednesday; (d) Thursday; (e) Friday; (f) Saturday; (g) Sunday.
Discriminating the emergency department demand patterns is important to identify several characteristics: the demand at night shift is considerably lower in comparison to the rest of the day; the morphology of the arrival pattern of yellow and green priorities is identical. As can be seen, two peaks occur during the day, one generally between 08:00 and 10:00 and another between 14:00 and 16:00 (for yellow and green). Orange patients are considered very urgent episodes with severe clinical states which converts to far fewer entries, and, although there are also two peaks, their magnitude is smoother than in the yellow and green pattern. The demand during the weekdays is considerable higher in comparison to the weekend, highlighting Monday as the most demanded day. This study analytically proved an idea shared within the staff members who mentioned Monday as the worst day in terms of performance.
3.2. Admission Process
Each patient only becomes an emergency episode after passing by the admission process, which consists of registering the patient entrance in the emergency department. From this point, the emergency process starts being monitored by the hospital, registering the times of the main events regarding patient treatment. As the hospital only begins monitoring patients after the registration process is finished, there is no data on the database to characterize the admission process processing time. Thus, to know how long it takes to admit a patient it was conducted an observation action to collect the admission processing time, described in Figure 7. The collecting action took place on three different days of the week to include randomness in the sample.
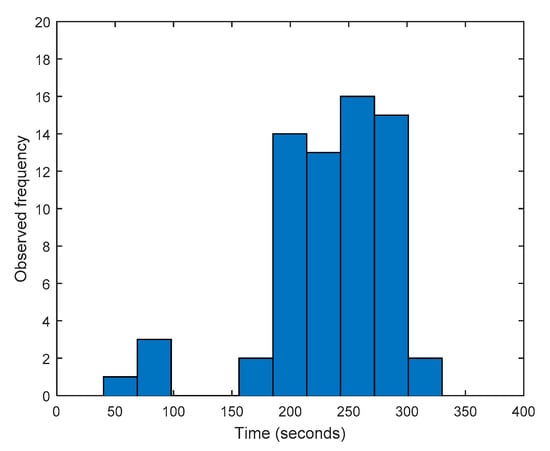
Figure 7.
Histogram of recorded admission times.
Since the purpose of describing analytically the admission process is to use such data in the simulation model, the collected data were treated and fitted, conservatively, to a uniform distribution, with a minimum and maximum of 3 and 5 min, respectively (Figure 7).
3.3. Triage Process
After entering the emergency department, which occurs when the registration process finishes, the patients have to wait for the triage process. Manchester’s protocol is applied, being assigned a priority level (represented by a color), as well as the medical specialist who will attend the patient. The triage duration is recorded for every patient and, thus, to analytically describe the triage process, a probabilistic fit of that data was performed based on the database provided. The maximum likelihood method [26] was used to determine the fitting parameter, being expressed in Figure 8 the data histogram and corresponding fit, as well as the probability plot. As can be seen by the Figure 8b, a Lognormal distribution (mean 4.58096 s and deviation 0.554615 s) shows a very good fit with the hospital database.
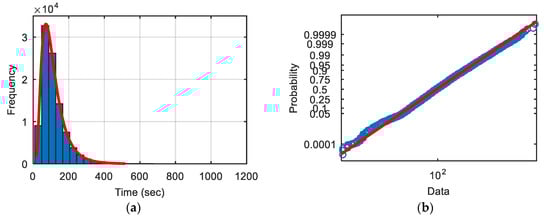
Figure 8.
Triage data: (a) histogram; (b) probability plot (blue circles—real data, red line—theoretical distribution).
Determining the random distribution that better represents the real data is of paramount importance to this study as it will be used in the simulation model to mimic the triage process behavior. Such a good fit increases confidence in developing a valid simulation model.
3.4. Treatment Rooms
Long waiting queues, and therefore, lengthy waiting times are common characteristics associated with emergency departments worldwide [25]. This can be associated with an unbalance between demand and capacity, and with operational wastes which amplify capacity problems [27]. The combination of these facts is the main justification for the unproductive environment of emergency departments, which is amplified by the increasing demand experienced over the years [25].
Thus, to pursue an improved performance, and properly design the required resources, it is imperative to understand the demand of the treatment rooms, which may be assessed by determining the takt time. This indicator measures, on average, how often a patient arrives at the treatment room. Since the hospital monitors at which time the patient begins the triage process and also the triage duration, it is possible to determine the exact time that the patients leave the triage area and arrive at the treatment room. Takt time will be the average time between arrivals, being expressed in Table 2.
Table 2.
Takt Time obtained from the hospital database.
Analyzing the data of Table 2, it is possible to observe that green and yellow patients arrive almost at the same rate, which is related to the fact that they represent a similar percentage of emergency episodes. Orange episodes, as these refer to more serious health diagnoses, are not as common as the green and yellow, the takt time being considerably higher. For the purpose of establishing an efficient service, the takt time represents the needed treatment rate at which there will be no queue in the treatment rooms. Therefore, takt time can be used to design the medical staff capacity required to respond to a specific demand, aiming in this way to create operational flow.
Knowing the takt time for each treatment area is extremely important since it establishes a production rate needed in the treatment rooms to reduce the possibility of creating queues, and consequently, long waiting times. As mentioned previously, the treatment process represents all the actions/stages that an emergency episode can follow, which can represent a large variety of flows.
When patients start treatment there are several actions/stages that they may undergo. This means that there are several types of flows inside the treatment rooms. Although the hospital makes a huge effort to record all steps of the patient inside the treatment rooms, in fact, such task is not completely fulfilled due to system limitations and personnel mistakes. Moreover, several information is recorded in different information systems which make it impossible to correlate and gather all the data regarding all steps of a patient inside the treatment room.
To overcome this difficulty, the authors considered a generic flow type, which is presented in Figure 9. It is important to mention that although Figure 9 illustrates a yellow patient example, the same strategy was applied for orange and green patients. As one can see, the flow type considered in the present study describes the treatment time with three components in two medical interventions, one in the beginning of the episode and the other at the end, and miscellaneous actions in the middle. All three components are characterized as a percentage of the treatment total time. The time for the first medical observation is determined by a triangular random distribution with parameters: minimum 15%, mode 12.5%, and maximum 20%. The time for second medical intervention (and consequent medical discharge) is determined as 5% of the total episode time. This parameterization was considered acceptable by the medical staff based on their experience on treating all types of patients. In fact, the number of medical interventions may vary from patient to patient, however, with this generic approach, all medical interventions are aggregated in two interventions. In general terms, the total time the medical staff is occupied with the patients will be the same. The time for miscellaneous actions (impossible to know from the hospital database) is the remaining time (subtracting the time of the two medical interventions to the total treatment time).
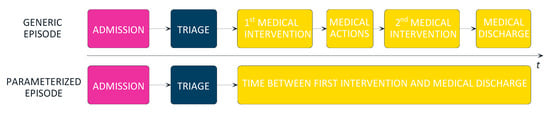
Figure 9.
Generic episode flowchart and parameterized flowchart considered in this case.
Different pathologies, as well as different priorities, will represent distinct treatment times. Since the database of the emergency department distinguishes the priority, as well as the diagnosis and the time from the first medical intervention until medical discharge, it was possible to treat such data using probabilistic fitting. As an example, for an episode characterized by a yellow priority with a diagnosis of “problem in the members” the treatment time for that type of episode is described by a lognormal distribution with mean of 113.836 s and a variance of 4667.12 s (Figure 10 represents the probabilistic fit). This procedure was carried out for the most common diagnosis presented in hospital database, representing around 90% of all types of episode (orange, yellow, and green) that the hospital must treat. Such detailed data analysis confers great reality upon the parameterized flow adopted for the study of the treatment rooms.
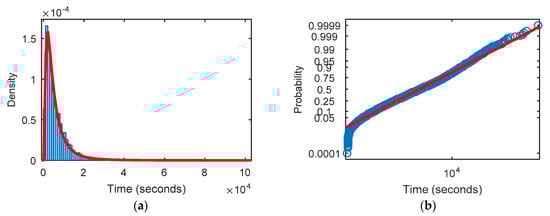
Figure 10.
Probabilistic fitting for the yellow patient with a member problem diagnosis for: (a) density function; (b) probability plot. (red line—theoretical distribution, blue—hospital database).
4. Simulation Model Description
After the analytical description of an emergency episode was completed, a simulation model with the same stages identified in Figure 2 was developed to predict the performance of the emergency department. This section presents how the previous information was considered in the simulation model. To finish a numerical validation of the simulation model, it is presented by comparing the obtained values with the real ones.
4.1. Overview
All the information shown previously was implemented in the simulation model (using Simio software) to realistically model the emergency department. Figure 11 presents an overview of the simulation model. All the processes and data analytically processed in the previous section were implemented in the simulation model.
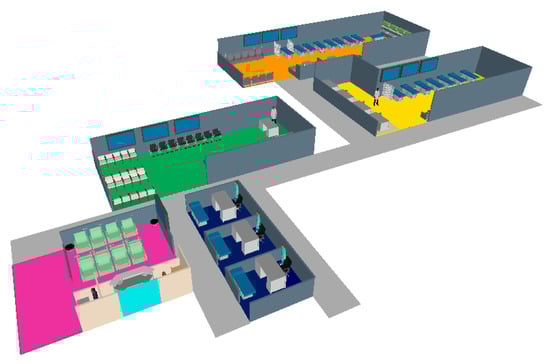
Figure 11.
Overview of the simulation model (purple area—admission, blue area—triage, green area—green and blue treatment room, yellow area—yellow treatment room, orange area—orange treatment room).
4.2. Patient Arrival Process
Simulation models often use Poisson distribution to generate the entities (patients in the present case) since it is known to be the best distribution fitting to describe arrival events [28]. Such distribution only requires the input of one parameter, the arrival rate of the event, which in our case is the arrival of a patient. As mentioned previously, the average arrival was determined for every hour of the week, as shown in Figure 6. These values, as is easily perceived, represent the input parameter of the Poisson distribution, which is used by the simulation model to generate the arrival of a new patient. For the purpose of clarification, consider as an example the arrival pattern of the 10th hour of Monday, shown in Figure 6a, i.e., 16 green patients. This means that the simulation model will take 16 as the input parameter of the Poisson distribution for the tenth hour of Monday.
4.3. Admission Process
The admission process is the first stage that each episode needs to go through. The processing time for this process was parameterized with a uniform distribution with a minimum value of 3 min and a maximum value of 5 min (implementation of the data fitting presented in Figure 7). The resources modeled for this process were administrative staff (two resources).
For this process, the most important performance indicators to analyze are the resource utilization (administrative staff) and the process queue (both time and number in queue). The simulation model also records the time when the admission process finishes which will allow for computing the admission process cycle time and, consequently, the triage process takt time.
4.4. Triage Process
The modelling procedure for the triage process is similar to that described above, with the operating time being dictated by a lognormal distribution (regarding the probabilistic fitting illustrated in Figure 8). In the triage process the patient is assigned a priority (in accordance to the percentage distribution found in the database). For the present study only orange, yellow, green and blue patients were considered since they represent 99.8% of the cases. As mentioned previously, blue patients were aggregated to the green ones as they share the same medical resources. For the triage process the modelled resources were nursing staff. The redesigned emergency department is planned to have three triage workstations, so the simulation model is flexible to accommodate any number of nursing staff for triage purposes.
For this process, the most important performance indicators to analyze are the resource utilization (nursing staff) and the process queue (both time and number in queue). The simulation model also records the time when the triage process finishes which will allow for computing the triage process cycle time and, consequently, estimate the takt time for each treatment room. When the triage process ends, the simulation model also starts monitoring the waiting time of the patient until the first medical intervention. This waiting time is one of the most important performance indicators of the study as it will reveal whether the emergency department is complying with the Manchester protocol time or not.
4.5. Treatment Room
Unlike the previous processes, simulating the treatment of a patient is a more complex process, since it involves the need for medical resources as well as other actions in the emergency department. Thus, when a patient enters a treatment room the treatment total time is computed based on the probabilistic data fitting explained in Figure 10. Then, it requests a medical resource to initiate the treatment. At this stage two distinct scenarios may occur, on the one hand if the medical resource is available the patient starts immediately the treatment, on the other hand if there is not any medical resource available the patient waits for the first observation. As was mentioned previously, the doctor’s allocation time to the patient is a percentage of the treatment total time, which also depends on the probabilistic distribution associated with the patient’s pathology. However, if a medical resource is available when requested but no treatment place is available in the treatment room, then the patient remains waiting. As can be seen, two premises must simultaneously be met for a patient to enter the treatment room: a medical resource and a treatment place being available. The time for the second medical intervention is 5% of the treatment total time, which will also depend on the patient pathology. For the second medical intervention the patients request a medical resource and wait until a medical resource becomes available. Patients inside the treatment room waiting for the second medical intervention have priority over the patients waiting for the first medical intervention. In the second medical observation the patients also receive their medical discharge, exiting the treatment room and, therefore, making available a space in the treatment room. The time between the first and second medical interventions is the remaining time of the treatment total time. This time represents the miscellaneous actions that may occur in the treatment rooms.
In the treatment rooms two main resources were modelled: the medical staff and the treatment places.
For the treatment rooms the most important performance indicators to analyze are the resource utilization (medical staff); waiting queues (both time and number in the queue—information needed to verify compliance with the Manchester protocol guidelines); and treatment places occupation.
4.6. General Flow Validation
To validate the simulation model two phases were considered: the first one compared the takt time for the treatment rooms obtained with the simulation model with the ones calculated using the hospital database (Table 3); the second one measured the performance indicators for each treatment room and asked for a validation of the corresponding system behavior by experienced medical staff.
Table 3.
Takt time comparison between values obtained by the database and by simulation model.
This shows that the emergency department is properly modelled in terms of flow. The simulation results represent a confidence interval of 95% that encompasses the arithmetic average of the database (the green room is sufficiently close to assume around 95% confidence level). Thus, this experiment validates the general flow and the analytical definition of the arrivals pattern, as well as the admission process and the triage process.
The second phase of the model validation was based on the expertise of the medical staff due to lack of data in the hospital database. The results obtained with the simulation model for each treatment room (considering the predefined number of resources and treatment places) is fully detailed next. The treatment places’ occupation will not be referred to for the model validation as it was new information only considered for the redesign of the emergency department. The performance indicators obtained for the reference case are shown in Table 4.
Table 4.
Performance of the treatment rooms.
By analysing Table 4 it is possible to verify that the average number of patients waiting for medical treatment is 2.8, 10 and 0.11, for green, yellow and orange rooms, respectively. In terms of waiting time, the average waiting time (in minutes) for medical treatment is 74, 162 and 8.6, for green, yellow and orange rooms, respectively. In terms of medical staff occupation, the results obtained show 70%, 74% and 34% occupation for green, yellow and orange rooms, respectively. All the results were considered valid by the hospital personnel. The green room is complying to the Manchester protocol times, showing a realistic system behaviour, as these patients are usually associated with very fast treatment times (processing times). The yellow room is the one showing more problems, not complying to the Manchester protocol standard times. This is explained by the more complex pathologies that these patients present which usually implies greater treatment times. This factor associated with the fact that yellow patients present high arrival rates, and also the shortage of resources, promotes the ineffective performance of the yellow room. The orange room presents statistics that comply with the Manchester protocol times representing no problems in terms of waiting time. These figures were validated by the hospital personnel conferring the needed validation for the simulation model.
5. System Improvement Procedure
One of the greatest advantages of using simulation models is the flexibility to study alternative scenarios without the need for real implementation. In this context, simulation is used to assess which variations on the modelled resources can translate into an improvement in the emergency performance. Since the real problems occur inside the treatment rooms, it is only necessary to assess the impact of their allocated resources (medical staff and treatment places). To properly design each treatment room, several scenarios were developed in which the impacts of varying treatment places and medical resources were assessed. The main performance indicators for scenarios evaluation were the Manchester protocol time, the medical staff occupation (scenarios with human occupation higher than 80% are discarded), and the number of treatment places occupied.
5.1. Green Room
As previously observed, the green treatment room displays no problems in terms of waiting time and medical resources occupation, which may reveal an over-dimensioning of resources. In this context, scenarios were generated by reducing the medical team by one member. For this case, the results in terms of average waiting time for the first medical intervention, and the occupation of the medical resources for different number of treatment places are shown in Figure 12, with the target limits being superimposed in red lines (results must be under the red lines to represent viable scenarios).
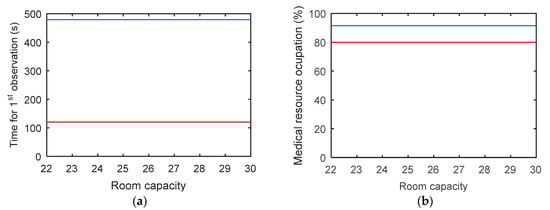
Figure 12.
Obtained values for different capacity scenario: (a) waiting time for first medical intervention (blue line—simulation model, red line—Manchester time); (b) medical resource occupation (blue line—simulation model, red line—occupation rate limit).
Reducing the medical staff by one member will lead to a congested system state where neither of the target performance indicators are met, which means that the number of members in the team should be maintained.
In a second phase, scenarios were generated by decreasing the number of treatment places. Figure 13 shows the results assuming the initial medical staff.
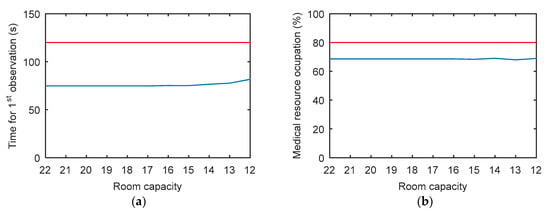
Figure 13.
Obtained values for different capacity scenario: (a) waiting time for first medical intervention (blue line—simulation model, red line—Manchester time); (b) medical resource occupation (blue line—simulation model, red line—occupation rate limit).
As can be seen, reducing the room treatment places is possible without penalizing the medical resource in terms of occupation and also allowing compliance with the Manchester protocol time requirements. Such behavior may be explained by the fact that green patients do not represent urgent episodes resulting in lower treatment times, which means that treatment places become available rapidly. These results reveal an over-design of the green room in terms of treatment places.
5.2. Yellow Room
A poor performance was observed for the baseline scenario in the case of the yellow treatment room. Thus, initially the impact caused by an increase in the capacity of the room (number of treatment places) was evaluated, keeping the medical staff unchanged. For this, several alternative scenarios with incremented room capacities were considered, with the results obtained being expressed in Figure 14.
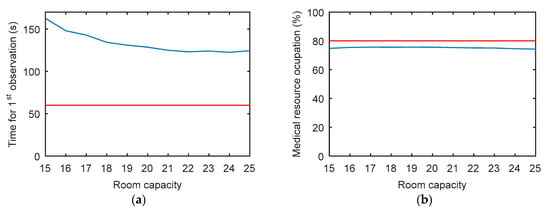
Figure 14.
Obtained values for different capacity scenario: (a) waiting time for first medical intervention (blue line—simulation model, red line—Manchester time); (b) medical resource occupation (blue line—simulation model, red line—occupation rate limit).
Increasing the room capacity produces a benefic behavior (reduction of the waiting time), without harming the medical staff, as they exhibit roughly the same occupation. The stagnation observed in the waiting times conjugated with a stable occupation reflects the need for increasing the medical staff. In this context, one more doctor was considered during the daily period (keeping the scenarios generation of increasing the room capacity). Figure 15 shows the results in terms of waiting time for the first medical observation, as well as the medical occupation for the several scenarios generated.
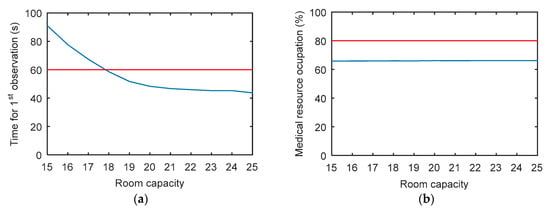
Figure 15.
Obtained values for different capacity scenario: (a) waiting time for first medical intervention (blue line—simulation model, red line—Manchester time); (b) medical resource occupation (blue line—simulation model, red line—occupation rate limit).
As can be seen, increasing the medical staff for the baseline case (15 treatment places) does not solve the waiting time problem (the Manchester protocol time is not met). However, increasing the number of treatment places improves the room performance in terms of waiting time (Figure 15a) and resource occupation (Figure 15b). It is important to note two observations regarding the room capacity: on the one hand to fulfill the Manchester’s protocol the room should increase three treatment spots (18 spaces in total); on the other hand the system reveals an asymptotic response around a total of 25 spaces which indicates that no more improvements are achieved after this number. This clearly means that migrating spaces from the green room to the yellow room will solve the response time problems faced by the hospital in the emergency department.
These results clearly show the nonlinear response of an emergency department, which reinforces the need for advance techniques, such as discrete-event simulation, to determine proper operation designs.
5.3. Orange Room
A similar analysis was conducted for the orange room where the decrease in the room capacity was assessed. As can be seen, by both results presented in Figure 16 there is an excess capacity in terms of room spaces and even in medical resources. However, since orange patients are considered very urgent emergency episodes, the rooms need to have an over design in both resources to accommodate peak demand without clogging the system.
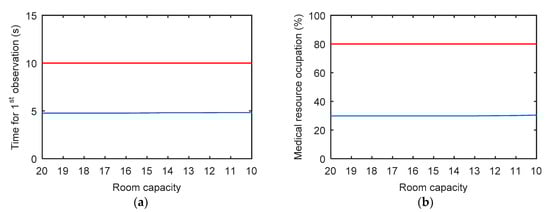
Figure 16.
Obtained values for different capacity scenario: (a) waiting time for first medical intervention (blue line—simulation model, red line—Manchester time); (b) medical resource occupation (blue line—simulation model, red line—occupation rate limit).
6. Conclusions
The paper presents a study of the emergency department in a hospital located in the north of Portugal. The objective of this study was to find solutions to improve the performance of the department in terms of waiting times and resource utilization using simulation techniques. In a first phase, the operating principles of the emergency department were presented, such as the arrival rates, the admission process, the triage protocol, resuming the main stages through which an emergency episode undergoes. Subsequently, an extensive analysis of the database provided by the hospital is presented, from which the stages of the emergency episode previously mentioned were analytically distinguished, as well as the emergency department demand. This made it possible to unveil Monday as the weekday with the higher demand in comparison to the rest of week. A demand pattern with two particularities was also evident: on the one hand the night shift registered a substantially lower number of entries, and on the other hand two peak periods between 08.00–10.00 and 14.00–16.00.
Then, a simulation model based on the extensive treated data was developed and presented. All the processes that characterize an emergency episode were modeled using probabilistic fitting to properly translate the emergency service operation. This model was later used to plan both the medical team, as well as the treatment places. We found a dependency between the number of doctors that make up the team and the places available for treatment, which directly affects the treatment rooms’ efficiency. It was revealed and quantified how much the treatment rooms performance is affected due to resources (human and spaces) availability. It was found that the green room has a surplus of capacity in terms of the number of treatment places, and the opposite was verified for the yellows’ treatment room. In this case, an improved solution is achieved by considering the binomial increase of the number of spaces (at least 3) with the increase of the doctor’s team (1 doctor day shift). Thus, the authors proposed that the excess spaces in the green room should be allocated to the yellow room so it can achieve a better performance (doctor’s occupation under 80% and waiting time for the first medical observation under 60 min, complying with the Manchester protocol time requirements). This allowed us to conclude that a proper room capacity design is influenced not only by the percentage of patients with a respective priority but also by the severity of the priority itself. Although the percentage of green patients is high, as their health status is not aggravated, and therefore they are treated more quickly, the capacity of the room does not require a volume of spaces in accordance with their percentage of entries. Taking into consideration the complexity and non-linearity of the emergency department, only a discrete-event simulation approach is capable of correctly modelling the system’s dynamics and intercorrelations allowing a proper design of both the size of the rooms and the medical team. However, if it is impossible to use a simulation model, the room capacity assigned to each priority must consider two factors, the severity of the patient and the percentage this represents in the total entries. It is important to mention that every change proposed by the authors was implemented in practice by the hospital management. Discrete event simulation has proven to be extremely effective in determining the behavior of alternative scenarios without being implemented at full scale. The flexibility associated with the simulation represents one of the biggest advantages in its adoption since it allows informed decision making.
Author Contributions
Conceptualization, A.C.-P., B.S.G. and R.M.L.; methodology, A.C.-P., B.S.G. and R.M.L.; validation, A.C.-P. and B.S.G.; formal analysis, A.C.-P., B.S.G. and R.M.L.; investigation, A.C.-P. and B.S.G.; writing—original draft preparation, A.C.-P. and B.S.G.; writing—review and editing, A.C.-P., B.S.G., R.M.L. and J.D.-C.; supervision, B.S.G. and R.M.L. All authors have read and agreed to the published version of the manuscript.
Funding
This work was partially supported by projects UIDB/00319/2020 and POCI-01-0145-FEDER-030299, from Fundação para a Ciência e Tecnologia (FCT), Portugal.
Institutional Review Board Statement
Not applicable.
Informed Consent Statement
Not applicable.
Data Availability Statement
Data is contained within the article.
Conflicts of Interest
The authors declare no conflict of interest.
References
- Melton, T. The benefits of lean manufacturing: What lean thinking has to offer the process industries. Chem. Eng. Res. Des. 2005, 83, 662–673. [Google Scholar] [CrossRef]
- Womack, J.P.; Womack, J.P.; Jones, D.T.; Roos, D. Machine That Changed the World; Simon and Schuster: New York, NY, USA, 1990. [Google Scholar]
- Sugimori, Y.; Kusunoki, K.; Cho, F.; Uchikawa, S. Toyota production system and kanban system materialization of just-in-time and respect-for-human system. Int. J. Prod. Res. 1977, 15, 553–564. [Google Scholar] [CrossRef]
- Holweg, M. The genealogy of lean production. J. Oper. Manag. 2007, 25, 420–437. [Google Scholar] [CrossRef]
- Ballé, M.; Beauvallet, G.; Smalley, A.; Sobek, D.K. The thinking production system. Reflections 2006, 7, 1–12. [Google Scholar]
- Womack, J.P.; Jones, D.T. Lean Thinking: Banish Waste and Create Wealth in Your Organisation; Simon and Shuster: New York, NY, USA, 1996; Volume 397. [Google Scholar]
- Hines, P.; Holweg, M.; Rich, N. Learning to evolve: A review of contemporary lean thinking. Int. J. Oper. Prod. Manag. 2004, 24, 994–1011. [Google Scholar] [CrossRef]
- Scorsone, E.A. New development: What are the challenges in transferring Lean thinking to government? Public Money Manag. 2008, 28, 61–64. [Google Scholar]
- Lima, R.M.; Dinis-Carvalho, J.; Souza, T.A.; Vieira, E.; Gonçalves, B. Implementation of lean in health care environments: An update of systematic reviews. Int. J. Lean Six Sigma 2020. [Google Scholar] [CrossRef]
- Weinstock, D. Lean healthcare. J. Med. Pract. Manag. MPM 2008, 23, 339. [Google Scholar]
- Heinbuch, S.E. A case of successful technology transfer to health care: Total quality materials management and just-in-time. J. Manag. Med. 1995, 9, 48–56. [Google Scholar] [CrossRef]
- Leslie, M.; Hagood, C.; Royer, A.; Reece, C.P.; Maloney, S. Using lean methods to improve or turnover times. AORN J. 2006, 84, 849–855. [Google Scholar] [CrossRef]
- Souza, T.A.; Vaccaro, G.L.; Lima, R.M. Operating room effectiveness: A lean health-care performance indicator. Int. J. Lean Six Sigma 2020, 11. [Google Scholar] [CrossRef]
- Kanamori, S.; Sow, S.; Castro, M.C.; Matsuno, R.; Tsuru, A.; Jimba, M. Implementation of 5S management method for lean healthcare at a health center in Senegal: A qualitative study of staff perception. Glob. Health Action 2015, 8, 27256. [Google Scholar] [CrossRef] [PubMed]
- Proudlove, N.; Moxham, C.; Boaden, R. Lessons for lean in healthcare from using six sigma in the NHS. Public Money Manag. 2008, 28, 27–34. [Google Scholar]
- D’Andreamatteo, A.; Ianni, L.; Lega, F.; Sargiacomo, M. Lean in healthcare: A comprehensive review. Health Policy 2015, 119, 1197–1209. [Google Scholar] [CrossRef] [PubMed]
- Barosz, P.; Gołda, G.; Kampa, A. Efficiency Analysis of Manufacturing Line with Industrial Robots and Human Operators. Appl. Sci. 2020, 10, 2862. [Google Scholar] [CrossRef]
- Florescu, A.; Barabas, S.A. Modeling and Simulation of a Flexible Manufacturing System—A Basic Component of Industry 4.0. Appl. Sci. 2020, 10, 8300. [Google Scholar] [CrossRef]
- McGinnis, L.F.; Rose, O. History and perspective of simulation in manufacturing. In Proceedings of the Simulation Conference (WSC), 2017 Winter, Las Vegas, NV, USA, 3–6 December 2017; IEEE: Piscataway, NJ, USA, 2017; pp. 385–397. [Google Scholar]
- Dengiz, B.; Belgin, O. Simulation optimization of a multi-stage multi-product paint shop line with Response Surface Methodology. Simulation 2014, 90, 265–274. [Google Scholar] [CrossRef]
- Thorwarth, M.; Arisha, A. Application of Discrete-Event Simulation in Health Care: A Review; Technological University Dublin: Dublin, Ireland, 2009. [Google Scholar]
- Robinson, S.; Radnor, Z.J.; Burgess, N.; Worthington, C. SimLean: Utilising simulation in the implementation of lean in healthcare. Eur. J. Oper. Res. 2012, 219, 188–197. [Google Scholar] [CrossRef]
- Doğan, N.Ö.; Unutulmaz, O. Lean production in healthcare: A simulation-based value stream mapping in the physical therapy and rehabilitation department of a public hospital. Total Qual. Manag. Bus. Excell. 2016, 27, 64–80. [Google Scholar] [CrossRef]
- Rocha, F.; Queiroz, J.; Montevechi, J.; Gomes, J. Aplicação de Value Stream Mapping e Simulação a Eventos Discretos Para Melhoria de Processo de um Hospital. Anais do XLVI Simpósio Brasileiro de Pesquisa Operacional, Salvador. 2014. Available online: http://www.din.uem.br/sbpo/sbpo2014/pdf/arq0141.pdf (accessed on 15 January 2021).
- Holden, R.J. Lean thinking in emergency departments: A critical review. Ann. Emerg. Med. 2011, 57, 265–278. [Google Scholar] [CrossRef]
- Murshudov, G.N.; Vagin, A.A.; Dodson, E.J. Refinement of macromolecular structures by the maximum-likelihood method. Acta Crystallogr. Sect. D Biol. Crystallogr. 1997, 53, 240–255. [Google Scholar] [CrossRef] [PubMed]
- King, D.L.; Ben-Tovim, D.I.; Bassham, J. Redesigning emergency department patient flows: Application of lean thinking to health care. Emerg. Med. Australas. 2006, 18, 391–397. [Google Scholar] [CrossRef] [PubMed]
- Hu, H. Poisson distribution and application. In A Course in Department of Physics and Astronomy; University of Tennessee at Knoxville: Knoxville, TN, USA, 2008. [Google Scholar]
Publisher’s Note: MDPI stays neutral with regard to jurisdictional claims in published maps and institutional affiliations. |
© 2021 by the authors. Licensee MDPI, Basel, Switzerland. This article is an open access article distributed under the terms and conditions of the Creative Commons Attribution (CC BY) license (http://creativecommons.org/licenses/by/4.0/).