Article

The Rotating Liner Engine (RLE) Diesel Prototype: Reducing Internal Engine Friction by about 40% under Idle Conditions

1
RSET Inc., University of Texas at Austin, Austin, TX 78712, USA
2
University of Texas at Austin, Austin, TX 78712, USA
*
Authors to whom correspondence should be addressed.
Appl. Sci. 2021, 11(2), 779; https://doi.org/10.3390/app11020779
Submission received: 30 November 2020 / Revised: 7 January 2021 / Accepted: 12 January 2021 / Published: 15 January 2021
(This article belongs to the Special Issue Advanced Engine Technologies and Innovative Vehicle Driving Systems)

Abstract

:
The Rotating Liner Engine (RLE) concept is a design concept for internal combustion engines, where the cylinder liner rotates at a surface speed of 2–4 m/s in order to assist piston ring lubrication. Specifically, we have evidence from prior art and from our own research that the above rotation has the potential to eliminate the metal-to-metal contact/boundary friction that exists close to the piston reversal areas. This frictional source becomes a significant energy loss, especially in the compression/expansion part of the cycle, when the gas pressure that loads the piston rings and skirts is high. This paper describes the Diesel RLE prototype constructed from a Cummins 4BT and the preliminary observations from initial low load testing. The critical technical challenge, namely the rotating liner face seal, appears to be operating with negligible gas leakage and within the hydrodynamic lubrication regime for the loads tested (peak cylinder pressures of the order of 100 bar) and up to about 10 bar BMEP (brake mean effective pressure). Preliminary testing has proven that the metal-to-metal contact in the piston assembly mostly vanished, and a friction reduction at idle conditions of about 40% as extrapolated to a complete engine has taken place. It is expected that as the speed increases, the friction reduction percentage will diminish, but as the load increases, the friction reduction will increase. The fuel economy benefit over the US Heavy-Duty driving cycle will likely be of the order of 10% compared to a standard engine.

1. Introduction

The Rotating Liner Engine (RLE, www.rotatingliner.com) is a unique lubrication concept aimed at Diesel engines, where the cylinder liner rotates to eliminate the boundary friction environment for the piston rings and skirt around the TDC (top dead center) of compression-expansion.
It is well understood from the literature that this specific form of friction loss is responsible for a substantial portion of the mechanical losses in Diesel engines (especially at high loads). In fact, the observed considerable increase in FMEP (friction mean effective pressure) as a function of engine load can be traced mostly to this particular factor and it is also responsible for the principal wear mechanism that limits engine life.

1.1. Methods for Measuring Instantaneous Piston Assembly Friction

Part of the challenge of evaluating the contribution of the piston ring and skirt boundary friction is the fact that it is almost impossible to measure in a practical firing engine. The floating liner method is one of the methods that has shown promise in isolating this term, but unfortunately, the increasing pressures also affect the sealing mechanism of the floating liner while piston side loads also interfere with the axial force balance via deflections and friction. As a result, the measured piston assembly liner force does not necessarily represent the actual friction. Another factor that limits the accuracy of floating liner testing is the fact that the state of wear of the cylinder liners and piston rings is generally in the close to new condition with the honing marks still fresh, and the piston ring profile is still mostly intact as it was optimized by its designers. However, a real heavy-duty engine as it operates in the field will reach a state relatively early in its useful life where the honing marks have disappeared from much of the top piston ring stroke, and the piston rings have worn out and reached their steady-state profile. It would be impractical to run the floating liner for sufficient hours (possibly over 1000) in order to reach this state. Therefore, this method has value in isolating changes in the frictional characteristics with different operating or design parameters. However, these results may not be sufficiently accurate to draw conclusions on the absolute energy contribution of different friction terms.
Another method that has been proposed in the past to isolate the individual components in a firing engine, the P-w method, was demonstrated by Marek et al. in 1991. The primary value of this approach is that it gives the overall instantaneous friction torque of a single cylinder engine without any modifications to the engine itself. One of the downsides of this method is that it only worked for low load cases and for single cylinder engines with a low moment of inertia. While the overall instantaneous torque cannot by itself identify and separate individual components, since we know, when in the cycle, high instantaneous friction torque takes place, we can deduce the likely source. Figure 1 shows a sample of the instantaneous friction torque. The conclusion from this work is that the friction torque is dominated by the high-pressure part of the cycle, where the piston assembly boundary terms are active (note, according to Miura et al. [1], the frictional losses of the crank bearings are almost independent of instantaneous bearing load, and are more or less constant throughout the cycle). This trend remains even when the engine load is zero, but not as pronounced as when the engine produces torque. This was the case, despite the fact that the oil sump temperatures for those tests were fairly low, amplifying the hydrodynamic terms. At increasing loads, the dominating spike increases, increasing the overall FMEP by 20% (despite the rather low brake mean effective pressure (BMEP) that this air-cooled, naturally aspirated Diesel can generate). It can be safely deduced that the piston assembly boundary friction (plus the injector pump, but in these type of engines, the injection pressure was fairly low and, therefore, this contribution was small) is the primary contributor for this 20% increase in total FMEP. It can also be deduced that while this term is important even at idle, at the much higher BMEP that modern heavy-duty Diesel engines operate, this term has a considerable contribution and possibly even dominates the mechanical losses.
An additional method of measuring friction losses in firing Diesels is the measurement of IMEP (indicated mean effective pressure) and BMEP. This is also not an easy measurement since, especially at high loads, the FMEP is the difference between two large numbers, and small errors in IMEP can cause large errors in FMEP. Additionally, modern engines operate under very high pressures, and the resulting deformation of the parts under high loads can move the location of TDC, which is critical to the accuracy of the IMEP measurements. Nevertheless, the empirical model originally proposed by Chen et al. (1965) [3] is extensively used in the industry and is calibrated by using the above IMEP-FMEP method. In the calibrations presented by Dardalis et al. 2012 (given to us by Southwest Research Institute), the piston assembly boundary terms can account for at least 25 kPa of FMEP at idle and 70 kPa at high loads. This seems to be consistent in magnitude with the conclusions that one can draw from the work by Marek et al.
If the RLE concept indeed eliminates the boundary term from the piston assembly, it may shed some additional light onto the contribution of the boundary piston assembly term in a firing diesel engine, since we will be able to compare the baseline and RLE under firing conditions.

1.2. Mechanism for Eliminating the Boundary Piston Assembly Term by Rotating the Liner

The new lubrication mechanism for the RLE is generated by the continuous motion of the cylinder liner relative to the piston plus the non-parallel micro-scratches generated by the relative orbital motion (Figure 2), as described by Dardalis et al. 2012.
An additional mechanism is proposed here. It is generally recognized that the frictional losses in engines are directly correlated to the high temperature and high shear rate of the lubricant. As the hot oil is sheared by the fast sliding and low film thickness surfaces, it undergoes a temporary reduction in operating viscosity, and it is this reduced viscosity that determines the lubrication conditions of the components, both film thickness and friction coefficient. Under high shear rate, the molecules of the lubricant align with the predominant direction of sliding, reducing the actual viscosity. This reduction can be beneficial in areas where pure hydrodynamic lubrication is taking place. However, it can also be detrimental in the areas close to transition from hydrodynamic into mixed. Given that the Stribeck diagram determines a potential increase in the friction coefficient between boundary and hydrodynamic by over two orders of magnitude, it can be deduced that the above factor can be critical in the areas close to TDC when the piston is moving slowly, yet the cylinder pressure is very high.
This mechanism may be considerably different, close to the piston reversal area of a rotating liner engine, as the rotating liner allows a continuous change in shear rate direction of the lubricant on the cylinder walls, and therefore no complete alignment of the lubricant molecules to the predominant shear rate direction. That is, as the piston is ascending, the molecules of the oil on the liner are forced to align in a certain direction offset from the vertical direction as in a conventional engine. However, as the piston is descending, the predominant shear rate is now at an angle to the one already laid on the cylinder wall, forcing an increase in the effective viscosity, which will be of great benefit in the mixed regime area (in the hydrodynamic zone, since the linear piston speed dominates, the increase in viscosity is likely low). This mechanism likely contributes to retaining the hydrodynamic film in the TDC area, both for the RLE, but also for the SVE (Sleeve Valve Engine).
The above theory can be extended and slightly modified for the piston ring lubrication very near or right at TDC when the dominating motion is very close to pure rotation. In addition to the above mechanisms (micro-scratch, shear rate directional changes, squeeze film normal to predominant shear rate), we have another factor. The very high gas pressure is also trying to generate a shear rate (in axial direction) which is also perpendicular to the predominant shear rate (note that in the conventional engine, all these directions are perfectly aligned, ensuring that the oil molecules also remain aligned). Note that this factor is far more important in the barrel face ring as opposed to the face seal because the effective sealing zone is actually very narrow, generating a high pressure gradient (dp/dy) in the area of low film thickness. It can be expected that this “conflict” in shear rate direction will also amplify the viscosity and help minimize or eliminate contact in the areas very close to TDC where liner sliding speed dominates over piston axial motion. This can be important, because if significant contact took place in that area, the instantaneous liner driving torque requirement would increase considerably, and FMEP wear would also increase (both events are proven not to be the case from Dardalis et al. 2005 [4], where liner torque remained very low at peak pressure, and of course, the SVE experience where wear rate near TDC was almost eliminated).
This will also affect RLE face seal lubrication, but in a slightly different way (the reader is encouraged to review the face seal geometry as shown by Dardalis et al. 2012 [5]). The analyses shown by Dardalis et al. (2012) show that squeeze film lubrication plays a considerable role in the primary sealing ring operating film thickness. The squeeze film is generating a shear rate perpendicular to the predominant shear rate due to rotation, which can also be responsible for localized viscosity increase. This phenomenon would also take place in journal bearings close to the edges; however, in journal bearings, much of the predominant squeeze film direction is also parallel to the sliding direction. In this face seal geometry, the two directions are perfectly perpendicular, since there is no variation in film thickness along the perimeter. Therefore, the pressure tolerance of the RLE face seal may prove higher than predicted by Dardalis et al. (2012).

1.3. Lubricant Starvation for Top Ring Lubrication

It has been suggested to the authors that one of the factors that generate boundary lubrication in the top ring TDC reversal is the oil starvation in the top part of the liner. However, the amount of lubricant necessary to achieve the minimization of metallic contact is very small. The authors have reasons to believe that the observed starvation at TDC may be more the result of metallic contact and resulting oil scraping rather than the cause of metallic contact (for example, we know that there is some boundary friction at BDC when there is no starvation issue). Lubricant starvation in the TDC area would in fact generate more friction and wear in engines with rotating liners. Based on the following section, and based on the preliminary testing of this current prototype, this does not seem to be the case.

1.4. Prior Engines with Moving Liners and Prior RLE Results

A detailed description of prior engines with partially rotating cylinders, Sleeve Valve Engines, has been provided by Dardalis et al. (2012). A lengthy review will not be presented here. However, the reader needs to know that the aircraft SVEs operated under BMEPs comparable to heavy-duty diesels, but the cylinder rotation during the high-pressure part of the cycle eliminated the typical wear pattern in the TDC area and also reduced overall FMEP, despite the fact that the sleeve valve added considerably more rotating components than the conventional valve train that it replaced. The reason for this decrease in friction while adding more sources of friction was initially mystifying. Ricardo (1968) eventually determined that the decrease in FMEP was due to the motion of the “sleeve” (liner) near the TDC, which minimized the presence of metal-to-metal contact from the piston assembly components around the TDC of compression–expansion.
The first RLE prototype was a single cylinder conversion of a GM Quad 4 light-duty SI engine [4]. Unlike this current Diesel prototype, that light-duty conversion was designed such that the space of the neighboring cylinders was invaded by the RLE components, condemning the engine into a single cylinder. The face seal, while similar in overall function, had certain design limitations which were corrected for the current heavy-duty design. However, the initial design allowed hot motoring tear down tests, which facilitated the measurement of friction characteristics. The rather large motoring FMEP reduction, along with a tear down test to confirm that the difference was from the piston assembly, is shown in Figure 3.
The authors have received questions about the relatively large amount of FMEP reduction presented in Figure 3, especially in light of tear down tests performed by other researchers that show the overall FMEP contribution of the piston assembly to be lower than the reduction shown in Figure 3. The precision of these tests by Kim et al. (2005) [6] is not likely to be the issue, since these measurements were extremely straight forward and conducted with two independent measuring techniques, while the margin of error is considerably smaller than the FMEP improvement shown. The authors are convinced that the primary source of the misconception is that most of the published tear down tests (particularly on light-duty engines such as the one tested by Kim et al. [6]) are almost always performed in the wrong order. The valve train is disabled before the piston components are removed, and this difference in torque is assigned entirely to the valve train. This is an erroneous conclusion, because when the valve train is disabled, the piston ring gas pressure loading is also eliminated, and therefore, piston assembly boundary friction is mostly eliminated. The result of this is that the observed reduction in friction by removal or disabling of the valve train, while caused by the fact that the piston assembly is no longer loaded by gas pressure, is erroneously assigned to the valve train. Therefore, piston assembly friction appears lower than its true contribution. A good example of this is presented by Stanton (2013). In the Stanton case, removal of the cylinder head generated a reduction in FMEP of the order of 8 psi (55 kPa), while the final removal of the pistons generated a reduction of 2–5 psi (14–34 kPa) in FMEP. (Note, in the Stanton (2013) test, the valve train was entirely removed by removing the cylinder head, but disabling the valve train while the head remains in place has an identical effect.) In the typical published tear down test, this procedure is natural because it is difficult to run the engine removing the piston and connecting rod while the valve train is still active. It would require the use of bob weights, which were present in the work presented by Dardalis et al. [5] and Kim et al. [6]. It needs to be noted that the valve train friction is not affected by the presence of the piston (as long as the oil temperature is maintained at the same level of course), while the piston assembly friction will decrease dramatically in the absence of a working valve train.

1.5. Reduced Lubricant Viscosities for Heavy-Duty Engines

One modern trend of reducing friction in heavy-duty Diesels, especially those that are subjected to fuel efficiency standards, is the reduction in lubricant viscosity. This approach is well captured in the results by Marek et al. (1991) [2]. Their results clearly show that reduced lubricant viscosity reduces the friction in the intake and exhaust strokes, but has no effect in the late compression/early expansion, even though the higher viscosity may offer some relief in the metal-to-metal contact intensity for some areas for some portion of the cycle (and therefore, reduced wear compared to the lower viscosity). This is consistent with many recent publications on heavy-duty lubricant formulations with low viscosity lubricants, where measurable improvement is shown for low load operating conditions, but only modest or negligible improvement at high loads. The reason cited is sometimes the misconception about the presence or the significance of the mixed lubrication in the high-pressure part of the cycle, but the real reason seems to be the fact that the lubricant viscosity plays a limited role in the actual fMEP during the loaded part of the cycle because the lubrication regime is deep into the boundary area where the friction coefficient is flat in the Stribeck diagram. However, viscosity always seems to play a leading role during the exhaust and intake strokes.

1.6. Lubricant Formulation in RLE Commercial Units

In addition to generating experimental proof of the potential contribution of the boundary and mixed lubrication in diesel engines, the authors also expect that, given the very high predicted reduction in FMEP compared to conventional methods, and given the relatively moderate increase in engine cost, the RLE will find its way in Heavy-Duty commercial engines. If that is to take place, the question that arises is what type of lubricant will be ideal for the RLE? Would the standard 15w40 lubricant be ideal, or should RLE units follow the trend of reduced viscosity?
For the testing of the first light-duty RLE prototype (Kim et al. 2005) [6], the standard 5w30 low-viscosity light-duty lubricant was used. The reason for choosing the above grade was that it was expected that the low viscosity would amplify the boundary terms for the low-speed un-throttled motoring conditions. Additionally, since the peak pressures for motoring were relatively low (just under 20 bar), the low viscosity oil would not provide any challenges for lubricating the RLE face seal.
During the initial testing of the RLE diesel prototype, the 15w40 grade has been consistently used. Dardalis et al. (2012) [5] presented calculations that showed that if a high-temperature, high-shear rate lubricant of about 0.0035 Pa*s is used (lower than the one exhibited by 15w40 and about identical to the modern low-viscosity oils currently proposed for Heavy-Duty use), then the seal film thickness will be adequate to avoid contact. Even though the low load cases that we have been running so far in the prototype would not exceed the limit of the seal calculated by Dardalis (2012) even with a 5w30 oil, and even though we expect that these calculations were conservative for the above reasons and computational complications discussed by Dardalis et al. (2012), the security that the high-viscosity oil provides is considered critical for the prototype’s preservation. Of course, once more data are accumulated, and the prototype is no longer as precious to us as it is now, lower viscosity can be tried as well so that more can be learned about RLE operation under reduced viscosity.
When the conversion is redesigned for larger engines, the bearing surfaces of the RLE face seal can be redesigned larger to accommodate for the lower viscosity with a higher confidence level. However, it is not clear yet if the lower viscosity may require higher liner speeds to achieve the same results in minimizing the boundary terms of the piston rings, especially when operating under the high pressures of the future engines. If that proves to be the case, the 15w40 grade may prove more desirable. Furthermore, most of the benefits of the low-viscosity oil can be gained by the 15w40 grade, if one simply increases the clearance in the crankshaft bearings and piston skirts. This would allow exploitation of the high viscosity for the top-end cylinder and RLE seal lubrication, while the rest of the hydrodynamic terms can still benefit from the reduced shear rate. It needs to be noted that in any hydrodynamic bearing design, the compromise between reduced viscous losses and reduced maximum load capacity work in an identical manner regardless whether the designer reduces the viscosity or increases clearance.
Due to the recent regulations in fuel economy for Heavy-Duty truck engines in North America, a new trend of reduced lubricant viscosities has emerged. As discussed above, and supported by Marek et al., the reduced viscosity will reduce the friction in the intake and exhaust stroke, while having almost no effect in the high-pressure part of the cycle, which seems to dominate the mechanical losses. Therefore, as expected, the benefit is marginal in terms of fuel economy, while introducing a risk of potential increased wear. In order to control the wear impact on the piston rings and cylinder liner, more aggressive and expensive additive packages have been developed. Regardless of what grade viscosity will be used in the RLE when it reaches production, given that the metallic intensity will be greatly minimized (which may also be accompanied by a significant reduction in piston ring temperature), many of these additives can be reduced or eliminated. This could not only reduce the cost of the lubricant, but also increase the life of the catalysts, which are known to degrade faster in the presence of large amounts of lubricant additives.

2. The Heavy-Duty RLE Prototype

2.1. Selected Pictures from the Diesel RLE Prototype

This section presents pictures of the prototype. The actual CAD of the prototype was presented by Dardalis et al. 2012 [5]. Relatively minor design changes have been made, and many of these will be pointed out in this section. Both baseline and RLE started life as a four-cylinder Cummins 4BT 3.9 model year prior to 1998 (two valves per cylinder, mechanical fuel injection). Both are converted to single-cylinder operation.
The overall layout of the RLE prototype can be seen in Figure 4. Cylinder #2 is the only active cylinder, and all other three crank throws are covered by bob weights that block oil leakage and also rebalance the crankshaft. The brass driving gear on the position of cylinder #1 engages the crankshaft via an external bevel 90-degree gearbox and belt with a total gear reduction of about 2.7:1 (later, when detailed testing was performed, the ratio was reduced to 3:1). This driving gear is identical in diameter and number of teeth to the rotating liner flange gear; therefore, it could be replaced by an actual rotating liner if the engine was to be a complete four-cylinder (proposed driving mechanism is shown by Dardalis et al. 2012). However, now two bearing holders are secured on the untouched original engine bore, and these bearings support the vertical shaft that is shown in Figure 4. The shaft goes through the cylinder head and engages the bevel gearbox discussed above.
Figure 5 shows the details of the face seal features on the rotating liner flange. These are exactly as described by Dardalis et al. 2012. The face has been flattened by lapping to the tolerance level of typical face seals, which is of the order of 1 micron flatness or less, and was also polished. There are nine oil supply holes across the flange which feed oil to the annular groove. The annular area inside the annular groove is called the “sealing zone” (see Dardalis 2012) [5] and acts as a sealing dam and squeeze film bearing. The etched step pads are visible, and these constitute the primary hydrodynamic features. The primary sealing ring can also be seen, held by a human hand. The primary sealing ring is actually flat (the radial marks seen are from the oil, which is deposited in an uneven manner, replicating the pattern from the rotating liner features that it was in contact with). The head gasket is a 2.25 mm (0.090 inch)-thick copper unit (identical gasket used in the baseline). In the case of the RLE, the head gasket only seals coolant and oil, so the head bolts need not be torqued down to the full 90 ft-lbs required by the Cummins shop manual.
Figure 6 shows the block with the cylinder head removed, the rotating liner pulled out to expose the polished outside surface. The brass thrust washer on the head block is visible. This thrust washer is loaded by the spring load acting on the primary sealing ring. However, as discussed by Dardalis et al. (2012) [5], when the engine is started and oil pressure is restored, the oil pressure will take the load and this thrust washer will no longer be active. The bearing holder for the driving gear shaft but without the ball bearing used is also visible on the bottom left of the picture (the driving gear has been removed).
Figure 7 shows the cylinder head with the head insert and primary sealing ring springs (component terminology follows Dardalis et al. 2012). This part is built out of mild steel and houses the secondary seal and springs, as described by Dardalis et al. 2012 [5]. The only deviation from the Dardalis et al. (2012) description is that conventional coil springs are used in place of a conical washer spring due to cost considerations.
We are also using two flywheels instead of one in order to minimize the crank speed variations typical in single-cylinder engines and to make engine starting easier.

2.2. Fuel Injection System

The injection system in use is the old mechanical type, mainly due to our very low budget. The same injection pump and injector are used for both engines. Partly due to the conversion of the injection pump operating only one cylinder, and partly because single cylinder engines are difficult to start, the injection timing is set fairly advanced. Additionally, the cracking pressure of the injector used is set about 30% below the original manufacturer settings. This applies to both baseline and RLE. This generates very high peak cylinder pressures during idle conditions. When the engines are cold, peak pressures are of the order of 67–70 bar. While this is probably very inefficient from the thermodynamic standpoint, this would be irrelevant to this investigation as long as both engines operate with the same injection timing. One added benefit of this factor is that we have the opportunity to test the RLE seal at pressure conditions more severe than the load conditions currently used. A second benefit is that the fueling rate may have a much larger impact on peak cylinder pressure because much of the fuel is consumed near the TDC at the low loads that we are currently working with, and since peak cylinder pressure is far easier to measure than fueling rate, some preliminary assessment of the fueling rate between the two engines may be readily derived. This has been expanded upon more in the next section. However, there is an overwhelming downside to the old technology injection system. That is, we have very limited control over the combustion and as a result, we have to follow a “hit and miss” approach in generating comparable conditions, as again illustrated on following sections.

2.3. Face Seal Design Challenge: Experimental Confirmation

As discussed by Dardalis et al. (2012) [5], the RLE seal needs to have negligible gas leakage, negligible wear, and very low added friction. Dardalis et al. (2012) described in detail the design and the philosophy behind the RLE face seal. A relatively low closing force compared to the bearing area is used so that very high cylinder pressures can be contained without metal-to-metal contact. Significant oil flow is established throughout the primary sealing ring, in order to keep it cool and also in order to ensure that sufficient oil is present to block the gas flow between the gap (film thickness ranges from up to 5 microns in the unloaded part of the cycle to under 1 micron under full load peak pressure). The abundance of lubricant also allows for a very low surface roughness to be used, which allows a much lower minimum film thickness prior to metal-to-metal contact compared to the piston rings that ride on a relatively high surface roughness. However, the fairly high spring pre-load and very tight flatness tolerance also ensure that oil leakage into the combustion chamber is negligible. As described by Dardalis et al. (2012) [5], negligible means that in the worst case scenario, it would be a tiny fraction of the lubricant deposited on the liner by the piston rings during each stroke. However, based on the calculation assumptions presented by Dardalis (2012), there may be almost zero net flow, given that the gas pressure will push much of this oil back from the sealing zone.
Based on the preliminary testing, it appears that these requirements have been met. The RLE and BSL (Baseline) seem to have an approximately identical starting performance. There is no indication of blowby from the RLE from exhaust port #1, which is directly open to the atmosphere and isolated from the remaining crank case. However, the best indication of zero blowby from the RLE face seal is the trace of carbon. Given the poor fuel atomization of our fuel injection system, a significant amount of carbon is deposited on all surfaces that are in contact with combustion products within a few minutes of engine operation. However, the surfaces of the rotating liner flange very close to the sealing gap, and head inserts are completely clean from any traces of combustion products. Therefore, no gas flow of any significance has been established while the engine was operating, which is to be expected, given that the RLE face seal has no end-gap. Furthermore, even though we have not measured the liner driving torque for this prototype, it appears to be fairly low, based on the fact that the drive belt (Figure 8) is not tight, and yet there is no observed belt slippage (note, this indicates that the pinned piston rings also likely ride hydrodynamically). The relatively soft copper alloy primary sealing ring does not show any signs of wear. This is of course premature, given that the peak pressure so far has not exceeded approximately 100 bar. However, the engine has now operated for about 50 h, has been subjected to about 10 bar BMEP, and we have still seen no malfunction or wear of the sealing system.

3. Testing the RLE and BSL Single Cylinder Engines under Idle Conditions

In this section, we will describe the testing of the Baseline Engine (identical to the RLE but with a conventional cylinder) and the RLE prototype described above. By comparing the combustion characteristics, we are quantifying the friction reduction experimentally under low-speed and peak cylinder pressure (PCP) conditions. This section is rather long for the two following reasons. We cannot accurately obtain the iMEP of the two engines and we cannot control the mechanical fuel injection well. A measurement of iMEP for the two engines would have been a very direct way of comparing the idle fMEP, but unfortunately, this is not feasible. An electronically controlled fuel injection would have allowed us to easily compare cases. Instead, a relatively complicated methodology that generates an even comparison of operating conditions between the BSL and RLE is presented, which accomplishes the same, but unfortunately is lengthy.
Given the fact that both engines are powered by an approximately 1 L single cylinder which drives a 5-bearing crankshaft and accessories sized for a 5.9 L 6-cylinder engine (water pump and oil pump are identical to the 6BT), and given that we have focused on 750 rpm, the operating conditions presented here represent a loaded idle (i.e., engine is driving an AC compressor or other accessories) rather than a totally unloaded idle condition of a full engine. The reason why we chose 750 rpm is because the minimum idle of the two engines is on the order of 630 to 680 rpm, and is not entirely consistent. Therefore, we are focusing on an idle condition where the fueling lever of the injection pump needs to be slightly advanced instead of resting at its minimum stop. These old-style injection pumps operate like speed regulators in the idle range. Additionally, we have focused on 70 °C because the original BSL data are at that oil/coolant temperature, and we have not yet obtained high resolution pressure data for the BSL at a higher temperature. Additionally, all the data are with the 15w40 grade lubricant.

3.1. Preliminary Testing from Prior Publication

The fuel economy at idle of the prototype was compared to a baseline engine, also single-cylinder, where all the characteristics were almost identical to the RLE except for the liner rotation (Dardalis 2019). The condition focused on at that time was 750 rpm idle and 71 °C coolant and oil temperature. For that condition, the RLE was estimated to have slightly under 20% lower fuel consumption. This estimation was achieved via comparing the pressure rise between the peak motoring pressure (PMP) and peak cylinder pressure during firing pressure (PCP), which is essentially proportional to the total heat release per cycle, as long as the combustion phasing is similar. The assumption here is that the indicated thermal efficiency of the two engines is identical, which is reasonable since the engines are almost completely identical with similar compression ratio. The validity of this comparison was also made possible by the fact that injection timing was substantially advanced and peak firing pressure was around the TDC, which meant that the majority of the heat release was complete by TDC. This is not an efficient way to run an engine, but we are not attempting to achieve a record in thermal efficiency; instead, we are estimating the percentage of friction reduction of the RLE concept by comparing the amount of heat release needed to sustain the idle in the BSL and RLE. The difference between PCP and PMP was adjusted by the ratio of clearance volumes between the two engines (which unfortunately were not exactly the same, but also varied, as shown in the sections below) in order to comply with the ideal gas equation, and the corrected value is what is used for the final comparison (the correction factor is relatively small). This yielded about a 19% reduction in fuel consumption at idle for the RLE (Dardalis 2019). However, these tests were very preliminary and had the following limitations.
  • Difficulty in obtaining the proper TDC location.
  • Difficulty in obtaining the accurate IMEP.
  • Uncertainty in injection timing.
  • Baseline had a slightly higher compression ratio.
  • The Rotating Liner gearbox was an inefficient unit with grease bushings rather than roller element bearings, which increased gearbox parasitic losses.
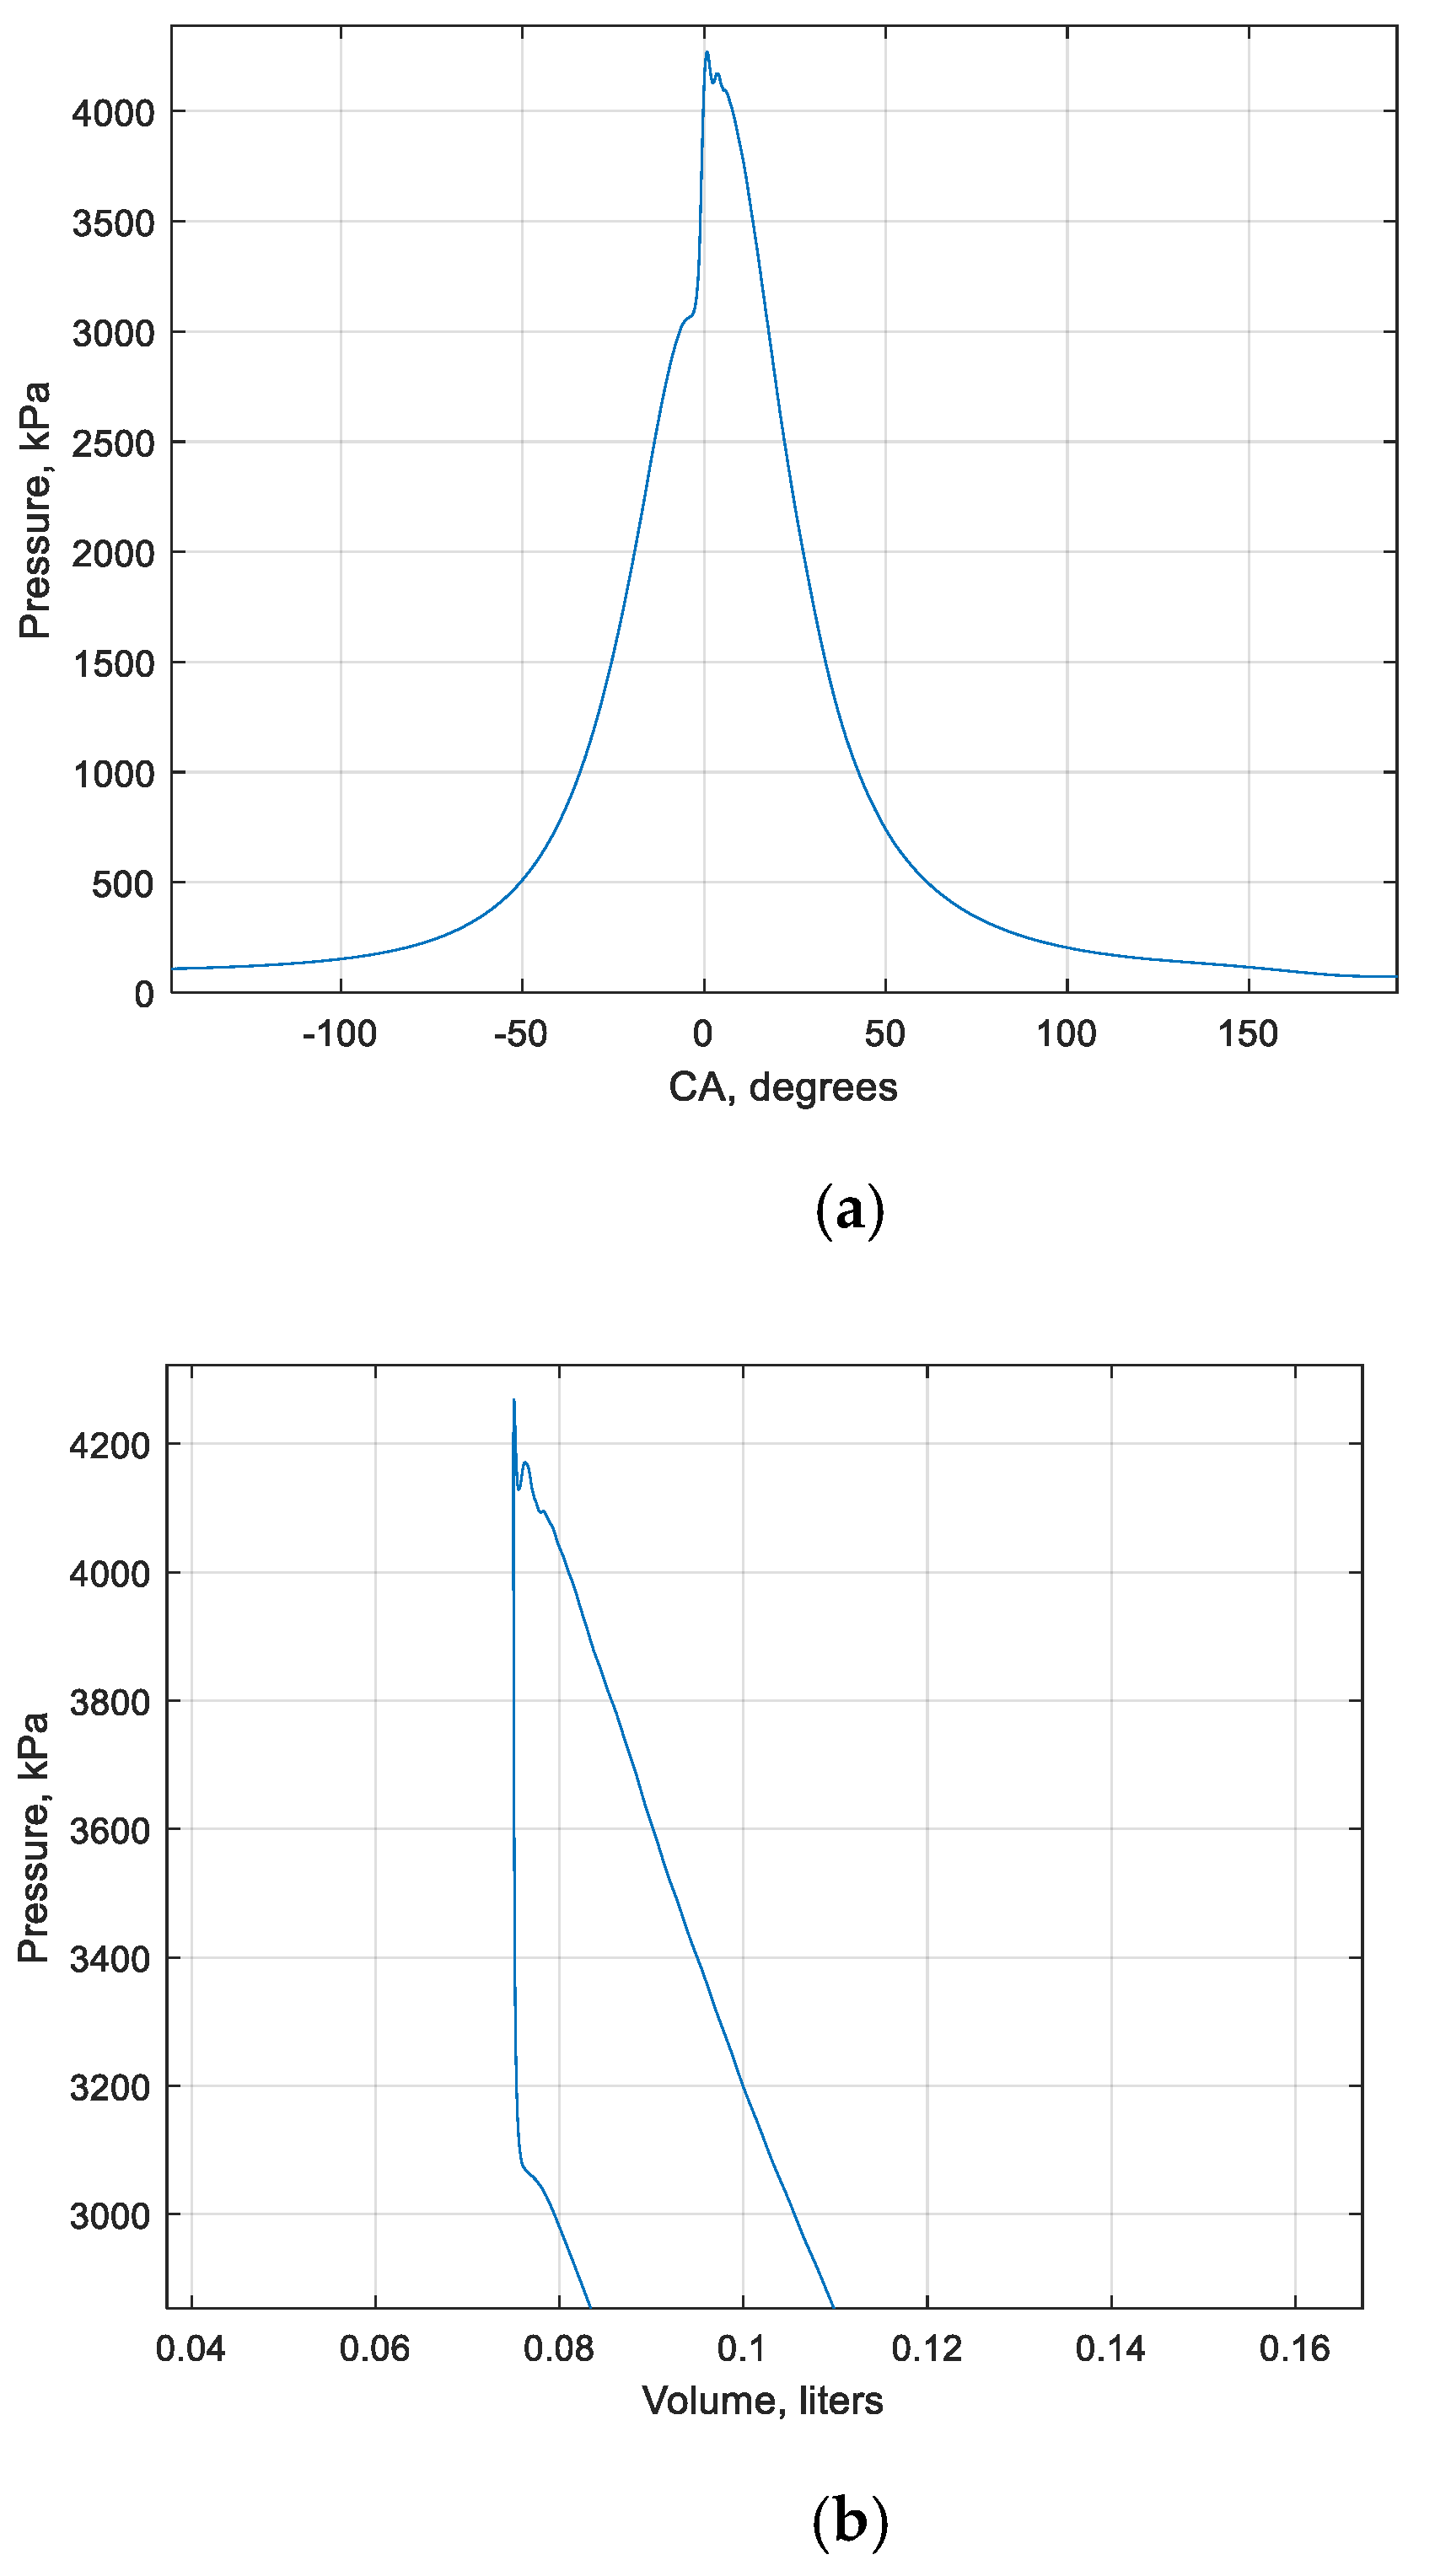
Figure 9 shows the pressure vs. crank angle graphs from the two prototypes from the prior publication. In this graph, the CA axis is slightly shifted in order to align the premixed combustion events, which seem to be fairly close anyway. However, it is fairly evident that both cases have a substantially over-advanced timing and that most of the heat release has been completed by the TDC. In both cases, the peak pressure was within one degree from the TDC. In the analyses presented in this paper, not only did we confirm that, but we also showed that the BSL was slightly more retarded, and a fraction of its heat release had taken place after the TDC, changing the numbers somewhat.
Firstly, we reduced the compression ratio of the BSL to the point where the motoring pressure was slightly lower than the motoring pressure on the RLE. Even though we have not perfectly matched the two compression ratios, we were at least able to bracket the RLE compression ratio with the two BSL cases. In the work presented in this paper, we were able to locate the TDC with better precision in both engines. However, we were still not able to obtain repeatable IMEP measurements. We identified the root of this problem to be the crankshaft torsional vibrations that take place due to the conversion from a four-cylinder configuration into a single-cylinder engine. The reasonably precise location of the TDC, however, allowed us to better define the location of the premixed combustion with respect to the TDC (which is the effective injection timing). The potential error caused by the torsional vibration is negligible compared to the potential error in the iMEP calculation. This allowed us to better refine our relative gross heat release rate (PCP minus PMP). Additionally, we were able to calculate the adiabatic instantaneous heat release rate, which is also relatively insensitive to the exact TDC location, especially if the majority of the heat input takes place during the premixed combustion phase (due to the low-pressure fuel system modified for single-cylinder operation), and if that event is substantially before the TDC where the combustion chamber volume is relatively large. We were also able to obtain some limited exhaust CO2 concentrations of the two engines.

3.2. Locating TDC and IMEP Measurements

The location of the top dead center is critical to the calculation of IMEP. In the prior BSL data, we had attempted to find TDC by motoring the engine and observing the peak pressure location. However, even that crude method had failed to produce good results because the peak pressure location varied over a range of 0.4 degrees (we used a shaft encoder with a resolution of 20 points per degree). In the RLE unit, we used a proximity sensor, replacing the injector, and cranked the engine while collecting encoder and proximity sensor output. The experiment was repeated for various cranking speeds (as the powering batteries were becoming depleted), and the minimum proximity sensor output was repeatable at a specific offset from the Z-pulse of our encoder.
While the above method worked well, we still had serious torsional vibration problems (aggravated by the liner mechanism for the RLE, Figure 10) that prevented us from generating reliable iMEP data. Therefore, we had to find alternative ways to analyze the combustion characteristics.
We present a number of BSL cases later in the paper. Only one of them has high resolution cylinder pressure data (using the same encoder as the BSL). The rest of the cases, taken more recently, do not use the encoder because we do not want to upset our TDC alignment on the RLE prior to taking high load data in the future. The high-resolution pressure data for the BSL are for the high compression ratio case that was presented by Dardalis et al. (2019) [7]. These data can be seen as the black line in Figure 11, where the top end of the P-V diagram is shown.

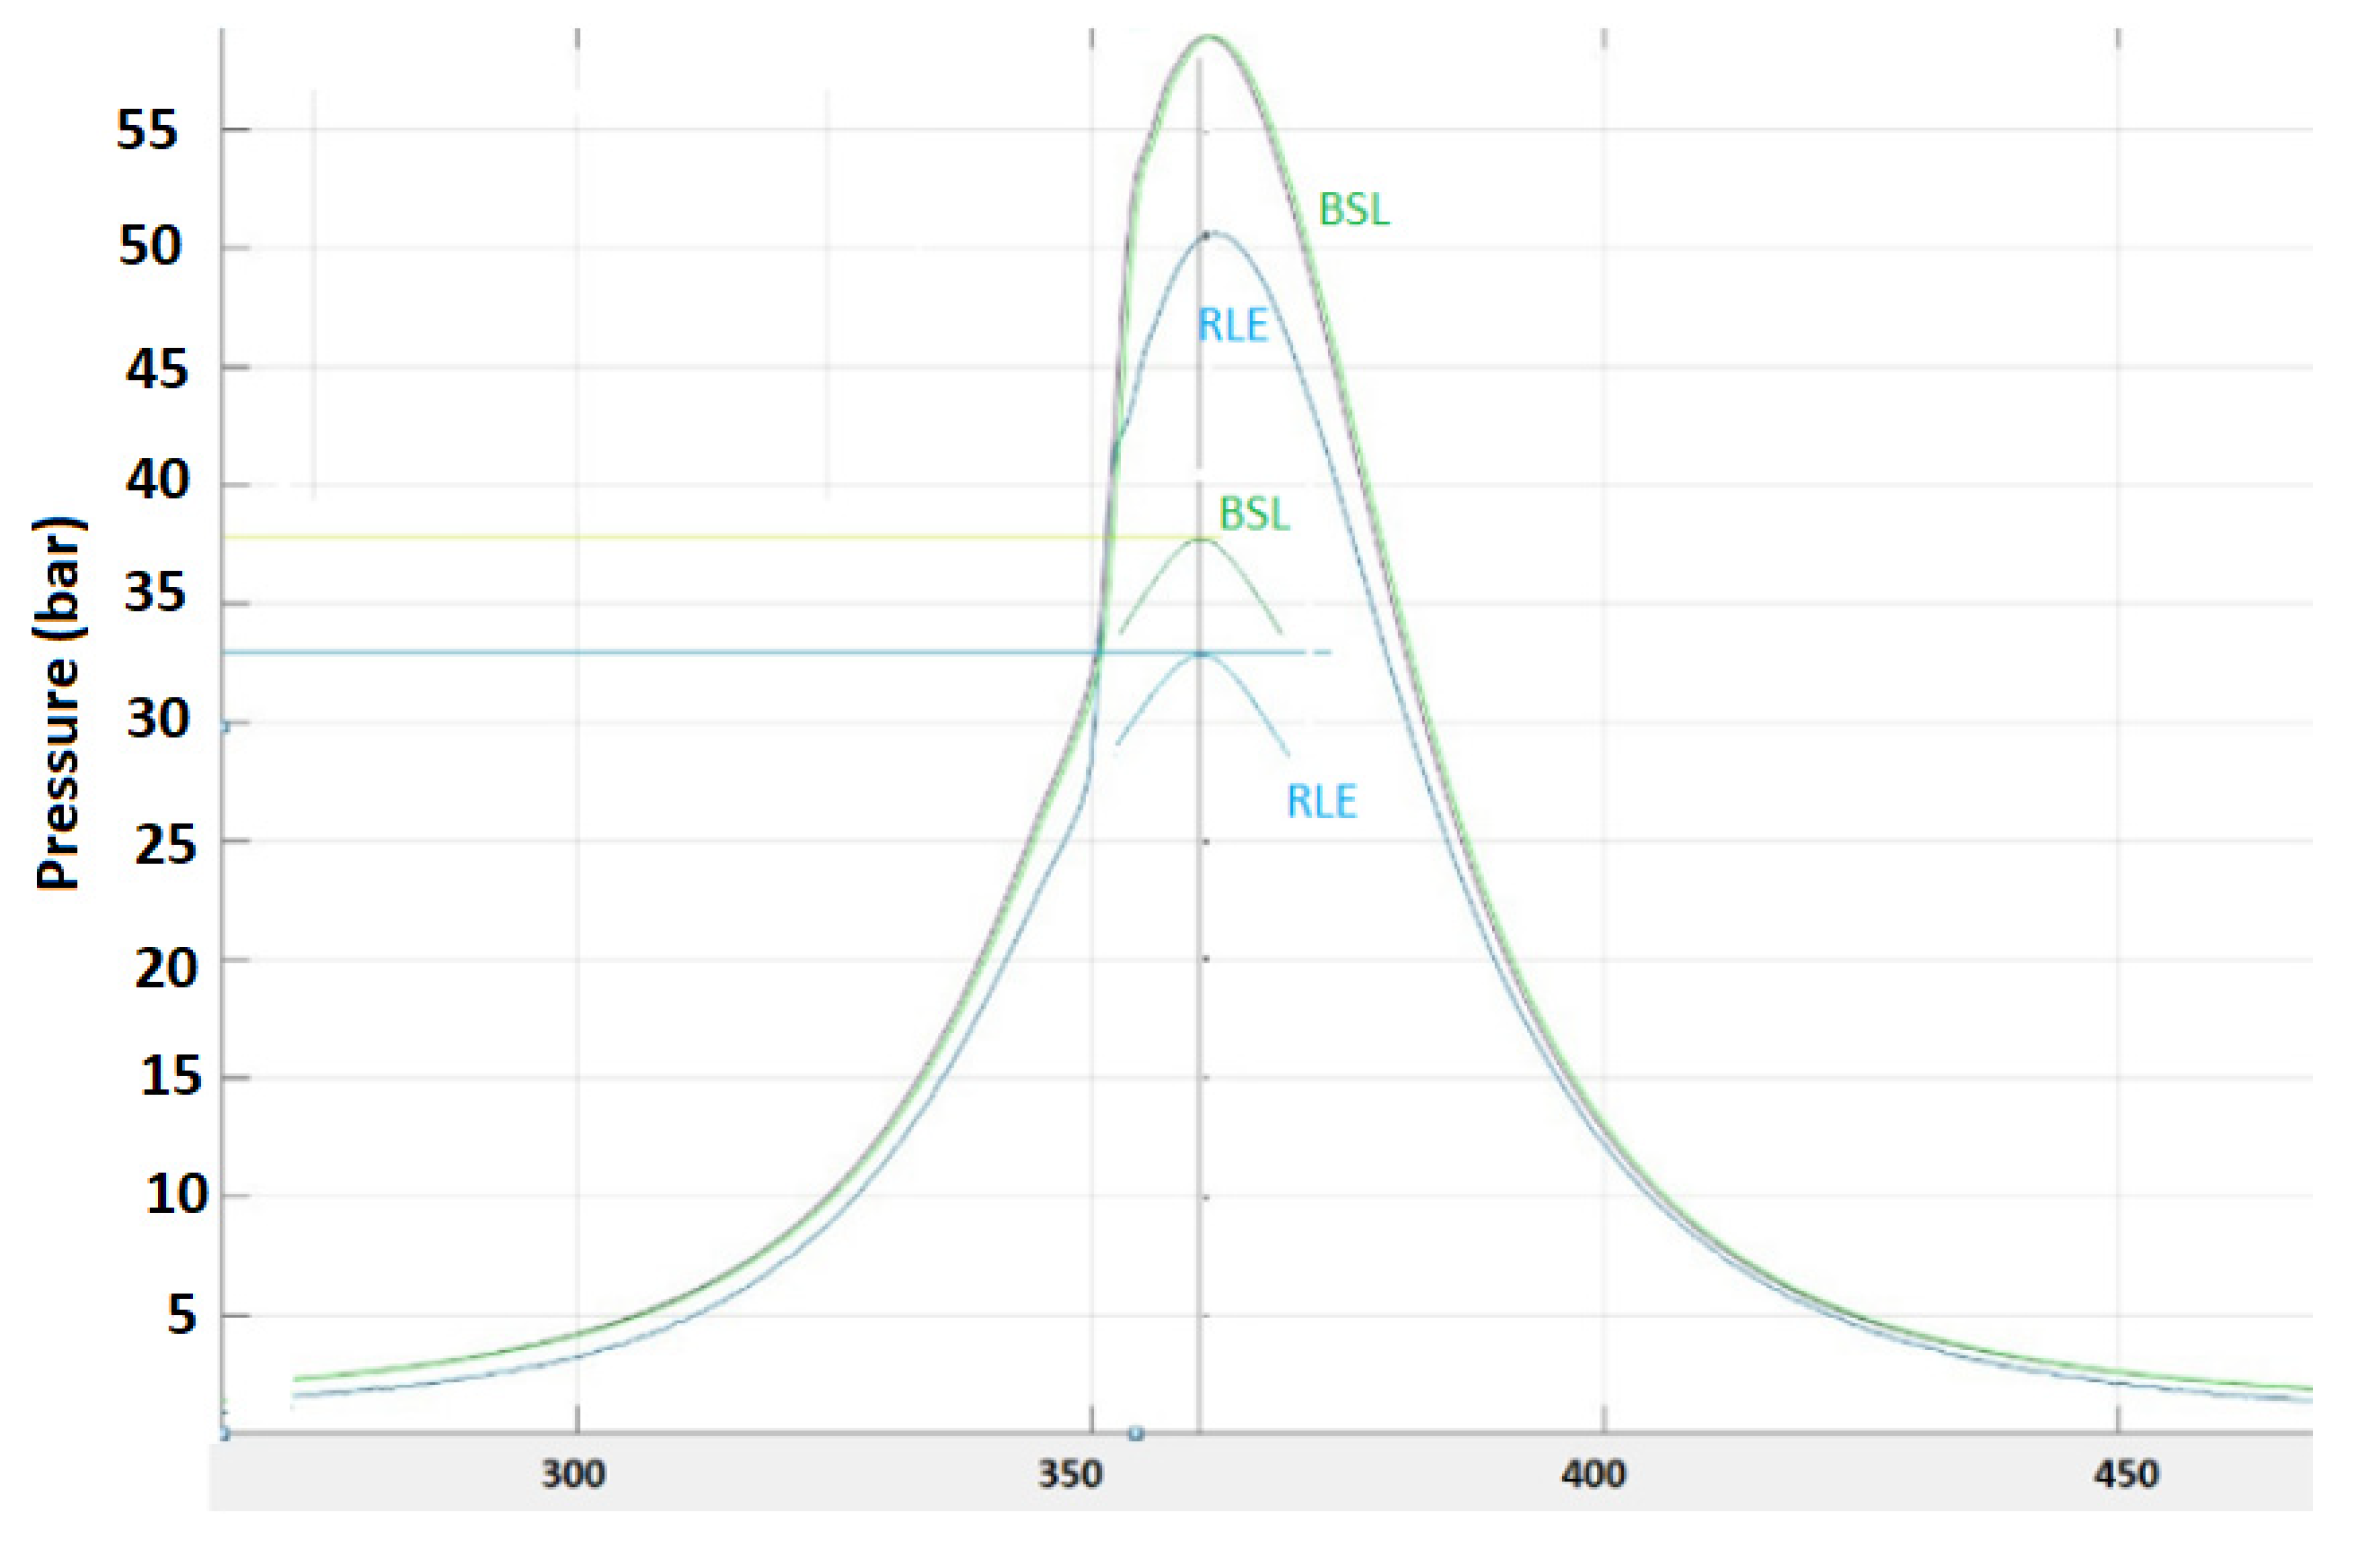
3.3. Comparison of High Compression Ratio BSL with the RLE

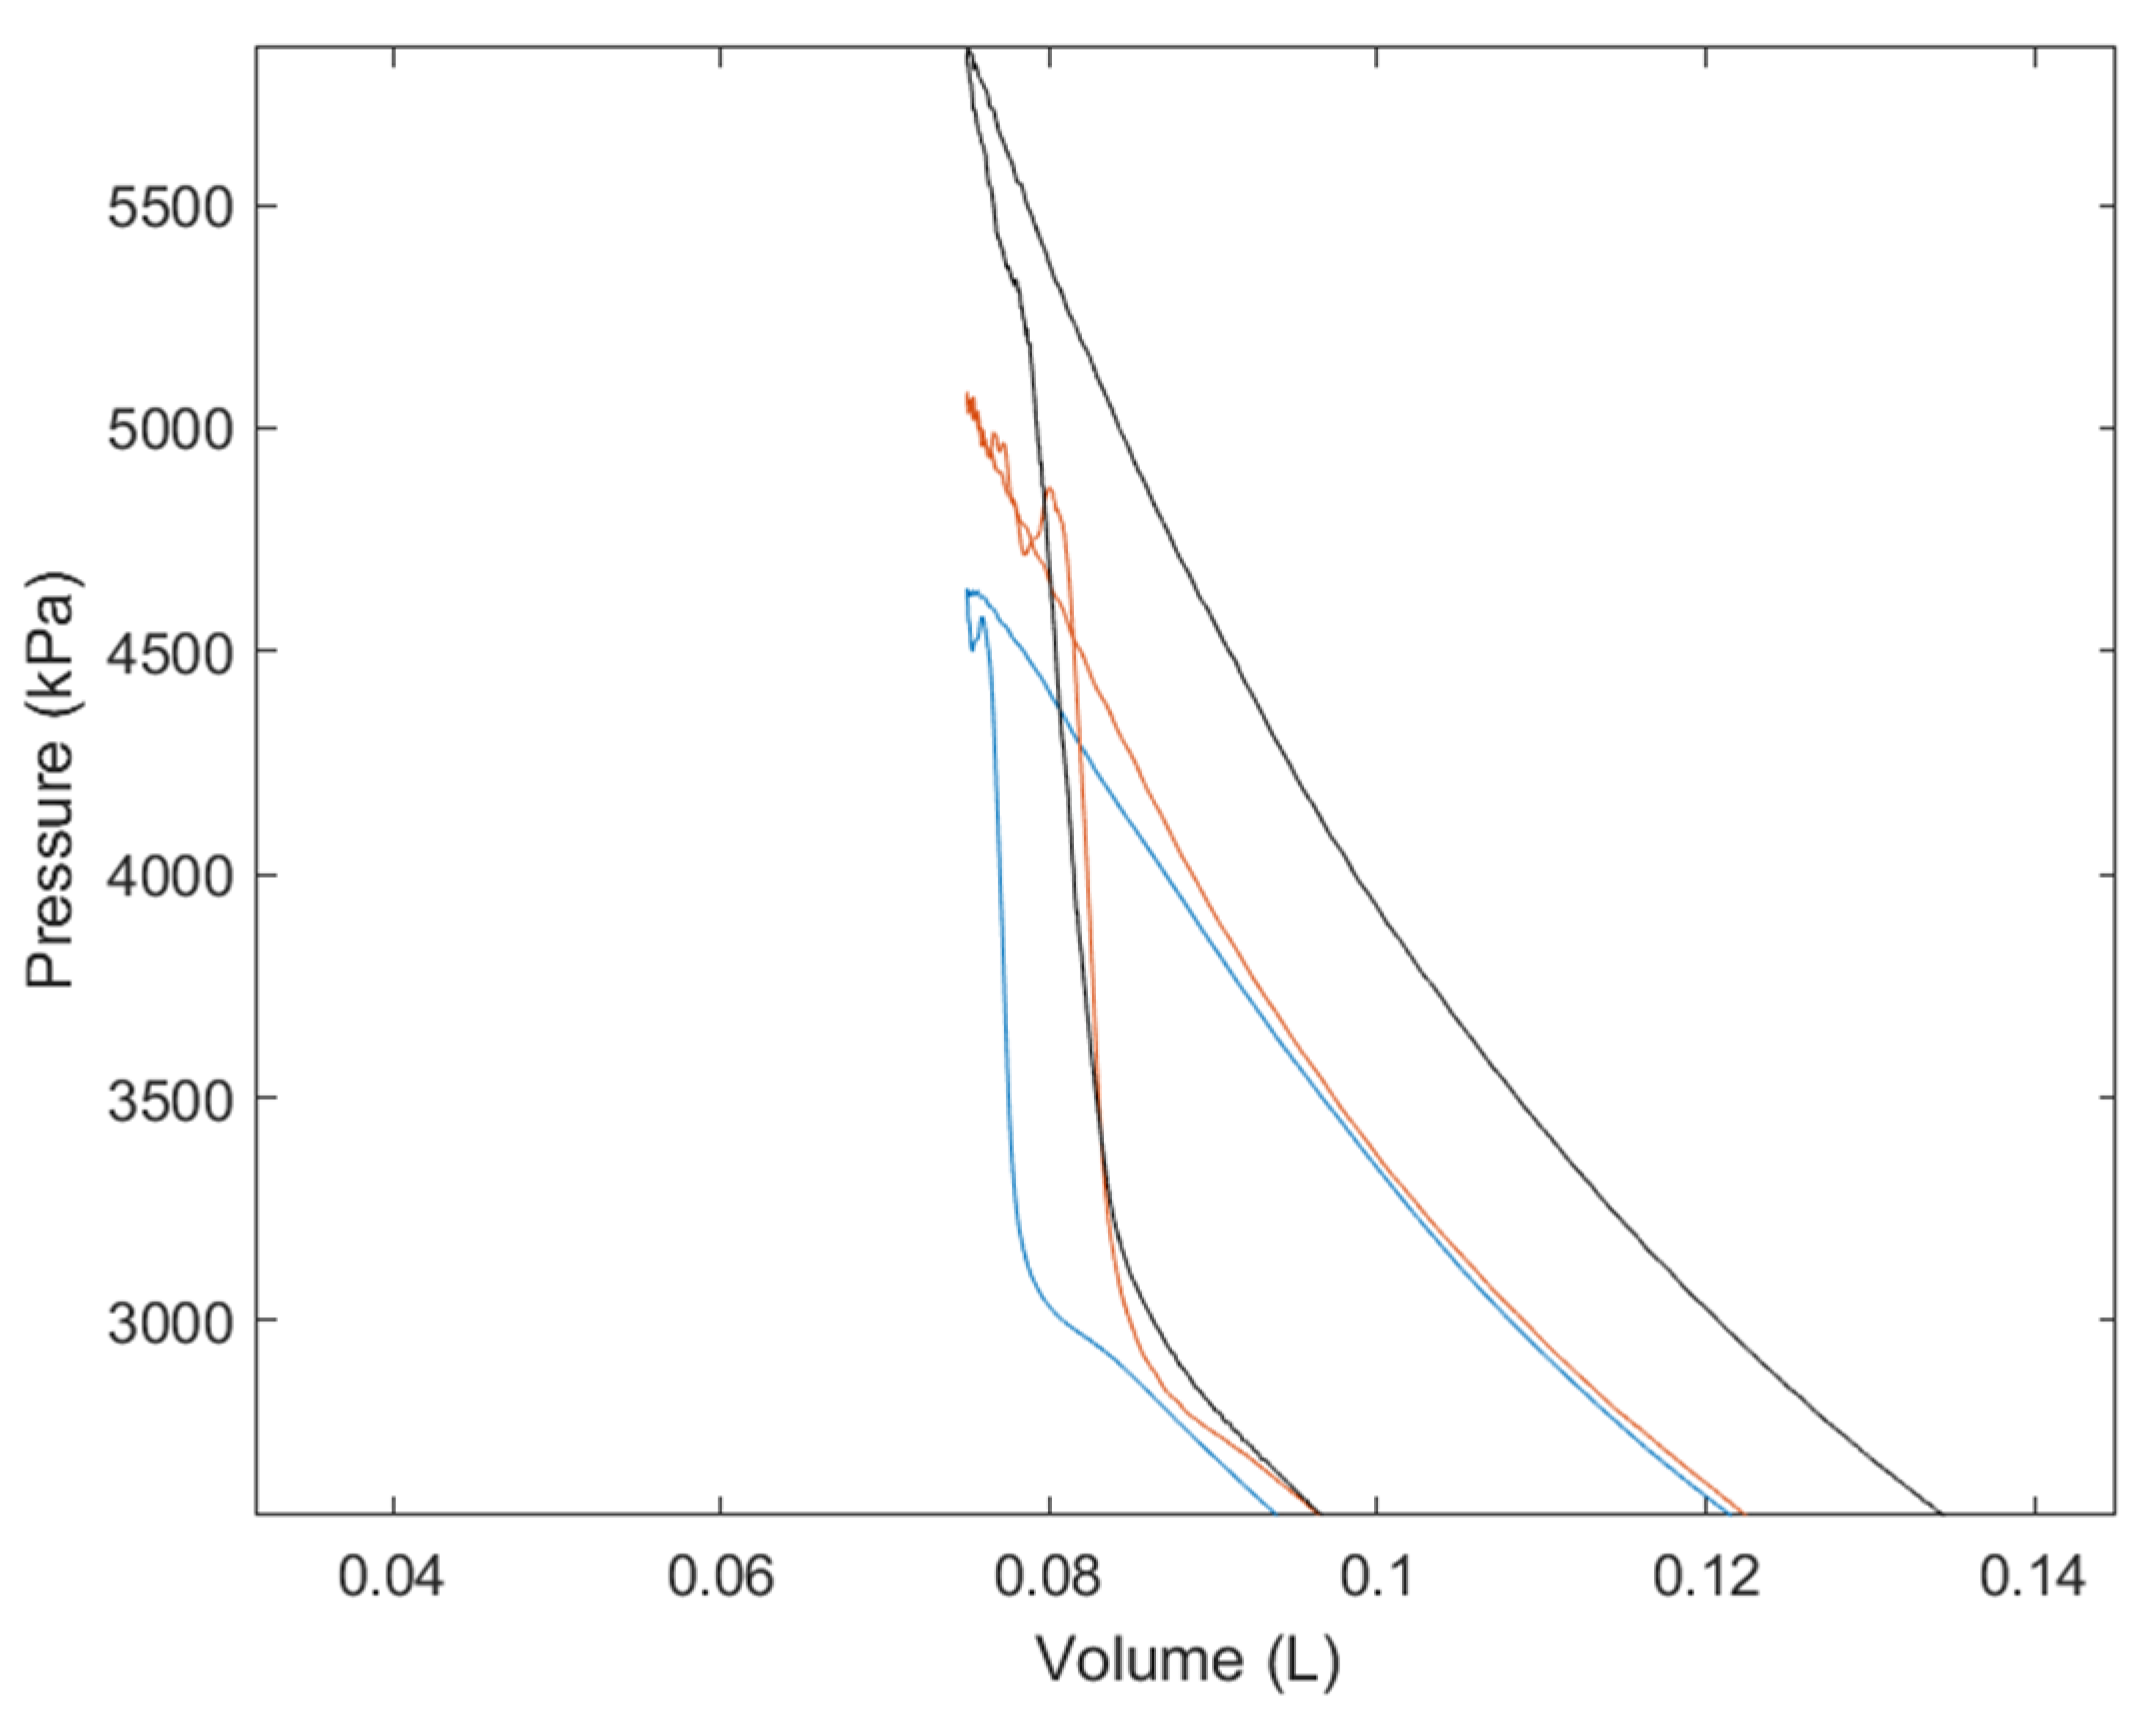
In this subsection, we show some P-V diagrams that help us analyze the combustion characteristics of the various cases that we are presenting. If the pressure rise due to combustion has the slope shown by the black and red curves of Figure 11, it means that the volume was still decreasing when combustion occurred; therefore, the combustion took place before TDC. In the case of the blue curve, the pressure rise is almost vertical, meaning that there was no appreciable volume change during combustion, so the premixed combustion took place at the TDC. If the slope was reversed, then the pressure rise would have been taking place while the volume was increasing, and it would have taken place after TDC (this is the typical way diesel engines are set up to run). Additionally, a portion of the top of the compression and expansion curves, as in the red graph of Figure 11, overlaps. This means that the combustion had ended before the minimum volume was reached, so the pressure followed the corresponding adiabatic curve from the end of combustion, to the minimum volume, and back over the early expansion. In the black curve of Figure 11, some degree of combustion continued until the minimum volume or slightly after; the expansion followed a slightly higher adiabatic curve than the late compression.
As discussed above, the RLE has been upgraded with a new gearbox and also with a proper TDC location. The data of Figure 11 (red line) were taken before ever modifying the injection pump timing, and with the same injector. Additionally, we are still using the exact same injection pump as we had in the original BSL experiments. It is obvious from Figure 11 that the injection timing in the RLE was substantially over-advanced and all combustion was complete prior to the TDC, whereas for the BSL, even though the premixed combustion was clearly taking place prior to the TDC, some combustion and increase in pressure continued after the TDC. The RLE red line graph also shows a pressure oscillation that was not present in the data presented by Dardalis [
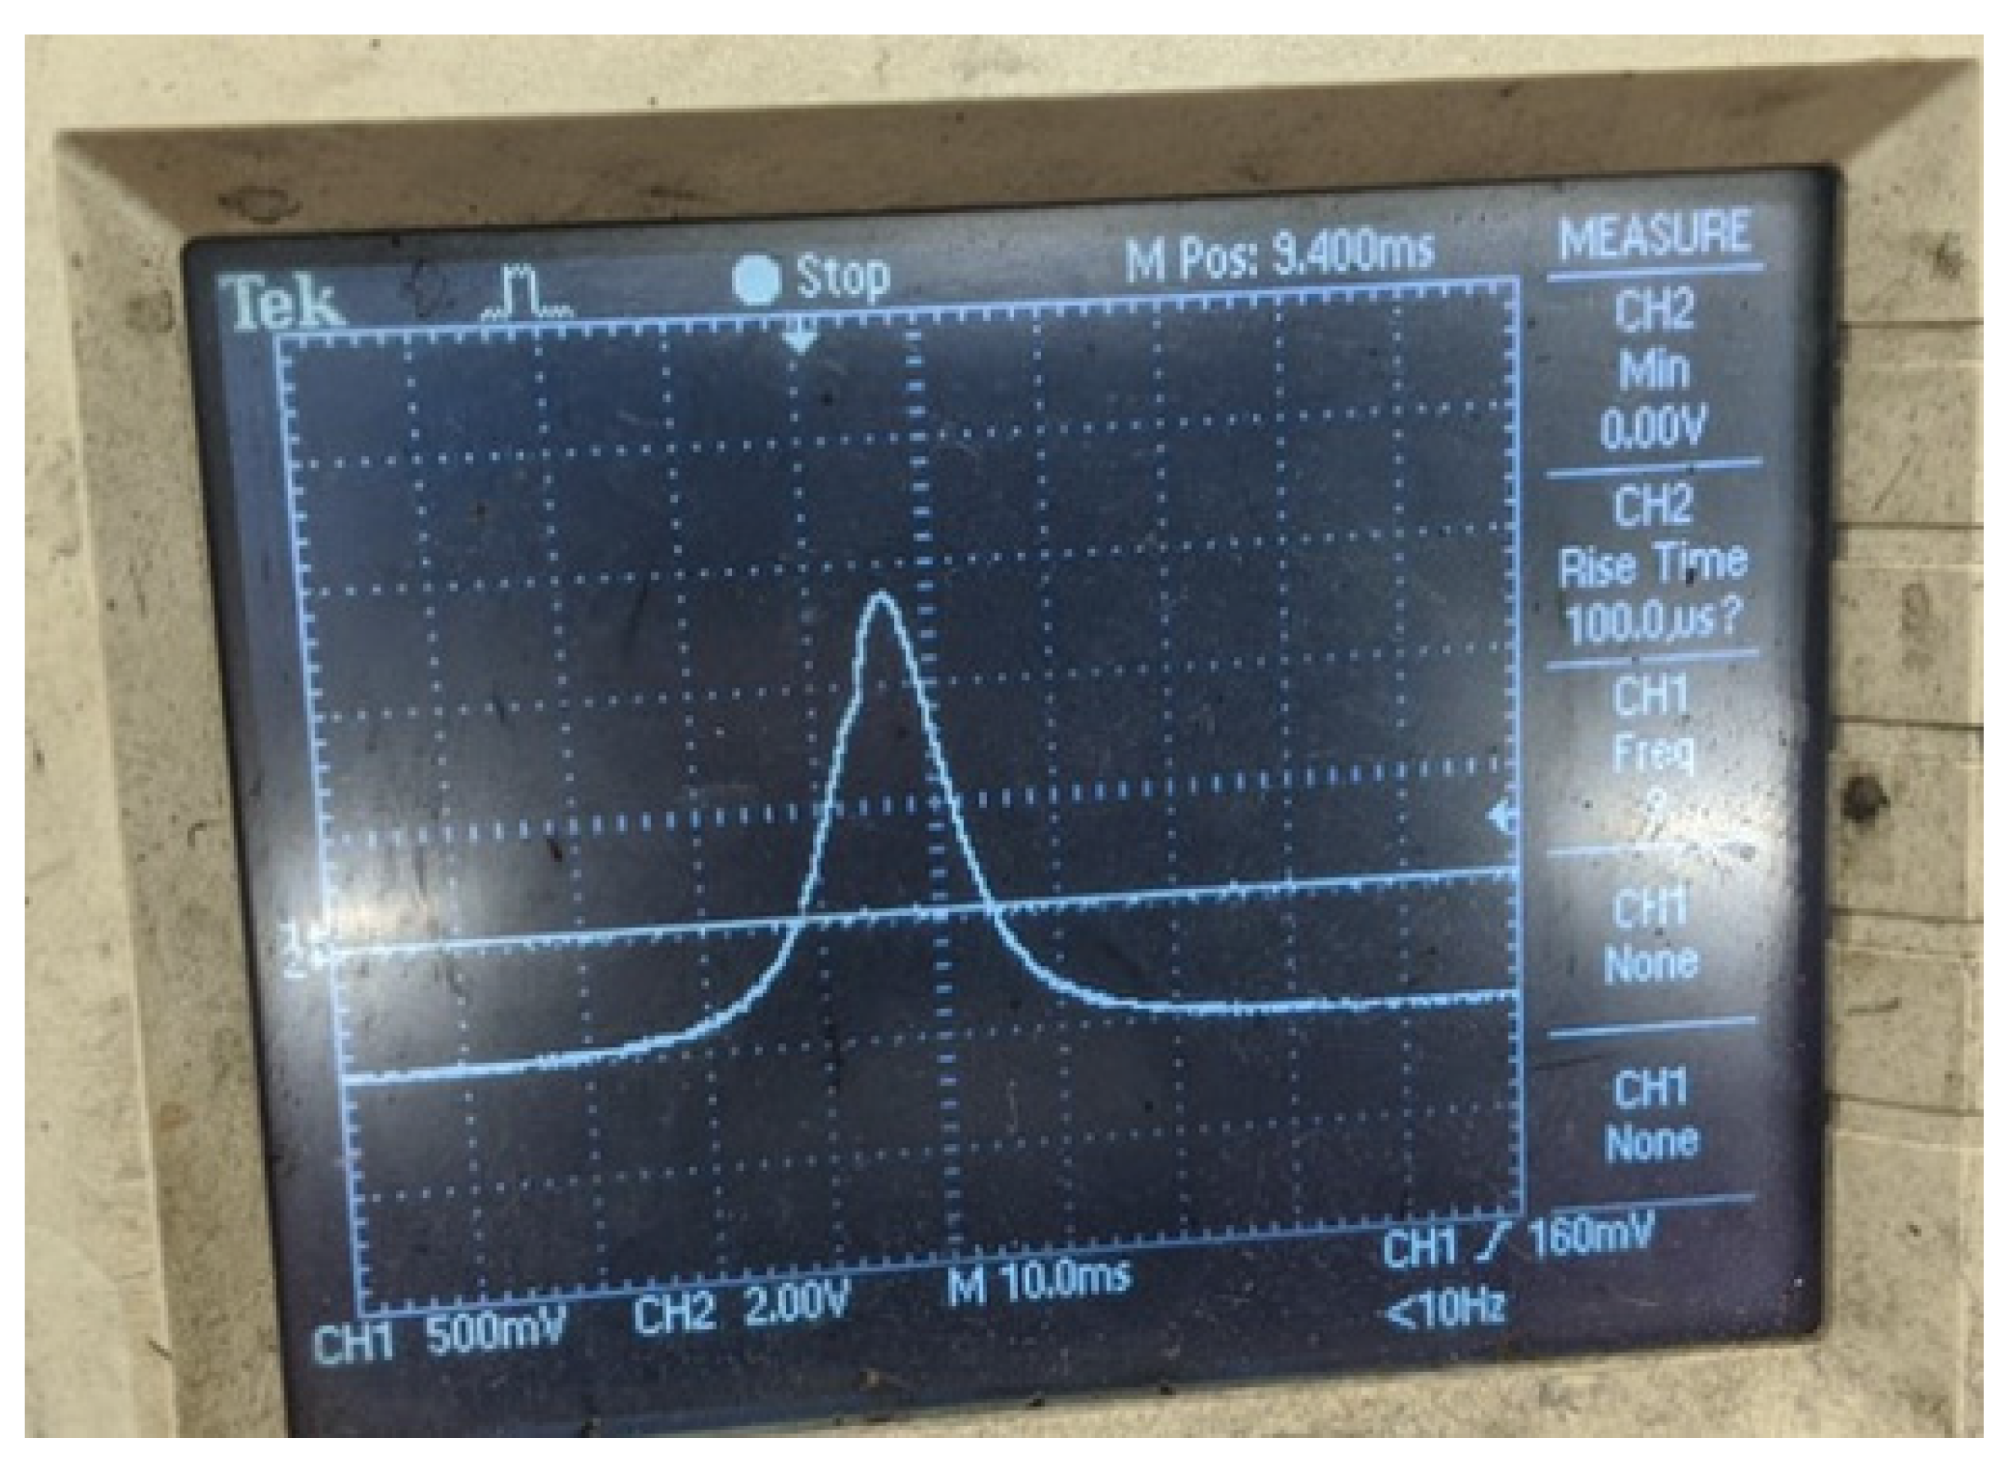
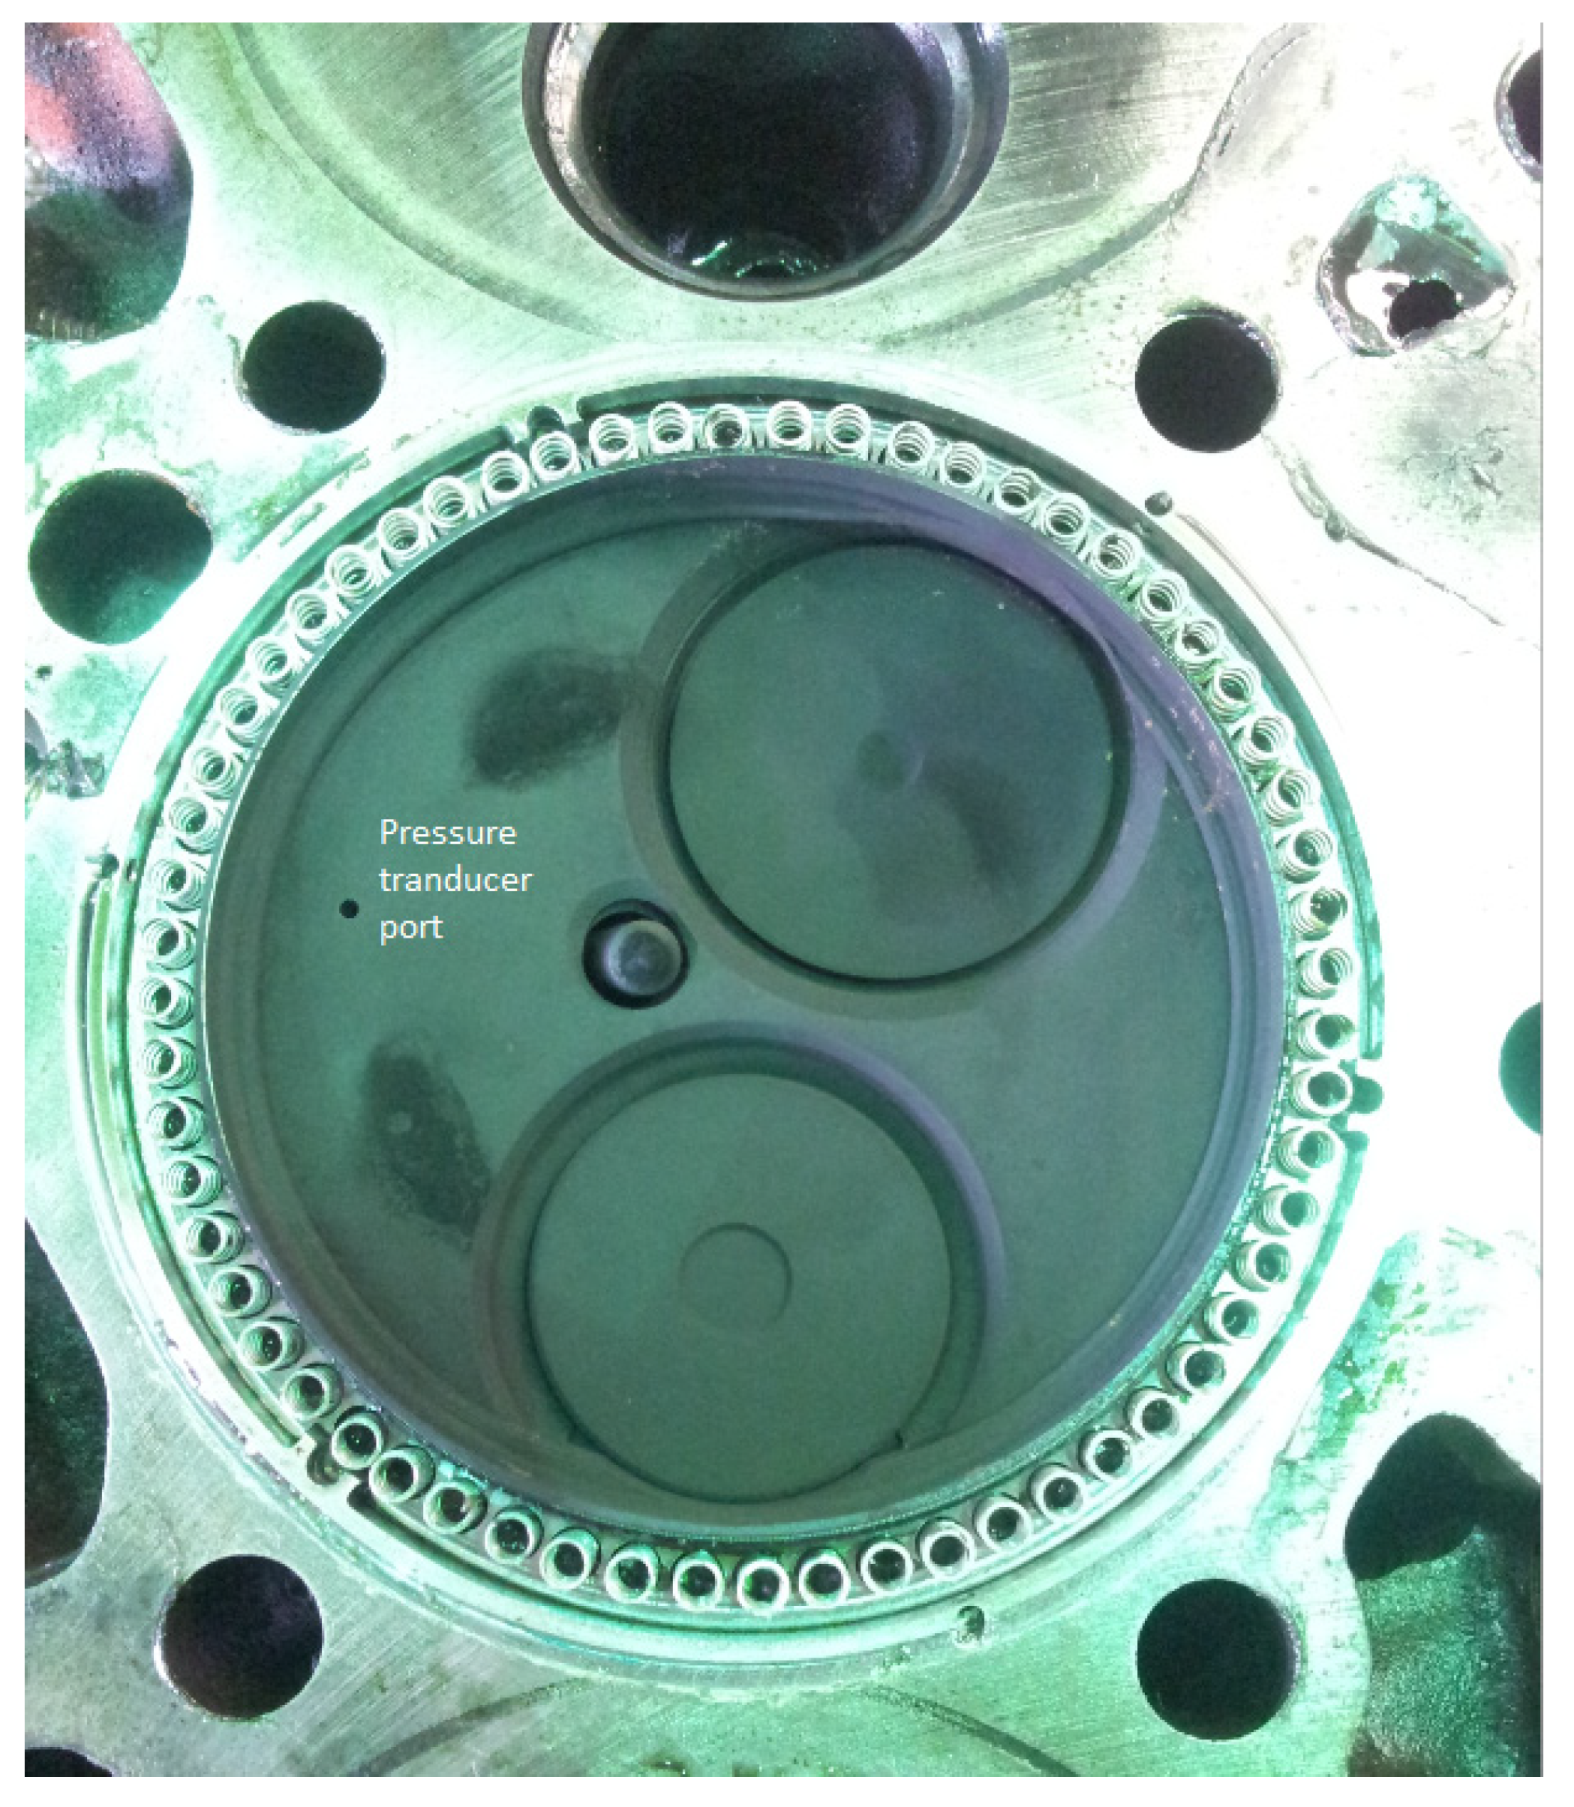
7]. It seems that we are having some abnormal combustion along with the pressure wave in the channel that connects the combustion chamber to the pressure transducer (a channel of approximately 20 mm is connecting our transducer to the combustion chamber, see Figure A2; under certain conditions, a pressure oscillation is seen in the signal). In the blue case in Figure 11, the injection timing was retarded (still on the RLE). As expected, the peak pressure was reduced, making it a more fair comparison; however, some pressure noise towards the very top is still visible (this is even more apparent on the Pressure vs. Crank Angle graph).
The blue graph in Figure 11 appears to be a much better comparison to the old BSL data (black). However, the combustion still appears to be faster. We are not exactly sure as to why, other than the fact that we were forced to service the injector between the two tests due to contamination, and the cracking pressure may have increased. As we said above, the obsolete mechanical fuel system cannot be controlled directly; instead, we tried different operating parameters in a trial and error mode and observed the results in the pressure signal.
We had a new injector prepared with a lower cracking pressure and tested it in the RLE. The result was a slower combustion event (the combustion duration and location with respect to the TDC is presented later with the instantaneous heat release rate calculations, see Section 3.7). Again, we are focusing on the conditions of 750 rpm and 71 °C coolant and oil temperature. The results are shown in Figure 12a and Figure 13b. Figure 12a shows the pressure vs. crank angle graph, where the slower combustion also minimized the pressure wave that we obtain on the signal right at the end of the premixed combustion. Figure 12b shows the top of the P-V diagram of the same case, which also looks remarkably identical to the BSL in Figure 11 (which is the same case as Figure 9 for BSL). Therefore, it can be concluded that the case in Figure 12 is a much better match to the original BSL cases in terms of percentage of fuel burnt at the TDC. The comparison of PCP minus PMP of these two cases is therefore more relevant.
The revised estimates for fuel reduction to sustain idle and therefore, friction reduction, are presented in Section 3.6 below. The purpose of the above discussion was to justify the comparison of the BSL Case 1 data to that of the RLE Case 5 data for both heat release and PCP/PMP analysis.

3.4. BSL Testing under Reduced Compression Ratio

We decided to conduct a few more tests with the BSL and obtain some preliminary CO2 exhaust concentrations from it. The BSL revival was performed without the crankshaft encoder, since we did not want to move this from the RLE and upset our TDC position. However, we could still take cylinder pressure data via the oscilloscope, which are presented in this subsection.
Prior to reviving the BSL, we also decided to reduce its compression ratio, so it would be a better match to the RLE; the correction factor due to differences in clearance volume would hopefully become 1 or closer to 1. As it turned out, the compression ratio of the BSL became slightly lower, so the correction factor was still needed, but the correction factor now amplified the difference in PCP-PMP rather than reducing it. The variation of compression ratio was performed by replacing the original thick copper head gasket with a stock gasket, but apparently, given that we did not know exactly the extent to which each gasket crushes, the compression ratio did not end up at the exact value of the RLE (we used a copper head gasket in the RLE as well, but the head bolts were torqued down to a lower torque than the BSL, since the combustion gases were contained by our RLE hydrodynamic face seal). The compression ratio comparison was performed via our motoring test. This motoring test is not exactly a motoring test, since we do not have a motoring dynamometer. Instead, we rev the engines up, turn off the injection pump, and record pressure and speed. This can be conducted with the data acquisition system, or simply by the oscilloscope. This process is shown in the Appendix A. The process yielded 28 bar absolute (27 bar gage) at around 1080 rpm (the sensitivity of the peak pressure on rpm is very low for both engines; it used to be slightly more pronounced for the BSL when it operated with a higher compression ratio).
The comparison in terms of CO2 concentration is shown in Table 1 and Table 2. Comparing the cases with advanced injection timing, the RLE exhibited about 20% lower CO2 concentration for the idle condition in question. With the retarded timing, the difference became substantially wider at a 45% difference. This margin is larger than the pressure data suggest, and we cannot explain this large difference yet.
During these tests, it was discovered that some further correlations between PCP-PMP can be made, and the injection timing can be used as a variable. Specifically, we know that as the injection timing is retarded, the PCP will be reduced. We wanted to capture this effect and compare it to how the RLE responds to similar injection timing. This allowed us to group cases with similar combustion characteristics, and make more refined comparisons, thus eliminating the uncertainty of injection timing. Even though we can no longer define the exact position of the premixed combustion with respect to the TDC (given the absence of the crankshaft encoder from the BSL), the changes in the combustion characteristics are fairly large, and solid conclusions can be made, even in the absence of an encoder.
In this next series of experiments, the new injector with reduced cracking pressure was used with the BSL as was the case of the RLE data given in Figure 12b. In this case, it has a rather advanced injection timing. This is evident by the fact that the sharp pressure rise of the premixed combustion takes place at a compression pressure of at least 3 bar below the maximum motoring pressure and of course, prior to any local maxima of the pressure. When the temperature actually reached 71 °C, the peak pressure was about 44.5 bar abs. The combustion behavior of this case is shown in the Appendix A (Figure A4). This case is called Case 2.
Now, let us explore the PCP response when the timing is retarded by 4 degrees. The combustion characteristics are again shown in the Appendix A (Figure A5). The fact that these conditions are of a retarded injection timing can be concluded by the fact that the premixed combustion started at a pressure about identical to PMP, indicating that combustion started around the TDC and most of the heat release took place after TDC. For some reason, the premixed combustion is not as well defined in this case, possibly due to the reduced compression ratio. The combustion seems to be slower than other cases. The PCP for that case was about 39.0 bar absolute. This case, which we call Case 3, is also shown in the Appendix A. Obviously, we cannot use the difference of PCP-PMP to compare this case with, for example, the RLE cases of Figure 11 or Figure 12, since in these cases, most of the heat release was completed by TDC. However, an RLE case with similarly retarded timing is presented in Section 3.5 in order to show that the trend of lower PCP-PMP in the RLE persists.

3.5. RLE Testing under Retarded Injection Timing

In order to be consistent with the BSL and cover the entire range of injection timing, the RLE was also retarded by 4 degrees from the case of Figure 12. Figure 13a shows the resulting pressure vs. CA (Crank Angle) history. It is clear that the premixed combustion starts just before TDC and ends just after TDC. Unlike the BSL, however, we have a well-defined premixed combustion instead of a more gradual pressure rise associated with a small degree of premixed combustion. Due to a coolant leak, we stopped the test early, and this case did not quite reach 71 °C, so we are presenting 63 °C with a higher fMEP, making the comparison more conservative. The trend is clear. The PCP dropped substantially, as in the BSL. Additionally, a slight pressure wave noise returned right around the TDC probably due to the rapid combustion. The top part of the PV-diagram is shown in Figure 13b, where the characteristics of the combustion are again confirmed. Additionally, in both Figure 13a,b, the effects of evaporative cooling by the injected fuel are visible, creating a local reduction in the pressure just before combustion.

3.6. The PCP-PMP Comparison Method, and First Estimate of RLE Friction Reduction

The above cases set the stage for meaningful comparisons of PCP minus PMP of comparable RLE and BSL cases in order to establish the total heat release needed to sustain the engine. It can be assumed that the indicated thermal efficiency of both engines is about identical, and since the only load on the engine at idle is its own internal friction, the fMEP is directly proportional to the heat needed to sustain the engines. This total heat release per cycle is proportional to the PCP-PMP, as long as the comparison is made for cases where about the same percentage of the total heat release is complete at the TDC, and/or as long as the peak cycle pressure is around the TDC (in other words, as long as the combustion phasing with respect to the TDC is identical). The only case where peak pressure is substantially after the TDC is Case 3 (see Figure A5 in the Appendix A). We collected enough information to justify meaningful comparisons. For the cases shown in Table 1 and Table 2, we can compare Cases 1 and 4 (favorable for the BSL as discussed), 1 and 5, 2 and 5, and 3 and 6. The CO2 measurements are not complete, but appear consistent with the PCP-PMP comparison method. The most important corroboration is actually via the integrated adiabatic heat release calculations, which will be discussed in Section 3.7; they show where in the cycle the heat release is taking place.
Overall, the comparison in Table 1 and Table 2 is consistent with the trends. The lowest margin of RLE improvement in fuel economy is when comparing Cases 1 and 4, which is 18%. RLE Case 4 is considerably over-advanced as shown by its P-V diagram (Figure 11, red curve). This over-advancing was also apparently causing excessive heat loss, and the actual indicated thermal efficiency was low, as indicated by the higher (compared to RLE Case 5) exhaust CO2 concentration. However, when the timing was retarded one step (Case 5), and the combustion of the RLE was a lot closer to BSL Case 1, we obtained a 38% reduction in PCP-PMP compared to Case 1. However, we are comparing the RLE with a higher compression ratio BSL, where it can be argued that the pressure loading on the BSL piston rings creates an excessive fMEP loss for the BSL (the RLE piston rings and skirt are operating hydrodynamically, so their fMEP contribution is not sensitive to pressure loading). However, when we compare RLE Case 5 with BSL Case 2, where the compression ratio is actually lower than the RLE, we are still obtaining a 32% reduction in fuel consumption. When the timing is considerably retarded on both engines, the margin is reduced to 23%. This is reasonable, based on the fact that the retarded timing reduces the pressure loading on the BSL piston rings, but also, it needs to be reiterated that this comparison favors the BSL where the peak pressure is considerably past the TDC (Figure 13a for the RLE and Figure A5 for the BSL).
Some readers may wonder about the validity of the PCP-PMP method, by suggesting that the leakage from the face seal reduces the peak pressure on the RLE. This was expanded upon by Dardalis et al. 2019 [
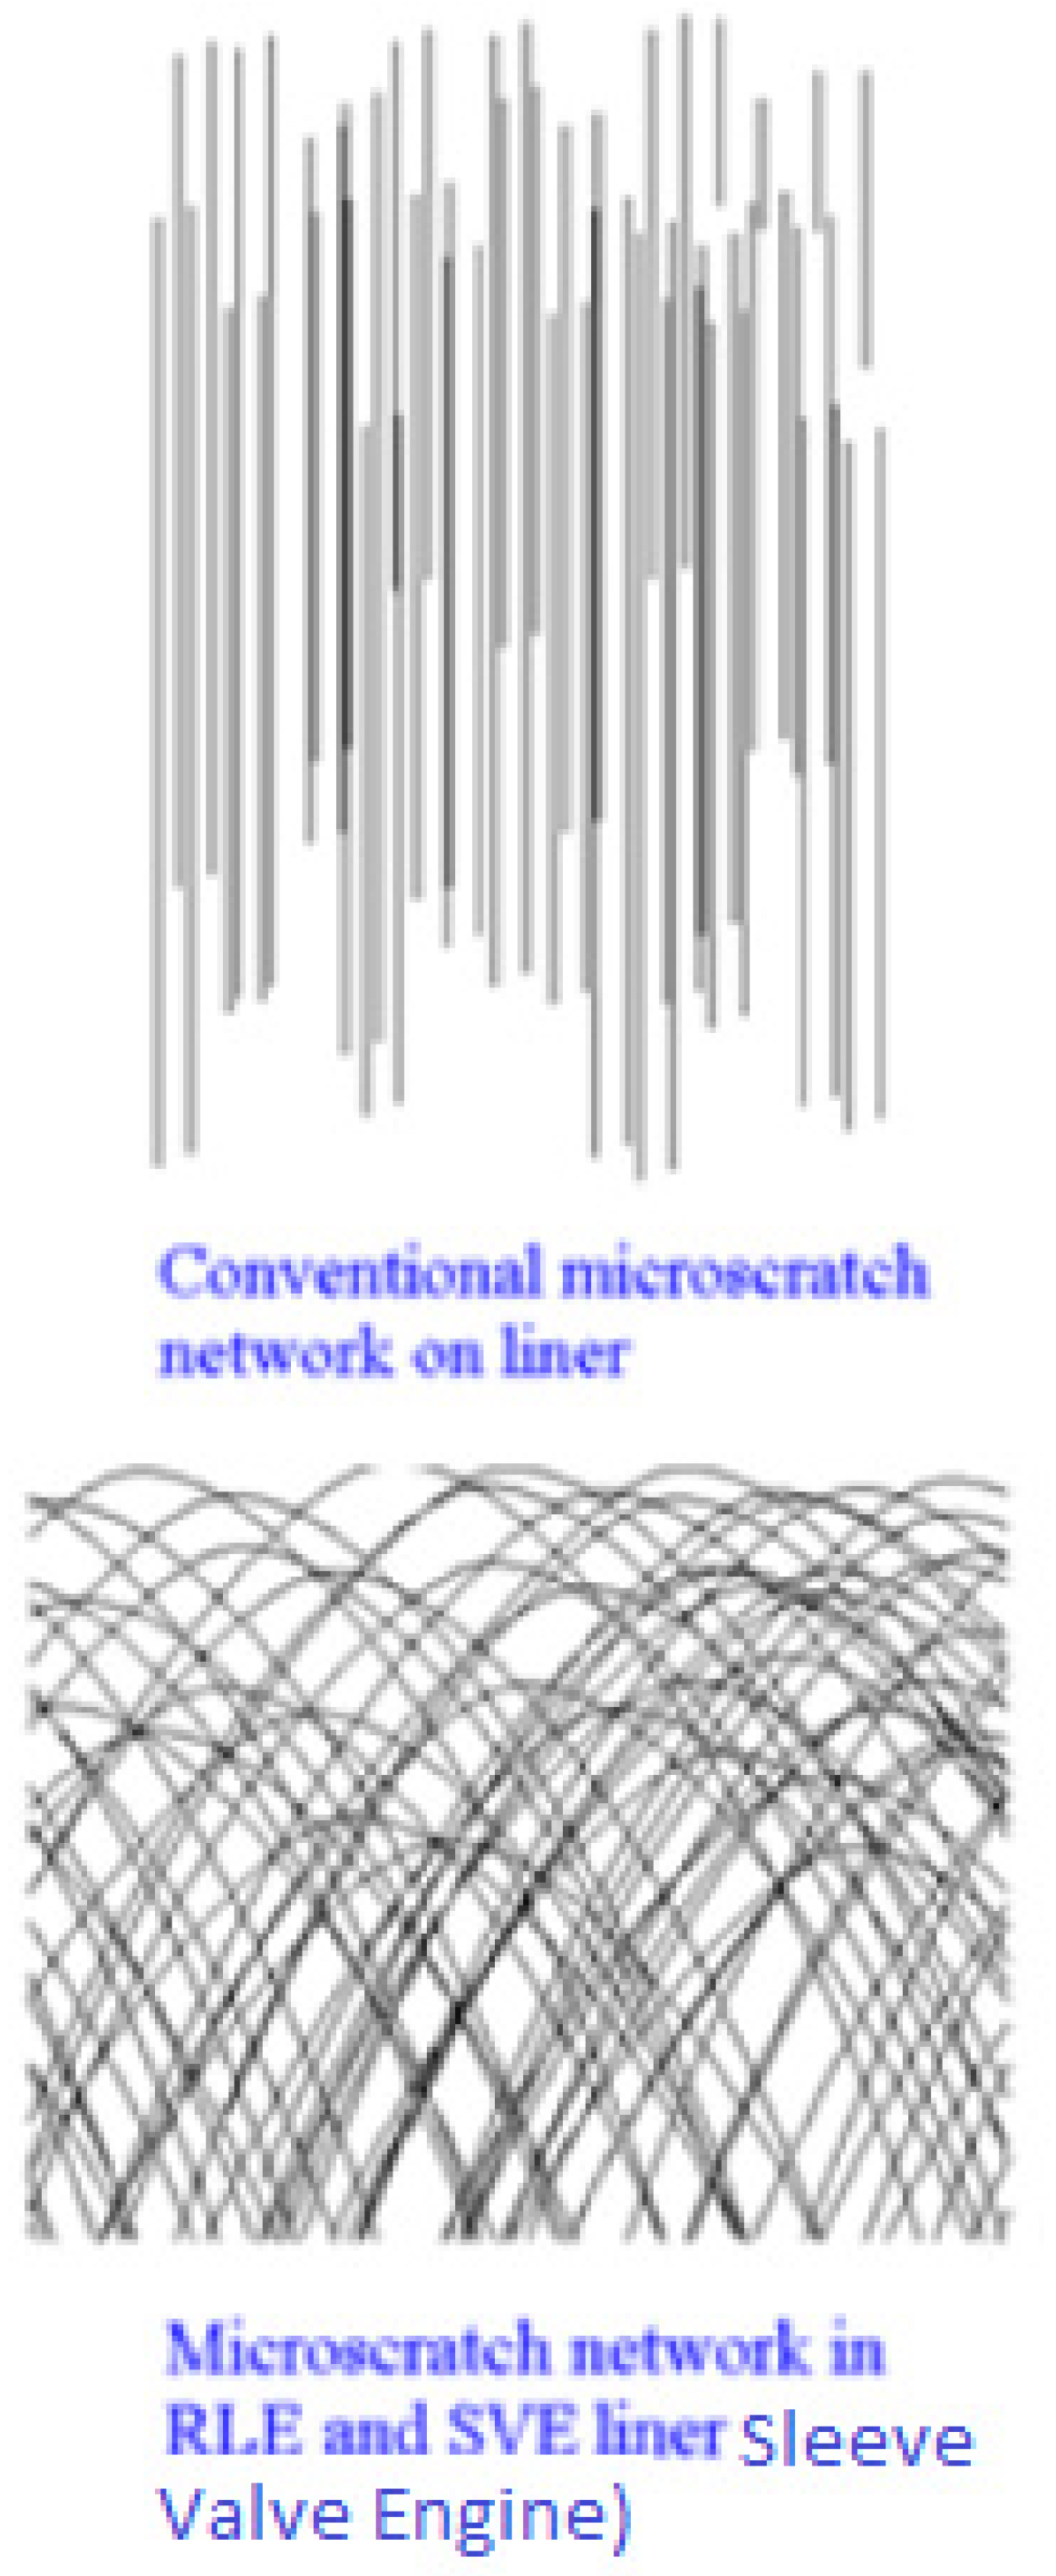
7], but it will be briefly mentioned here. The combustion with this low-pressure injection system is very sooty and leaves heavy traces where there is blowby. When the engine is disassembled and inspected, it is typically observed that the area of the seal is clean from soot, and in fact, the area where the soot never enters in the seal gland is very well defined (See Figure A2 in the Appendix A). This is in contrast to the piston ring lands, for example, where soot is clearly defining the leakage path, especially in the RLE where the rings are pinned, and the end-gaps are always in the same position. Second, the RLE face seal area is directly connected to the gear area (
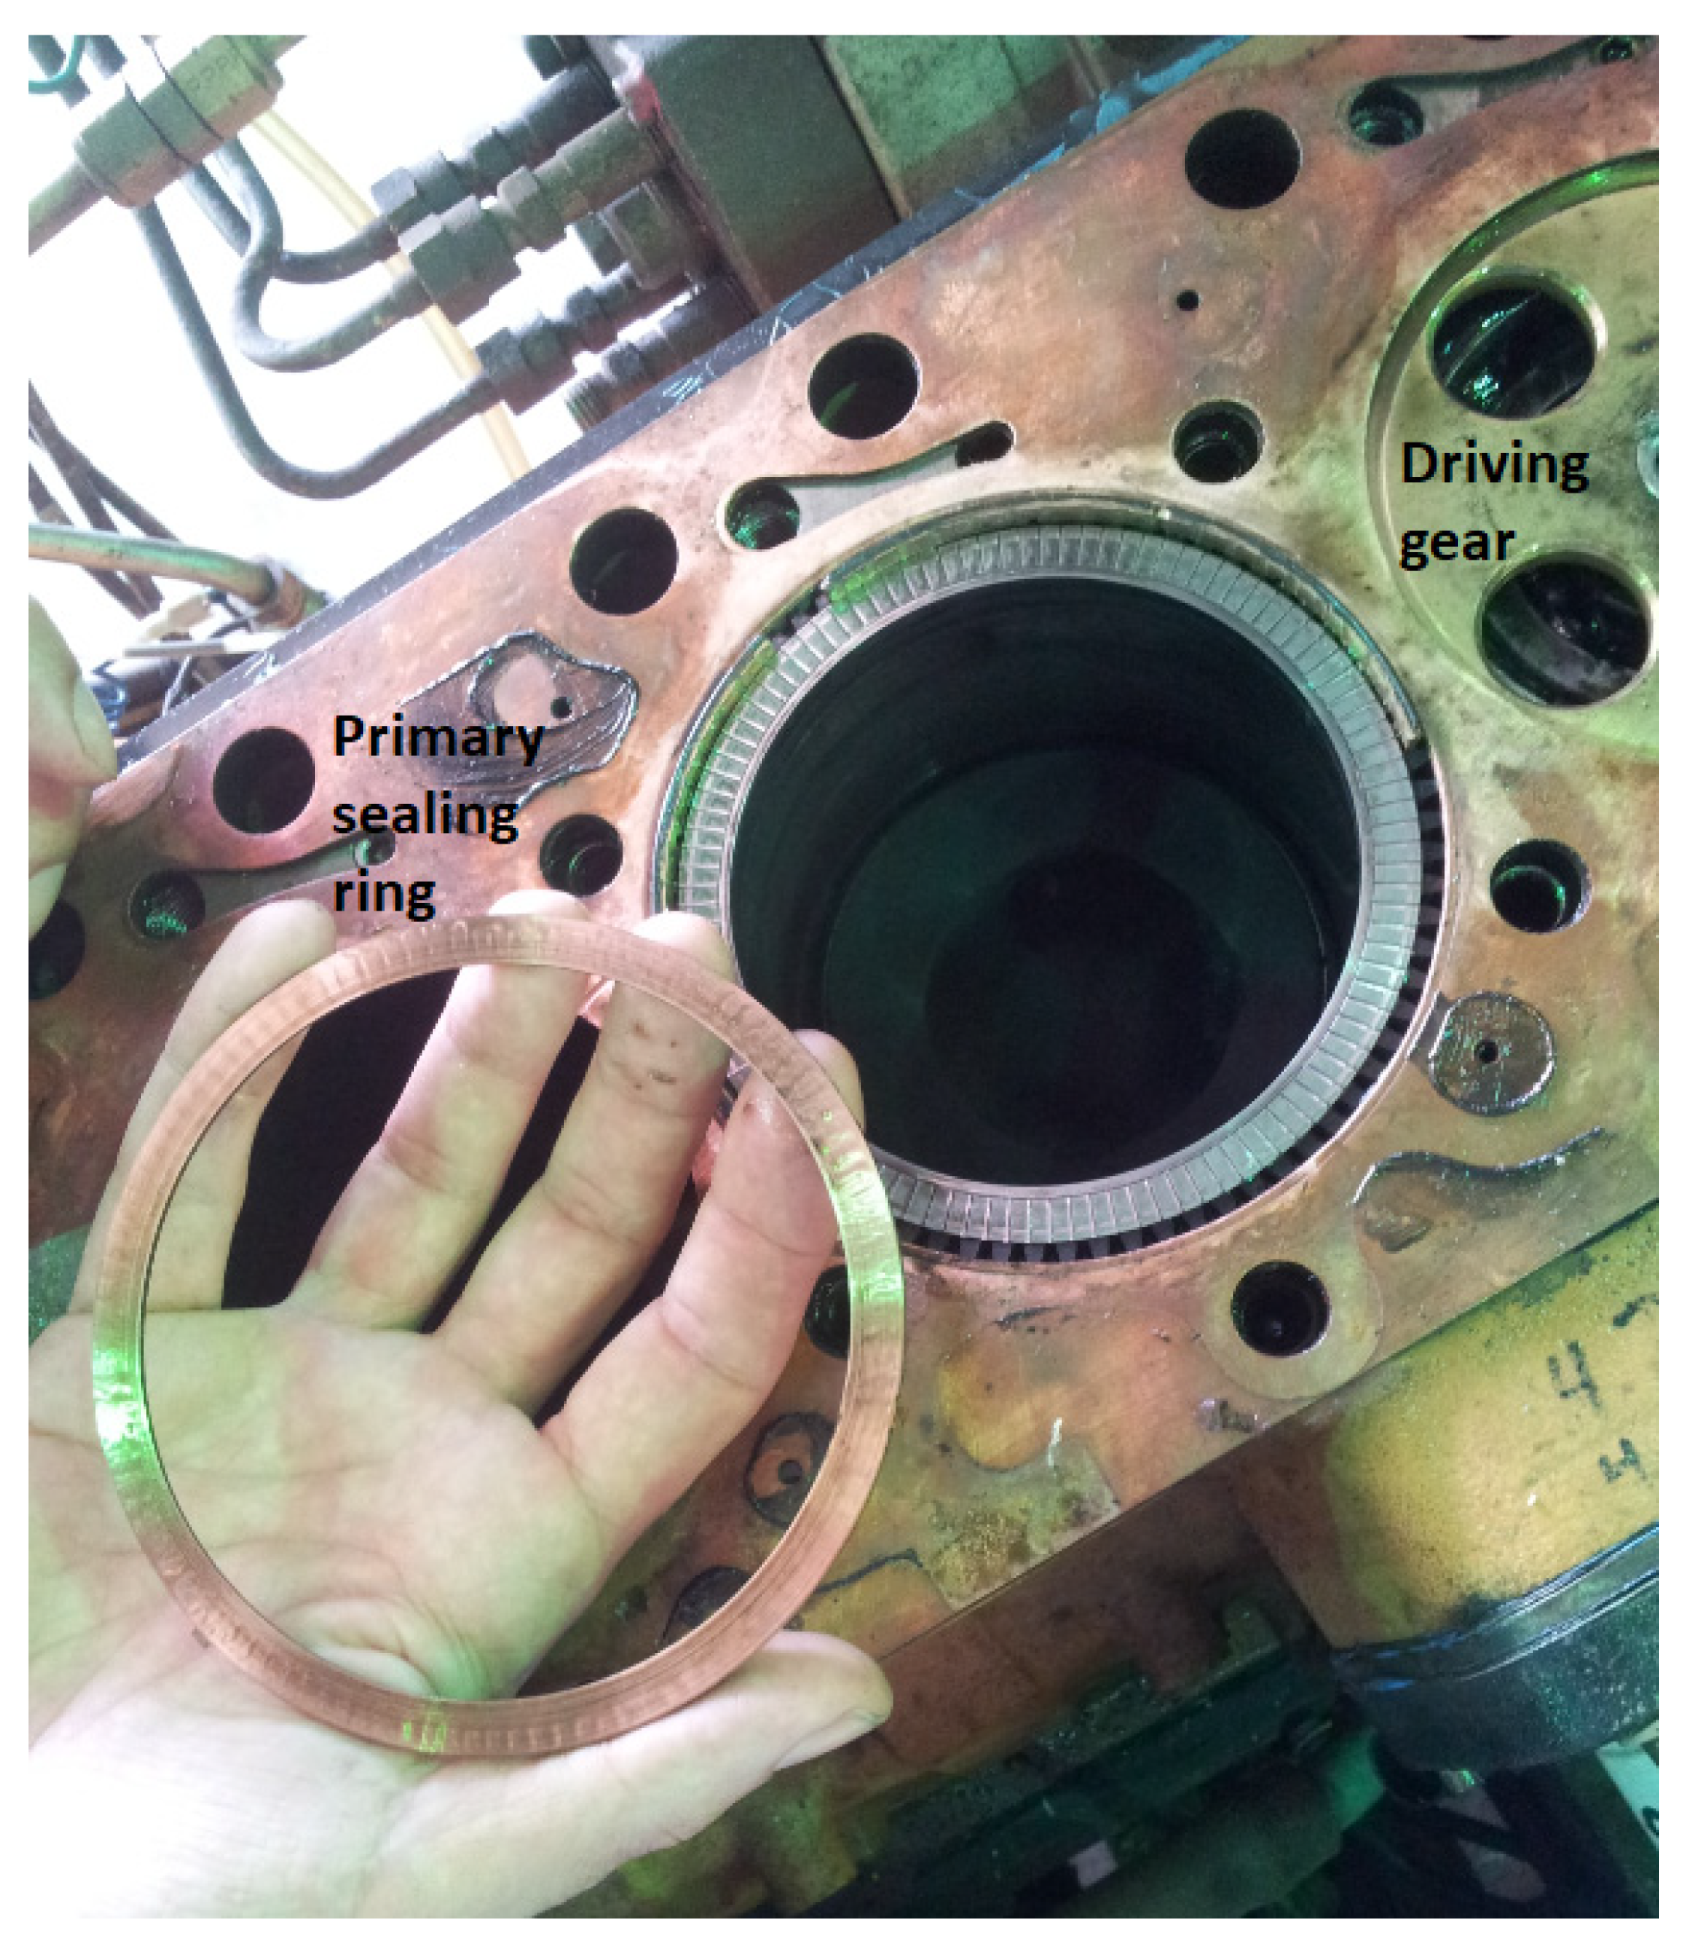
Figure 4 or Figure A1), which is in turn isolated from the main crankcase. We had leaks occur occasionally due to malfunctions, caused either by an error during assembly, or on one occasion, by debris from a proximity sensor that collided with the piston and packed in the gland, interfering with the face seal function. When a leak happened, the sound was clearly heard from the open port of cylinder #1. This is the only time when signs of soot are observed in the seal area during disassembly. Finally, a gas leakage is a direct energy loss, which will require a larger quantity of fuel to be burned to compensate. As will be seen in Section 3.7, most of the heat release takes place during a very brief portion of the cycle when there would be very little time for gas leakage. A significant energy loss due to leakage would show itself as a higher amount of total heat released per cycle needed to sustain the engine. However, the overall heat release follows the same trends as the PCP-PMP method, as shown in Section 3.7.
Based on the results of this section, it is reasonable to conclude that the RLE fMEP is approximately 20–35% less than the BSL, as it takes about 20–30% less fuel to run, given approximately identical thermal efficiencies. Additionally, given that each of the single cylinders has to rotate a 5-bearing crankshaft, and the oil and water pumps are sized for complete 6-cylinder engines, it can be concluded that the fMEP reduction for a complete engine would likely be much higher than 30%. This is expanded on in Section 3.8.

3.7. Instantaneous and Integrated Total Heat Release Comparison

We have high-resolution cylinder pressure data with a crankshaft encoder for many cases for the RLE and one case for the BSL, Case 1 having a high compression ratio. These were analyzed to obtain the instantaneous adiabatic heat release rate. This information can be used to confirm the statements of previous sections with respect to the heat release distribution in the cycle, and specifically with respect to the TDC. For example, was Case 4 of Table 1 and Table 2 really more advanced than Case 1, and is Case 5 indeed a better match to Case 1 to the position of the combustion event with respect to the TDC?
The equation used to calculate the instantaneous heat release rate was borrowed from Brunt and Platts [8] and is shown here as Equation (1).
d Q h r = γ γ 1 · p · d V + 1 γ 1 · V · d p
where Qhr is the heat input by combustion, γ is the ratio of specific heats (function of temperature), p is the pressure, and V is the volume. Note that we ignored heat loss; we are only considering the adiabatic heat release in order to be consistent with the prior PCP-PMP method. For all the graphs shown in this section, the dQ plotted is for 1/20th of a crank angle, which is our encoder resolution.
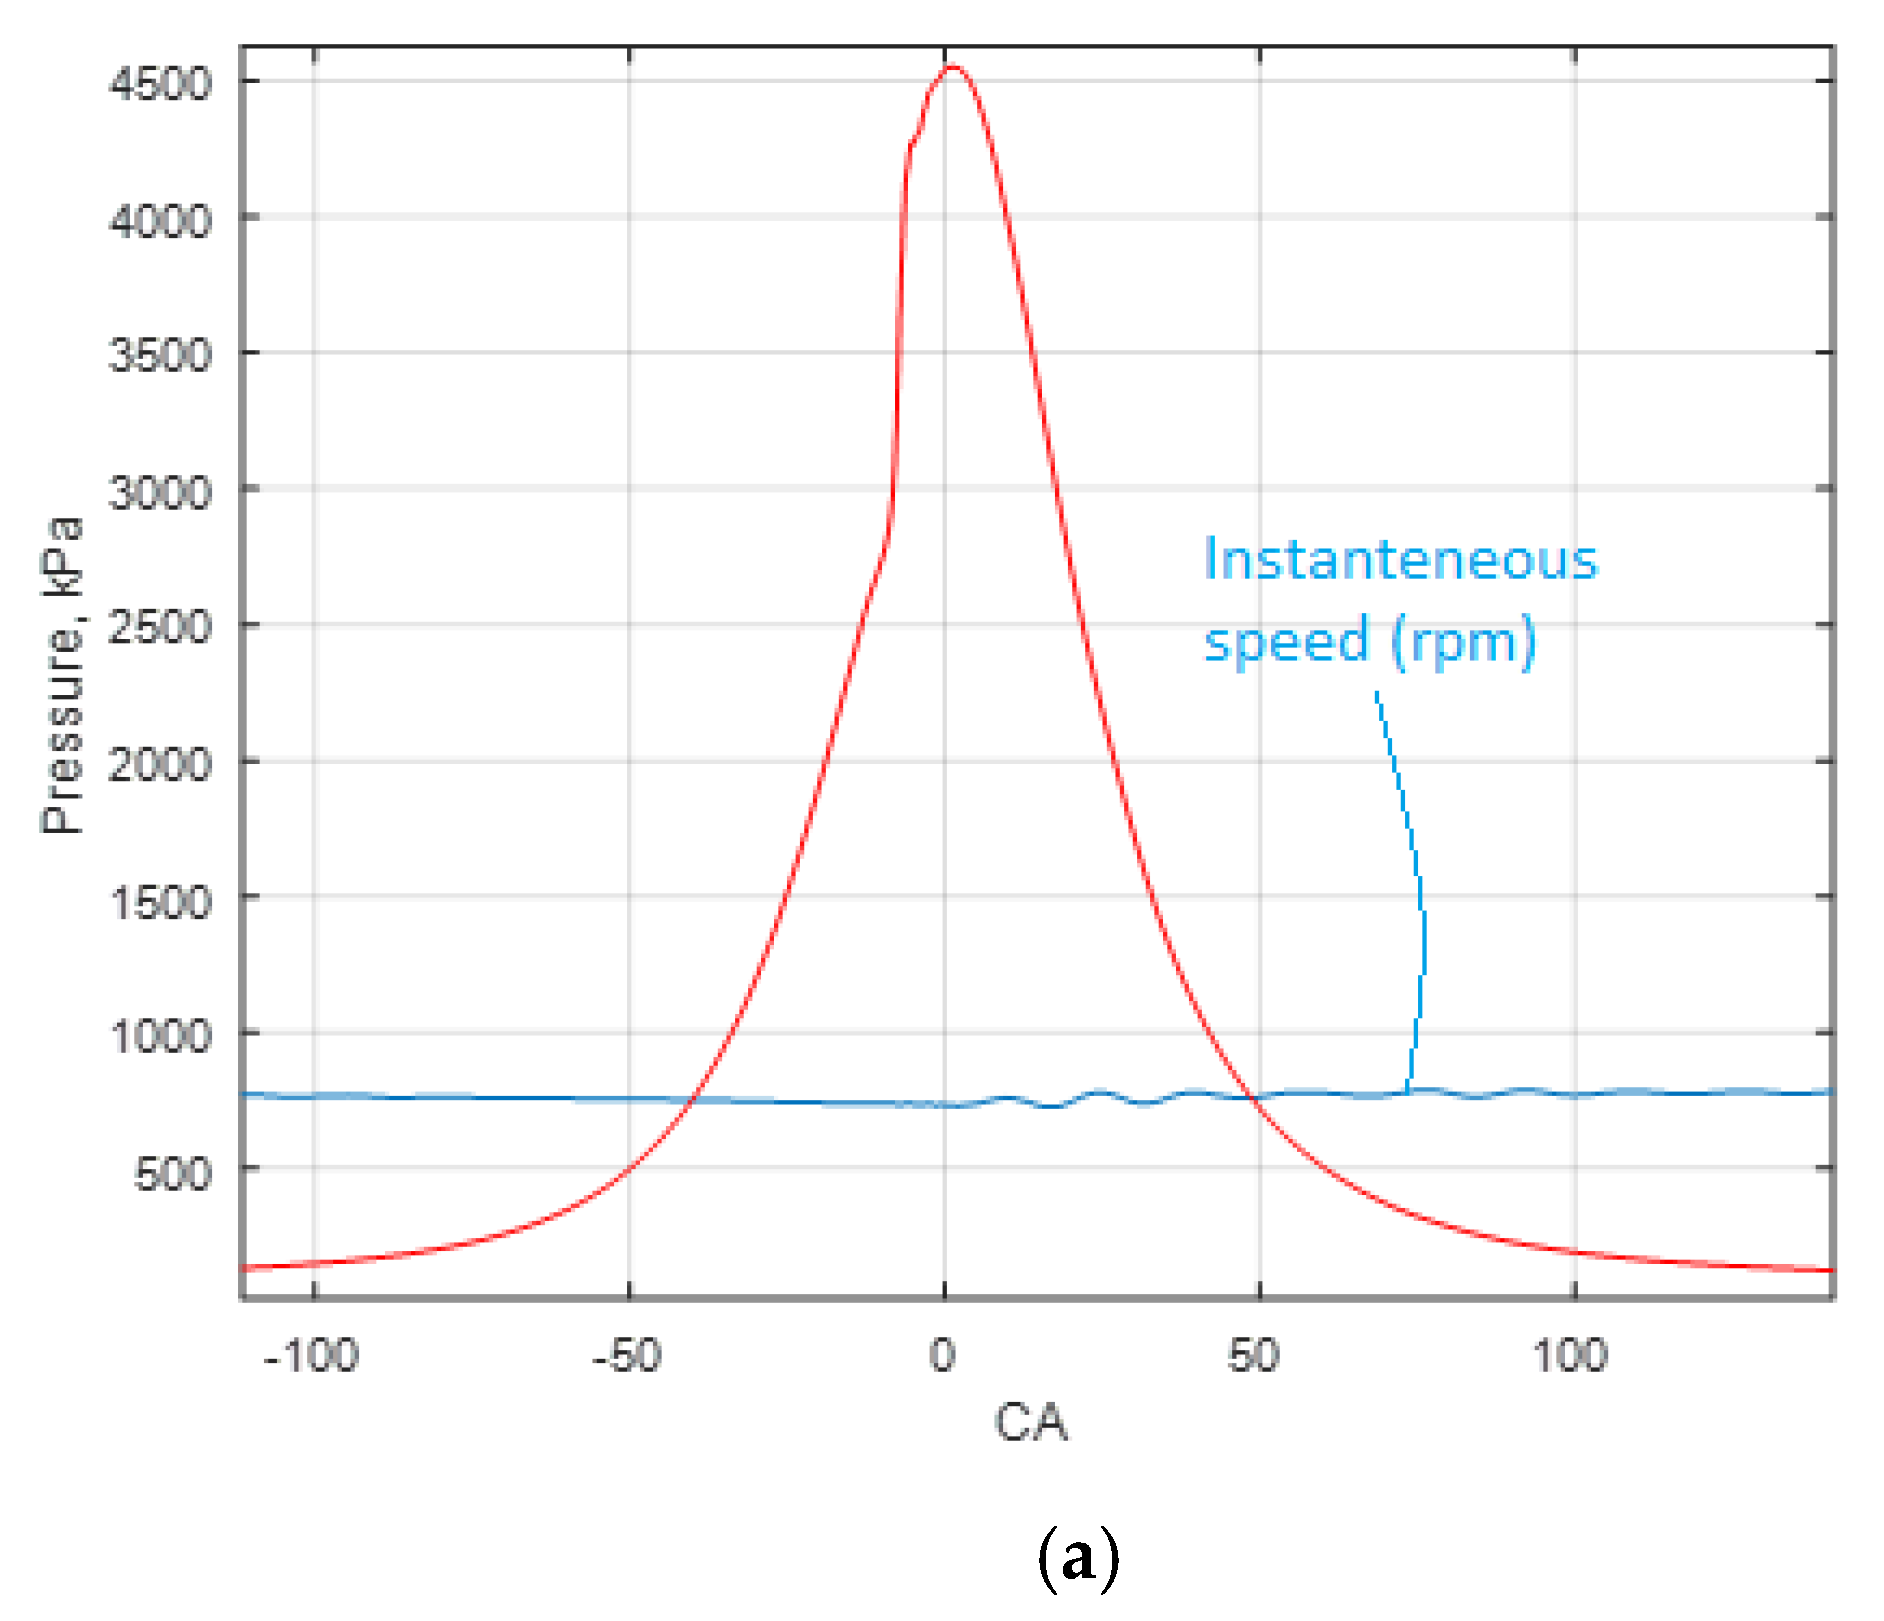
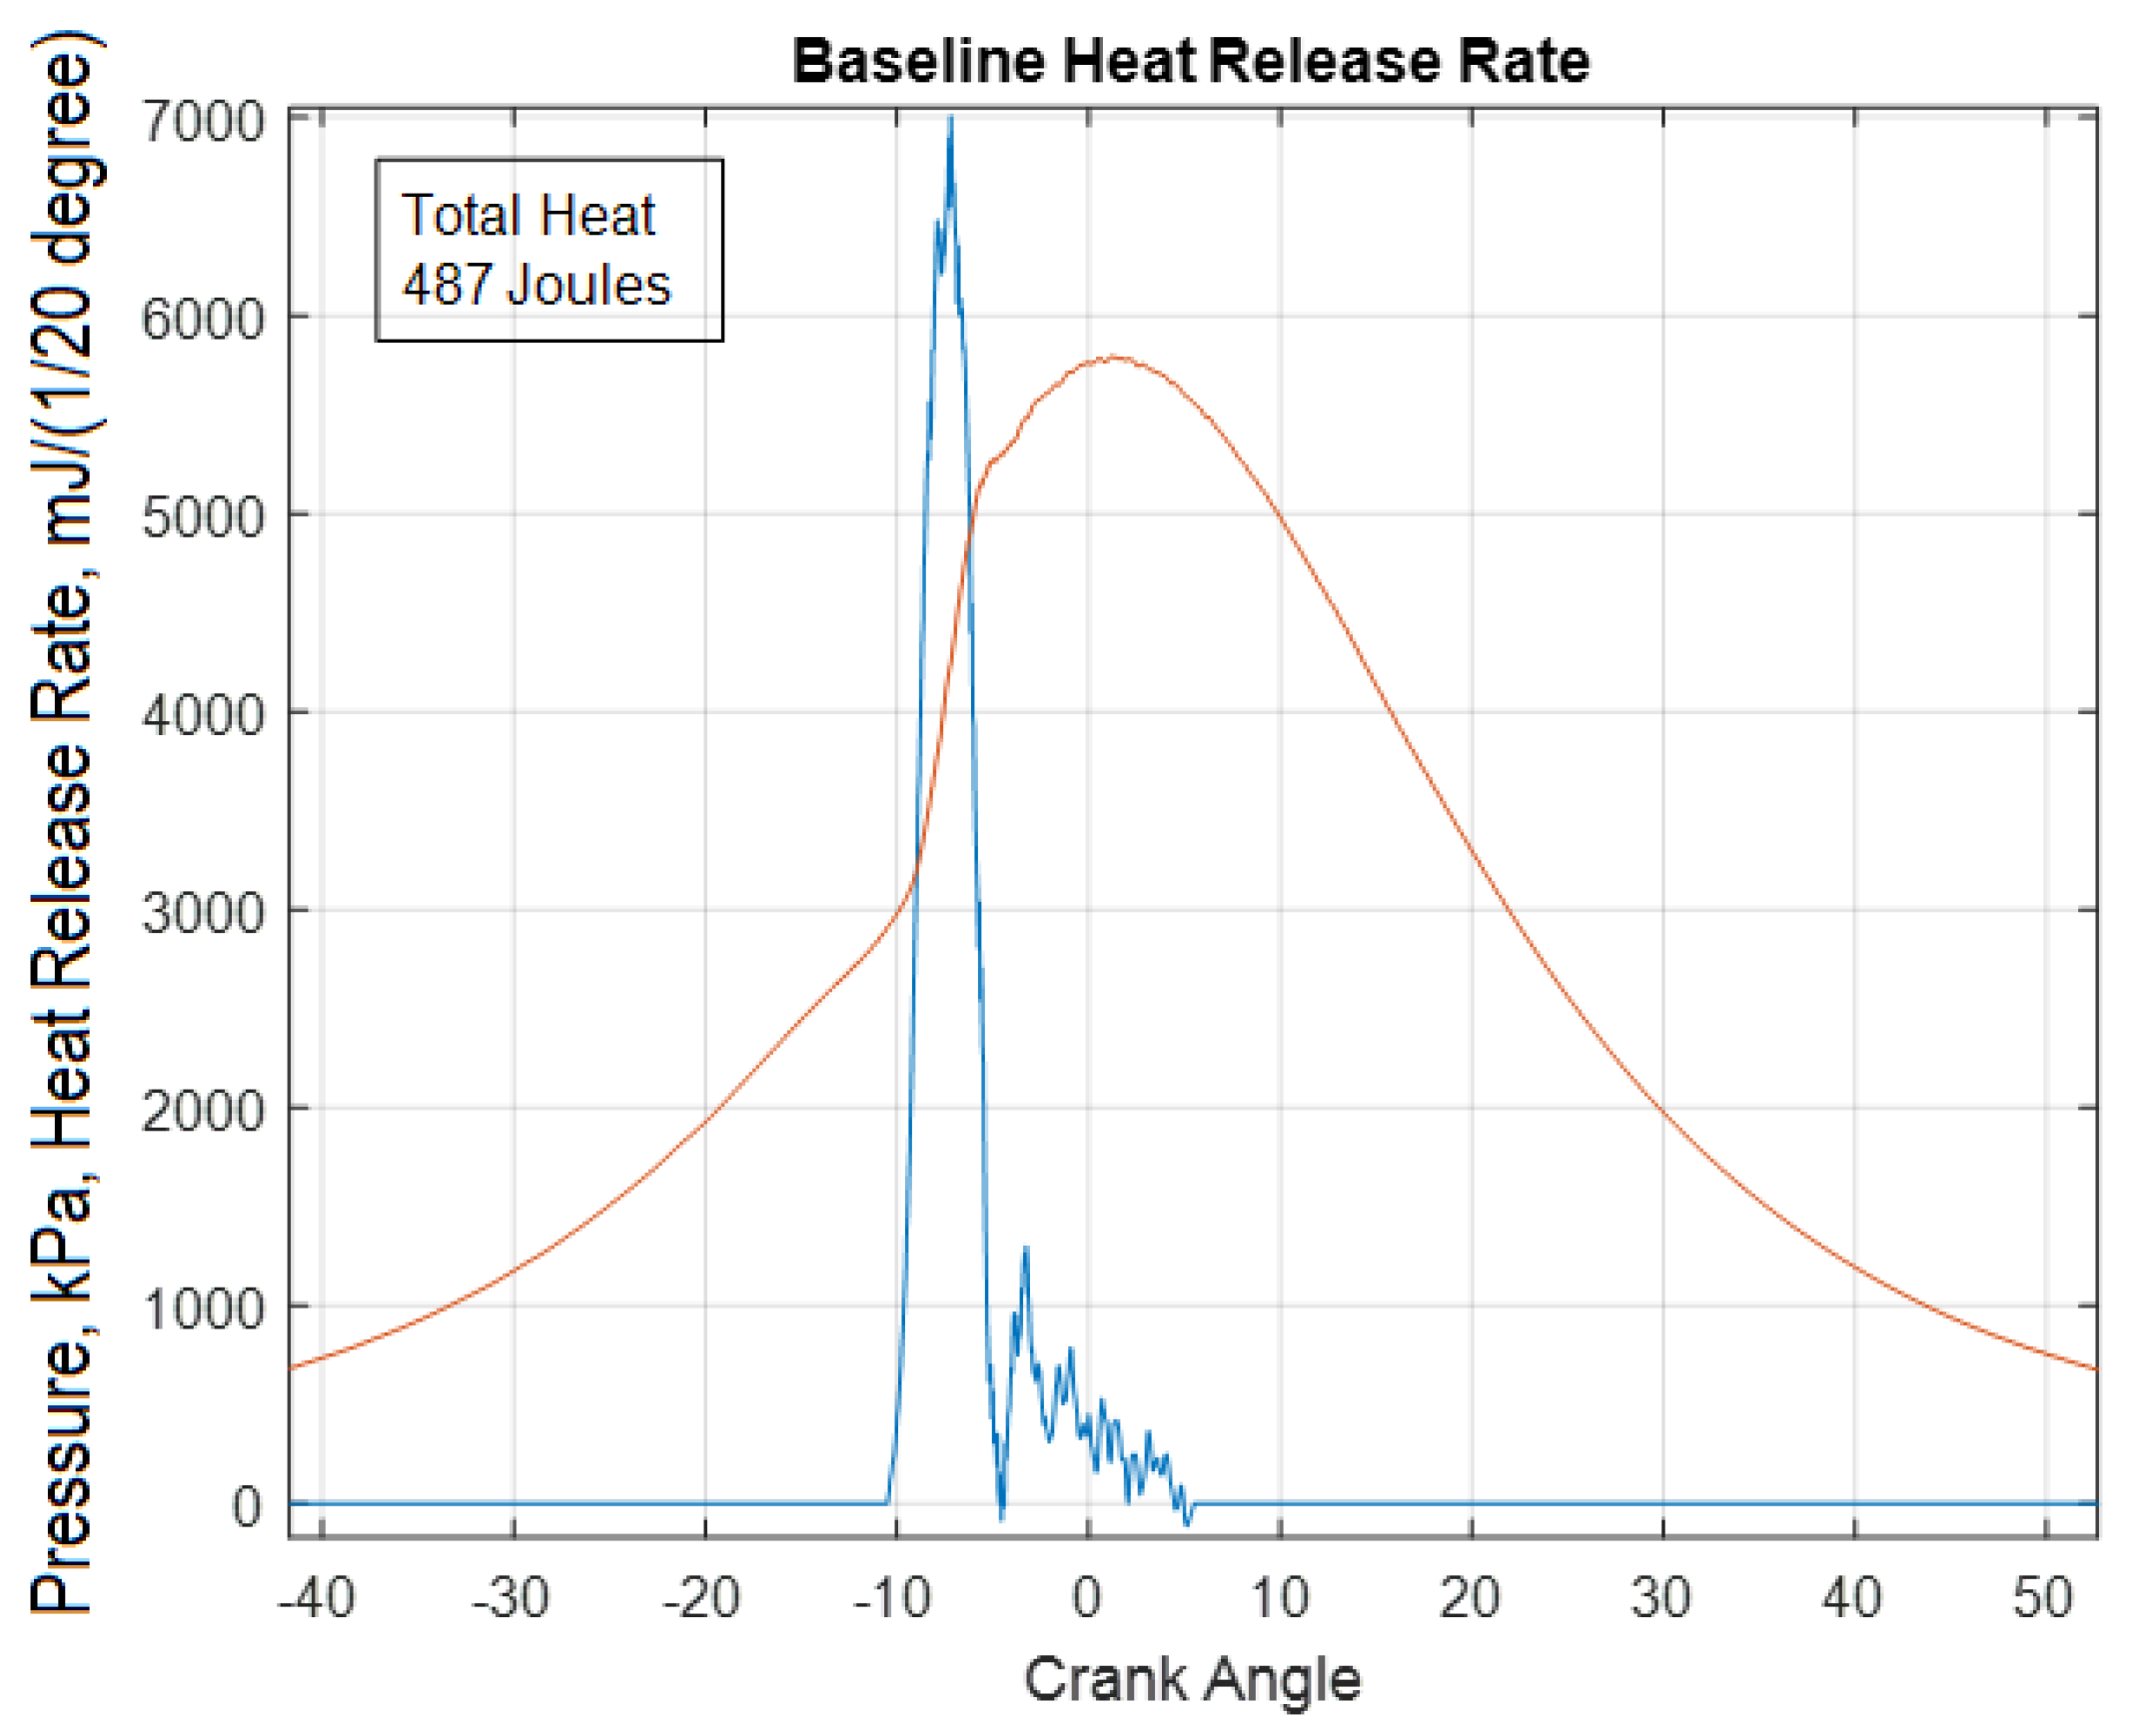
Figure 14 shows the heat release rate for BSL Case 1. This confirms the prior statements that most of the heat release was prior to the TDC, but some combustion continued after the TDC. Additionally, it confirms that the bulk of the combustion takes place in the premixed section. 
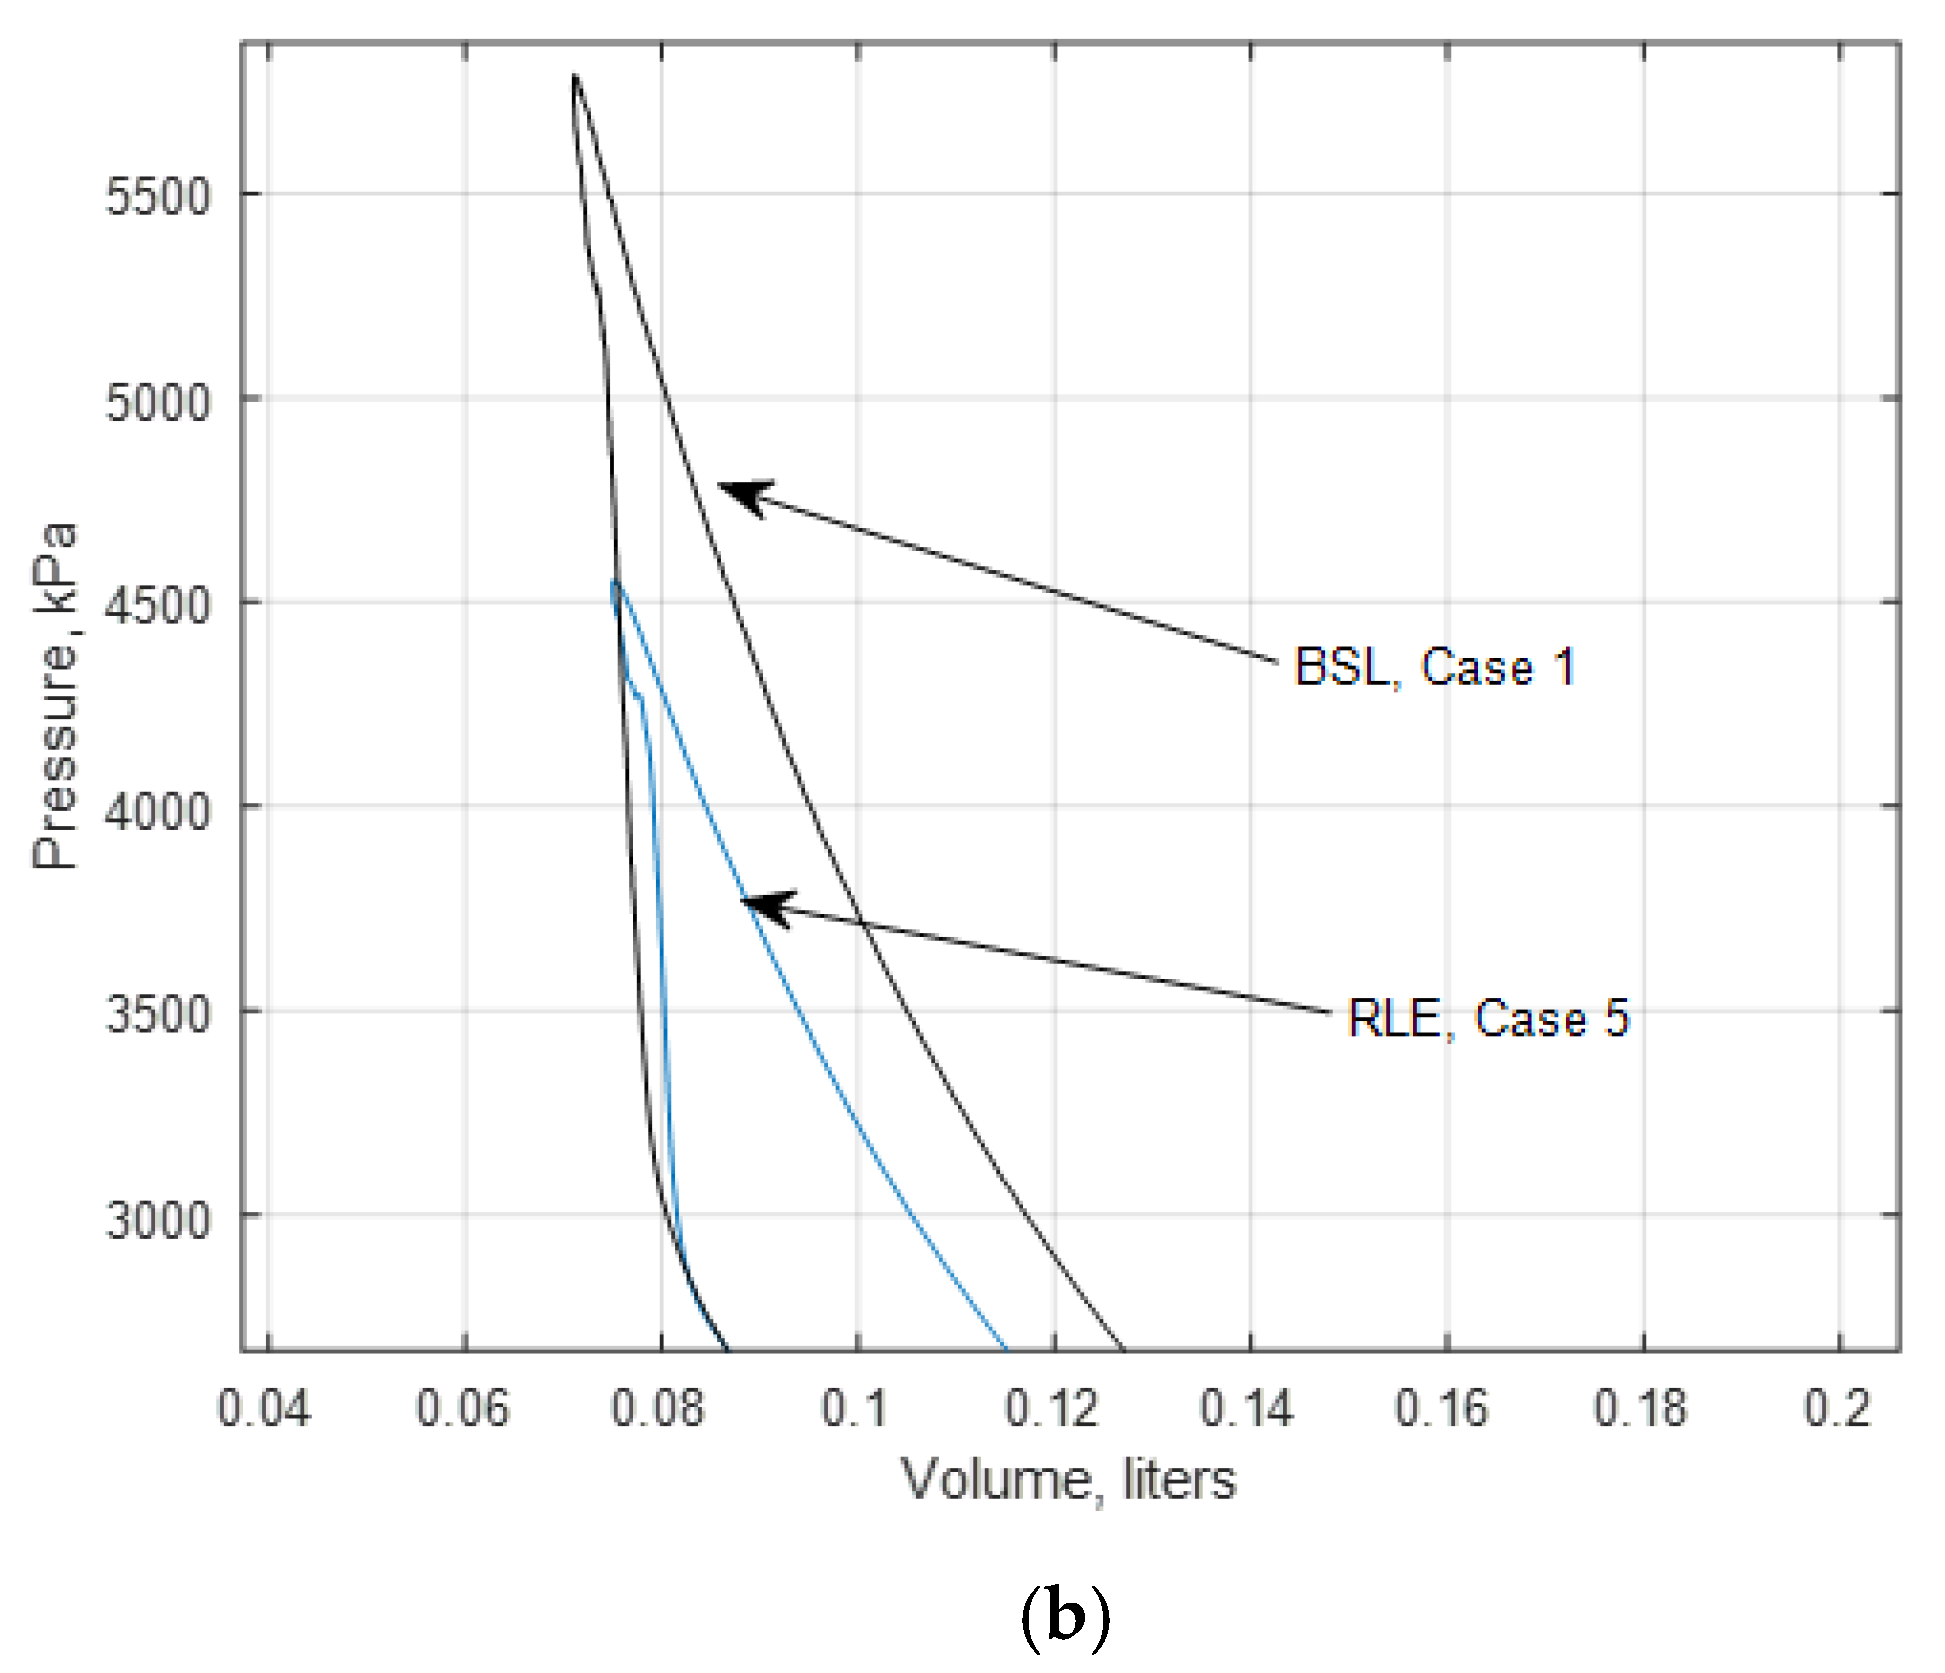
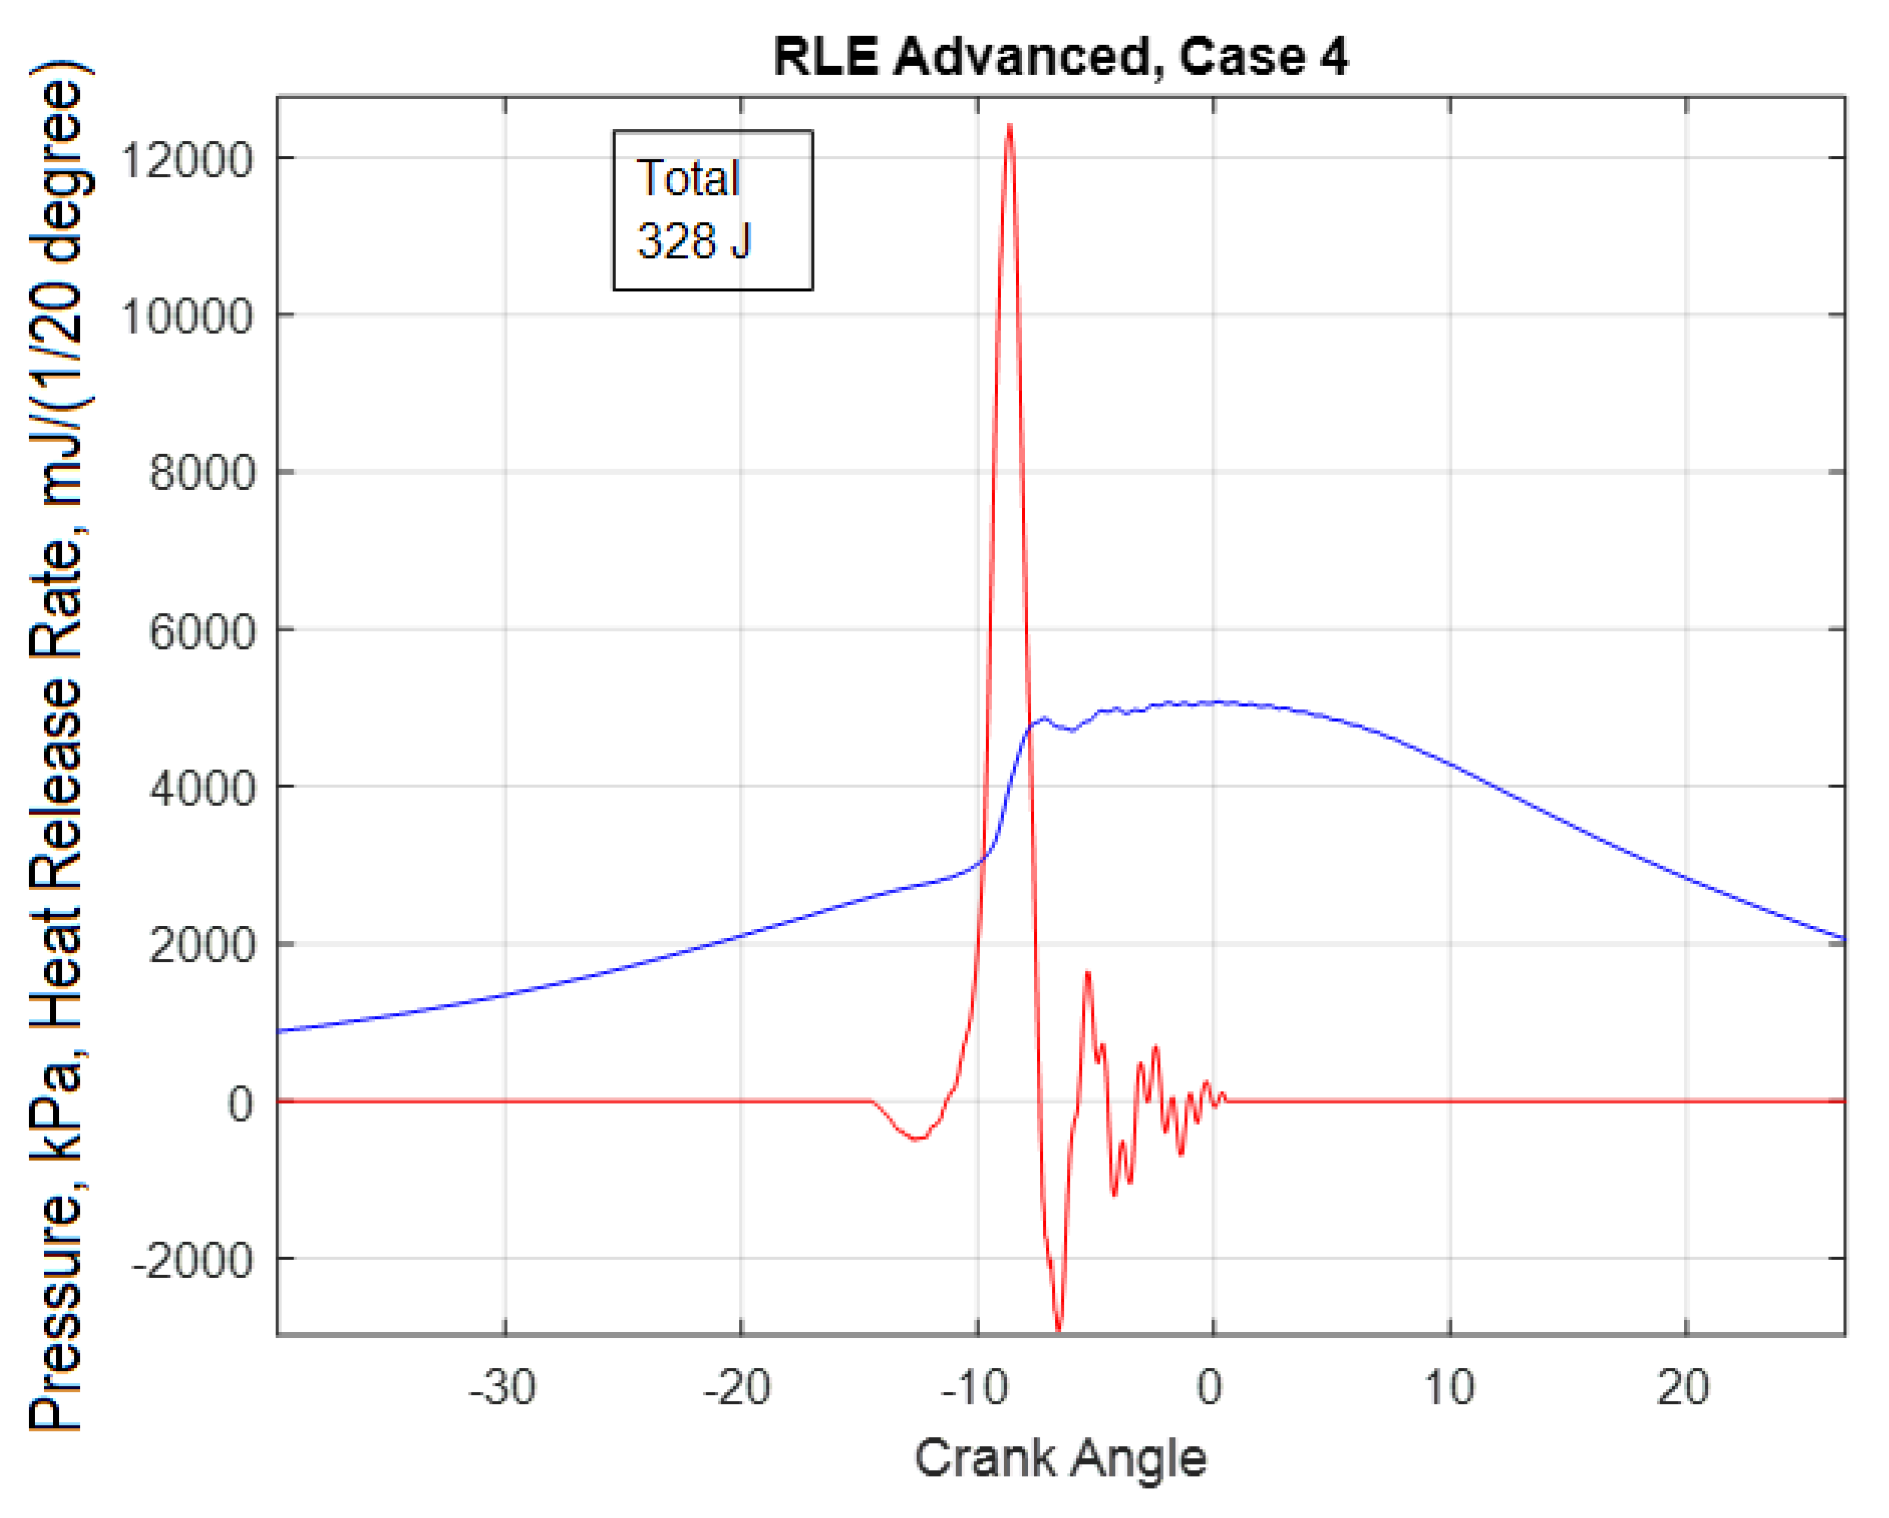
Figure 15 describes Case 4 for the RLE, which had a more advanced combustion. This calculation indicates that while the combustion started at about the same time, virtually all the heat was released in the premixed stage, and all prior to the TDC. Note also that the maximum heat release rate around crank angle −8.5 is very high in Case 4, which is responsible for creating the pressure wave noise right at the end of the premixed phase. This pressure wave also causes a local calculated negative heat release rate at about crank angle −6.5, but this noise does not affect the average calculation. The heat release history confirms that the comparisons of PCP-PMP between Cases 1 (BSL, high compression ratio) and 4 (RLE most advanced) were not entirely fair for the RLE because the combustion characteristics of Case 4 will generate a higher PCP for the same total heat released per cycle. The comparison of the total heat released per cycle of 487 J for the BSL to 328 J for the RLE indeed shows a larger margin for the RLE, a reduction in total heat input by 33%, while the simplified PCP-PMP method only yields 18%.
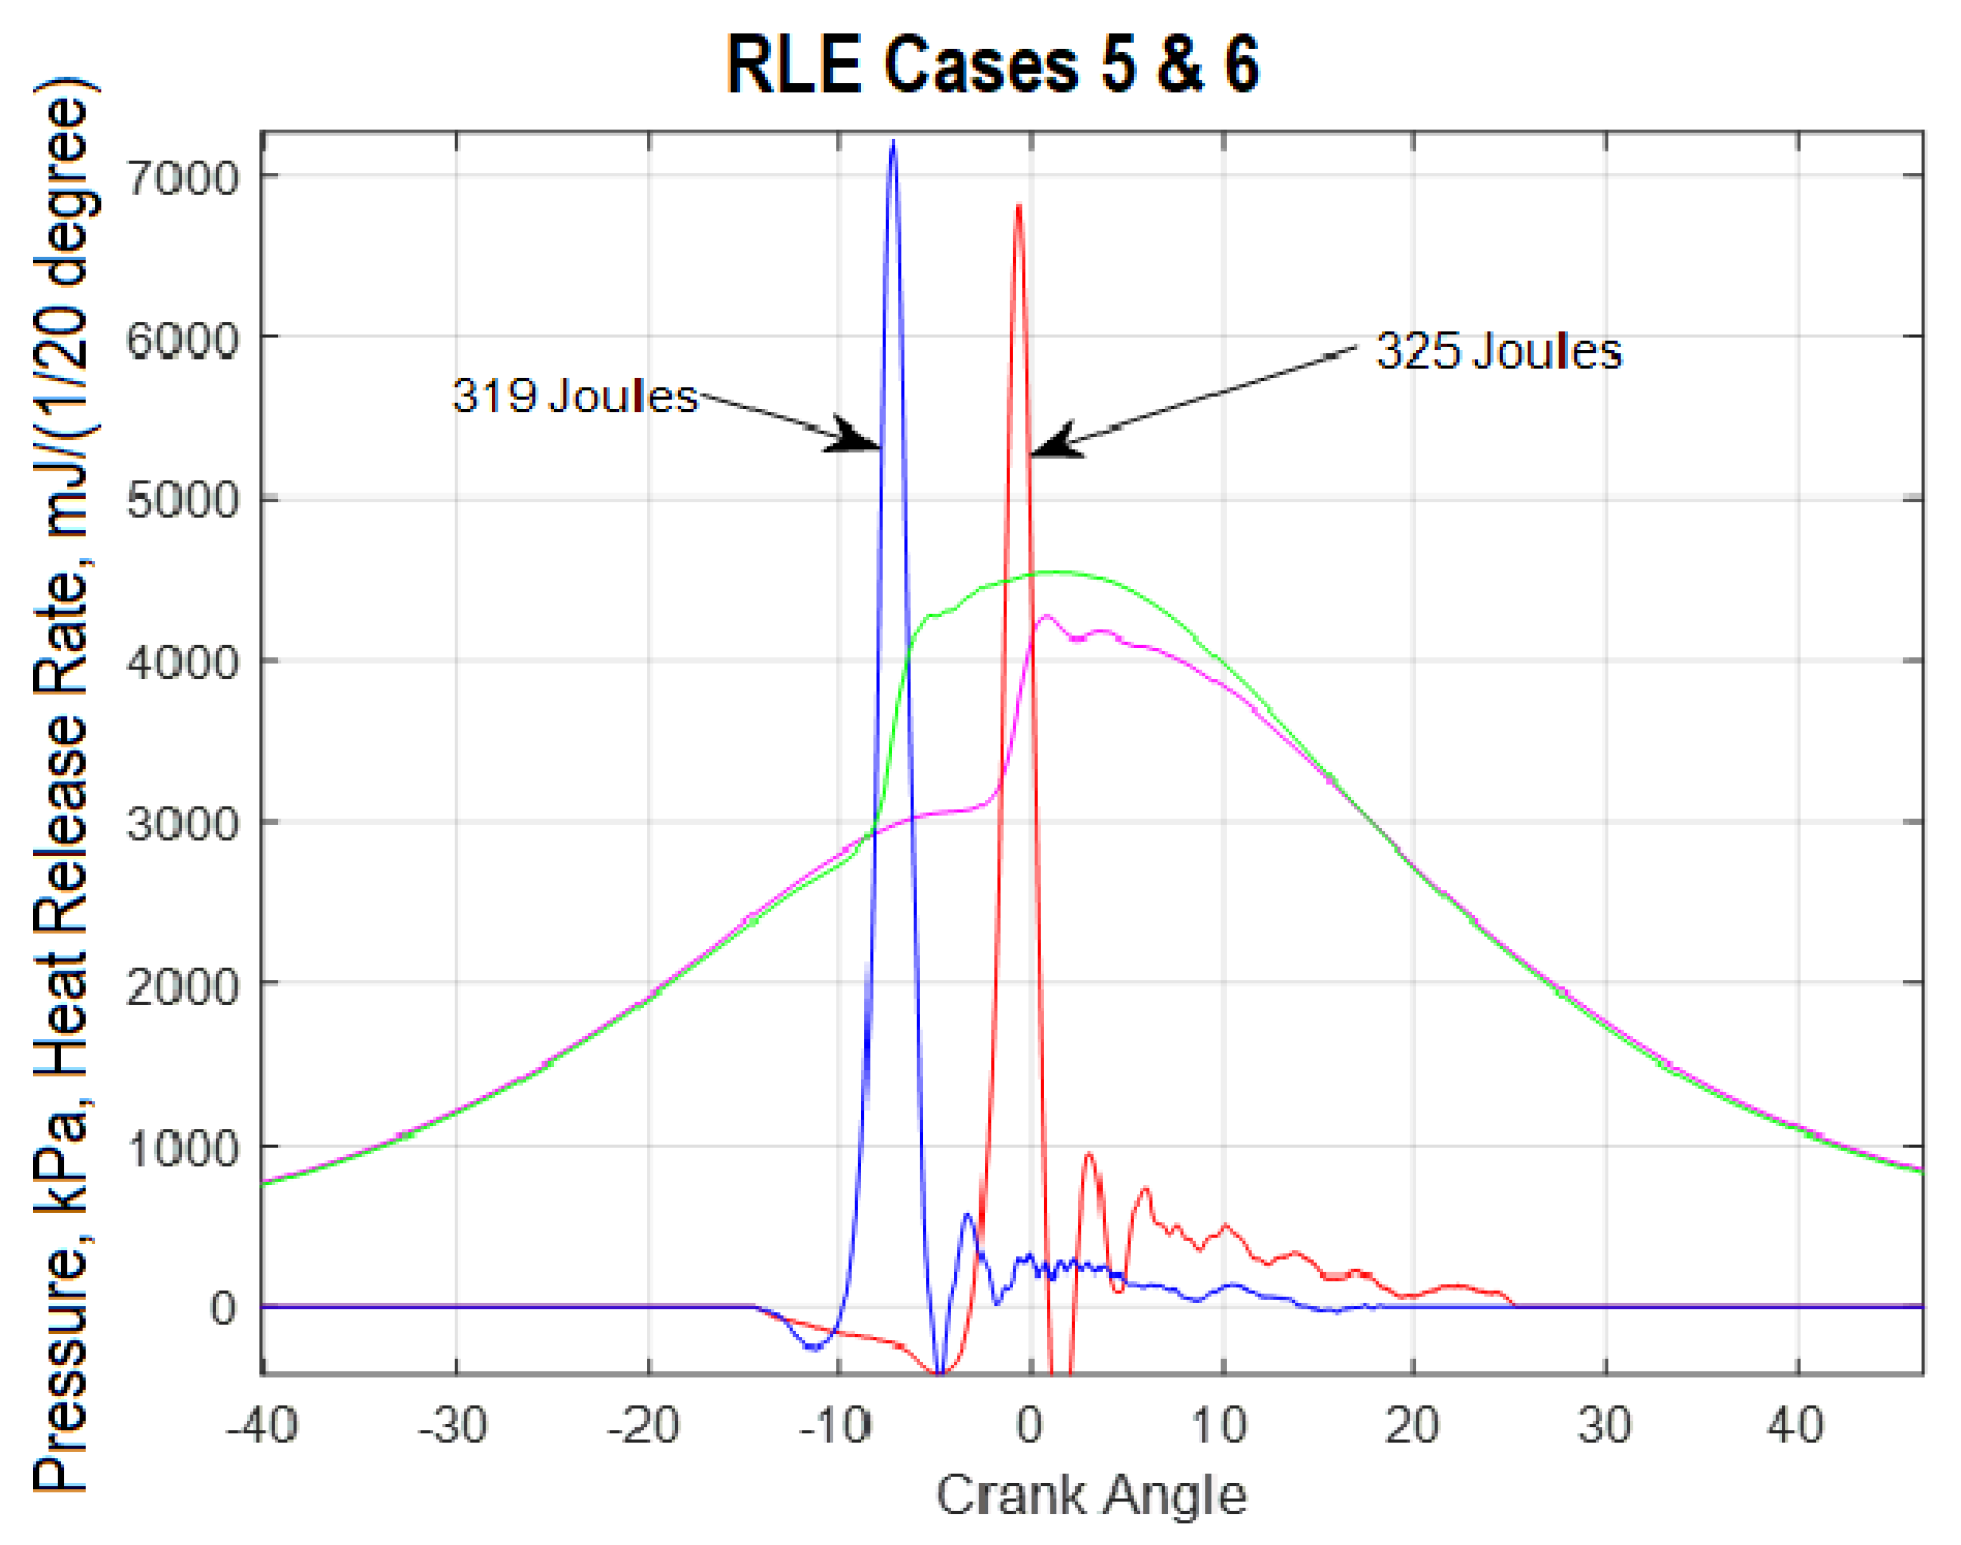
Figure 16 shows the heat release rates for both RLE Case 5 and Case 6 (retarded yet another 4 degrees). The first lesson from Figure 16 is the effect that the combustion retardation has on PCP. As expected, as the injection timing is retarded, the PCP drops. This will obviously happen on both BSL and RLE. Therefore, in the PCP-PMP method, it is important to compare cases with similar injection timing as expressed by the location of the heat release with respect to the TDC.
Now, we consider if, indeed, RLE Case 5 (retarded by about 4 degrees) is a more fair comparison with BSL Case 1. Further examining Figure 16, we note that in Case 5, we can see that the maximum rate of combustion is much reduced compared to Case 4 (Figure 15), causing a reduction in the pressure wave noise, which also reduced the negative heat release just after the premixed combustion, and that some combustion continues after the TDC, much like Case 1 of the BSL shown in Figure 14 or Figure 11. The phasing of the maximum heat release rate, the beginning and end of the premixed combustion (starts at −10, ends at −5), and the small tail end of heat release that stretches to just after the TDC, all match between the two cases. Case 4, in contrast (Figure 15), has a much higher maximum rate of heat release, and the premixed event was just about over at −7.5 crank angle degrees. This confirms that Cases 1 and 5 are better matched for the PCP-PMP method comparison. The simplified PCP-PMP method yields a 38% reduction in fueling, while the integrated heat release comparison (319 vs. 487 J) yields 34.5%.
If we compare RLE Cases 4 (over-advanced) and 5, given that we have identical integrated heat release (heat per cycle), one would expect that the CO2 emissions would also be about identical. However, Table 1 and Table 2 show a large difference in CO2 concentration. This discrepancy is caused by the fact that our heat release calculation is adiabatic and does not consider the loss in indicated thermal efficiency caused by the excess heat loss of Case 4 (in Case 4, we know that the heat loss is greater due to the longer exposure of the combustion chamber walls to high temperature and pressure). In other words, our analysis only considers the heat release that was directly used to raise the cylinder pressure and perform mechanical work, and not the heat lost to the combustion chamber walls. The indicated thermal efficiency with respect to expansion ratio, however, is identical, which is consistent with the similar values to the total adiabatic heat release. We can differentiate, however, between the friction reduction and fuel consumption reduction. The friction reduction is likely directly proportional to the adiabatic total heat release. However, the reduction in fuel consumption at idle will be proportional to the total heat release (which includes the heat lost to the combustion chamber walls). Brunt and Pratts [9] suggest that the actual heat release is about 15% higher than the adiabatic heat release. Therefore, the percentage reduction in fuel consumption may prove to be 15% higher (i.e., a 30% value would be 34.5%). We are planning on performing fuel flow measurements in the future.
Given that the PCP-PMP method is corroborated by the more sophisticated heat release rate calculation, we can also compare Case 5 with Case 2 (28% benefit for the RLE), as well as Case 3 with Case 6 (20% benefit for the RLE even though Case 6 is not entirely warmed up). It is only reasonable for the RLE margin to be reduced when the timing is retarded, as the pressure loading on the BSL piston assembly is relieved (but also, the RLE was not fully warmed up). However, even with a reduced compression ratio for the BSL compared to the RLE, the substantial friction reduction persists. The trend of greater fMEP reduction at increasing pressure loading (i.e., higher loads) will likely persist (based also on the SVE experience), but unfortunately, the testing precision will have to be improved, since a smaller fraction of the fuel energy will be expended towards overcoming internal friction.
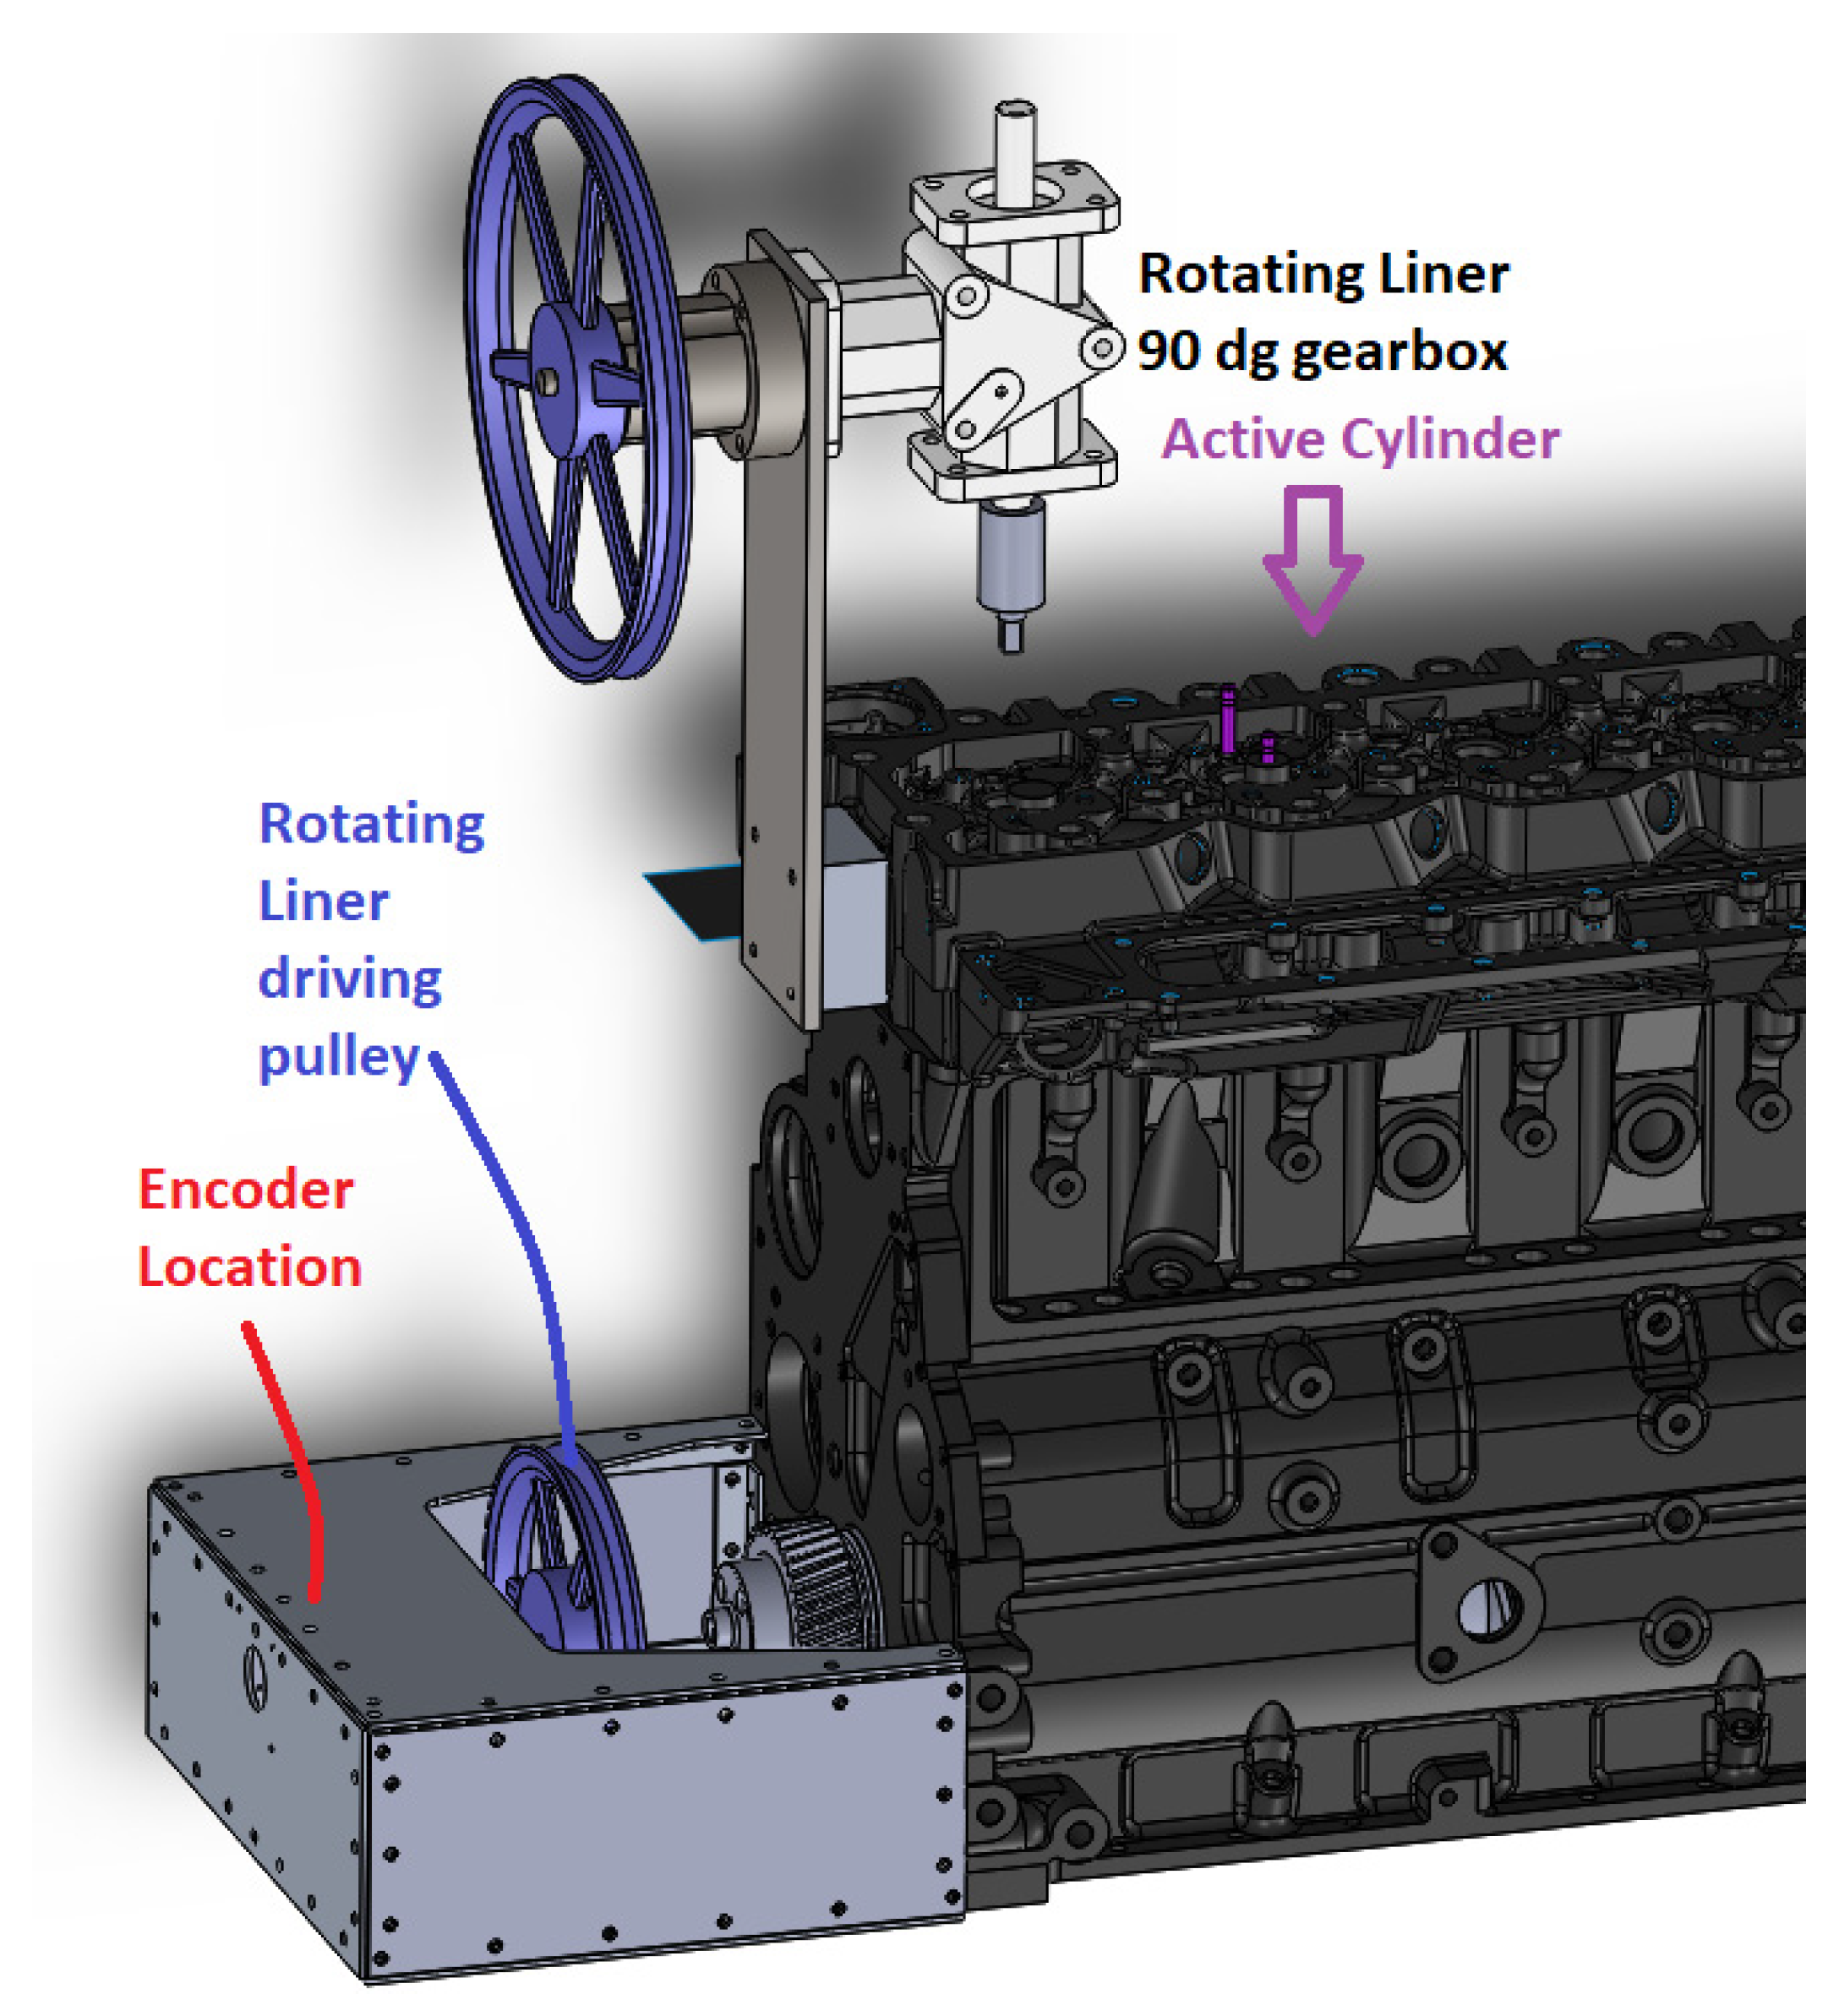
A sensitivity analysis of this heat release calculation was conducted to compare the estimated magnitude of the friction reduction of the RLE at idle with the potential error. As discussed above, it was calculated that BSL Case 1 had approximately 4 cc lower clearance volume (the relatively large difference in peak pressure was partly due to valve timing and excessive valve lash that caused an early intake valve closing, plus slightly different camshaft specs). Additionally, there is approximately +/−0.25 crank angle error on the TDC of the BSL for Case 1, plus some errors in the real piston location as opposed to the encoder position, due to the torsional vibrations mentioned earlier (these are more pronounced in the RLE, where the liner driving mechanism adds a torsional spring and flywheel upstream of the encoder, see Figure 10). Therefore, we did a test calculation of the BSL total heat release, assuming extreme errors of 1 full degree TDC shift (towards the direction where the heat release would decrease), plus a reduction in clearance volume of 10 cc instead of 4 cc, which would also reduce the total heat released per cycle (if the clearance volume was that much lower in the BSL, we would not have had reduced the motoring pressure via the minor changes performed prior to resurrecting the BSL unit). Even at this extreme range of parameters, which is far outside the confidence level, the BSL heat release is still 396 J per cycle, or 24% higher than RLE Case 5. The main reason why the heat release calculation is insensitive to the TDC location is that even in Case 1, most of the heat release occurred substantially before TDC. If the premixed combustion took place near TDC, then it is very likely that the calculation would show more sensitivity to TDC location and clearance volume. In other words, given the nature of combustion for both engines for most cases, the integrated heat release calculation is equivalent to the PCP-PMP method. The margin of error on the simpler method is obviously very low as the experimental error is very low compared to the difference.
Again, it is unfortunate that we do not have an electronic fuel injection system so that we can directly control the fuel injection rate and timing. However, this heat release rate analysis explores the direct results of fuel injected, and therefore, more than compensates for the above defect. A lot of trial and error is required to obtain comparable cases, but we have proven that we have accomplished that. Our methods may lack precision, but the margins calculated are substantially higher than the margin of error.
Comparing BSL Case 3 and RLE Case 5 based on the CO2 emissions yields a larger margin for the RLE. We cannot explain the variation, (other than the possibility that the increased adiabatic heat release also generates increased heat loss and amplifies some of the fuel consumption of the BSL, but this is not sufficient to explain the difference). We took the CO2 numbers twice for both cases. Given some variations in the valve timing and volumetric efficiency of the two engines, we tend to believe the pressure data more.

3.8. Extrapolation to a Complete Engine

In this section, we will describe a friction energy accounting scenario, in order to extrapolate the potential reduction in the idle fuel economy of a complete 4BT, if we had indeed converted all cylinders, and we were comparing the 4-cylinder RLE to a complete 4-cylinder baseline engine. 
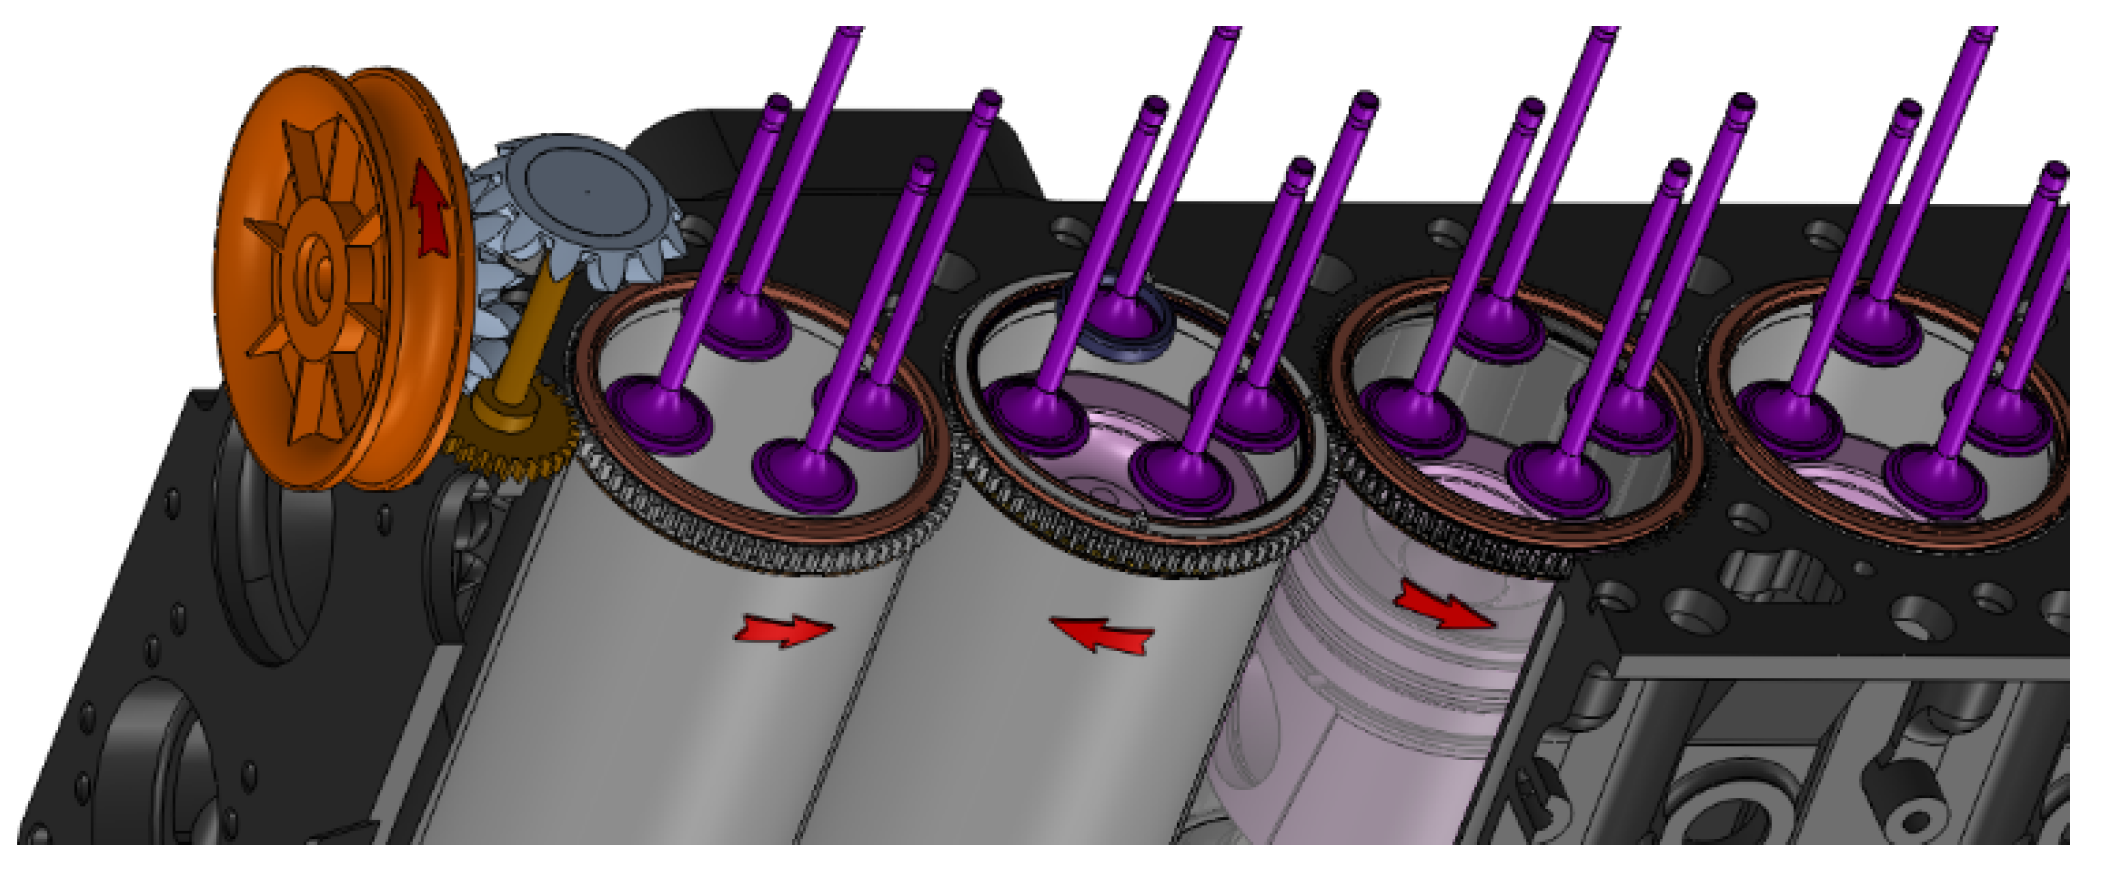
Figure 17 shows the conceptual CAD of a multi-cylinder RLE. In this CAD representation, all the design features of the rotating liner components as fabricated for this prototype are reproduced so that the performance characteristics of this prototype would be perfectly duplicated without any changes, and would fit in the existing block.
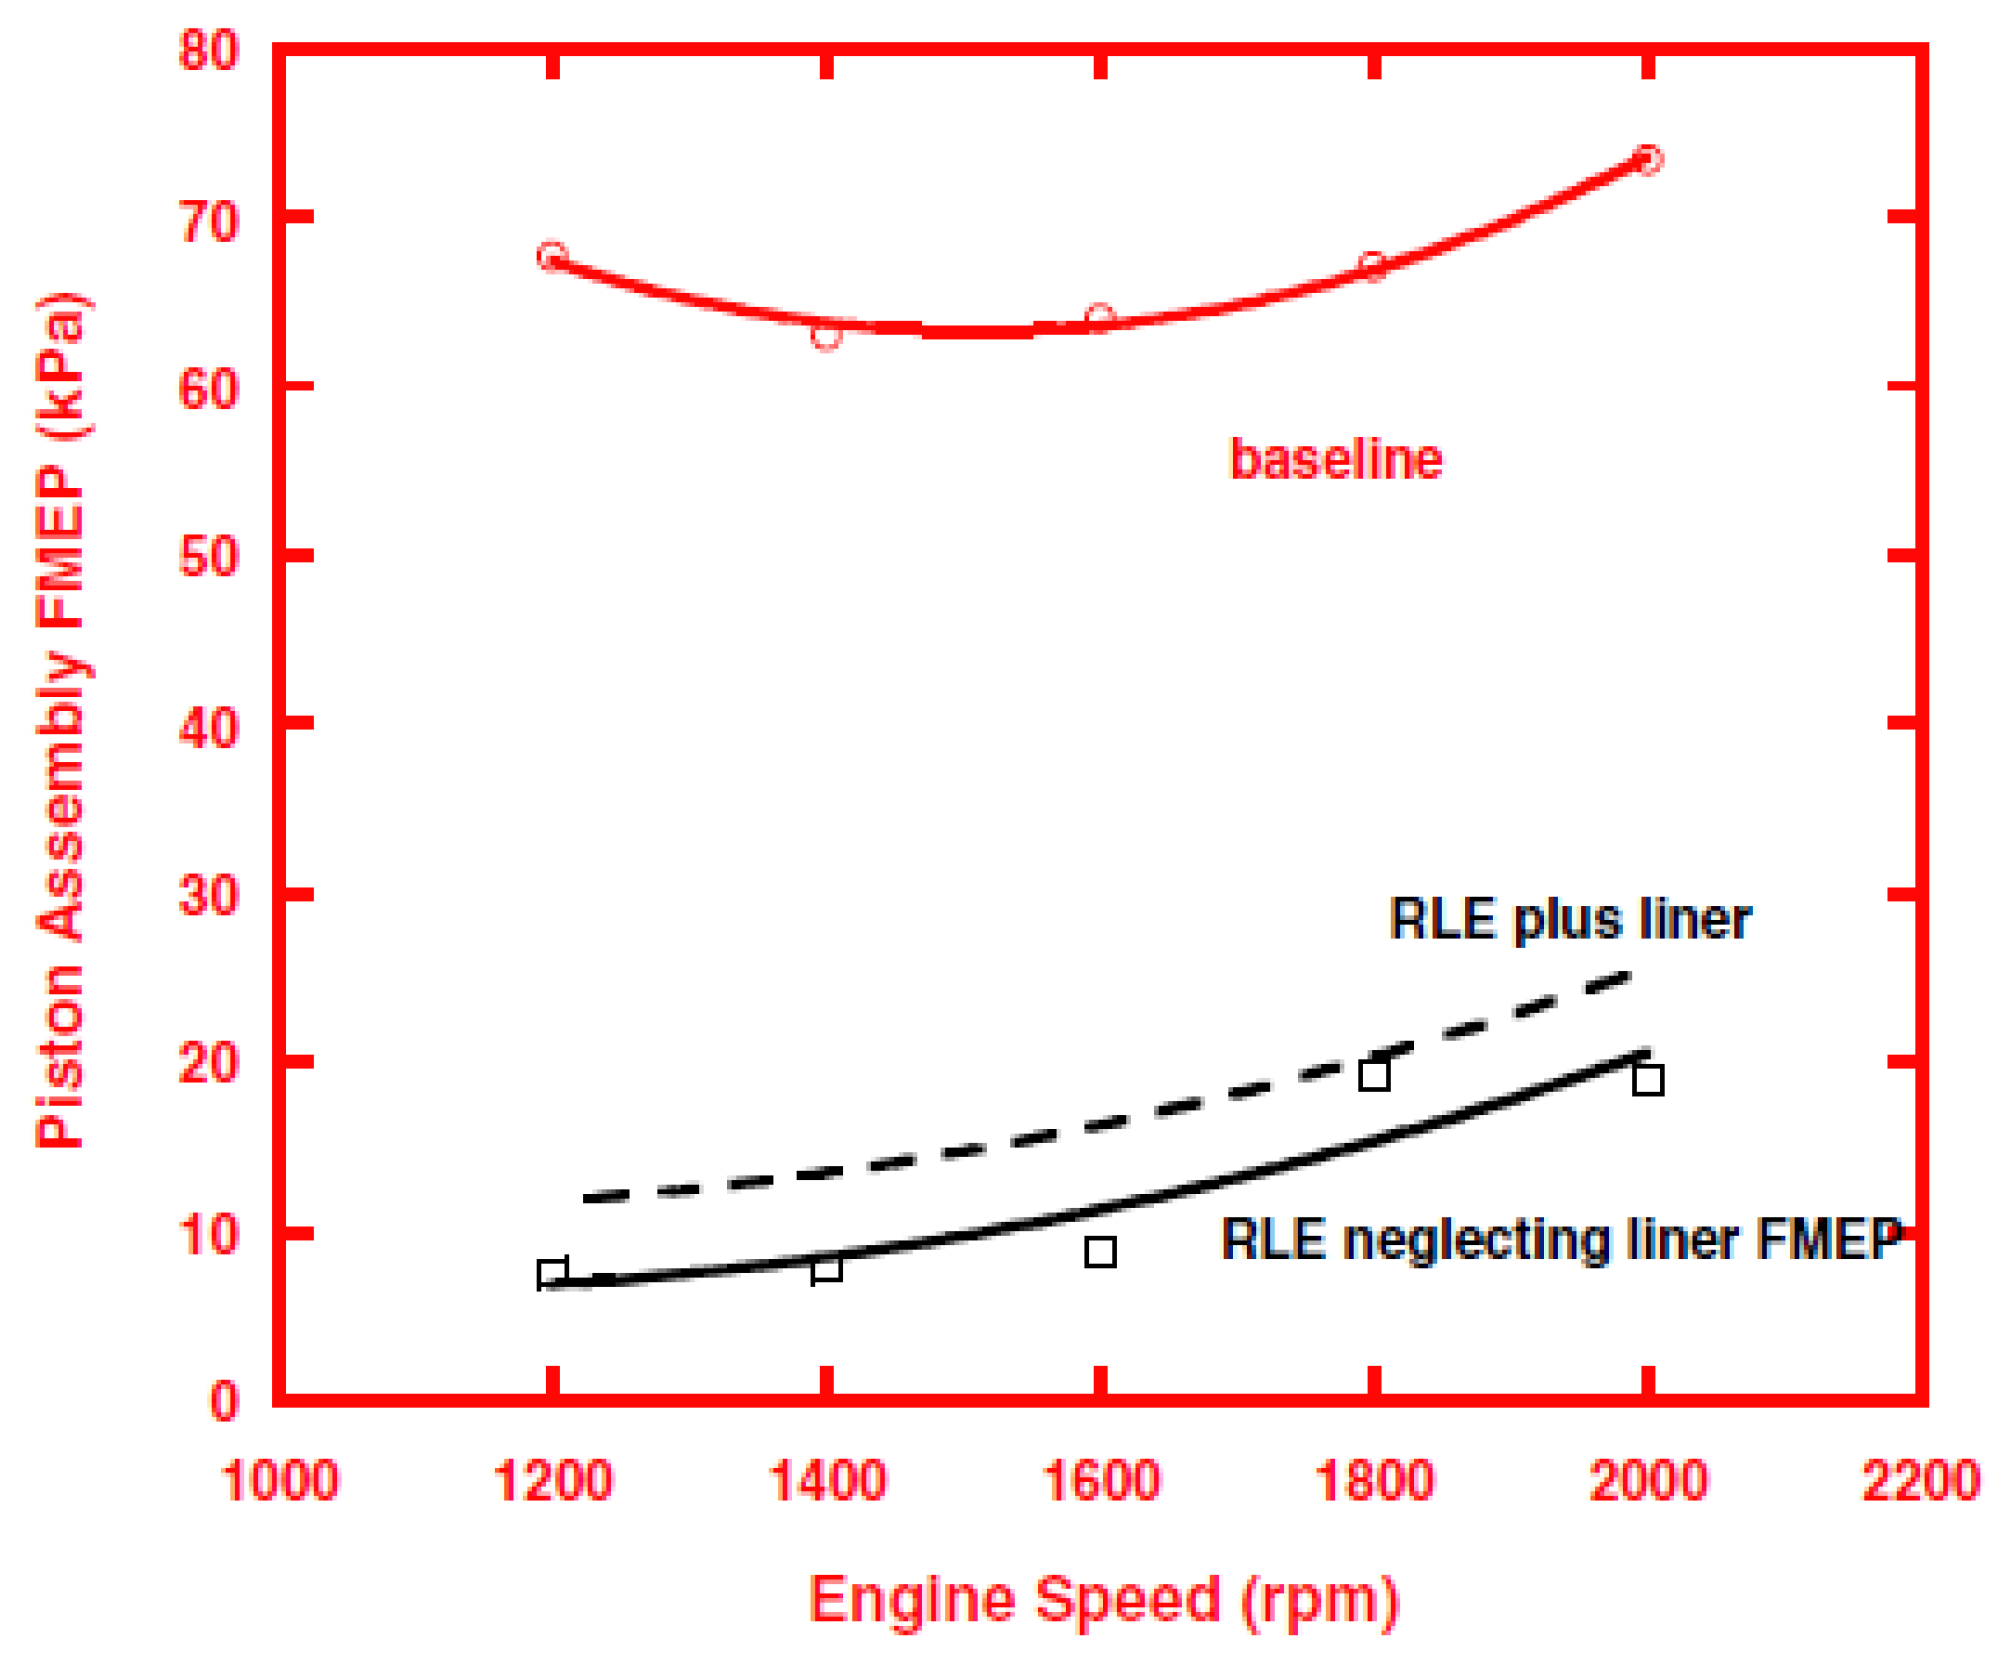
Table 3 shows a likely percentage distribution of component friction for the original Cummins 4BT, and how the RLE reduces it, in order to approximate the measured friction reduction via analysis of the combustion characteristics of the two single cylinder engines. The numbers assigned fit general friction distributions that are reported in the literature. Note also, according to a motoring tear down friction test of a diesel engine published by Stanton (2013), at 750 rpm, the piston assembly (plus valves, but the valvetrain is a small contributor) was the dominant source of friction by about 75% of the total, so the Table 3 numbers may be a bit conservative concerning the piston assembly’s contribution (note, Stanton’s graph does not properly assign the removal of the cylinder head to the piston assembly; this is a typical error in published tear down tests, which are often performed in the wrong order, Dardalis 2019). The units in Table 3 are arbitrary, adjusted to give 100% for the 4-cylinder BSL.
In the column that corresponds to the 4-cylinder BSL, the crank 10 + 10 corresponds to 10% for the connecting rod bearings and 10% for the main bearings. The accessories include the injection pump, which will have a substantially reduced power requirement when operating on one cylinder. All injection pump pistons accept fuel during engine operation, but only one piston compresses the fuel against the injector—the other three pistons just return the fuel to the tank without compressing it. The piston assembly contribution for the RLE single cylinder was reduced until the RLE single-cylinder total friction was about 25% reduced from the single cylinder BSL and so as to be consistent with the measurements presented above. The result is a total friction reduction of over 40%. The numbers in Table 3 illustrate that the measured 25% friction reduction in the single-cylinder RLE will receive a considerable amplification when a complete four-engine is converted. The dramatic piston assembly friction reduction in Table 3 from 14.25 to 5.0 is consistent with the tear down presented by Dardalis et al. (2005), where a similarly dramatic friction reduction was recorded for the light-duty RLE under motoring conditions.
The fMEP shown by Stanton (2013) is about 105 kPa, but this is a motored condition which is known to yield reduced fMEP. The fMEP of a regular diesel at firing idle at the above coolant temperature is about 137 kPa, based on the friction model by Chen and Flynn (1965) and presented again by Dardalis (2012), updated with coefficients that are a better match for modern engines. The calculation used the mid-range of all coefficients except for the hydrodynamic term, which we used the highest value, justified by the relatively low coolant and oil temperature. The above friction model is semi-empirical and calibrated to match a large number of experimental datasets by Southwest Research Institute. The calibration was performed in the late 1990s when the Cummins 4BT engines were being tested and built. Based on our information, Cummins is currently using a similar model with coefficients of about similar values. If we assume that the total friction energy of the four-cylinder BSL in Table 3 is distributed among all 4 cylinders, and that the 100 units of friction energy corresponds to 137 kPa, one can calculate the predicted burden for the single cylinder BSL and RLE. The operating IMEP of the single cylinder BSL would be 137 kPa/100 × 36.75 × 4 = 201 kPa. The IMEP for the RLE would be 137/100 kPa × 27.5 × 4 = 150.7 kPa. Indeed, our IMEP calculation for BSL Case 1 is 208 kPa, while the RLE cases vary between 155 and 180 kPa. As discussed in Section 3.2, the IMEP numbers are not reliable due to the torsional vibrations that upset the volume calculation (likely more so for the RLE with the additional shaft portion that drives the rotating liner), but the order of magnitude IMEP seems to be in general agreement. The RLE seems to reduce the fMEP by about 50 kPa at idle. Since the boundary friction assembly term that the RLE minimizes increases at higher loads, the fMEP reduction will increase at these higher loads. We expect that future research will confirm that.
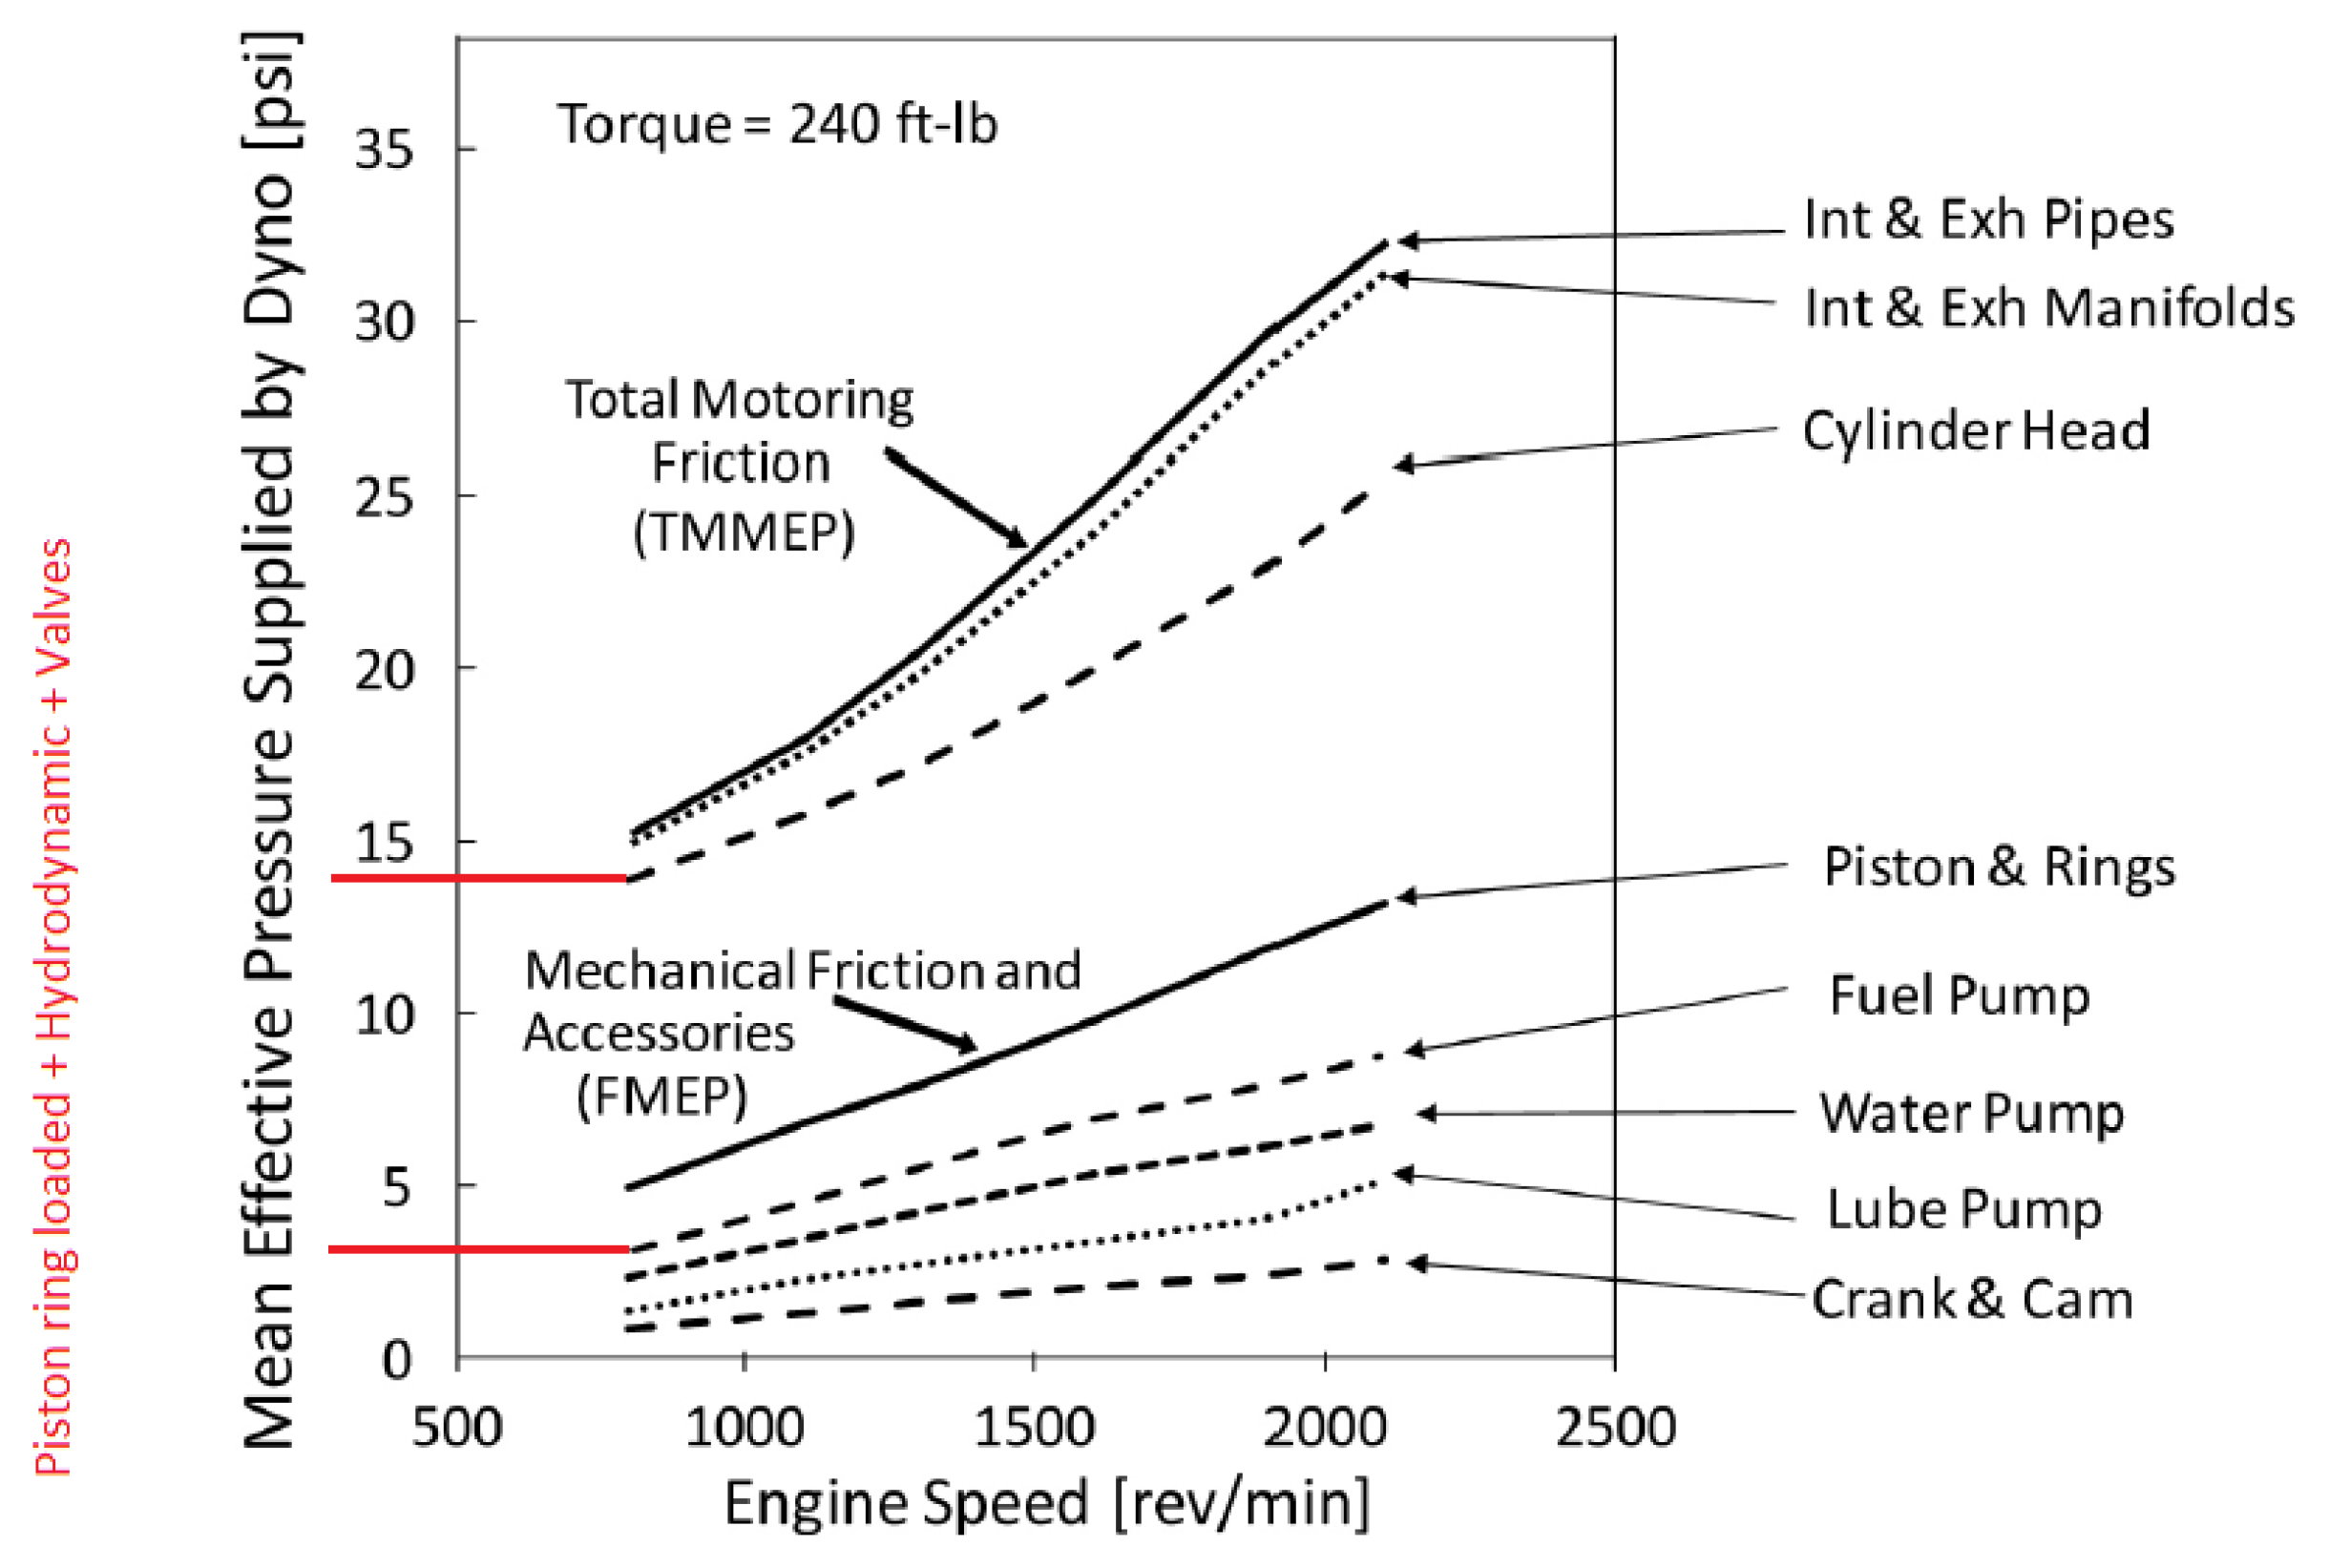
Some researchers may find it difficult to believe that a piston friction reduction method can reduce total engine friction by 50 kPa or more. Part of the reason for this resistance is the many erroneous test results reported by the literature. While usually, the researchers mention that confidence in the absolute numbers of their reported fMEP is low and only the reported trends and margins are useful, nevertheless, readers tend to accept the numbers as given. Stanton et al. (2013) show (once corrected) that the piston assembly-loaded friction, plus unloaded piston assembly friction (boundary oil control rings and the hydrodynamic terms) and the valvetrain contribute 69 kPa for motoring conditions at the lowest rpm range. This graph is reproduced as Figure A6 in the Appendix A. Kim et al. (2005) [6], in a similar motoring tear down of the light-duty RLE and BSL engines, showed a friction reduction of 50+ kPa under motoring conditions. These motoring tests are relatively simple, so the confidence level in the absolute numbers is high. Fedden et al. [
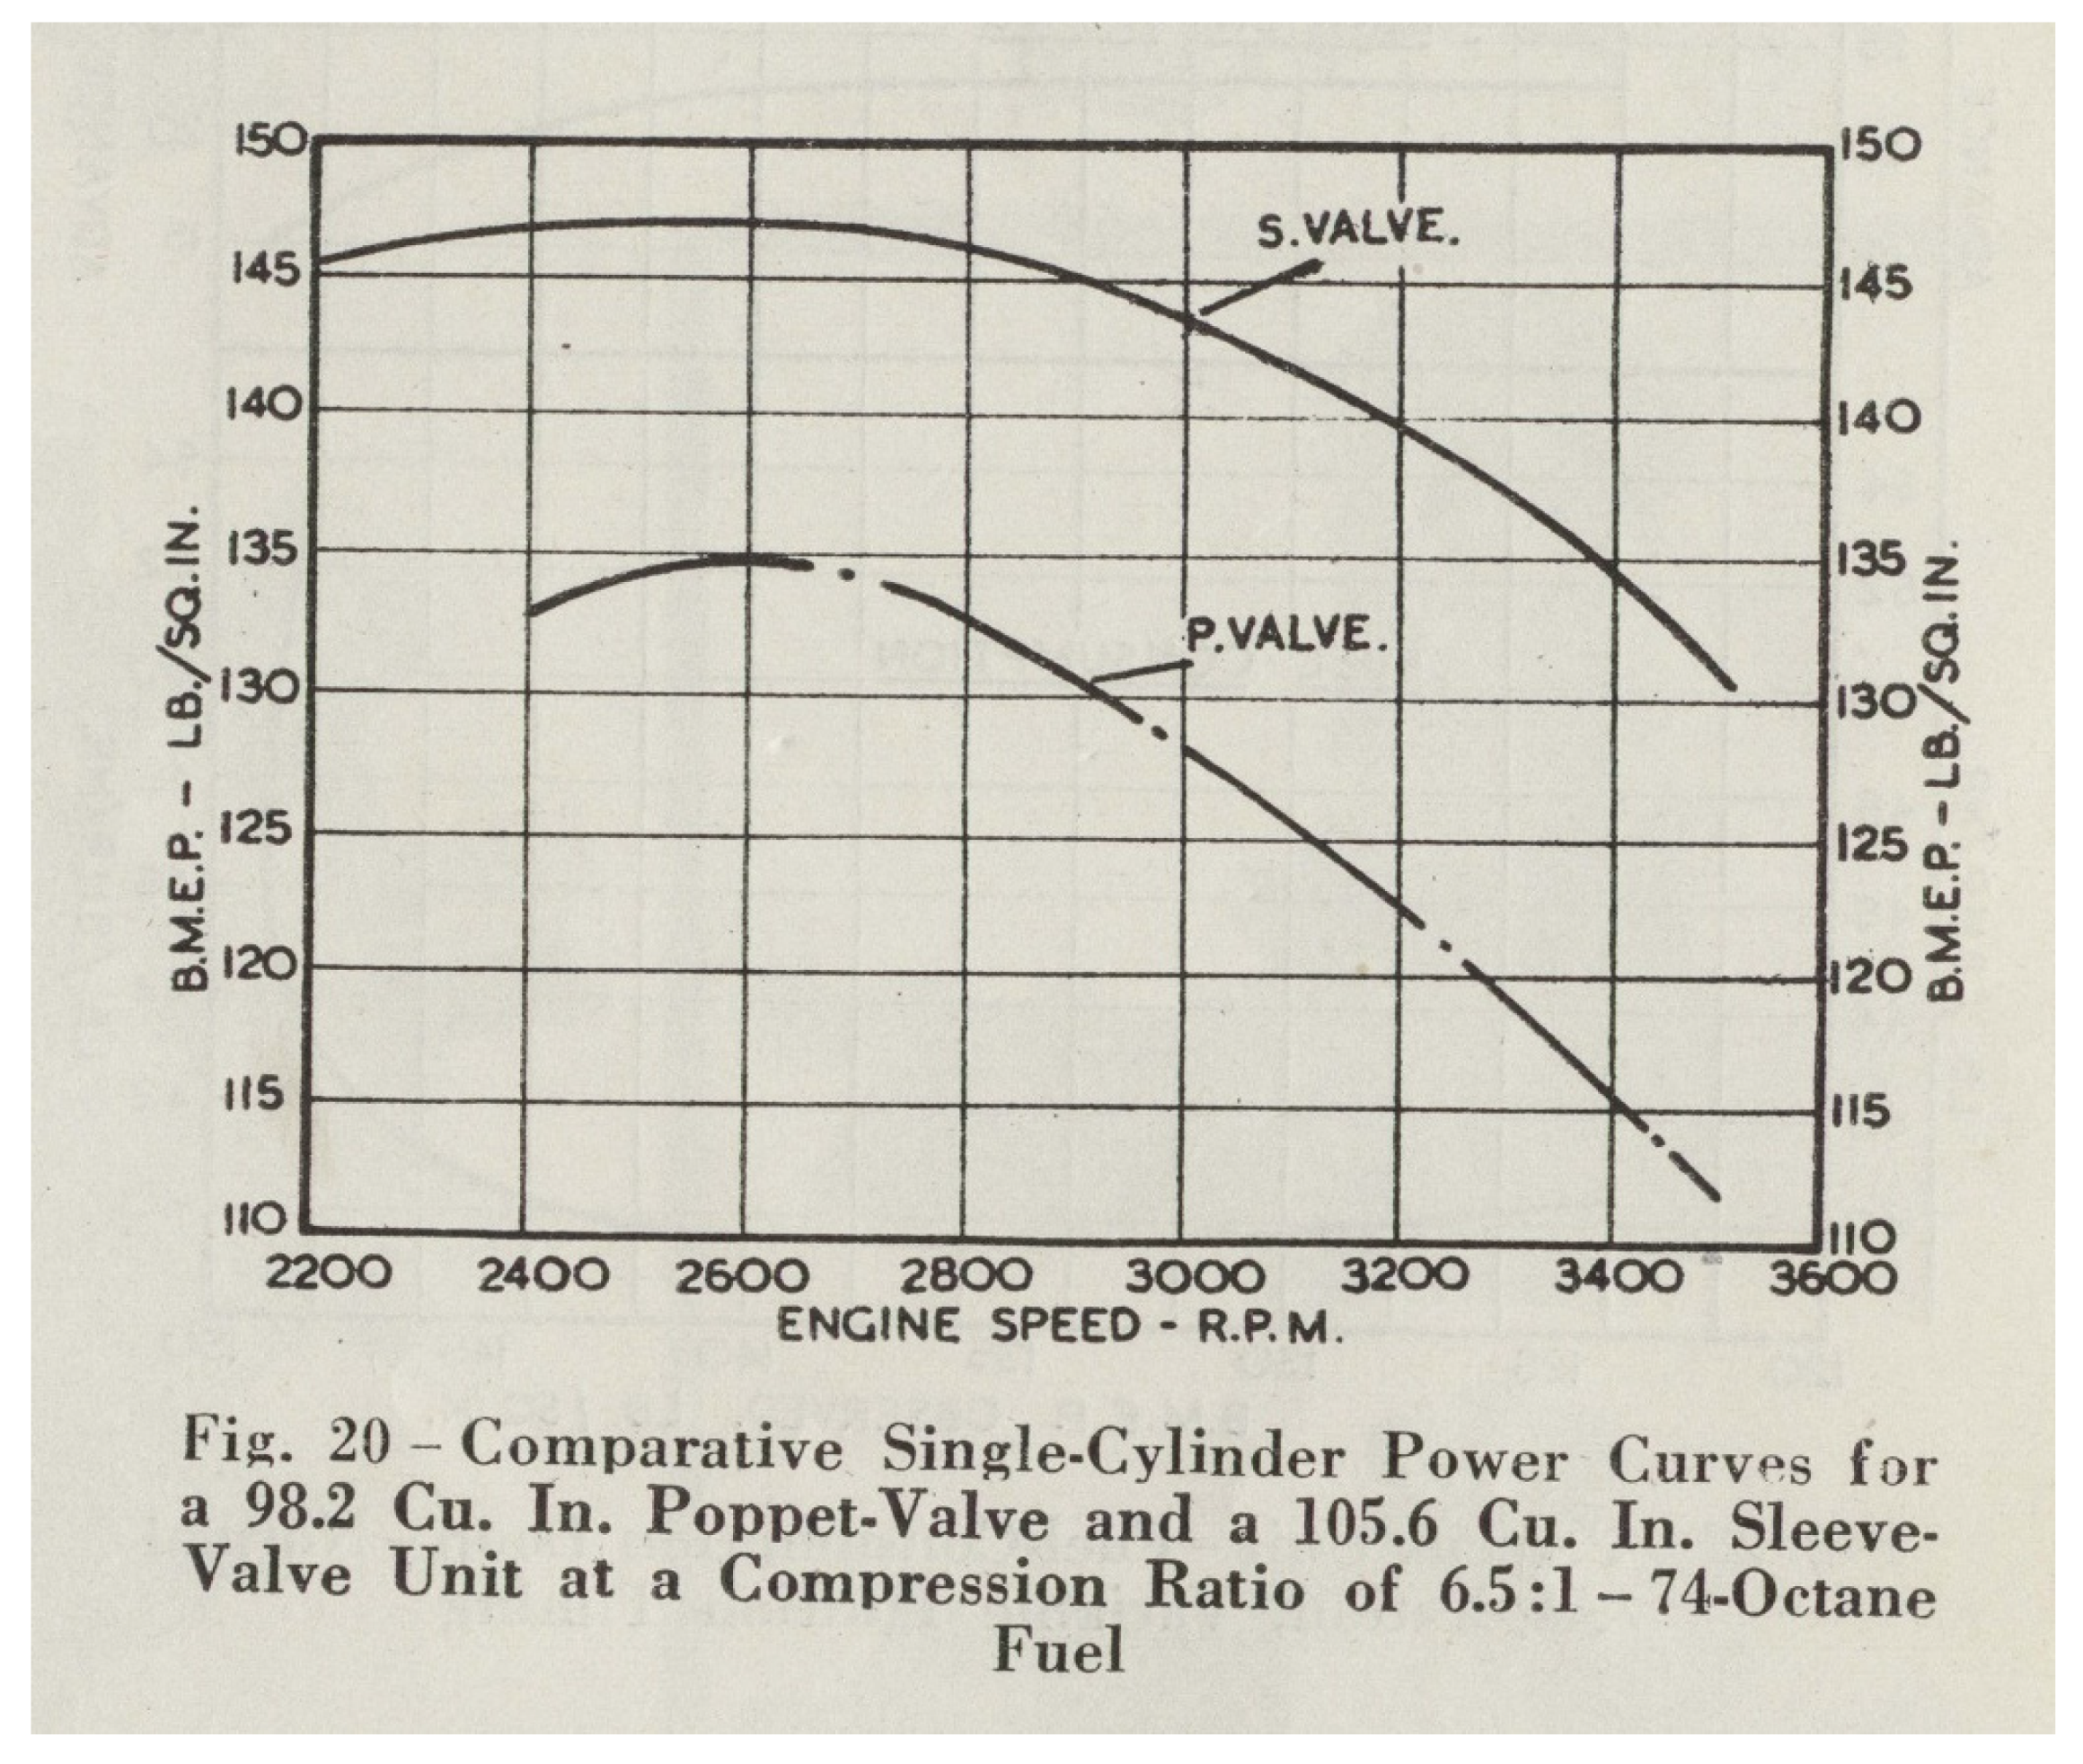
7] presented two naturally aspirated spark ignition engines, one a conventional poppet valve, DOHC (dual overhead cam), and 4 valves per cylinder with stationary liners, and one a sleeve valve (rotating cylinders close to TDC), both operating at a compression ratio of 6.5:1 and at wide open throttle (shown in Figure A8 in the Appendix A). The sleeve valve unit produced about 100 kPa more BMEP, even at a low engine speed where any possible advantage in volumetric efficiency of the sleeve valve cannot be significant. Note that the pressure loading of the piston rings of these two engines is not too far from our idling diesels, due to their very low compression ratio, even though they were operating at full throttle. Therefore, friction reduction of this order of magnitude, if indeed the boundary friction terms are minimized, is possible and consistent with the prior literature. Additionally, as discussed above, if the boundary friction via liner rotation was not indeed nearly entirely removed, the total friction of the RLE would have been substantially higher than the BSL, simply because the high friction coefficient of metallic contact would have burdened not only the piston axial motion (from about 30 degrees before TDC to about 45 after TDC) but also the rotating liner during that period (which travelled about 6.6 cm during that time period, unlike the piston which only travelled about 2.5 cm).
Based on the friction model presented by Dardalis et al. (2012) [5], the friction reduction at idle was expected to be about 25%, but the testing showed that it is 40% or more. Therefore, it may be logical to assume that the 3.5% fuel economy benefit at full load and the 6.8% benefit over the Heavy-Duty FTP derived by the assumptions by Dardalis (2012) may both prove conservative. While the fuel economy percentage improvement will reduce by increasing load because the mechanical efficiency of the baseline naturally increases, the fMEP reduction at increasing load will likely increase, and likely more than the prior modeling suggested. There is a proportionality between the boundary portion of the fMEP that the RLE is reducing/eliminating to the peak cylinder pressure, as the Chenn and Flynn [2] friction model suggests (see Figure A7 in the Appendix A). Furthermore, the 6.8% benefit over the HD FTP (Heavy Duty Federal Test Procedure) was calculated by Dardalis based on data from pre-EGR engines with lower cylinder pressures. Therefore, an RLE applied to a modern heavy-duty truck engine will likely produce much larger benefits than anticipated back in 2012.

3.9. Future Work

The future work is going to move in two directions. First, we will connect the single-cylinder test engines to a dynamometer in order to compare friction under firing conditions. Obviously, this will be more challenging, since the engine friction will be a smaller fraction of the total heat release in the engine, and the PCP-PMP method will be harder to apply. Simultaneously, we are working on fabricating a complete four- or six-cylinder RLE that is expected to make IMEP measurement feasible.

4. Conclusions

The combustion characteristics of the two single-cylinder engines, the rotating liner unit, and the baseline unit were compared. Based on these comparisons, the fuel energy requirement for adiabatic heat input required to operate the RLE unit, including the energy to drive the liner, is between 25 and 35% lower than the baseline engine, which translates into a mechanical friction reduction of the same amount. The analysis presented has a margin of error far smaller than the difference. If one considers the effects of reduced heat loss to the cylinder walls from the reduced pressure rise needed to keep the engine running, the idle energy benefits may be even higher. If the operating temperature was higher, it is likely that the margin would be higher (a higher oil temperature would reduce all other hydrodynamic terms for both engines, and particularly, the parasitic losses of the rotating liner that are all hydrodynamic). This was accomplished without any special optimization of the piston skirt or ring-pack as described by Dardalis 2012. The reduction in friction is of the order of 50 kPa at idle and will likely grow larger with increasing load, based on the friction model offered by Dardalis [5], which was based on the measurements by Chen and Flynn [2] and has been accepted ever since as the standards for predicting diesel engine friction. The friction reduction fraction compared to a complete engine could be of the order of 40% at these low load conditions. The friction reduction percentage will increase at increasing load because the boundary friction of the BSL increases with increasing load (Chen and Flynn [2]; the effect is illustrated in Figure A7 in the Appendix A). The friction reduction fraction will decrease at increasing speed because the hydrodynamic terms for both engines increase, especially the one of the RLE. Dardalis et al. [5] had calculated the fMEP associated with the rotating liner and its seal at about 3.9 kPa at 2000 rpm engine speed, 600 rpm liner speed, and 10 °C oil temperature (these tests were conducted at 71 °C).
In the past 10–15 years or so, many methods of reducing the boundary piston assembly friction have been developed: new piston ring profiles, plateau honing techniques, DLC ring or cylinder coatings, etc. Our baseline engine certainly did not have any of these features. We had new pistons and piston rings in the engines, and the top rings had the traditional symmetrical profile, while the liner of the baseline was well used but still within spec (the cross hatch on the top of the liner was gone as happens fairly early in the life of any diesel engine, but the hone marks were still visible in the mid portion, whereas most engine testing is performed with fresh liners shortly after break-in). All the above methods have limited usefulness in heavy-duty engines, where the engines are expected to be in use long after the effects of the above technologies have faded away (Dardalis [4,10]). Reducing the oil viscosity has some limited effects on engine friction at low loads only, but at the expense of engine life. According to Carden et al. [9], reducing high-temperature, high-shear viscosity by 36% (from 3.5 × 10⁻³ Pa*s, probably 15w40, to 2.26 × 10⁻³ Pa*s, probably 5w30) accomplishes a reduction in friction at low load and 800 rpm of about 5 kPa, and up to 15 kPa at 1400 rpm, while the reduction diminishes to almost nothing for higher loads as the metallic contact intensifies (Carden et al. [9] also explain that the overall fMEP measurements presented were excessively low, and only the differences are important, not the absolute values). Note that if the engine tested by Carden was not a fresh engine and instead was about halfway into its operating life, the benefit may have been even smaller. It is possible that the RLE and its seal will work satisfactorily at the reduced viscosity (the analyses presented by Dardalis et al. [5] were for 3.0 × 10⁻³ Pa*s viscosity and the seal could handle 180 bar peak pressure). It is also possible that the elimination of metallic contact will be sustained at low viscosity, possibly requiring slightly higher liner speeds. Therefore, the low viscosity benefit could be combined with the RLE friction reduction. Another possibly better option for a high efficiency RLE is to use the 15w40 grade oil plus larger clearances for the pistons and bearings, so the hydrodynamic terms can be reduced without sacrificing the load capacity of the bearings as compared to low viscosity and tighter clearances. This lubricant can be lighter on additives and therefore, easier on the exhaust aftertreatment and of lower cost. Additionally, since there will be less wear debris in the oil from the cylinders and rings, the filtration demands may be reduced. The drain intervals may also be extended since there is less reliance on the additives.
Obviously, our parallel claim of much longer engine life cannot be confirmed that easily. The wear reduction that we have proven, however, can only come from elimination of the metallic contact. This will automatically lead to wear reduction. We have not yet proven that at higher loads this mechanism will persist. However, we have proven that the mechanism works with about 50 bar of peak cylinder pressure and 1.4 m/s surface liner speed (which corresponds to the 750-rpm crankshaft speed or 250-rpm liner speed). Under high engine load, the engine speed will also be higher, and the liner surface speed will also be two to three times higher, similar to the Sleeve Valve Engines. There is evidence from Ricardo [11] that the bore wear rate of the sleeve valve engines was one-tenth that of the fixed liner engines of their time, for high BMEP aircraft engines and for industrial diesel engines that operated over tens of thousands of hours and never needed sleeve overhaul (there were no anti-wear or anti-corrosion lubricant additives at the time). It is therefore logical to expect that the dramatic wear reduction will transfer to RLEs, even with light lubricant additive packages, which again could help prolong exhaust aftertreatment, or even reduce the size of the aftertreatment devices. The RLE face seal should not have any appreciable wear either, since it is designed to operate with a relatively high film thickness (Dardalis et al. [12]). The economics of diesel operation may be substantially altered, not only via reducing fuel consumption, but by considerably extending the lives of engines, eliminating the need for on-frame overhauls, reducing the cost of the lubricants, and possibly even extending the life of the aftertreatment devices due to the reduction in anti-wear additives.

Author Contributions

D.D.: Original Draft Preparation, Data Analysis, Experimental Work. M.J.H.: Review and Editing, Supervision, Data Analysis. R.D.M.: Supervision. A.B.: Review and Edition, Data Analysis. All authors have read and agreed to the published version of the manuscript.

Funding

This research received no external funding.

Conflicts of Interest

The authors declare no conflict of interest.

Appendix A

Figure A1. Detail of the rotating liner during a tear down. The active cylinder is number 2. The driving gear is identical in size to the gear on the rotating liner, proving that there is sufficient space for all cylinders to be converted. Lubricant flows under the rotating liner flange, through the radial passages of the rotating liner face, and back to the sump.
Applsci 11 00779 g0a1
Figure A2. Detail of the cylinder head modification. Note that the seal gland area is completely free from carbon deposits.
Applsci 11 00779 g0a2
Figure A3. Motoring test on the BS, establishing its motoring pressure. The engine is revved up and the injection pump is turned off. As the engine continues to rotate, we record the peak pressure. Each division is 10 bar. The x axis scale gives us the speed estimate. The speed here is about 1050 rpm. The peak pressure will drop slightly to 750 rpm, but we are using this figure of about 27 bar gage or 28 bar absolute.
Applsci 11 00779 g0a3
Figure A4. First case of new BSL data with advanced injection timing, equivalent to Case 2. Premixed combustion starts at 24–25 bar absolute, which is about 2–3 bar below the motoring pressure. This is how we know that the injection is advanced. Note that the peak cylinder pressure in this case is about 55 bar. The engine was not fully warmed up yet. When we reached 70 °C, the reduced friction allowed the peak pressure to drop down to 44.5 bar gage or 45.5 bar absolute.
Applsci 11 00779 g0a4
Figure A5. BSL retarded injection timing at operating temperature, or Case 3 of Table 1. The fact that these conditions are of a retarded injection timing can be concluded by the fact that the premixed combustion started at a pressure about identical to PMP, indicating that combustion started around the TDC and most of the heat release took place after TDC. For some reason, the premixed combustion is not as well defined in this case, possibly due to the reduced compression ratio. The reading here is 38 bar gage, 39 bar absolute.
Applsci 11 00779 g0a5
Figure A6. Tear down motoring figure copied from Stanton et al. [12]. When the cylinder head was removed, the valve train and the loading on the piston skirt and rings were also removed. The valve train and pumping are of course fairly small, and already partially contained in the removal of the manifolds. The graph erroneously labels the component as the “cylinder head”. It also needs to be remembered that the test shown is under motoring conditions. When the engine is idling and the PCP is about 20 to 30% higher, this energy loss will increase by about the same amount, while all the hydrodynamic and pumping losses will remain about the same. Under load, the loaded piston assembly term will of course grow even larger. The part of the graph shown as “Piston & Rings” represents the hydrodynamic portion of the piston assembly, plus the boundary friction of the oil control rings which is mostly unaffected by cylinder pressure. The RLE in this paper is believed to eliminate a large portion of the friction between the two red lines, plus the oil control boundary friction term.
Applsci 11 00779 g0a6
Figure A7. Snapshots taken from Chen and Flynn (1965). On the left, one of the single-cylinder engines is shown. Note that there are three compression rings per cylinder, as opposed to two piston rings for more modern engines (including ours). This will reduce the pressure loading for the top ring, because the sealing loading is shared by three instead of two rings, and will reduce the metallic contact intensity and therefore boundary friction of the ring pack. This is of course at the expense of an increase in the hydrodynamic friction. On the right, the graph shows the fMEP of the two single cylinder research engines as a function of PCP. These engines are robust, and with a short crankshaft, so they do not suffer from the torsional vibrations that our single cylinders do. Therefore, IMEP measurements are possible. Note that as the peak pressure increases, the FMEP increases as well. Note also that the slope is almost constant for all speeds, meaning that the engine speed only slightly reduces the magnitude of this loss. Note as well that the ER-1 design has higher fMEP and also higher sensitivity to peak pressure. The reasons are first that the ER2 has externally driven accessories, and second that the ER2 has a larger and heavier piston skirt that distributes the combustion load better on the cylinder liner, and also probably generates better consistency on the oil film deposited on the cylinder liner (skirt metallic contact is known to scrape off oil and generate local oil starvation conditions). The magnitude of the fMEP shown may be different on modern engines, partly due to design differences, and partly due to the single cylinder nature of these engines, but the trends persist. Note that the pressure sensitivity term of 0.005 for the ER-2 is very similar to modern engines, which typically ranges from 0.004 to 0.007 based on the design and wear state of the engine.
Applsci 11 00779 g0a7
Figure A8. Comparison of an SVE to a poppet valve engine with 4 valves per cylinder, reproduced from Fedden (1938). Both engines operate naturally aspirated, and with the same compression ratio. Fedden is not concerned as to what portion of the BMEP advantage of the SVE is due to fMEP reduction, and what portion is due to volumetric efficiency effects, but at the low speed range, there cannot be any significant difference in volumetric efficiency.
Applsci 11 00779 g0a8

References

  1. Miura, A.; Shiraishi, K. Investigation of Main Bearing Friction in a Diesel Engine; SAE Technical Paper 890140; SAE: Warrendale, PA, USA, 1989. [Google Scholar]
  2. Marek, S.; Henein, N.; Bryzik, W. Effect of Load and Other Parameters on Instantaneous Friction Torque in Reciprocating Engines; SAE Technical Paper 91072; SAE: Warrendale, PA, USA, 1991. [Google Scholar]
  3. Chen, S.; Flynn, P.Y. Development of a Single Cylinder Compression Ignition Research Engine; SAE Technical Paper 650733; SAE: Warrendale, PA, USA, 1965. [Google Scholar] [CrossRef]
  4. Dardalis, D.D.; Matthews, R.D.; Kiehne, T.M.; Kim, M. Improving Heavy Duty Efficiency and Durability: The Rotating Liner Engine; SAE Technical Paper 2005-01-1653; SAE: Warrendale, PA, USA, 2005. [Google Scholar] [CrossRef]
  5. Dardalis, D.; Matthews, R.D.; Lebeck, A.O. Design Details of the Compression Ignition Rotating Liner Engine. In Reducing Piston Assembly Friction and Liner/Ring Wear in Heavy-Duty Diesel Engines; SAE Paper 2012-01-1963; SAE: Warrendale, PA, USA, 2012. [Google Scholar]
  6. Kim, M.; Dardalis, D.; Matthews, R.D.; Kiehne, T.M. Engine Friction Reduction through Liner Rotation; SAE Technical Paper 2005-01-1625; SAE: Warrendale, PA, USA, 2005; also in CI and SI Power Cylinder Systems and Power Boost Technology, SAE Special Publication SP-1964, pp. 144–156. [Google Scholar] [CrossRef]
  7. Dardalis, D.; Hall, M.; Mathews, R.; Basu, A.; Ozel, T. The Rotating Liner (RLE) Diesel Prototype: Preliminary Testing; SAE Technical Paper 2019-01-0084; SAE: Warrendale, PA, USA, 2019. [Google Scholar] [CrossRef]
  8. Brutt, M.F.J.; Platts, K.C. Calculation of Heat Release in Direct Injection Diesel Engines; SAE Technical Paper 1999-01-0187; SAE: Warrendale, PA, USA, 1999. [Google Scholar]
  9. Carden, P.; Pisani, C.; Andersson, J.; Field, I.; Lanine, E.; Bansal, J.; Devine, M. The Effect of Low Viscosity Oil on the Wear, Friction, and Oil Consumption of a Heavy Duty Truck Engine. SAE Int. J. Fuels Lubr. 2013, 6, 311–319. [Google Scholar] [CrossRef]
  10. Fedden, H.R. The Single Sleeve as a Valve Mechanism for the Aircraft Engine; SAE Transactions; SAE: Warrendale, PA, USA, 1938. [Google Scholar]
  11. Ricardo, H.R.; Hempson, J.G. The High Speed Internal Combustion Engine, 5th ed.; Blackie & Son Limited: Glasgow/London, UK, 1968. [Google Scholar]
  12. Stanton, D.W. Systematic Development of Highly Efficient and Clean Engines to Meet Future Commercial Vehicle GHG Regulations. SAE Int. J. Engines 2013, 6, 1395–1480. [Google Scholar] [CrossRef]
Figure 1. Instantaneous frictional torque of a single cylinder Diesel [2]. This particular case examined the effect of lubricant viscosity in instantaneous friction. The unclear legends in the figure refer to the oil temperature (57 °C) and the load.
Applsci 11 00779 g001
Figure 2. Comparison of the micro-scratch structure in the Rotating Liner Engine (RLE) and a conventional engine on the cylinder liner close to the piston ring reversal.
Applsci 11 00779 g002
Figure 3. Hot motoring friction of the light-duty RLE compared to baseline, borrowed from Kim et al. (2005). The x axis shows the engine speed, and the y axis shows the measured motoring FMEP for the two engines. This was performed after the tear down process allowed the isolation of the piston assembly FMEP from the other terms (i.e., crankshaft, camshaft, etc.).
Applsci 11 00779 g003
Figure 4. Block of the RLE diesel prototype. The driving gear could be replaced by another rotating liner, so the engine could operate as a complete four-cylinder 4BT RLE.
Applsci 11 00779 g004
Figure 5. Details of the rotating liner face seal features. The copper head gasket only needs to seal oil and coolant. This picture is shown again in the Appendix A with a higher resolution.
Applsci 11 00779 g005
Figure 6. Rotating liner pulled a few inches out of the block, exposing the outside surface.
Applsci 11 00779 g006
Figure 7. Cylinder head, showing the head insert that houses the primary sealing ring, springs that pre-load the primary sealing ring, and secondary seal.
Applsci 11 00779 g007
Figure 8. Overall layout of the prototype, seen here running. The 90-degree gearbox is the total transaxle of a small tractor, so it is much larger than it needs to be. The actual bevel gears used in there are approximately 3 inches in diameter. This gearbox was later replaced by a smaller and more efficient unit.
Applsci 11 00779 g008
Figure 9. Pressure vs. crank angle of RLE vs. BSL. The two parabolas in the middle indicate the approximate peak of the motoring pressure.
Applsci 11 00779 g009
Figure 10. Overall RLE prototype, showing encoder location and revised gearbox. For more details on the prototype geometry, see the Appendix A.
Applsci 11 00779 g010
Figure 11. Top of the PV diagram of the original BSL case (black), RLE with original injection timing (red), and RLE with retarded timing (blue).
Applsci 11 00779 g011
Figure 12. (a) One case of RLE combustion characteristics that matches well the BSL and lacks the pressure wave noise. (b) Top of P-V diagram for the RLE case, also identical to BSL in Figure 11. Unlike Figure 11, the proper clearance volume is now used for the BSL graph.
Applsci 11 00779 g012aApplsci 11 00779 g012b
Figure 13. (a) Pressure vs. crank angle history on the RLE when the timing is retarded. Note that combustion is still fairly fast compared to BSL Case 3 (see Appendix A), but we can still consider this a close comparable case for PCP-PMP comparison. (b) Pressure vs. volume for the RLE in the retarded condition. Note that now the premixed combustion is right at the TDC with some significant heat release occurring past the TDC, which lowers PCP. This is to be contrasted against Figure 12b, where the premixed combustion is well before the TDC, and only a slight amount of heat is released before the TDC, or Figure 11 (red), where all the heat is released well before TDC.
Applsci 11 00779 g013
Figure 14. Instantaneous heat release rate for BSL Case 1 along with the corresponding cylinder pressure. The premixed combustion looks sharper than what is normally reported in the literature, partly due to the low-pressure fuel injection and partly due to the over-advanced timing.
Applsci 11 00779 g014
Figure 15. Instantaneous heat release rate for RLE Case 4.
Applsci 11 00779 g015
Figure 16. Instantaneous heat release rate for RLE Case 5 (blue/green) and Case 6 (red/purple). One interesting observation in Figure 9 is that the approximately 4 degrees of physical rotation of the mechanical injection pump generated about 6 degrees of delay in the premixed combustion event.
Applsci 11 00779 g016
Figure 17. CAD representation of the multi-cylinder RLE. The critical components are identical to the current prototype, and the model of the block is the production engine, so a direct modification is feasible.
Applsci 11 00779 g017
Table 1. Summary of PCP minus PMP for 750 rpm and 71 °C (160F) coolant/oil idle conditions. RLE cases in italics font.
Case NumberPCP (bar abs)PMP (bar abs)Difference (bar)
1. BSL high compression (old) but combustion continues after TDC.59.53821.5
2. BSL low compression, med advance44.52816.5
3. BSL low compression, retarded timing.39.02811.0
4. RLE old (combustion completed well before TDC)49.83316.8
5. RLE new (some combustion taking place past TDC)45.63312.6
6. RLE new, slightly cooler coolant, further retarded timing.42.5 *339.5
* In other tests with different injectors, we have seen PCP as low as 40 bar when the temperature approaches 71 C (160F).
Table 2. Summary of overall results plus total heat release and CO2 emissions (for details on heat release, see Section 3.7).
Case NumberDifference Adjusted to RLE Clearance Volume (bar)Total Adiabatic Heat Release (j/cycle)CO2 (%)% Idle Fuel Economy Improvement Based on PCP-PMP
1. 20.5487 **N/A
2. 18.6N/A2.52%
3. 12.4N/A2.54%
4. 16.83282.02%18% compared to 1,
5. 12.63191.31%32% compared to 2, 38% compared to 1.
6. 9.5325N/A23% compared to 3
** described in Section 3.7.
Table 3. Hypothetical accounting of friction energy percentages at 750 rpm idle relative to the 4-cylinder BSL. The numbers for the 4-cyl. BSL are adjusted to reasonable numbers from the literature. The numbers for the 1-cyl. BSL are adjusted based on the components removed. The 1-cyl. RLE piston is reduced until the measured margin in friction is reached. Then, the RLE 4-cyl. contains the friction of the added components over the 1-cyl. RLE. This scenario shows a 45% reduction in 4-cylinder idle fuel consumption.
4-Cylinder BSL1-Cylinder BSL1-Cylinder RLE4-Cylinder RLE
Piston + valves *6514.255.020
Crank10 + 10 **2.5 + 102.5 + 1010 + 10
Accessories15101015
Total10036.7527.555
* The two-valve/cylinder design has very low valve lift and low stiffness valve springs, so the contribution is low. ** The crank friction is assumed to be half main bearings, half rod bearings.
Publisher’s Note: MDPI stays neutral with regard to jurisdictional claims in published maps and institutional affiliations.

