Abstract
Protein synthesis is a central process in all cells, crucial for cell development and maintenance. Translational dysregulation, in fact, is associated with cancer or neurodegenerative diseases. Active protein synthesis occurs on a supramolecular complex, named polyribosome or polysome, formed by a mRNA associated with multiple ribosomes. Polysomes therefore can be considered as a privileged molecular platform to obtain information about the physiological or pathological state in cells. The classical methods for purifying the mRNAs associated with polysomes mainly rely on ultracentrifugation in sucrose gradient followed by standard RNA extraction. This method present several drawbacks, among all it is a time-consuming procedure, which requires a fairly large amounts of starting material. New methods offering an efficient, rapid and user-friendly alternative to standard methods are therefore highly desirable. Here, a panel of surfaces and surface functionalizations were screened for their ability to entrap polysomes with the ultimate aim to set up smart biofunctional surfaces for the purification of nonlabelled polysomes and their associated mRNAs. As a proof-of-concept, prepurified ribosomes and polysomes were incubated on multiple functional surfaces and characterized by atomic force microscopy to assess number and morphology of entrapped polysomes. Surfaces able to efficiently capture polysomes were then included in a microdevice with promising results, opening the future perspective of developing protocols and devices based on biofunctional surfaces.
1. Introduction
The process of protein synthesis translates the genetic information stored in mRNAs into proteins. Evidence accrued over the last 20 years showed that not all the mRNA found in a cell in a certain moment is effectively translated into proteins [1]. After transcription and export to the cytoplasm in an eukaryotic cell, in fact, several post-transcriptional controls define whether a mRNA will be immediately translated, stored or degraded. mRNAs in active translation are typically associated with ribosomes, large ribonucleoprotein complexes which read the information carried by mRNAs and assemble proteins. In the course of the translation process, the same mRNA is occupied by multiple ribosomes, which form large complexes known as polyribosomes or polysomes [2]. The analysis of the pool of mRNAs recruited to ribosomes for protein synthesis, pool named “translatome”, can reveal important regulatory cues and discover relevant pathways connected to diseases [3,4].
The methodologies currently used to profile the translatome are based on three main strategies [5]: (i) polysomal profiling [6], (ii) ribosomal profiling [7] and (iii) affinity-capture techniques [8]. Polysomal profiling was developed in the 1960s as a technique based on sucrose gradients for polysomes purification and later used to profile the translatome with the microarray technology [9]. Compared to the other techniques, polysome profiling is unique and it can be used to monitor in parallel the cosedimentation of mRNAs and ribosome associated proteins to the translation machinery [10,11,12]. Polysome profiling is based on a differential centrifugation through density sucrose gradients [6,13,14]. Although widely employed, polysomal profiling presents several drawbacks, such as the long time of processing, the need of expensive equipment, the fairly high amount of starting material and the presence in the resulting polysomes of sucrose, which could impede their direct use for the following analyses. The progress of sequencing techniques allowed the recent development of alternative methods, in particular ribosome profiling [7,15]. In this method, the RNA fragments protected from nuclease digestion by ribosomes, are sequenced on large-scale. Ribosome profiling has been validated for translatome studies in several biological models, from cell lines to tissues in various organisms. However, this method also has several disadvantages, for example, it is labor intensive and requires a large amount of starting material. The need to study the translatome in vivo and in specific cell types pushed the development of the ribosome affinity purification techniques [8,16]. Ribosome affinity purification relies on the development of genetically modified cells/organisms, which express an affinity-tagged ribosome subunit. Thanks to these tagged subunits, the translatome analyses become possible in individual cell types. The major drawback is, of course, that this method could be applied only with samples with genetically tagged ribosomes.
Recently, alternative methods of polysomes purification have been proposed. Yoshikawa et al. developed a polysome fractionation method based on an ultraHPLC size exclusion chromatography [17]. Although this efficient and reproducible methodology can facilitate the isolation of polysomes from mammalian cells and tissues, it employs expensive instrumentation to be used by skilled personnel. Kandala et al. introduced instead a different approach based on the study of interaction of puromycin derived molecules to trap polysomes and the associated RNA [15].
Therefore, the need for new devices and protocols able to specifically purify polysomes in their native state to isolate the associated transcripts is evident. This possibility could give access to information on protein synthesis both for basic research studies and for enabling a deeper comprehension of pathologies where the protein synthesis is affected, like cancer or neurodegenerative diseases [11]. In this context, the setup of biofunctional surfaces able to selectively capture polysomes could be of great value especially in a microdevice perspective. We already demonstrated that biofunctional surfaces prepared on flat substrates [18,19] can be easily integrated in microdevices [20,21,22], if the preparation and the working principle of surfaces is deeply characterized and studied.
The aim of the present work is the development and the analysis of functional surfaces enabled to isolate and separate polysomes, with the ultimate goal to provide ideal material for the purification of actively translated mRNAs (both in healthy and in diseased conditions). The surface functionalization is based on the formation of Self-Assembled Monolayers (SAM) of organic molecules, which expose a convenient functional group able to modify polarity and surface charge of the starting substrate. A deep characterization of the prepared functional surfaces as well as of adsorbed ribosomes and polysomes on such surfaces is presented. Moreover, a proof-of-concept of polysomes (both prepurified and from cell lysate) entrapment on functionalized microdevices is also reported.
2. Materials and Methods
2.1. Materials
The following reagents were purchased from Sigma-Aldrich (USA): 11-Mercaptoundecanoic acid (MCOOH), 11-Mercapto-1-undecanol (MOH), 11-Amino-1-undecanethiol hydrochloride (MNH), 1-Undecanethiol (M11CH), ethanol, toluene and anhydrous toluene (99.8%), tetrahydrofuran (THF) (99%) and powders for buffer solutions. N-(trimethoxysilylpropyl)ethylene-diamine triacetic acid, trisodium salt (triCAS) 45% in water and carboxyethyl-silanetriol, disodium salt (CST) 25% in water were obtained from Gelest (USA). Pyrogen-free DEPC water and RNase-free water (RNF-water) were purchased from Life technologies Corporations (USA). The quantification of RNA was performed with the Quant-iT™ RiboGreen® RNA Assay kit (RG) by Invitrogen Ltd. (UK).
2.2. Preparation and Functionalization of Surfaces
2.2.1. Gold Samples
Ultraflat gold surfaces were prepared according to Marocchi [23]. Briefly, a 150 nm thick gold layer was evaporated onto Highest Grade V1 mica disk by an electron beam evaporator. Gold surfaces were then glued to glass supports using epoxy glue and stored at room temperature. The gold surfaces were separated from mica just before use, after immersion in a tetrahydrofuran bath for a couple of minutes to reduce the adhesion of gold to mica. A 1 mM solution of alkanethiol in ethanol was used to functionalize the freshly stripped gold surfaces. After 24 h (68 h when MCOOH was used), surfaces were rinsed with ethanol and dried under a stream of nitrogen. For MCOOH functionalized surfaces, the longer time was necessary to optimize the formation of the SAM.
Table S1 lists the four functional thiols used in this work that differ in their functional group (carboxyl, amine, hydroxyl and methyl) in order to tailor the behavior of the surface, such as its charge distribution or its hydrophilicity.
2.2.2. Silicon Oxide Functionalization
Thermally grown silicon oxide fiilms (TG-SO), obtained on 1 cm2 area silicon substrates were cleaned and activated [24] in a PDC-32G plasma cleaner [23], applying to the RF coil a power of 6.8 Watt, for 2 min in argon atmosphere at a pressure of 2 mbar.
Two different silane molecules, endowed with carboxy groups (triCAS and CST, Table S1), were used to silanize the TG-SO surfaces employing the following protocols:
Silanization with triCAS: surfaces treated with plasma, were soaked in a 4.5 % v/v triCAS solution in water for 2 h, at room temperature, rinsed in ultrapure water and finally cured at 80 °C for 30 min.
Silanization with CST: the CST solution was prepared at 12.7 mM concentration in ethanol:water (5:100 v/v) pH 5 (adjusted with acetic acid), and incubated 5 min at room temperature. The plasma treated samples were then immersed in this solution and gently stirred with an orbital shaker at 100 rpm for 30 min at room temperature, then rinsed with the ethanol/water solution and finally cured at 110 °C for 30 min.
2.2.3. Ribosome/Polysomes Adsorption on Plane Surfaces
Ribosomes and polysomes were purified from MCF7 cells (human breast adenocarcinoma) obtained from the Istituto Zooprofilattico Sperimentale (Brescia, Italy), as previously reported [23,25]. Briefly, cells were cultured in DMEM medium (supplemented with 10% FBS, 2 mM glutamine, 100 units/mL penicillin, and 100 mg/mL streptomycin) at 37 °C, 5% CO2 until 80% confluence was reached. At this point, cells were firstly treated for few minutes with cycloheximide 10 µg/mL at 37 °C to entrap ribosomes on mRNAs and then lysed. Cells were washed with PBS added with 10 µg/mL cycloheximide and scraped directly on the plate with 300 µL lysis buffer (10 mM NaCl, 10 mM MgCl2, 10 mM Tris–HCl, pH 7.5, 1% Triton X–100, 1% sodium deoxycholate, 0.2 U/µL RNase inhibitor (Fermentas), 10 µg/mL cycloheximide, 1 mM dithiothreitol) and transferred to an Eppendorf tube. Nuclei and cellular debris were removed by centrifugation for 5 min at 12,000× g at 4 °C. After this step, the lysate was transferred onto a 15–50% linear sucrose gradient (30 mM Tris–HCl, pH 7.5, 100 mM NaCl, 10 mM MgCl2), and ultra-centrifuged for 100 min at 180,000× g at 4 °C. Fractions of the centrifuged lysate were collected and measured at 254 nm (a typical lysate profile is shown in Figure S1). The peaks pertaining to ribosomes (80S) and to the polysomal fractions used in this work are pointed out. The fractions were aliquoted, flash frozen in liquid nitrogen and stored at −80 °C till use.
For the adsorption experiments, the protocol described in [23] was followed. Briefly, an aliquote of ribosomal/polysomal fraction was diluted 4–10 times in 30 mM Tris/HCl pH 7.5, 0.1 M NaCl, 10 mM MgCl, plus sucrose at the same concentration as in the fraction. The dilution factor, ranging from 4 to 10 times, was determined experimentally from optical absorbance at 254 nm. Fractions were then incubated on the surface for 3 min before adding a deposition buffer (i.e., 10 mM Hepes pH 7.4, 10 mM NaCl, 10 mM MgCl, 20 µg/mL cycloheximide, 3% w/v sucrose). After one hour at 4 °C, the surface was firstly rinsed very gently with the same buffer and then extensively but gently with DEPC water added with cycloheximide. Finally, the sample was air dried before AFM imaging.
2.3. Surface Characterization
2.3.1. AFM Morphological Characterization
Surface morphology was characterized by Atomic Force Microscopy. Acquisitions were performed with a Cypher AFM (Oxford Instrument, UK), equipped with a flexural scanner in closed-loop configuration, with a full range of µm. Surfaces were imaged in air and analyzed in AC mode using MikroMasch NSC35 tips (nominal resonance frequency of 210 kHz, 315 kHz and 150 kHz) and Olympus Corporation OMCL-AC 240 TS and OMCL-AC 200 TS cantilevers (nominal resonance frequency of 70 and 150 kHz respectively).
Images of functionalized surfaces before and after polysome deposition were acquired measuring areas from 200 nm to 5 µm wide, and processed (plane subtraction and line by line leveling) with SPIP V4 (Image Metrology, Denmark, www.imagemet.com). Morphological effects due to the functionalization process were evaluated computing the superficial average roughness (), using Gwyddion (www.gwyddion.net). Ribosomes and polysomes deposited on the surfaces were also analyzed with Gwyddion by grain analysis method. This analysis was used to characterize ribosome and polysome size value distributions: height (i.e., the maximum value occurring inside the grain), minimum and maximum dimension (i.e., width and length of a region circumscribing the grain). Frequency distributions of these data and their fitting with Gaussian curves were obtained by means of scripts written in Octave (v. 5.2.0—www.octave.org), using TeXmacs (v. 1.99.13—www.texmacs.org) as frontend.
2.3.2. XPS Chemical Characterization
Gold surfaces were analyzed by X-Ray Photoelectron spectroscopy with a SCIENTA ESCA 200 instrument, while silicon oxide surfaces were analyzed with a KRATOS AXIS UltraDLD, both equipped with a hemispherical analyzer and a monochromatic Al K X-ray source (1486.6 eV). The analysis chamber pressure was maintained at ∼5 mbar during sample analysis, using an emission angle between the axis of the analyzer and the normal to the sample surface of 60°. Binding Energy scales were referenced to the CC/CH bond centered at 285.0 eV [26]. The quantification, reported as relative elemental percentage, was carried out using the integrated area of the fitted core lines, after Shirley background subtraction and by correcting for the atomic sensitivity factors. All XPS data were analyzed using the software described in Speranza and Canteri [27].
2.4. Microdevice Assay
2.4.1. Microdevice Fabrication and Functionalization
Silicon/Pyrex microdevices were produced by Olivetti I-Jet, starting from a 6 silicon wafer. Microchannels were patterned in the silicon oxide substrate via Reactive Ion Etching (RIE) technology, obtaining smooth verticals walls subsequently passivated by a 100–160 nm thick silicon oxide coating, grown via Low Pressure Chemical Vapour Deposition. Microchips were sealed by anodic bonding of the silicon substrate with a Pyrex cover carrying two holes produced by sand blasting, for fluids inlet and outlet. Finally, each wafer was diced in 12 microdevices of 3 × 3 cm area each. The serpentine shaped channel (see Figure S2) is 100 µm deep, 500 µm wide and 50 cm long, has a total volume of 25 µL and a total inner surface of 11 cm.
Prior to functionalization with triCAS (Table S1), the microdevices were extensively washed with RNF-water and autoclaved for 20 min at 120 °C. Similarly to the silanization of planar TG-SO samples (see Section 2.2.2), a solution of triCAS 973 mM in RNF-water was inserted in the microdevice and incubated for 2 h at room temperature. Next, the microdevice was washed three times with RNF-water, dried with a nitrogen flux and incubated at 80 °C for 30 min.
2.4.2. On-Chip Extraction of RNA from Polysomes
Microdevices were tested for the extraction of RNA from already purified MCF-7 polysomal fractions (Section 2.2.3) and from cell lysates. An extensive wash with RNF-water was performed on the freshly silanized serpentine shaped channel prior to insert the polysome solution.
Polysomal fractions number from 7 to 12 (see Figure S1) were mixed, inserted in the silanized microdevices and incubated at 4 °C for 1 h. Next, the unbound sample was removed and TE buffer was inserted (10 mM Tris-HCl, 1 mM EDTA, pH 7.5). After heating the microdevice at 50 °C for 10 min, the ribosome-bound mRNA was free in solution.
For experiments with cell lysate (Figure S10), cell lysate obtained as described in Section 2.2.3, was inserted in the microdevices, either untreated or functionalized with triCAS, and let to adhere to the surfaces for 1 h at 4 °C. Next, a wash with RNF-water was performed before elution with TE buffer for 10 min at 50 °C. All solutions recovered from microdevices were analyzed to evaluate the amount (see Section 2.4.3) and the quality of the RNA extracted (see Section 2.4.4).
2.4.3. Fluorescence Measurements
The RNA obtained from silicon microdevices was stained with RG and the resulting fluorescence was measured with a SPEX FluorMax spectrofluorimeter (Horiba Instruments Inc., Edison, NJ, USA). An excitation wavelength of 480 nm was used to record the emission spectrum from 496 to 700 nm. The fluorescence signal from 520 to 540 nm was integrated and compared with results obtained from a calibration curve. The unbound fractions as well as the initial polysomal fractions were subjected to thermal treatment before staining in order to detach RNA from polysomes and compare results.
2.4.4. Bioanalyzer Analysis
In order to asses the quality (integrity and class) of RNA extracted from the on-chip assay (Section 2.4.2), the solution collected was analyzed via capillary electrophoresis. RNA was analyzed with the Agilent 2100 Bioanalyzer and the chips utilized were the Agilent RNA 6000 Pico chips, following the manufacturer instructions for RNA analysis. As for fluorescence measurements (see Section 2.4.3), the unbound fractions as well as the initial polysomal fractions were subjected to thermal treatment before analysis.
3. Results and Discussion
A very promising property of biofunctional surfaces is the possibility to perform specific analyses in solid-state. These approaches allow the inclusion of these surfaces in compact and easy-to-use microdevices. Here, several materials and a variety of functionalizations were tested in order to set up smart biofunctional surfaces for the entrapment of polysomes and for the extraction of actively translated mRNAs. Mammalian ribosomes (80S) consist of a small (40S) and a large (60S) subunit and are globally formed by basic proteins (about 80, with isoelectric points above 10) and by four nucleic acids (intrinsically negatively charged). Since ribosomes present both positive and negative charges (Figure S3), surfaces endowed with different charge and hydrophilicity can be exploited to entrap ribosomes and polysomes. A panel of charged (either positively or negatively charged) and polar or apolar molecules were used to modulate the surface properties of gold flat substrates. After a deep surface characterization, these functionalized surfaces were employed to evaluate the most promising treatment to capture ribosomes and polysomes, compared to unmodified gold surfaces and mica standard surfaces. Additionally, silicon based negatively charged surfaces were selected as biofunctional surfaces to be potentially included in microdevices. Silicon surfaces are indeed commonly present in microdevices on the contrary to gold surfaces. Silicon surfaces were modified with different negatively charged reagents and tested for polysomes adsorption. A proof-of-principle of polysomes capture and polysomal RNA extraction on an integrated silicon-based microdevice was also performed.
3.1. Functionalization and Characterization of Gold Surfaces
Ultra-flat gold surfaces prepared according to Hegner and coworkers [28] were functionalized with four alkanethiols in order to obtain SAM (see Section 2.2.1 and Table S1) with different charge distribution (i.e., negative, positive or neutral) and hydrophobicity. MCOOH, MOH, MNH2 and M11CH3, which share the same alkane chain, and carry differing terminal groups, were selected. In this way the formation at physiological pH of negatively charged SAM (MCOOH) or positively charged (MNH2) or even neutral but hydrophilic (MOH) or hydrophobic (M11CH3) SAM was possible at physiological pH. Functionalized surfaces were first of all characterized by AFM for the possible change in morphology with respect to the bare gold surface and by XPS for the change in chemical composition (Table 1).

Table 1.
Surface roughness measured by AFM of bare gold and functionalized gold surfaces (second column) and elemental composition (%) of same surfaces, measured by XPS at 60°emission angle.
Ultra-flat gold surfaces prepared according to Section 2.2.1, presented large flat areas, ranging from hundreds of nanometers to a few m, with surface average roughness Sa equal to 0.15 ± 0.01 nm (Table 1). After functionalization, the original gold substrate morphology changed, showing objects with an height of 1–2 nm, while some higher peaks were also present. The average roughness of the four surfaces (Table 1) is however very similar to gold, i.e., very low and therefore suitable for the direct observation of ribosomes (expected height around 10 nm, imaged in air [25]) and nucleic acids by AFM (expected height about 1 nm [29]).
The functionalized surfaces were also characterized from the chemical point of view and compared to the nonfunctionalized gold surface (Table 1). As expected, the bare gold surface present a minor contamination of hydrocarbon and oxygen, as expected, while sulfur is present in all the four functionalized surfaces, witnessing the successful SAM formation. Moreover, oxygen and carbon increase on the MCOOH surface and nitrogen appears only when gold is modified by MNH, as expected. In addition, the chemical composition of MOH or M11CH surfaces reflects the presence of the respective SAM.
The morphological and chemical characterization of the functionalized surfaces confirm not only the presence of the desired SAM but also the SAM smoothness, which are required for the AFM analysis of biological macromolecules.
3.2. Evaluation of Ribosomes and Polysomes Adsorption on Functionalized Gold Surfaces
Once demonstrated that the functionalized gold surfaces are suitable for AFM analysis of macromolecules, the adsorption of ribosomes and polysomes was evaluated considering number, density and morphological parameters of the adsorbed structures. These structures were compared with purified fractions corresponding to 80S particles and polysomes deposited in already well-characterized conditions [25]; therefore, they were used as a reference. These reference particles were deposited on mica treated with Ni, a standard surface for AFM polysome imaging [25,30] and the morphological properties of the deposited objects were used as standard to evaluate the integrity of the ribosomes and polysomes deposited on bare and functionalized gold surfaces in this study.
3.2.1. Ribosome Adsorption
Prepurified ribosomes adsorbed on the bare gold surface appeared as evenly distributed ellipsoidal features, similar in dimension, mainly isolated, although a few cluster of 2–4 objects could be observed. Some smaller particles could also be recognized (Figure S4, panel A). To extract geometrical characteristic parameters, a grain-analysis algorithm was applied using the Gwyddion software, on several sample areas. The distributions calculated from the AFM images were fitted with Gaussian curves (Figure S5) and used to obtain the center and the width of the distribution peaks (see Table 2). The values of height and of minimum and maximum size obtained for ribosomes adsorbed on bare gold are smaller than those found by Viero et al. [25]) for the 80S fraction deposited in standard conditions (i.e., (height: 6.0 ± 1.0 and 9.1 ± 1.2) nm, (width: 34.1 ± 3.9) nm, (length: 42.2 ± 6.7) nm, respectively. These results indicate that some mild degradation induced by the interaction with the surface may occur for ribosomes deposited on bare gold.
Table 2.
Height (H1, H2 ) and lateral size values (width—W1, W2, length—L1, L2) obtained from the Gaussian fits of the morphological value distributions of ribosomes deposited on bare and functionalized gold (center and width of Gaussian fits are shown). Data and fits are reported in Figure S5.
A variable extent of such degradation was found when depositing the same ribosomal fraction on the gold functionalized surfaces. A minimal degradation was observed for MCOOH surfaces, where values very similar to those found by Viero et al. [25] were obtained (see Table 2), while an almost complete degradation was found for M11CH surfaces. Typical AFM images are shown in Figures S4 and S6, as examples of the various surfaces. Ribosomes adsorbed on MCOOH and MNH2 surfaces clearly showed a bimodal distribution. On MCOOH the two populations showed the best agreement among the tested conditions with previously published data (see [25]), while on MNH2 surface the two populations show a larger deviation, height being lower and length greater than the reference data. Moreover, ribosomes adsorbed on the MOH surface presented a quite broad distributions (Figure S5), with a maximum frequency in the very low population size. To be noted that ribosomes deposited on the surface M11CH aggregated in large bodies where single ribosomes could not be resolved, impeding their quantitative analyses (Figure S6). On this surface large, blurred aggregates, several nanometers high (see the height profile in Figure S6, panel B) were found, indicating an high degree of degradation of the ribosomal material due to the interaction with this hydrophobic surface.
The density of ribosomes observed on the different surfaces was used as a numerical estimator of the ribosome affinity for the differently functionalized surfaces (Table 3). Beside bare gold surfaces, ribosomes showed a significant tendency to adhere to the MNH treated surfaces. To be noted, the MNH surface are endowed with a net positive charge distribution at physiological pH due to the presence of amino groups exposed on the surface.
Table 3.
Density of ribosomes and polysomes adsorbed on the different surfaces.
3.2.2. Polysome Adsorption
Similarly to ribosomes (Section 3.2.1), polysome adsorption was analyzed on gold and gold-functionalized surfaces. Fraction 10 of purified polysomes (Figure S1) was selected for this study. Fraction 10 is a medium-heavy weighted fraction, comprising polysomes formed by 6–10 ribosomes each [25]. Examples of AFM images of these polysomes are shown in Figure 1, while the morphological distribution resulting from grain-analysis is reported in Figure S7 (data and fit), and in Table 4 (summary of fitted peaks). In addition, in the case of polysomes, the morphological characteristics measured by AFM were compared to reference conditions [25].
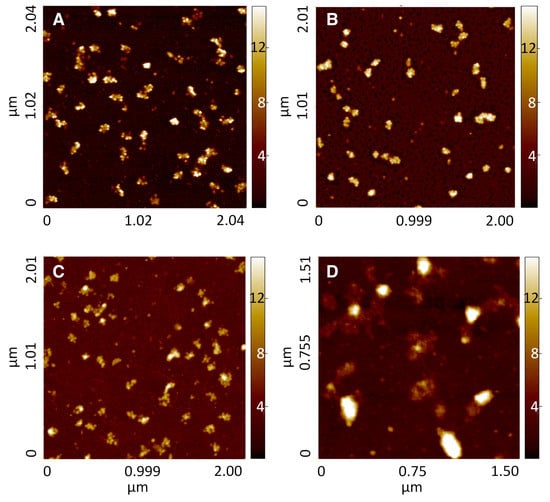
Figure 1.
2 × 2 µm2 AFM images of medium-heavy weighted polysome fractions deposited on bare gold (A) and MCOOH (B), MNH (C) and MOH (D) functionalized gold. The z-range color-scale is 15 nm.
Table 4.
Height (H1, H2, H3) and lateral size values (width—W1, W2, W3; length—L1, L2, L3) obtained form the Gaussian fits of the morphological value distributions of polysomes deposited on bare and functionalized gold (center and width of Gaussian fits are shown). Data and fits are reported in Figure S7.
After deposition on gold, polysomes were imaged as globular or rod-shaped isolated clusters of ribosomes (about ten ribosomes per cluster) occasionally connected by strand-like features, which likely correspond to naked mRNA (Figure 1, panel A). The distributions of morphological parameters appear to be segregated in two main populations: a first population represented by smaller objects with an height of 5.9 nm, width of 24.9 nm and length of 33.4 nm, and a second population that comprises larger objects with an height of 12.6 nm, width of 87.2 nm and length of 122.5 nm. These values show a quite good conservation in polysome shape and distributions compared with the reference. Similarly, polysomes on MCOOH functionalized gold retained similar size values in the population of bigger objects (height of 13.6 nm, width of 76.6 nm and length of 107.6 nm). On MNH surfaces was also noticed the presence of small strand-like structures. Moreover, the distributions obtained from depositing on MNH2 surfaces, required three Gaussian components for a meaningful fit, evidencing an highly abundant population of smaller objects, as defined by the three studied properties. Finally, polysomes deposited on neutral surfaces (i.e., MOH and M11CH) were found to be severely disrupted, particularly on the hydrophobic M11CH surface (Figure S8). The favorable adhesion of ribosomes and polysomes we found on charged surfaces (both positively and negatively charged) can be elicited by the presence on the ribosomal surface of several charged groups, as shown in the Figure S3. Moreover, we note that during the adhesion phase, relatively high concentration of divalent cations are present in polysome preserving buffers, which can also favor the indirect adhesion of negatively charged groups on negatively charged surfaces [31,32].
As in the case of ribosomes, the positively charged MNH surface functionalization was the most effective in entrapping polysomes in terms of density (Table 3). However, this surface could retain also other molecules, as can be noted from the morphological analysis of the AFM images (Figure S7 and Table 4). Moreover, it is known that surfaces exposing amino functionalities are prone to adsorb both DNA [18] and RNA [19].
3.3. Silicon-Based Surfaces for Polysomes Capture
Results obtained with gold surfaces were then used to set-up a purification route based on the use of silicon surfaces, which are more suitable for the fabrication of microdevices. In particular, based on the final observations in Section 3.2.2, functionalization protocols inducing negatively charged surfaces were tested. TG-SO surfaces were treated with two different organic silanes, CST and triCAS (Table S1), containing 1 and 3 carboxyl functional residues, respectively. The functionalized surfaces were characterized via AFM and XPS before monitoring the polysomes adsorption.
The AFM analysis showed that initial TG-SO surfaces are quite smooth, with an average roughness S of (0.18 ± 0.01) nm. This roughness does not increase significantly after functionalization with either triCAS or CST. Moreover, XPS analysis confirmed that the silanization process occurred successfully, since all the silanized surfaces showed a larger amount of carbon content. In particular, 2 to 3 times more carbon was measured on the silanized surfaces compared to bare TG-SO (Table S2). These results demonstrate that the functionalization process resulted in a coverage of the pristine surface.
The unmodified (but plasma cleaned) and the modified surfaces were tested for their capacity of adsorption of polysomes, as in the above Section 3.2.2. Medium-high heavy polysomes were incubated on plasma-treated TG-SO and on the functionalized TG-SO surfaces. AFM imaging (Figure 2) showed a similar result for polysomes adsorbed on plasma-treated TG-SO (Figure 2, panel A) and on surfaces treated with triCAS (Figure 2, panel B), i.e., a fair number of adsorbed polysomes without any marked shape of degradation. Concerning polysomes entrapped on CST- treated TG-SO (Figure 2, panel C), a certain degree of degradation can be noticed, as also confirmed by the analysis of morphological distributions. The three morphological properties indeed showed a decrease in the peak center, compared to the TG-SO and triCAS surfaces (Table 5 and Figure S9). Furthermore, about two thirds of the detected objects are estimated to contribute to the population of smaller objects, characterized by low width and length values (Figure S9).

Figure 2.
2 × 2 µm2 AFM images of polysomes adsorbed on negatively charged silicon-based surfaces. Panel A: plasma-treated TG-SO; panel B: triCAS treated silicon surface; panel C: CST treated TG-SO (Section 2.2.2).
Table 5.
Height (H1, H2) and lateral size values (width—W1, W2; length—L1, L2) obtained form the Gaussian fits of the morphological value distributions of polysomes deposited on bare and functionalized thermally grown silicon oxide (center and width of Gaussian fits are shown). Data and fits are reported in Figure S9.
The overall distribution of fitting peaks obtained using triCAS (Table 5) quite closely resembles the results obtained with MCOOH-treated gold (see Table 4).
However, on surfaces functionalized with triCAS, some isolated smaller objects are present, as reflected by the appearance of a peak at 4.5 nm in the height distribution, which is instead absent in the MCOOH-gold surfaces. Summarizing, by comparing the density of objects adsorbed on surfaces (Table 6), the TG-SO silanized with triCAS is the surface able to retain more objects, yielding a result comparable to that found employing MCOOH-functionalized gold surfaces. TG-SO functionalized with CST yields comparable results in term of density, but a high fraction of these structures are possibly degraded polysomes. Therefore, silicon surface functionalized with triCAS are the negatively-charged surface most promising for polysome capture.
Table 6.
Number of polysomes adsorbed on plasma-treated TG-SO and functionalized TG-SO surfaces. Silanizations are described in Section 2.2.2. The result obtained with negatively-charged gold surfaces is shown for comparison.
3.4. On-Chip Polysome Capture and RNA Purification
Given the promising results reported in the previous paragraphs, a proof-of-concept for an integrated system was assessed to directly capture polysome from cell lysates and extract mRNA from them. The functionalization protocol set-up on silicon plane surfaces was thus applied to a silicon/Pyrex microdevice (Figure S2) as a proof-of-concept for an integrated system devoted to both polysome capture from cell lysates and mRNA extraction from the immobilized polysomes. To compare microdevice results with protocols set up on plane samples, the same conditions were implemented on-chip, in particular prepurified polysomes were employed. Polysomes were immobilized on the negatively-functionalized surfaces of the microdevice and, after a washing step, the captured mRNA was released. Based on results described in the previous paragraph and after testing the different silanization protocols on microdevices (see Section 2.2.2), the functionalization with triCAS was performed on three microdevices. In parallel, three additional nonfunctionalized microdevices were used as a control. First, a prepurified polysomal fraction was inserted in the microdevices and incubated for 1 h at 4 °C to allow adsorption of polysomes in conditions similar to those used for plane surfaces. Next, the unbound material was collected, and an elution step combining a thermal treatment and a change in saline concentration was then performed. These steps favor both the detachment of mRNA from polysomes and its subsequent elution. Both the unbound material and the eluted RNAs were stained with RiboGreen and quantified with a spectrofluorimeter, while RNAs quality and integrity was checked with capillary electrophoresis (Figure 3). The functionalized microdevices confirm their good performances with respect to the untreated microdevices. In fact, the quantity of unbound material (Figure 3, panel A, black bars) measured in the first case is negligible with respect to the unbound material obtained from untreated microdevices. Moreover, the fraction of RNA eluted from functionalized microdevices is clearly more abundant than RNA eluted from the untreated microdevices (Figure 3, panel A, gray bars). The adsorption and elution efficiencies reflect independently the performances of the microdevices, concerning both polysome adsorption and RNA release steps, respectively. Both parameters indicate that the silanized microdevice show slightly better performances. The RNA captured via polysome adsorption amounted to the 88% in the silanized microdevice and to the 70% in the untreated microdevice, while the mRNA obtained after the elution process was 73% of the initial amount for the silanized microdevice and 56% for the untreated microdevice.

Figure 3.
RNA recovery from silicon/Pyrex microdevices functionalized with triCAS or untreated. Panel A: RiboGreen quantification; panel B: electropherograms of RNA unbound and eluted from microdevices functionalized with triCAS; panel C: electropherograms of RNA unbound and eluted from untreated microdevices.
Beside the amount of RNA adsorbed and eluted, the quality and integrity of the recovered RNA is crucial for further analyses. Results of capillary electrophoresis analysis (Figure 3B,C) show that RNA extracted from the silanized microdevices (solid line, panel B) is mainly composed by peaks identified with ribosomal and polysomal intact RNAs. On the contrary, in the case of the untreated microdevice (solid line, panel C), the RNA is composed mainly by shorter fragments, indicating a large degree of degradation, possibly due to the interaction with the bare surfaces. In fact, the presence of intact rRNA 18S and 28S, around 2000 and 5000 nt, respectively, is clearly visible in fractions eluted from the functionalized microdevice and not in fractions eluted from the untreaded microdevice, confirming better performances in the first case. The unbound RNA (dashed line, panel B and C) is in both cases a minimal amount. These results confirm those results obtained with TG-SO plane surfaces functionalized with triCAS. These surfaces in fact immobilized the highest number of polysomes per cm among the tested surfaces, without introducing a noticeable degradation (Table 6 and Figure 2). The proof-of-concept of polysomes entrapment was performed with prepurified polysomes in order to compare protocols set up for plane surfaces and since the results were confirmed, a further proof-of-concept was performed starting from cell lysate. In this case, the protocol was slightly modified by introducing a washing step aimed at removing all the unwanted material other than polysomes, prior to elute RNAs. The eluted material was then analyzed by capillary electrophoresis and a comparison between RNA eluted from functionalized and nonfunctionalized microdevices was performed (Figure S10). As clearly visible, the RNA eluted both from functionalized and from nonfunctionalized microdevices is mainly constituded by mRNA, while no rRNA is present. However, about six times more mRNA is recovered from the functionalized microdevice with respect to the nonfunctionalized microdevice. Therefore, the protocol set up for prepurified polysomes is able to entrap polysomes from cell lysate and could be utilized for the elution of mRNA associated with polysomes.
Even if a deeper investigation is certainly required before suggesting the use of these microdevices as diagnostic tools (for example, to identify alterations in protein synthesis leading to altered mRNA profiles or expression), the proof-of-concept here presented represents a very appealing and potentially breakthrough approach for rapid and integrated analyses of polysomally associated mRNA on a single monolithic microdevice with clear impact in hands-on diagnostics and biomarker discovery.
4. Conclusions
The separation of polysomes is crucial to assess the physiological or pathological state of a cell, since the mRNA associated with polysomes is the actively translated, as such representing a proxy for proteomes. The isolation of mRNA associated to polysomes is traditionally obtained by time-consuming and laborious protocols. Prompted by the idea of providing the scientific community with a rapid, miniaturized and simple device, alternative strategies were explored in this work.
Different materials, i.e., gold and silicon, and different functionalizations were tested in order to set up biofunctional surfaces for the purification of mammalian/human polysomes. A panel of either positively or negatively charged and polar or apolar molecules were used to modulate the surface properties of flat substrates, screening their ability to entrap polysomes. Charged surfaces were the best surfaces able to capture an high amount of intact polysomes. Negatively-charged surfaces were selected for preparing a proof-of-concept microdevice, successfully tested for the adsorption of polysomes and extraction of polysomal RNA in an integrated analysis. Leveraging on simple preparation and use, biofunctional surfaces are envisaged as promising tools for the future development of protocols and devices able to speed up and optimize the separation and analysis of polysomes, with possible diagnostic purposes.
Supplementary Materials
The following are available online at https://www.mdpi.com/2076-3417/11/2/776/s1, Figure S1: Typical polysome sedimentation profile of a MCF-7 cell lysate after sucrose gradient centrifugation and fractionation, Figure S2: Scheme with dimensions, CAD rendering and actual microdevice employed for polysome purification, Figure S3: Human ribosome structure, Figure S4: AFM images of ribosomes adsorbed on bare gold, on MCOOH, MOH and MNH2 functionalized gold surfaces, Figure S5: Height, minimum and maximum lateral size distributions obtained by grain-analysis on surfaces obtained depositing ribosomes on bare gold and MCOOH, MNH2, and MOH functionalized gold, Figure S6: AFM image of M11CH3 functionalized gold surfaces treated with ribosomes, Figure S7: Height, minimum and maximum lateral size distributions obtained by grain-analysis on surfaces obtained depositing polysomes on bare gold, MCOOH, MNH2, and MOH functionalized gold, Figure S8: AFM image of M11CH3 functionalized gold surfaces treated with polysomes, Figure S9: Height, minimum and maximum lateral size distributions obtained by grain-analysis on surfaces obtained depositing polysomes on plasma-treated TG-SO, triCAS treated silicon surfaces and CST treated TG-SO, Figure S10: Electropherograms of RNA eluted from microdevices after incubation of cell lysate. Table S1: List of undecanethiols used to functionalize gold substrates and of carboxysilanes used to functionalize silicon oxide surfaces, Table S2: Chemical composition of bare and functionalized TG-SO surfaces, measured by XPS at 60°take off angle.
Author Contributions
Conceptualization, L.L. and C.P. (Cecilia Pederzolli); Data curation, L.L., L.M., L.P., L.V. and C.P. (Cristina Potrich); Funding acquisition, C.P. (Cecilia Pederzolli); Investigation, L.M., L.P., L.V., G.V. and C.P. (Cristina Potrich); Methodology, G.V.; Supervision, L.L. and C.P. (Cecilia Pederzolli); Writing—original draft, C.P. (Cristina Potrich); Writing—review and editing, L.L., L.P., G.V. and C.P. (Cristina Potrich). All authors have read and agreed to the published version of the manuscript.
Funding
This research did not receive any specific grant from funding agencies in the public, commercial or not-for-profit sectors.
Institutional Review Board Statement
Not applicable.
Informed Consent Statement
Not applicable.
Conflicts of Interest
The authors declare no conflict of interest.
Abbreviations
The following abbreviations are used in this manuscript:
| SAM | Self Assembled Monolayer |
| TG-SO | Thermally Grown Silicon Oxide |
| AFM | Atomic Force Microscope |
| RG | RiboGreen |
| DEPC | diethylpyrocarbonate |
| DMEM | Dulbecco’s Modified Eagle Medium |
| FBS | Fetal Bovine Serum |
| PBS | Phosphate Buffered Saline |
| XPS | X-Ray Photoelectron Spectroscopy |
References
- Tebaldi, T.; Re, A.; Viero, G.; Pegoretti, I.; Passerini, A.; Blanzieri, E.; Quattrone, A. Widespread uncoupling between transcriptome and translatome variations after a stimulus in mammalian cells. BMC Genom. 2012, 13, 220. [Google Scholar] [CrossRef] [PubMed]
- Warner, J.R.; Rich, A.; Hall, C.E. Electron microscope studies of ribosomal clusters synthesizing hemoglobin. Science 1962, 138, 1399–1403. [Google Scholar] [CrossRef] [PubMed]
- Piccirillo, C.A.; Bjur, E.; Topisirovic, I.; Sonenberg, N.; Larsson, O. Translational control of immune responses: From transcripts to translatomes. Nat. Immunol. 2014, 15, 503. [Google Scholar] [CrossRef] [PubMed]
- Del Prete, M.J.; Vernal, R.; Dolznig, H.; Müllner, E.W.; Garcia-Sanz, J.A. Isolation of polysome-bound mRNA from solid tissues amenable for RT-PCR and profiling experiments. RNA 2007, 13, 414–421. [Google Scholar] [CrossRef]
- King, H.A.; Gerber, A.P. Translatome profiling: Methods for genome-scale analysis of mRNA translation. Brief. Funct. Genom. 2014, 15, 22–31. [Google Scholar] [CrossRef] [PubMed]
- Mašek, T.; Valášek, L.; Pospíšek, M. Polysome analysis and RNA purification from sucrose gradients. Methods Mol. Biol. 2011, 703, 293–309. [Google Scholar]
- Ingolia, N.T.; Ghaemmaghami, S.; Newman, J.R.; Weissman, J.S. Genome-wide analysis in vivo of translation with nucleotide resolution using ribosome profling. Science 2009, 324, 218–223. [Google Scholar] [CrossRef]
- Heiman, M.; Kulicke, R.; Fenster, R.J.; Greengard, P.; Heintz, N. Cell type-specific mRNA purification by translating ribosome affinity purification (TRAP). Nat. Protoc. 2014, 9, 1282–1291. [Google Scholar] [CrossRef]
- Arava, Y.; Wang, Y.; Storey, J.D.; Liu, C.L.; Brown, P.O.; Herschlag, D. Genome-wide analysis of mRNA translation profiles in Saccharomyces cerevisiae. Proc. Natl. Acad. Sci. USA 2003, 100, 3889–3894. [Google Scholar] [CrossRef]
- Tebaldi, T.; Zuccotti, P.; Peroni, D.; Köhn, M.; Gasperini, L.; Potrich, V.; Bonazza, V.; Dudnakova, T.; Rossi, A.; Sanguinetti, G.; et al. HuD Is a Neural Translation Enhancer Acting on mTORC1-Responsive Genes and Counteracted by the Y3 Small Non-coding RNA. Mol. Cell 2018, 71, 256–270.e10. [Google Scholar] [CrossRef]
- Lauria, F.; Bernabó, P.; Tebaldi, T.; Groen, E.J.N.; Perenthaler, E.; Maniscalco, F.; Rossi, A.; Donzel, D.; Clamer, M.; Marchioretto, M.; et al. SMN-primed ribosomes modulate the translation of transcripts related to spinal muscular atrophy. Nat. Cell Biol. 2020, 22, 1239–1251. [Google Scholar] [CrossRef] [PubMed]
- Shi, Z.; Fujii, K.; Kovary, K.M.; Genuth, N.R.; Röst, H.L.; Teruel, M.N.; Barna, M. Heterogeneous Ribosomes Preferentially Translate Distinct Subpools of mRNAs Genome-wide. Mol. Cell 2017, 67, 71–83.e7. [Google Scholar] [CrossRef] [PubMed]
- Aboulhouda, S.; Di Santo, R.; Therizols, G.; Weinberg, D. Accurate, Streamlined Analysis of mRNA Translation by Sucrose Gradient Fractionation. Bio-Protocol 2017, 7, e2573. [Google Scholar] [CrossRef] [PubMed]
- Bernabó, P.; Lunelli, L.; Quattrone, A.; Jousson, O.; Lencioni, V.; Viero, G. Studying translational control in non-model stressed organisms by polysomal profiling. J. Insect Physiol. 2015, 76, 30–35. [Google Scholar] [CrossRef] [PubMed]
- Kandala, D.T.; Del Piano, A.; Minati, L.; Clamer, M. Targeting Translation Activity at the Ribosome Interface with UV-Active Small Molecules. ACS Omega 2019, 4, 10336–10345. [Google Scholar] [CrossRef]
- Bertin, B.; Renaud, Y.; Aradhya, R.; Jagla, K.; Junion, G. TRAP-rc, Translating Ribosome Affinity Purification from Rare Cell Populations of Drosophila Embryos. J. Vis. Exp. 2015, 103, e52985. [Google Scholar] [CrossRef]
- Yoshikawa, H.; Larance, M.; Harney, D.J.; Sundaramoorthy, R.; Ly, T.; Owen-Hughes, T.; Lamond, A.I. Efficient analysis of mammalian polysomes in cells and tissues using Ribo Mega-SEC. eLife 2018, 7, e36530. [Google Scholar] [CrossRef]
- Pasquardini, L.; Lunelli, L.; Potrich, C.; Marocchi, L.; Fiorilli, S.; Vozzi, D.; Vanzetti, L.; Gasparini, P.; Anderle, M.; Pederzolli, C. Organo-silane coated substrates for DNA purification. Appl. Surf. Sci. 2011, 257, 10821–10827. [Google Scholar] [CrossRef]
- Santini, G.C.; Potrich, C.; Lunelli, L.; Pasquardini, L.; Vaghi, V.; Pederzolli, C. Innovative microRNA purification based on surface properties modulation. Colloids Surf. B Biointerfaces 2014, 116, 160–168. [Google Scholar] [CrossRef]
- Pasquardini, L.; Potrich, C.; Quaglio, M.; Lamberti, A.; Guastella, S.; Lunelli, L.; Cocuzza, M.; Vanzetti, L.; Pirri, C.F.; Pederzolli, C. Solid phase DNA extraction on PDMS and direct amplification. Lab Chip 2011, 11, 4029–4035. [Google Scholar] [CrossRef]
- Potrich, C.; Vaghi, V.; Lunelli, L.; Pasquardini, L.; Santini, G.C.; Ottone, C.; Quaglio, M.; Cocuzza, M.; Pirri, C.; Ferracin, M.; et al. OncomiR detection in circulating body fluids: A PDMS microdevice perspective. Lab Chip 2014, 14, 4067–4075. [Google Scholar] [CrossRef] [PubMed]
- Potrich, C.; Lunelli, L.; Cocuzza, M.; Marasso, S.L.; Pirri, C.F.; Pederzolli, C. Simple PDMS microdevice for biomedical applications. Talanta 2019, 193, 44–50. [Google Scholar] [CrossRef] [PubMed]
- Marocchi, L. Surface Functionalizations Towards Nucleic Acid Purification: A nanoscale Study. Ph.D. Thesis, University of Trento, Trento, Italy, 2014. [Google Scholar]
- Suni, T.; Henttinen, K.; Suni, I.; Mäkinen, J. Effects of Plasma Activation on Hydrophilic Bonding of Si and SiO2. J. Electrochem. Soc. 2002, 149, G348–G351. [Google Scholar] [CrossRef]
- Viero, G.; Lunelli, L.; Passerini, A.; Bianchini, P.; Gilbert, R.J.; Bernabó, P.; Tebaldi, T.; Diaspro, A.; Pederzolli, C.; Quattrone, A. Three distinct ribosome assemblies modulated by translation are the building blocks of polysomes. J. Cell. Biol. 2015, 208, 581–596. [Google Scholar] [CrossRef]
- Dadafarin, H.; Konkov, E.; Omanovic, S. Electrochemical Functionalization of a 316L Stainless Steel Surface with a 11-mercaptoundecanoic Acid Monolayer: Stability studies. Int. J. Electrochem. Sci. 2013, 8, 369–389. [Google Scholar]
- Speranza, G.; Canteri, R. RxpsG a new open project for Photoelectron and Electron Spectroscopy data processing. SoftwareX 2019, 10, 100282. [Google Scholar] [CrossRef]
- Hegner, M.; Wagner, P.; Semenza, G. Ultralarge atomically flat template-stripped Au surfaces for scanning probe microscopy. Surf. Sci. 1993, 291, 39–46. [Google Scholar] [CrossRef]
- Moreno-Herrero, F.; Colchero, J.; Baró, A.M. DNA height in scanning force microscopy. Ultramicroscopy 2003, 96, 167–174. [Google Scholar] [CrossRef][Green Version]
- Mikamo, E.; Tanaka, C.; Kanno, T.; Akiyama, H.; Jung, G.; Tanaka, H.; Kawai, T. Native polysomes of Saccharomyces cerevisiae in liquid solution observed by atomic force microscopy. J. Struct. Biol. 2005, 151, 106–110. [Google Scholar] [CrossRef]
- Minati, L.; Migliaresi, C.; Lunelli, L.; Viero, G.; Dalla Serra, M.; Speranza, G. Plasma assisted surface treatments of biomaterials. Biophys. Chem. 2017, 229, 151–164. [Google Scholar] [CrossRef]
- Bettotti, P.; Visone, V.; Lunelli, L.; Perugino, G.; Ciaramella, M.; Valenti, A. Structure and properties of DNA molecules over the full range of biologically relevant supercoiling states. Sci. Rep. 2018, 8, 1–14. [Google Scholar] [CrossRef] [PubMed]
Publisher’s Note: MDPI stays neutral with regard to jurisdictional claims in published maps and institutional affiliations. |
© 2021 by the authors. Licensee MDPI, Basel, Switzerland. This article is an open access article distributed under the terms and conditions of the Creative Commons Attribution (CC BY) license (http://creativecommons.org/licenses/by/4.0/).