Article

Deep Learning-Based Computer-Aided Diagnosis System for Gastroscopy Image Classification Using Synthetic Data

1
Interdisciplinary Graduate Program for BIT Medical Convergence, Kangwon National University, Chuncheon-si 24341, Korea
2
Department of Internal Medicine & Institute of Health Sciences, Gyeongsang National University School of Medicine and Gyeongsang National University Hospital, Jinju-si 52727, Korea
3
Department of Electronics Engineering, Kangwon National University, Chuncheon-si 24341, Korea
*
Authors to whom correspondence should be addressed.
Appl. Sci. 2021, 11(2), 760; https://doi.org/10.3390/app11020760
Submission received: 18 November 2020 / Revised: 5 January 2021 / Accepted: 8 January 2021 / Published: 14 January 2021

Abstract

:
Gastric cancer has a high mortality rate worldwide, but it can be prevented with early detection through regular gastroscopy. Herein, we propose a deep learning-based computer-aided diagnosis (CADx) system applying data augmentation to help doctors classify gastroscopy images as normal or abnormal. To improve the performance of deep learning, a large amount of training data are required. However, the collection of medical data, owing to their nature, is highly expensive and time consuming. Therefore, data were generated through deep convolutional generative adversarial networks (DCGAN), and 25 augmentation policies optimized for the CIFAR-10 dataset were implemented through AutoAugment to augment the data. Accordingly, a gastroscopy image was augmented, only high-quality images were selected through an image quality-measurement method, and gastroscopy images were classified as normal or abnormal through the Xception network. We compared the performances of the original training dataset, which did not improve, the dataset generated through the DCGAN, the dataset augmented through the augmentation policies of CIFAR-10, and the dataset combining the two methods. The dataset combining the two methods delivered the best performance in terms of accuracy (0.851) and achieved an improvement of 0.06 over the original training dataset. We confirmed that augmenting data through the DCGAN and CIFAR-10 augmentation policies is most suitable for the classification model for normal and abnormal gastric endoscopy images. The proposed method not only solves the medical-data problem but also improves the accuracy of gastric disease diagnosis.

1. Introduction

According to the statistics released by the Global Cancer Observatory in 2018, gastric cancer is the fifth most frequently diagnosed cancer and the third leading cause of cancer deaths worldwide, as shown in Figure 1 [1].
To increase the survival rate of patients with gastric cancer, it is important to detect and treat it early through gastroscopy. A previous study showed that the survival rate of patients with gastric cancer who underwent gastric endoscopy was 2.24 times higher than that of those who did not [2]. Precancerous lesions that cause gastric cancer include gastritis, gastric ulcer, and gastric bleeding. Most of these gastric diseases are difficult to detect because they are asymptomatic until they develop into gastric cancer. Therefore, gastric cancer can be prevented through the early detection of lesions that develop into gastric cancer with regular gastroscopy. As the importance of gastroscopy increases, the number of gastroscopy examinees is expected to increase. In addition, as the imaging technology continually develops and the number of medical images rapidly increases, the fatigue experienced by specialists who perform the diagnosis by relying on the naked eye increases, and differences in diagnosis occur depending on the skill of the specialist. Therefore, the need for a computer-aided diagnosis (CADx) system to assist specialists in performing the diagnosis is increasing. A CADx system assists a doctor in performing the diagnosis by detecting and analyzing lesions, reduces the manual work of endoscopy specialists, and improves the accuracy of gastric-disease diagnosis.
Currently, CADx systems using deep learning are being actively studied. According to research results, the latest deep-learning technologies can consistently deliver superior performance even if the data contain some errors, as long as there are enough data [3]. However, if the system does not have enough training data to train parameters, then overfitting problems that hinder its performance occur more easily. Therefore, deep learning-based research requires a large amount of quality data. However, the collection of medical data, owing to their nature, requires approval from institutional review boards for the protection of personal information of patients; further, it is highly expensive and time consuming because of the involved verification process that includes medical examinations and biopsy tests. To solve this problem, many studies have proposed methods of generating data similar to actual data through data augmentation. Frid-Adar et al. [4] introduced data-augmentation methods through rotations, flipping, transmission, and scaling and a general adversarial network (GAN) for computed-tomography (CT) images of the liver. Zafar et al. [5] proposed a method of augmenting data and classifying melanoma by applying random image-brightness and color-contrast values to skin-lesion images. Shin et al. [6] proposed a method of generating synthetic abnormal magnetic resonance imaging (MRI) images with brain tumors using a GAN from brain MRI images. Dai et al. [7] produced split images of the lungs and heart through a trained GAN from chest X-ray images. Zhao et al. [8] improved the performance of the method classifying malignant and benign pulmonary nodules by generating various lung CT images through a forward GAN and improving the image quality through a backward GAN. In addition, Gomes Ataide et al. [9] flipped, rotated, and blurred thyroid nodule ultrasound images to augment data, extract features, and classify them as either benign or malignant through a random forest classifier. Lyu et al. [10] classified different types of lung nodule malignancies through a multilevel cross-residual convolutional neural network (CNN). These studies [4,5,6,7,8,9,10] were conducted by applying a basic augmentation method or GAN for lesions such as lung, skin, and brain lesions but not gastric lesions. Asperti et al. [11] increased the amount of data by randomly applying rotation, width shift, height shift, shear, and zoom methods within a certain range to classify gastroscopy images as normal or abnormal. Togo et al. [12] improved the performance of the model by generating X-ray gastritis images using a loss function-based conditional progressive growing generative adversarial network (GAN). Nguyen et al. [13] proposed a method of classifying in vivo endoscopy images into normal or abnormal through VGG, DenseNet, and inception-based networks using the proposed ensemble learning. Some studies [11,12,13] also used gastroscopy and X-ray images of the stomach, but data were augmented by applying basic augmentation methods or a GAN. However, in the present study, for data augmentation, we mixed data generated through a deep convolutional generative adversarial network (DCGAN) with data applied using the augmentation policies of the CIFAR-10 dataset proposed by AutoAugment. In addition, we attempted to improve the performance of the model by using an image quality-measurement method for the generated images.
Related studies have proposed various augmentation methods using various medical images, such as lung CT images, brain MRIs, and endoscopy images, and a method that applies classification networks based on machine learning and deep learning. In this study, two methods were used to supplement the insufficient amount of data required for learning. In our method, a gastroscopy image is generated through a DCGAN using CNNs with excellent image-processing performance, and data are augmented by applying 25 policies optimized for the CIFAR-10 dataset suggested by AutoAugment. An image quality-measurement method, with the Xception network (a deep learning-based image-classification network), is applied for the augmented data. Then, only images that are similar to real images are selected and added to the training dataset. By including the image quality-measurement process, the increased image was verified, and only data that could improve the quality of learning were selected for performance improvement. The proposed method is expected to improve the accuracy of gastric-disease diagnosis and help doctors perform the diagnosis. Therefore, the classification network, data-augmentation method, and image quality-measurement method employed in this study will be described.

2. Materials and Methods

2.1. Dataset

The gastrointestinal endoscopy images used in this study were obtained from the Department of Gastroenterology at Gyeongsang National University Hospital and used with white-light endoscopy images that were approved by the Institutional Review Board. All endoscopy images were acquired using OLYMPUS GIF-HQ290. They were verified through an examination and a biopsy test conducted by a gastroenterologist. The data used in the experiment were obtained from 150 patients and randomly divided into a training dataset and a test dataset. The training and test datasets also were confirmed by a gastrointestinal endoscopy specialist (i.e., a gastroenterologist). As shown in Table 1, the training dataset of the actual gastroscopy images consisted of 655 normal and 655 abnormal images. The test dataset consisted of 164 normal and 164 abnormal images. Lesions with abnormalities include gastritis, gastric SMT (submucosal tumors), early gastric cancer, polyps, gastric ulcer, and bleeding. Figure 2 presents the normal and abnormal gastroscopy images from the dataset.

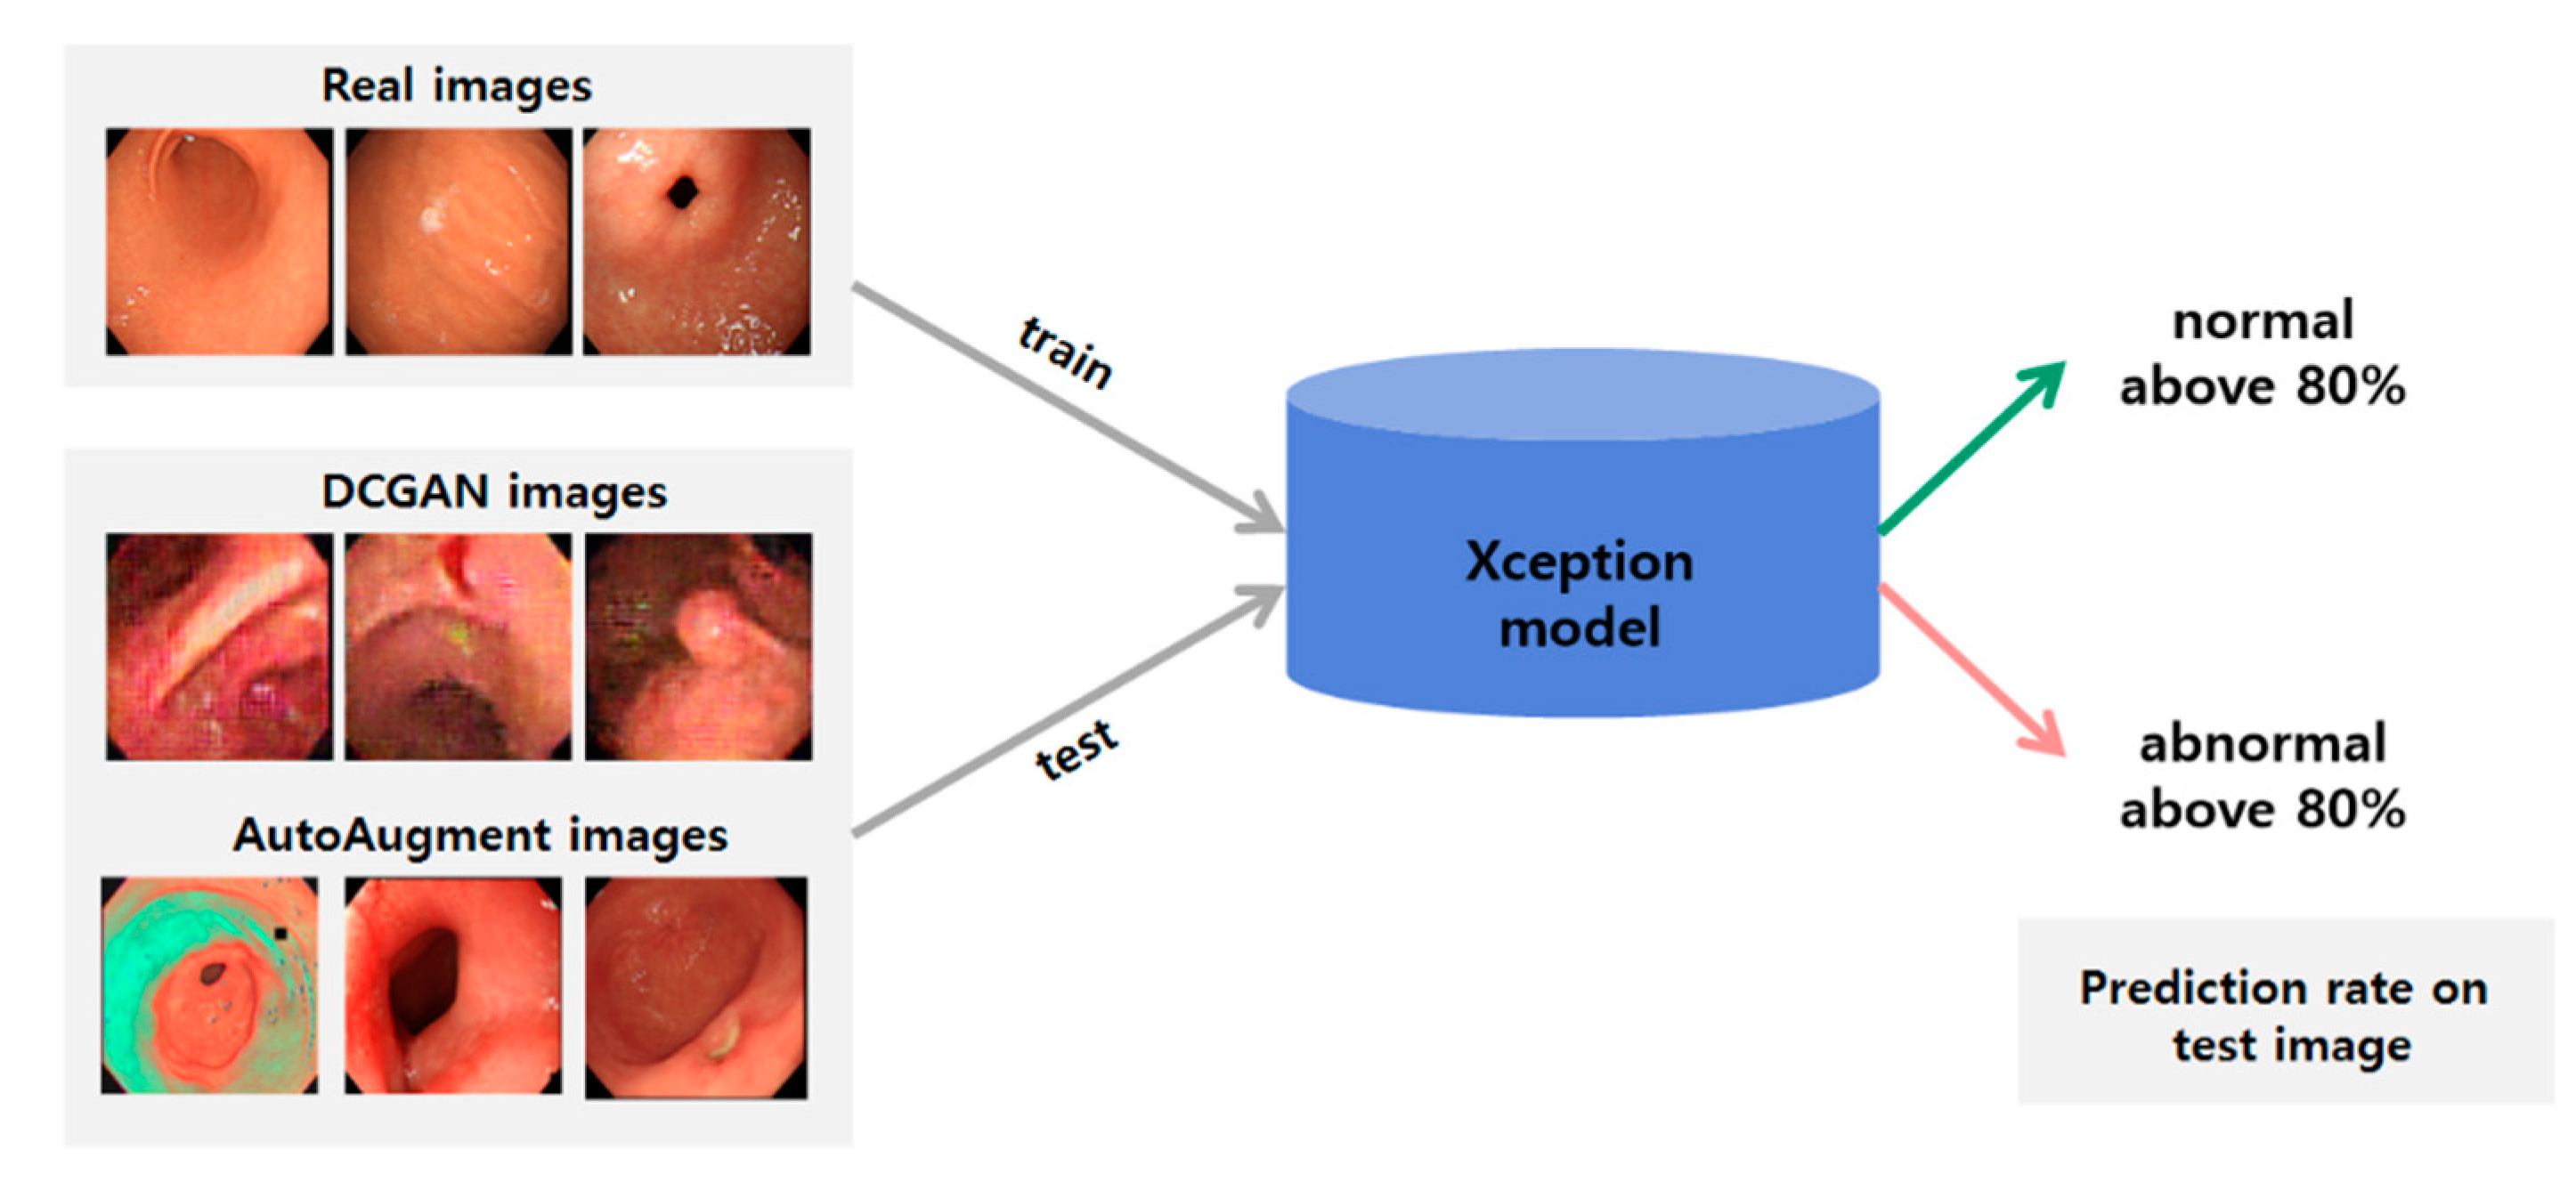
2.2. Classification Method

Xception is a model based on Inception. In addition to it reducing the connection between nodes using the Inception module in GoogLeNet, Xception is a network that separates finding the relationships between all the channels and finding local information [14]. Accordingly, the extreme version of the Inception module is proposed herein. As shown in Figure 3, after applying a 1 × 1 convolutional layer to the input, all the channels are separated, and each channel is individually operated for the 3 × 3 convolution. Xception uses a depth-wise separable convolution created by modifying the operation. In a depth-wise separable convolution, the convolution operation was performed for each channel, and a 1 × 1 convolutional layer was obtained. As shown in Figure 4, the standard convolution creates one feature map by considering all the channel and area information. Conversely, the depth-wise separable convolution adjusts the number of output feature maps by performing a 1 × 1 convolution operation, called point-wise convolution, after the depth-wise convolution operation that creates one feature map for each channel.

2.3. Generating Synthetic Gastroscopy Images

A large amount of high-quality training data is required to improve the performance of deep learning. However, medical data are difficult to collect because the process is expensive and takes considerable time to specify the ground truth of the lesion. This section describes the 25 policies of the CIFAR-10 dataset and DCGAN used to improve the performance of the model and an image quality-measurement method used to select high-quality data from the augmented data.

2.3.1. DCGAN

A GAN is a deep neural network architecture composed of two neural networks, namely generator and discriminator networks [15]. The generator network generates new data using existing data. The generator aims to generate new data similar to real data based on a randomly generated vector of numbers called a latent space. The discriminator distinguishes between real data and synthetic data through the generator. As shown in Figure 5, two neural networks are trained against each other by repeating the generation and discrimination processes. During the training, each of the two neural networks attempts to minimize its own objective functions. Equation (1) expresses the final objective function of the GAN.
min G   max D V ( D , G ) = E x ~ p d a t a ( x ) [ log D ( x ) ] + E z ~ p z ( z ) [ log ( 1 D ( G ( z ) ) ) ]  
The DCGAN used in this study was an improved GAN [16]. Since a fully connected layer was used in the GAN, the generation of high-resolution images by the generator is limited, and learning is not stable. The DCGAN addresses this limitation using convolutional layers in both subneural networks. In the DCGAN, discriminators classify images as real or fake using a dense classification layer. The generator takes a random noise vector from a uniform distribution and transforms it until it produces a final image. Figure 6 shows the structure of a generator that generates a 128 × 128 image. The generator takes one tensor with the shape of (batch size, 100) and outputs one tensor with the shape of (batch size, 128 × 128 × 3).

2.3.2. AutoAugment

Augmentation is proposed as one of the techniques to secure enough data to train deep-learning models. Augmentation refers to a methodology for obtaining new training data by applying artificial changes to a small amount of training data. The goal is to create data that are similar to the real data and secure new images by flipping or cropping the image. However, it is expensive and takes considerable effort to find an aggregation technique suitable for the data. Therefore, to solve this problem, we applied AutoAugment developed by Google.
The AutoAugment method employed in this study is an algorithm that automatically finds the most appropriate augmentation policy for an image dataset through reinforcement learning. The method presented by the Google Brain team at the Conference on Computer Vision and Pattern Recognition 2019 provides an optimal augmentation method for validated datasets such as ImageNet, Street View House Number (SVHN), and CIFAR-10 [17]. The CIFAR-10 dataset contains 50,000 training images, including cats, birds, and airplanes, and Google used data consisting of 4000 images randomly selected out of the 50,000 and collectively called them the “reduced CIFAR-10 dataset”. The ImageNet dataset consists of approximately 1.4 million images in 21,841 classes including people, animals, and musical instruments, and SVHN is a dataset composed by cropping the house number image from Google Street View. As shown in Figure 7, through a recurrent neural network (RNN), which is the controller that determines the augmentation technique policy, and the child network created by the controller, various augmentation policies are applied to the dataset. In this process, we obtained R, which is the performance accuracy, and updated R in the controller to find the best policy.
A total of 25 augmentation policies are presented, and one policy is composed of five subpolicies to find various augmentation techniques suitable for the data. The subpolicy consists of two operations. The operation method consists of ShearX/Y, TranslateX/Y, Rotate, AutoContrast, Invert, Equalize, Solarize, Posterize, Contrast, Color, Brightness, Sharpness, Cutout, and Sample Pairing functions, and n(T) = 16. For each operation, probability values (P = {0, 0.1, …, 1}, n(P) = 11) and strength values (M = {0, 1, …, 9} and n(M) = 10) were used. Consequently, a total of ( ( 16 × 11 × 10 ) 2 ) 5 = 2.9 × 10 32 candidate groups for image augmentation were defined in AutoAugment. In the learning process, these policies were randomly selected and applied to the training data for learning, and the classification was repeated to find an enhancement policy with improved performance to consequently determine the optimal policy. Accordingly, the optimal augmentation method was suggested according to the data characteristics.

2.4. Image Quality Measurement Method
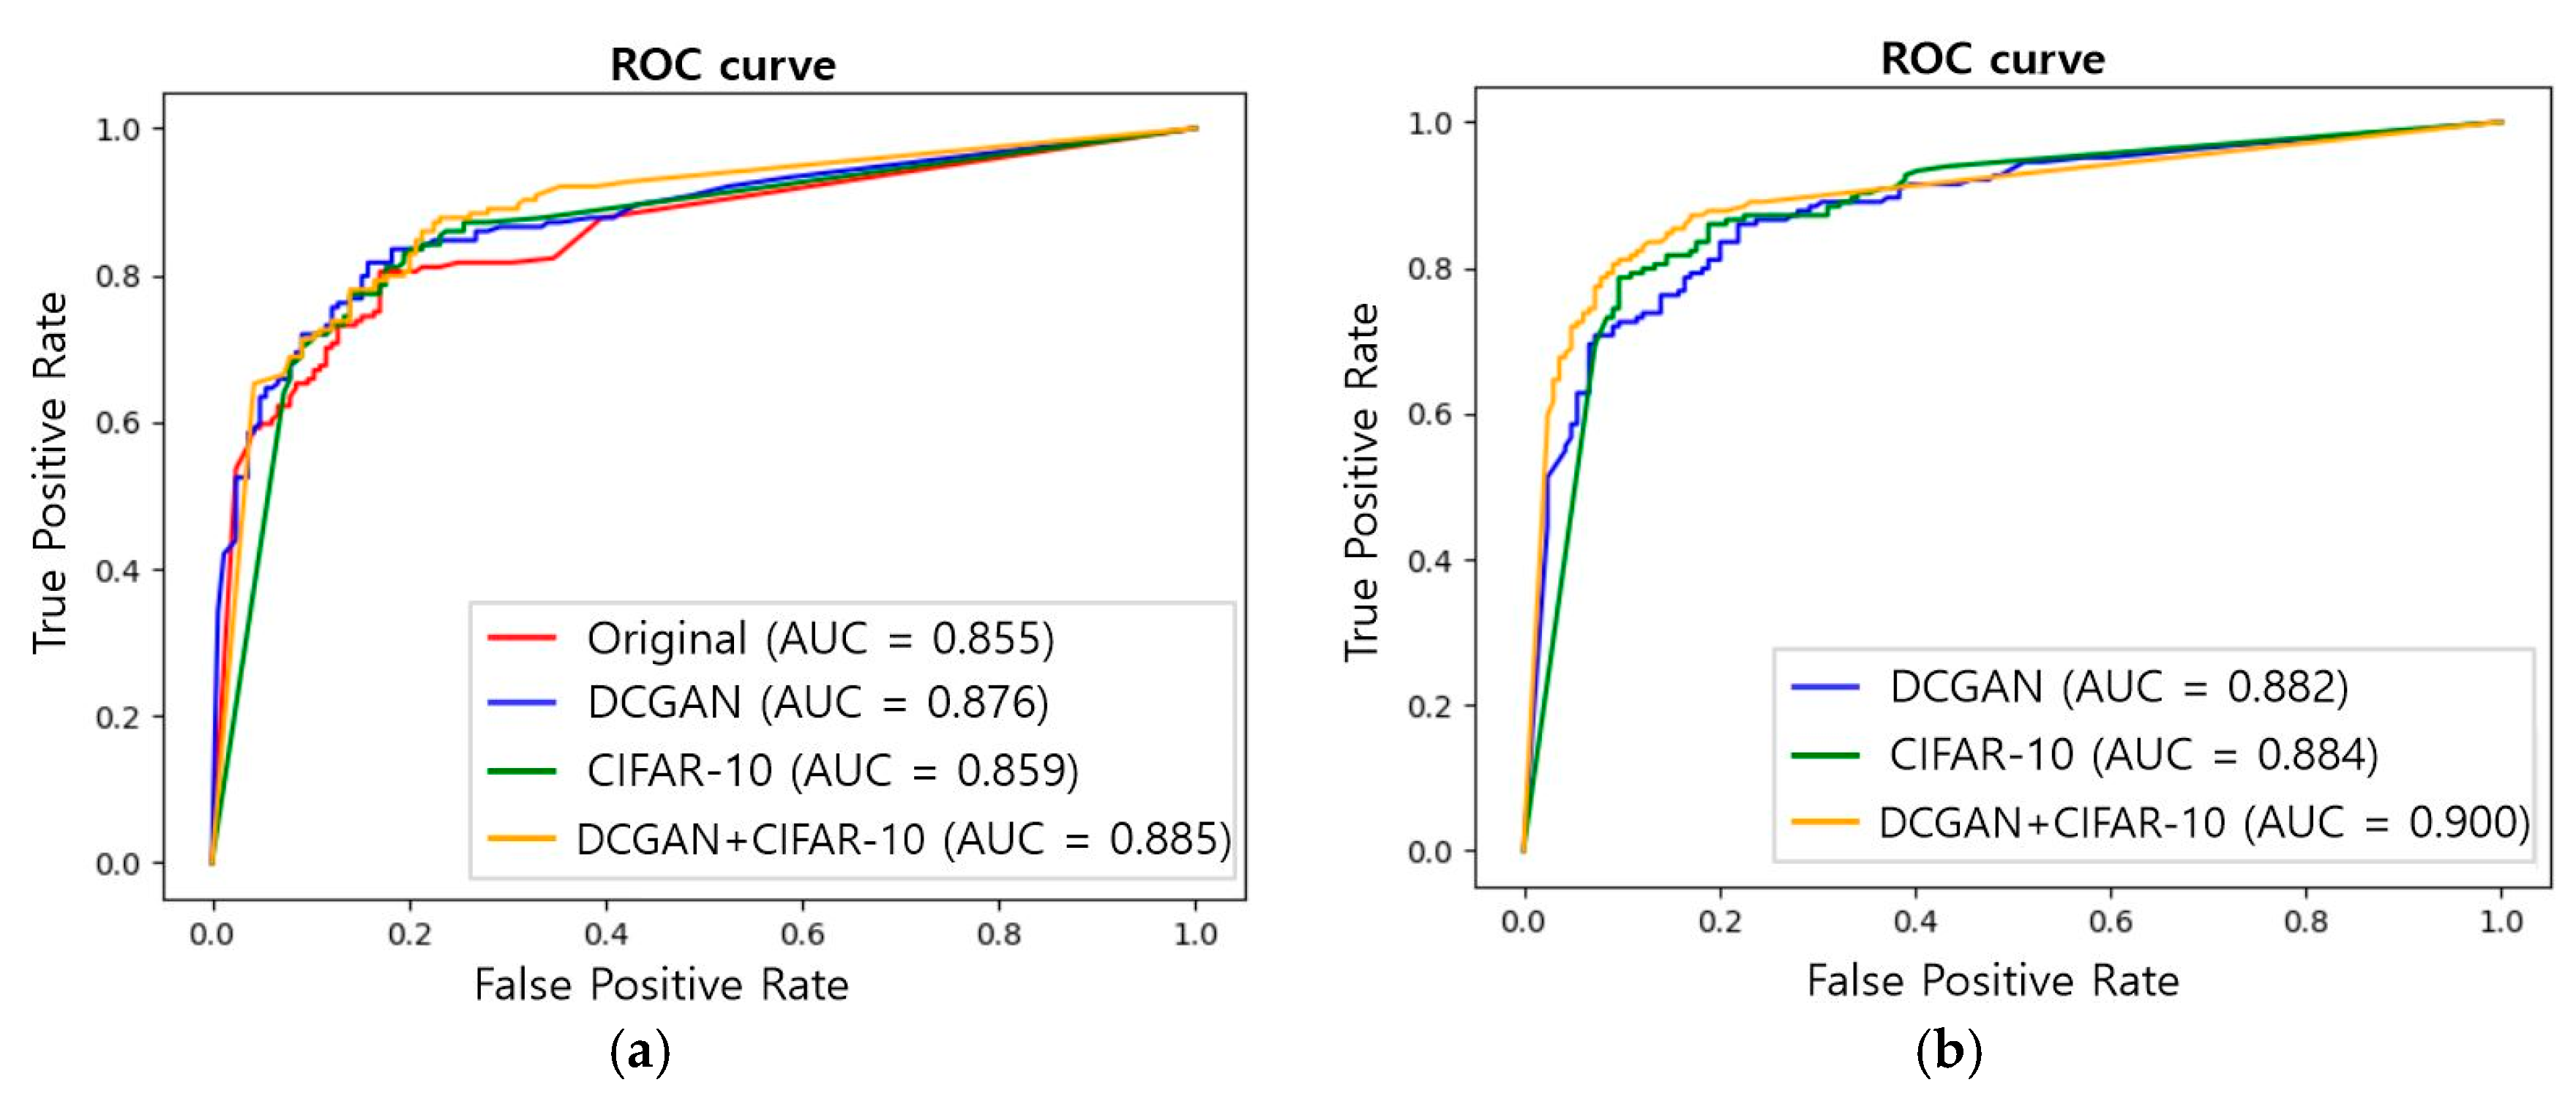
The quality of data generated through GAN is not automatically measured and must be inspected with the naked eye, rendering the optical judgment difficult. Therefore, to use only high-quality data for learning, a quantitative criterion for evaluating the generated data is required. Many studies have proposed criteria to measure the GAN performance. The inception score proposed by Shane Barratt [18] is the most widely used scoring algorithm for GANs. It measures the quality and diversity of the generated image by extracting the features of the real image and the image created using the pretrained Inception V3 neural network, where the higher the inception score, the better the quality of the model. The inception score can be calculated using Equation (2).
IS ( G ) = exp ( E x ~ p g D K L ( p ( y | x ) | | p ( y ) ) )
where p ( y | x ) is the conditional class distribution, x is the generated image, and y is the label. p ( y ) is the marginal class distribution and can be calculated using Equation (3).
p ( y ) =   p ( y | x ) p g ( x )
If the generated image is diverse, then p ( y ) approaches a uniform distribution. However, measuring the quality based on the inception score also encounters problems. If the model generates only one image per class, even if the diversity is low, p ( y ) may be close to a uniform distribution, thus resulting in incorrect performance.
Therefore, in this study, quality was evaluated by applying the method proposed by Shmelkov [19] to objectively evaluate the generated image. Our proposed method is to train a deep-learning model with a training dataset consisting only of real data and test newly created data to select only images with an accuracy of 0.8 or higher, among correctly classified images. Through this process, not only the images generated through GAN but also the quality of data augmented by 25 policies of the CIFAR-10 dataset were evaluated. As shown in Figure 8, the Xception model was trained with an actual gastroscopy image, and the data expanded through the 25 policies of CIFAR-10 and DCGAN were composed of a test dataset and classified as normal or abnormal. Correctly classified images mean that they are similar to real images, and only high-quality images were selected by selecting only images with a classification prediction degree of at least 0.8. Through this method, the quality of image was judged based on a quantitative standard rather than subjective evaluation.

3. Results

We propose a classification method for normal and abnormal gastroscopy images through CADx. Figure 9a presents the architecture of a basic deep-learning model using a dataset consisting of only real gastroscopy images. Figure 9b presents the architecture of a deep-learning model using training data that combines DCGAN and AutoAugment.
In a previous study [20], we applied 25 augmentation policies to optimize gastroscopy images in the CIFAR-10, ImageNet, and SVHN datasets. It was confirmed that the policies of the CIFAR-10 dataset are the most suitable for gastroscopy image classification. Therefore, in this study, the existing data were augmented 25 times by applying the optimized augmentation policies of the CIFAR-10 dataset. The augmentation policies—Equalize, AutoContrast, Color, and Brightness—were generally selected, and most of them chose color-based conversion. Moreover, we found that the results of Xception in the gastroscopy medical image classification were the best among four different deep-learning models, namely Xception, Inception-V3, Resnet-101, and Inception-Resnet-V2. Based on the results, we selected the Xception network for this study.
The DCGAN and the 25 augmentation policies of the CIFAR-10 dataset were implemented to augment the training data. After selecting data using the Xception-based image quality-measurement method, the augmented data were trained and tested. Among the collected training data, 655 normal and 655 abnormal images were used to generate 200 normal and 200 abnormal images through the DCGAN, which were increased by 25 times through the CIFAR-10 dataset, and a total of 11,744 normal and 11,744 abnormal images were selected. The selection criterion of the data was an accuracy of at least 0.8. To verify whether the image quality-measurement method is effective, we compared the performances of the model with and without the image quality-measurement method. We used the receiver operating characteristic curve (ROC curve), an evaluation index, and compared the performances with the Az value of the area under the curve.
Figure 10 presents the results of the classification performance of the models based on the ROC curve. As shown in Figure 10b, the Az values after adding 400 images through the DCGAN and after adding 23,488 images through the CIFAR-10 dataset were 0.882 and 0.884, respectively. After applying both DCGAN and CIFAR-10 datasets, the Az value was 0.9, which was the highest. The Az value was significantly (p ≤ 0.01) higher for the DCGAN + CIFAR-10 than for the DCGAN and CIFAR-10. However, the difference between the DCGAN+CIFAR-10 and the original did not reach statistical significance (p ≥ 0.01). The results confirmed that when data were augmented, the performance of all the data was improved, compared to the original data. Moreover, the model with the image quality-measurement method outperformed the model without the image quality-measurement method.
In addition, after making correct predictions for normal and abnormal images based on the confusion matrix, the performance was improved in terms of the accuracy, precision, recall, and F1 score, as computed using Equations (4)–(7).
Accuracy =   T P + T N T P + T N + F P + F N
Precision =   T P T P + F P
Recall =   T P T P + F N
F 1 Score = 2 × P r e c i s i o n × R e c a l l P r e c i s i o n + R e c a l l
A true positive (TP) is a value that represents correct classification of an abnormal image as an abnormal image, a false negative (FN) is a value that represents incorrect classification of an abnormal image as a normal image, a false positive (FP) is a value that represents incorrect classification of a normal image as an abnormal image, and a true negative (TN) is a value that represents correct classification of a normal image as a normal image. Precision refers to the ratio of correctly predicted abnormal images to total predictions of images as abnormal images, and recall refers to the ratio of correctly predicted abnormal images to total actual abnormal images. Accuracy refers to the correctly classified proportion in all the cases, and the F1 score is the harmonic average of precision and recall. After increasing the data using both the DCGAN and CIFAR-10, the method has an accuracy of 0.851 and F1 score of 0.841, which improves the performance by approximately 0.06, compared to the model without data augmentation, as shown in Table 2. The values in brackets in the table are the results of the model without the image quality-measurement method. Thus, the results confirmed that the model with the image quality-measurement method delivered a better overall performance than the model without the method.

4. Discussion

In this study, the data required for learning were secured by applying an image-generation method through the DCGAN and an automated augmentation method using a CNN and RNN. Through the Xception-based image quality-measurement method, it has been augmented by approximately 18 times, compared to the existing training data. Comparing the performance of the model with the augmented data, the AutoAugment with the CIFAR-10 dataset is more suitable for the classification of actual gastroscopy images because it delivers better performance than that of the DCGAN. Since a larger amount of data are required to generate various types of data through the DCGAN, data with relatively better quality than that of CIFAR-10 could not be obtained. Moreover, many of the AutoAugment policies of the CIFAR-10 dataset are based on a variety of colors, which seem to yield superior classification results on the gastroscopy images. In this study, our proposed model, which aims to augment data using the DCGAN and CIFAR-10 datasets, delivered superior performance. The accuracy, Az value, and F1 score of the model were 0.851, 0.9, and 0.841, respectively. The value of precision increased to 0.896, but the value of recall decreased to 0.793. The higher the values of both indicators, the better the model. However, the two values have a trade-off relationship; thus, the higher the precision, the lower the recall. The findings of this study confirm that the classification model generated through the DCGAN and the policies of the CIFAR-10 dataset with the addition of an image quality-measurement method performs the best. Moreover, securing sufficient learning data by augmenting data through the DCGAN and CIFAR-10, as proposed herein, and selecting data through an image quality-measurement method are effective in improving the performance.
This paper proposed a method of solving the problem of performance deterioration of deep learning owing to insufficient data. The proposed method augments the data required for learning and solves the problem of the lack of data through the image quality-evaluation process. Not only in the medical field but also in various areas, such as defect inspection in a smart factory, pest classification, and distracted driving detection, the problem of data shortage is being solved by data augmentation [21,22,23]. The method proposed herein is expected to be applicable to not only medical images but also various areas where data are insufficient. Future studies will be required to evaluate the adaptability of our methods to other modalities.
To generate data through DCGAN, there is a limitation in that the larger the amount of data, the more diverse and high-quality data can be generated. Therefore, in the future, we plan to conduct research to generate data through a GAN after going through different data-augmentation methods. In addition, we planned to compare the performance of the model by creating an image through a different type of GAN other than DCGAN or applying it to other CNN models.

5. Conclusions

Deep neural networks are effective when trained with a large supervised dataset. However, acquiring such a dataset used in a CADx system is a difficult task. Herein, we proposed a computer-assisted diagnostic system that generates data through a DCGAN and increases the amount of data by implementing the augmentation policies of the CIFAR-10 dataset. An image quality-measurement method was used to select accurate data from the augmented data. Our results revealed the performance of the proposed model in terms of accuracy, precision, recall, Az value, and F1 score. The model that used the two methods, DCGAN and Cifar10, delivered 5% superior Az value results than those that did not use these two methods. It delivered the accuracy and F1 score that were about 6% better than that of the existing method. Therefore, the method of using the DCGAN and CIFAR-10 dataset policies, along with the image quality-measurement method proposed herein, was suitable for solving the problem of acquiring large datasets for training deep neural networks.

Author Contributions

Conceptualization, H.-c.C. and H.C.C.; methodology, H.-c.C., H.C.C. and Y.-j.K.; software, H.-c.C. and Y.-j.K.; validation, H.C.C., H.-c.C. and Y.-j.K.; formal analysis, H.-c.C. and H.C.C.; data curation, H.C.C.; writing-original draft preparation, H.-c.C. and Y.-j.K.; writing-review and editing, H.-c.C., H.C.C. and Y.-j.K. All authors have read and agreed to the published version of the manuscript.

Funding

This work was supported by the National Research Foundation of Korea (NRF) grant funded by the Korea government (MSIT) (No. 2017R1E1A1A03070297). This research was supported by the MSIT (Ministry of Science and ICT), Korea, under the ITRC (Information Technology Research Center) support program (IITP-2020-2018-0-01433) supervised by the IITP (Institute for Information and communications Technology Promotion).

Institutional Review Board Statement

The study was conducted according to the guidelines of the Declaration of Helsinki and approved by the Institutional Review Board of Gyeongsang National University Hospital (GNUH 2017-09-019-003 and October 24, 2017).

Informed Consent Statement

Informed consent was obtained from all subjects involved in the study.

Data Availability Statement

The data presented in this study are available on request from the corresponding author. It needs additional IRB approval.

Conflicts of Interest

There is no conflict of interest to declare.

Ethical Approval

This article does not contain any studies with human participants or animals performed by any of the authors.

References

  1. Bray, F.; Ferlay, J.; Soerjomataram, I.; Siegel, R.L.; Torre, L.A.; Jemal, A. Global cancer statistics 2018: GLOBOCAN estimates of incidence and mortality worldwide for 36 cancers in 185 countries. CA Cancer J. Clin. 2008, 68, 394–424. [Google Scholar] [CrossRef] [PubMed] [Green Version]
  2. Lim, E.-K.; Kim, K.-H.; Kim, K.-B. Endoscopic image analysis system for early gastric cancer. In Proceedings of the Korean Intelligent Systems Society, Seoul, Korea, 29 April–30 April 2005; Volume 15, pp. 255–260. [Google Scholar]
  3. Rolnick, D.; Veit, A.; Belongie, S.; Shavit, N. Deep learning is robust to massive label noise. arXiv 2017, arXiv:1705.10694. [Google Scholar]
  4. Frid-Adar, M.; Diamant, I.; Klang, E.; Amitai, M.; Goldberger, J.; Greenspan, H. GAN-based synthetic medical image augmentation for increased CNN performance in liver lesion classification. Neurocomputing 2018, 321, 321–331. [Google Scholar] [CrossRef] [Green Version]
  5. Zafar, K.; Gilani, S.O.; Waris, A.; Ahmed, A.; Jamil, M.; Khan, M.N.; Sohail Kashif, A. Skin Lesion Segmentation from Dermoscopic Images Using Convolutional Neural Network. Sensors 2020, 20, 1601. [Google Scholar] [CrossRef] [Green Version]
  6. Shin, H.-C.; Tenenholtz, N.A.; Rogers, J.K.; Schwarz, C.G.; Senjem, M.L.; Gunter, J.L.; Andriole, K.; Michalski, M. Medical image synthesis for data augmentation and anonymization using generative adversarial networks. In International Workshop on Simulation and Synthesis in Medical Imaging; Springer: Granada, Spain, 2018; pp. 1–11. [Google Scholar]
  7. Dai, W.; Dong, N.; Wang, Z.; Liang, X.; Zhang, H.; Xing, E.P. Scan: Structure correcting adversarial network for organ segmentation in chest x-Rays. In Deep Learning in Medical Image Analysis and Multimodal Learning for Clinical Decision Support; Springer: Berlin/Heidelberg, Germany, 2018; pp. 263–273. [Google Scholar]
  8. Zhao, D.; Zhu, D.; Lu, J.; Luo, Y.; Zhang, G. Synthetic medical images using F&BGAN for improved lung nodules classification by multi-scale VGG16. Symmetry 2018, 10, 519. [Google Scholar]
  9. Gomes Ataide, E.J.; Ponugoti, N.; Illanes, A.; Schenke, S.; Kreissl, M.; Friebe, M. Thyroid Nodule Classification for Physician Decision Support Using Machine Learning-Evaluated Geometric and Morphological Features. Sensors 2020, 20, 6110. [Google Scholar] [CrossRef] [PubMed]
  10. Lyu, J.; Bi, X.; Ling, S.H. Multi-Level Cross Residual Network for Lung Nodule Classification. Sensors 2020, 20, 2837. [Google Scholar] [CrossRef] [PubMed]
  11. Asperti, A.; Mastronardo, C. The effectiveness of data augmentation for detection of gastrointestinal diseases from endoscopical images. arXiv 2017, arXiv:1712.03689. [Google Scholar]
  12. Togo, R.; Ogawa, T.; Haseyama, M. Synthetic gastritis image generation via loss function-based conditional pggan. IEEE Access 2019, 7, 87448–87457. [Google Scholar] [CrossRef]
  13. Nguyen, D.T.; Lee, M.B.; Pham, T.D.; Batchuluun, G.; Arsalan, M.; Park, K.R. Enhanced Image-Based Endoscopic Pathological Site Classification Using an Ensemble of Deep Learning Models. Sensors 2020, 20, 5982. [Google Scholar] [CrossRef] [PubMed]
  14. Chollet, F. Xception: Deep learning with depthwise separable convolutions. In Proceedings of the IEEE Conference on Computer Vision and Pattern Recognition, Honolulu, HI, USA, 21 July–26 July 2017; pp. 1251–1258. [Google Scholar]
  15. Goodfellow, I.; Pouget-Abadie, J.; Mirza, M.; Xu, B.; Warde-Farley, D.; Ozair, S.; Courville, A.; Bengio, Y. Generative adversarial nets. Adv. Neural Inf. Process. Syst. 2014, 27, 2672–2680. [Google Scholar]
  16. Radford, A.; Metz, L.; Chintala, S. Unsupervised representation learning with deep convolutional generative adversarial networks. arXiv 2015, arXiv:1511.06434. [Google Scholar]
  17. Cubuk, E.D.; Zoph, B.; Mane, D.; Vasudevan, V.; Le, Q.V. Autoaugment: Learning augmentation policies from data. arXiv 2018, arXiv:1805.09501. [Google Scholar]
  18. Barratt, S.; Sharma, R. A note on the inception score. arXiv 2018, arXiv:1801.01973. [Google Scholar]
  19. Shmelkov, K.; Schmid, C.; Alahari, K. How good is my GAN? In Proceedings of the European Conference on Computer Vision (ECCV), Munich, Germany, 8–14 September 2018; pp. 213–229. [Google Scholar]
  20. Shin, S.-A.; Kim, D.-H.; Cho, H.-C. Deep Learning Based Gastric Lesion Classification System Using Data Augmentation. Trans. Korean Inst. Electr. Eng. 2020, 69, 1033–1039. [Google Scholar]
  21. Yun, J.P.; Shin, W.C.; Koo, G.; Kim, M.S.; Lee, C.; Lee, S.J. Automated defect inspection system for metal surfaces based on deep learning and data augmentation. J. Manuf. Syst. 2020, 55, 317–324. [Google Scholar] [CrossRef]
  22. Kusrini, K.; Suputa, S.; Setyanto, A.; Agastya, I.M.A.; Priantoro, H.; Chandramouli, K.; Izquierdo, E. Data augmentation for automated pest classification in Mango farms. Comput. Electron. Agric. 2020, 179, 105842. [Google Scholar] [CrossRef]
  23. Wang, J.; Wu, Z.; Li, F.; Zhang, J. A Data Augmentation Approach to Distracted Driving Detection. Future Internet 2021, 13, 1. [Google Scholar] [CrossRef]
Figure 1. Distribution of cases and deaths for the five most common cancers in 2018: (a) incidence and (b) mortality.
Applsci 11 00760 g001
Figure 2. Normal and abnormal gastroscopy images in the dataset: (a) normal; (b) gastritis; (c) gastric SMT; and (d) gastric cancer.
Applsci 11 00760 g002
Figure 3. Extreme version of the inception module.
Applsci 11 00760 g003
Figure 4. Types of convolution: (a) standard convolution and (b) depth-wise separable convolution.
Applsci 11 00760 g004aApplsci 11 00760 g004b
Figure 5. Architecture of the general adversarial network (GAN).
Applsci 11 00760 g005
Figure 6. Generator architecture of the deep convolutional generative adversarial network (DCGAN).
Applsci 11 00760 g006
Figure 7. Process of Google’s AutoAugment.
Applsci 11 00760 g007
Figure 8. Process of the image quality measurement method.
Applsci 11 00760 g008
Figure 9. Structure of the gastroscopy image classification model: (a) original and (b) DCGAN and 25 augmentation policies of the CIFAR-10 dataset.
Applsci 11 00760 g009
Figure 10. Gastric cancer classification model performance based on the ROC curve: (a) models with no image quality measurement method and (b) models with the image quality measurement method.
Applsci 11 00760 g010
Table 1. Classification of images in the datasets.
NormalAbnormal
Training datasetOriginal655655
Synthetic11,94411,944
Test dataset164164
Total12,76312,763
Table 2. Model performance for gastric cancer classification.
AccuracyPrecisionRecallF1 Score
Original0.7960.8390.7320.782
DCGAN0.811 (0.814)0.823 (0.825)0.793 (0.774)0.807 (0.804)
CIFAR-100.832 (0.805)0.819 (0.825)0.854 (0.774)0.836 (0.799)
DCGAN+CIFAR-100.851 (0.820)0.896 (0.800)0.793 (0.854)0.841 (0.826)
Publisher’s Note: MDPI stays neutral with regard to jurisdictional claims in published maps and institutional affiliations.

