Article

Classification and Quantification of Human Error in Manufacturing: A Case Study in Complex Manual Assembly

1
Department of Mechanical Engineering, École de Technologie Supérieure (ÉTS), 1100 Notre-Dame St W, Montreal, QC H3C 1K3, Canada
2
Institute of Ergonomics and Human Factors, Technische Universität Darmstadt, Otto-Berndt-Straße 2, 64287 Darmstadt, Germany
*
Authors to whom correspondence should be addressed.
Appl. Sci. 2021, 11(2), 749; https://doi.org/10.3390/app11020749
Submission received: 15 December 2020 / Revised: 9 January 2021 / Accepted: 10 January 2021 / Published: 14 January 2021
(This article belongs to the Special Issue Applied Engineering to Lean Manufacturing and Production Systems 2020)

Abstract

:
Manual assembly operations are sensitive to human errors that can diminish the quality of final products. The paper shows an application of human reliability analysis in a realistic manufacturing context to identify where and why manual assembly errors occur. The techniques SHERPA and HEART were used to perform the analysis of human reliability. Three critical tasks were selected for analysis based on quality records: (1) installation of three types of brackets using fasteners, (2) fixation of a data cable to the assembly structure using cushioned loop clamps and (3) installation of cap covers to protect inlets. The identified error modes with SHERPA were: 36 action errors, nine selection errors, eight information retrieval errors and six checking errors. According to HEART, the highest human error probabilities were associated with assembly parts sensitive to geometry-related errors (brackets and cushioned loop clamps). The study showed that perceptually engaging assembly instructions seem to offer the highest potential for error reduction and performance improvement. Other identified areas of action were the improvement of the inspection process and workers’ provision with better tracking and better feedback. Implementation of assembly guidance systems could potentially benefit worker’s performance and decrease assembly errors.

1. Introduction

An efficient and reliable assembly process is a critical aspect of manufacturing, ensuring that the final product meets the required quality level. Engineers usually consider several variables when selecting an appropriate assembly system. Among them are flexibility, productivity, product variants and production volume [1]. Figure 1 shows the relationship between some of these variables and the level of automation in the assembly system. The development of industrial robotics has induced a significant increase in the automation and productivity of manufacturing processes, including assembly [2]. However, in manufacturing domains where product complexity and variety present particular challenges, manual work remains a viable alternative. This is the case of such manufacturing domains as consumer electronics [3], aerospace manufacturing [4,5], combustion engine assembly [6], automotive manufacturing [7,8] and the production of industrial machines and tools [9,10]. Hence, for manual assembly to yield a final product of the appropriate level of quality, several operations must be executed properly. For example: selecting, handling and fitting parts; checking; applying force; and retrieving and analyzing information. Unfortunately, these operations are susceptible to human error and represent potential sources of defects. Swain and Guttmann [11] define human errors as “any member of a set of human actions that exceed some limit of acceptability, i.e., an out-of-tolerance action, where the limits of tolerable performance are defined by the system”. Common error-related defects in manual assembly processes include loose connections, missing components, the installation of wrong components, improper application of force to fasteners, damage during assembly and contamination by foreign object debris [12,13]. Poor physical and cognitive ergonomics have been found to increase errors and impact product quality [12,14]. The links between human factors, errors and quality issues have been recognized in the literature [15]. Human errors are to be avoided to limit economic losses associated with defects and unnecessary waste. For this reason, ergonomics and human factors discipline is considered to be a key practice area within the lean manufacturing approach [12].
With the introduction of Industry 4.0, manufacturing will experience an increase in product customization under the conditions of highly flexible (large scale) production [13]. According to Thoben et al. [14], this mass customization is expected to escalate production complexity and could increase the demands on human operators’ skills. In this context, optimizing the working system is necessary to minimize human error. Identifying and understanding the factors that affect assemblers’ performance is the first step in the implementation of effective strategies. Bubb [15] argues that human reliability is crucial to improve quality in the manufacturing sector. However, human reliability research has mostly focused on safety, while less attention has been paid to the manufacturing sector and to manual assembly specifically [16]. To close this gap, this paper applies classic human reliability analysis (HRA) techniques to a realistic case study of complex manual assembly. It assumes that some HRA techniques, developed and mostly used in safety-critical domains, can also be useful in the analysis of human error in manual assembly context. The study’s main goal is to understand where and why manual assembly errors occur by identifying the most common error modes, evaluating them, and determining the factors that influence the assemblers’ performances. The paper also discusses potential strategies for the reduction of errors, including new technological approaches.
The research is articulated around a case study of complex manual assembly in a manufacturing setting (described in detail later in the paper). This case study is intended to provide new insights into human-related effects of assembly processes, which might lead to new work design solutions and generate new research questions. Additionally, previous results of human reliability analysis may be critically questioned. The case study method is recognized as having an impact on the generalization of theoretical and empirical findings and it offers the possibility of studying a defined situation in great detail [17]. This methodological approach is especially suitable when researchers require a holistic, in-depth investigation that demands that research goes beyond the study of isolated variables. The examination of the manual assembly context object of study is an integral aspect of the understanding of the interactions within. This examination favors the collection of data in real settings [18]. In the present paper, a complex manual assembly is defined as an assembly task that requires specialized knowledge and skills for the worker to be able to complete the task. Additionally, the assembled object is composed of a high number of parts with a high number of possible choices among them, while the geometry of the assembled object has several symmetric planes [19]. The cognitive demands on the assembler as a consequence of information perception and information processing are relatively high [20]. The conceptual debate around definitions of complexity is beyond the scope of this article and is the focus of different scientific teams; we, therefore, invite the reader to consult the literature on this behalf [21,22,23].

2. Literature Review

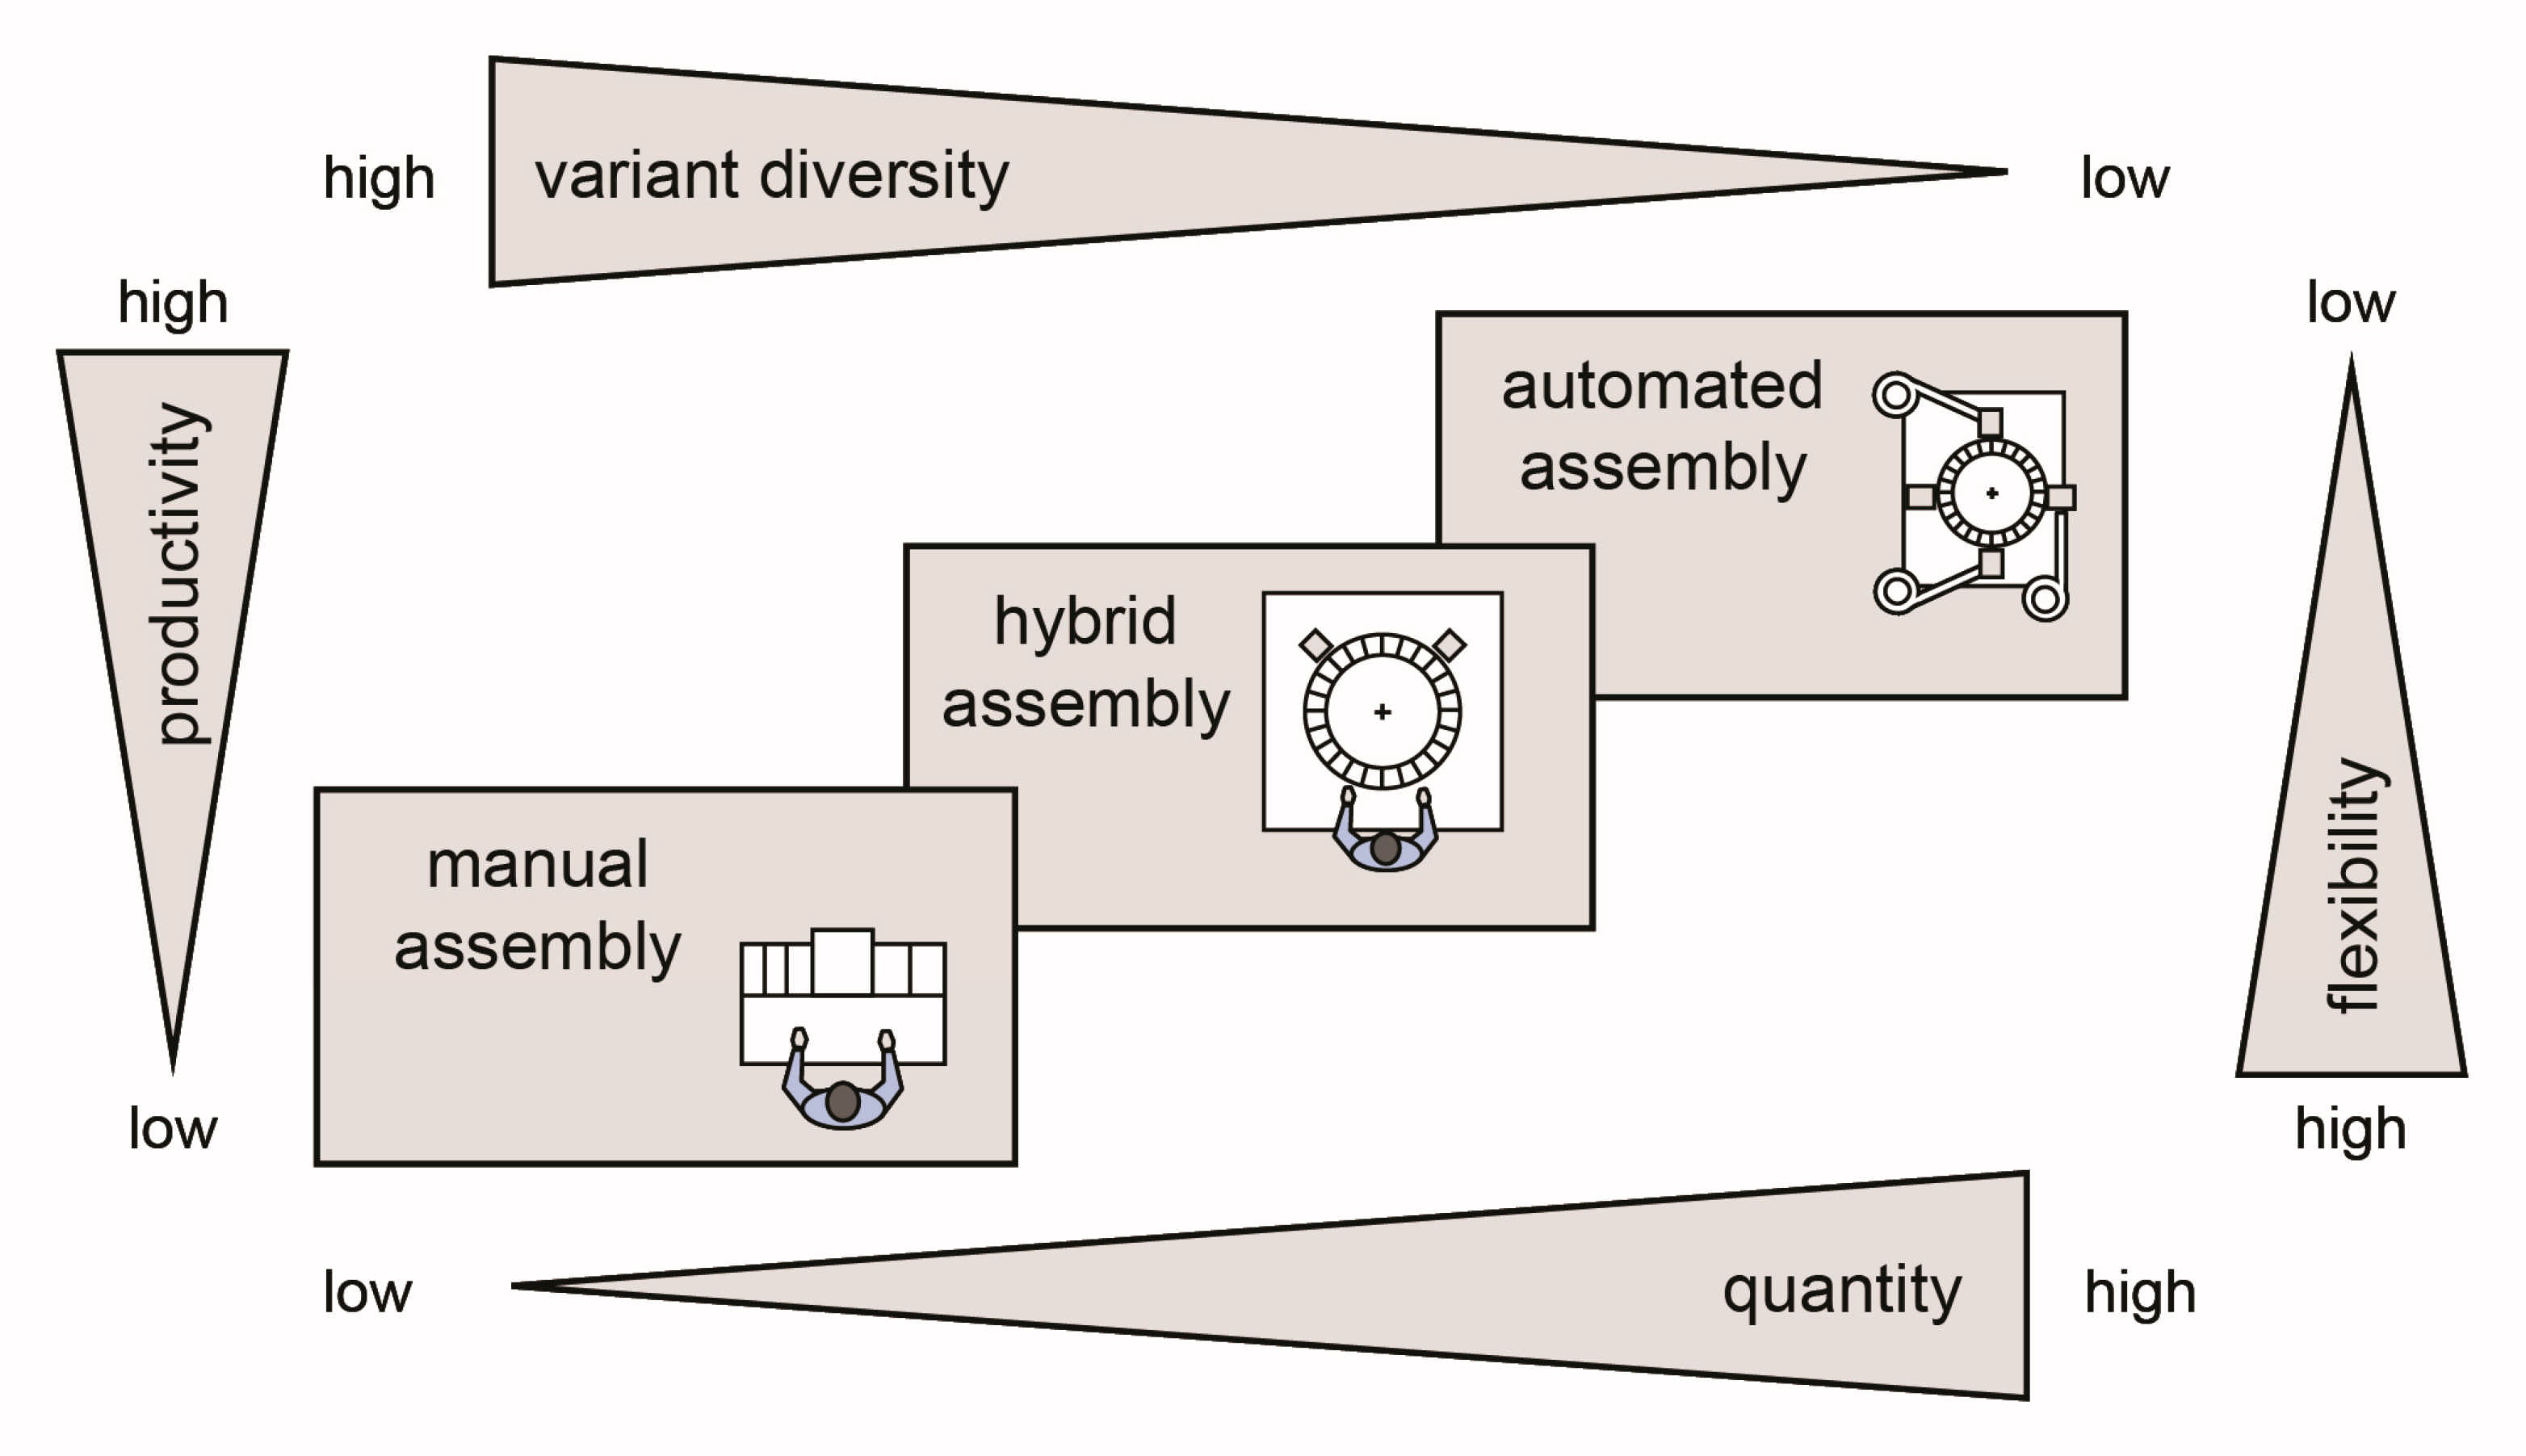
2.1. Some Considerations about Manual Assembly

According to Swift and Booker [24], manual assembly “involves the composition of previously manufactured components or sub-assemblies into a complete product or unit of a product, primarily performed by human operators using their inherent dexterity, skill and judgment”. Richardson et al. [19] describe manual assembly as a spatial problem-solving activity that requires that workers build a mental model to understand and manipulate spatial information. The quality of the information contained in work instructions, the way this information is presented and how the worker interacts with this information are particularly important in manual assembly processes [25,26,27,28]. To take full advantage of the assemblers’ cognitive abilities, work instructions should clearly and unambiguously describe which components to use and how they should be assembled [27]. One accepted principle is that these instructions must be presented in such a way that anyone can understand them and conduct assembly accordingly [29]. This way, work instructions can help to reduce the assemblers’ cognitive workloads, particularly by minimizing dynamic complexity.
In modern manual assembly processes, work instructions are generally provided electronically and presented on a computer screen, as text supported by visual information [25,28]. However, according to Mattsson et al. [30], instructions need to be more perceptual, which means that richer and more immediate sensory inputs should be provided to the assembler. Using three-dimensional models in work instructions can show the assembly process in a more realistic, accurate and intuitive fashion. Such model-based instructions (MBI) may present multiple views and easy-to-follow assembly procedures [31,32]. Recent technologies, such as augmented reality (AR), seem to promise even better means of delivering work instructions to assemblers. In a recent literature review, AR was identified as one of the two most promising technologies to support humans in manufacturing contexts, along with collaborative robots [33]. However, applications of AR are still in development and the technology has not reached full technological maturity [34,35].
Choosing the right parts during the assembly requires a certain amount of information processing and decision making, which is why the use of kitting systems has been explored as a strategy to minimize this cognitive load [36]. Parts kitting is a logistics technique used to deliver groups of parts together in one or more kit containers [37]. Generally, kits are prepared in a warehouse and delivered to the assembly line, to specific workstations, according to the production schedule. When kits are prepared properly, parts are supposed to be easily available, checked, and prepositioned so that they can be removed rapidly from the container [38]. According to Brolin [25], a kit can be considered as a “carrier of information” for assembly, meaning that work instructions are embedded in the kit itself. Medbo [39] argues that appropriately structured kits can support assemblers and even facilitate learning. According to Caputo et al. [37], kitting systems provide the opportunity for in-process quality control and additional checks, both in the kitting room or at the workstation. Kitting can therefore reduce the risk of a wrong part being assembled or of a part being omitted by providing direct feedback to the assembler. Past research suggests that kitting may yield better quality and productivity when compared to other parts feeding policies [25,39,40].
It has been acknowledged that errors cannot be entirely eliminated because they are considered to be a normal consequence of human variability [41]. Thus, during manual assembly, inspection is required to verify that a product is free of defects before it is transferred to the next level of assembly or shipped to the customer [42]. In this way, inspection allows the system to recover from human error. Historically, workers have performed these inspections visually. However, the limitations of humans as visual inspectors have long been recognized [43,44]. For this reason, automated visual inspection (AVI) has long been used in the manufacturing industry for quality control and monitoring [45,46]. As gains in computational power yield enhanced image acquisition, processing and analysis capabilities, automation replaces human visual inspection more and more often [42,47]. For example, a robot can take pictures of the final product to detect deviations and nonconformities. Such a system can validate the quality of final assembly based on its ability to perform optical characteristics recognition, such as detecting whether a specific component is absent. However, even though machine vision has been used in quality inspection for several years, it seems that technological challenges remain. According to Sobel [48] “Many of the advances we take for granted in modern computing—ubiquitous connectivity, unlimited data storage in the cloud, insights drawn from massive unstructured data sets—have yet to be applied systematically to the factory floor in general and to computer vision specifically”. One drawback of centralized automated inspection at the end of the assembly line is that the identification of nonconformities is made too late and the cost of reworking may be considerable. Lean approaches seek to ensure the quality of the assembled object before it leaves the workstation to minimize costs and delays by eliminating waste [49]. As machine vision continues to evolve, it would be reasonable to expect that automated visual inspection might become sufficiently flexible to come to the assembly workstation. Thus, a centralized automated inspection would shift to an in-process, ubiquitous automated inspection carried out with a smart assistance system. These systems could combine, for example, wearable augmented reality with automated visual inspection [50,51] or use collaborative robots for automated visual inspection [52,53].

2.2. Human Reliability Analysis: Origins and Applications in Assembly Systems

According to Embrey [54], the essence of human reliability analysis (HRA) is the prediction and mitigation of error to optimize safety, reliability and productivity. HRA’s main focus is the identification of sources of human error and the quantification of the likelihood of such errors [55]. Over the years, the discipline of HRA has proposed several techniques [56,57], which stem from the need to quantify human error for probabilistic safety analysis (PSA) in the nuclear sector [58,59]. Other industries where HRA has been applied include aerospace, offshore oil extraction and chemical processing, all of them safety-critical domains [60,61]. Human reliability analysis represents the intersection of reliability engineering and human factors research [62]. Reliability engineering seeks to predict overall system reliability based on system configuration and probabilistic estimates of component failures [63]. According to Boring et al. [55], human factors research provides the empirical basis to support predicting human performance in HRA. In practical terms, human performance is predicted by calculating human error probability (HEP). Mathematically, human error is treated as the failure of a technical component. However, some HRA techniques focus on human error identification rather than the calculation of human error probabilities [64,65].
Failure mode and effects analysis (FMEA) is a well-established reliability engineering technique used to assess vulnerabilities in a system proactively [66]. It has been used in manufacturing and manual work [67]. Quality function deployment (QFD), a quality research technique, has also been used to redesign product functionality to reduce complexity in assembly [68]. Despite these examples, a recent literature review by Pasquale et al. [16] concluded that: “a prospective analysis of human reliability in the manual assembly systems until now has been neglected in the literature and few papers investigated the range of human error and the type of errors that occur in this field”. However, this conclusion is based on a rather small number of relevant documents, i.e., 20 peer-reviewed papers published in English between 2005 and 2017. Authors from manufacturing powerhouses like Germany, France and Japan, who published in their native languages, were not considered. While non-exhaustive, Table 1 shows additional developments and applications of HRA to manufacturing and manual assembly.
Broadly speaking, there are two main approaches to human reliability in manual assembly: the development of context-specific techniques [37,69,70] and the application of classic HRA techniques with or without modifications [6,15,71]. Context-specific methods are expected to provide more precision in the calculation of HEP, but they are more resource-intensive. For example, methods time and quality measurement (MTQM), developed in Germany, requires in-depth knowledge of predetermined motion time systems (PMTS) and high investments in training time and money [72]. Little information about context-specific techniques is available, which hinders replication of the analysis process. On the other hand, classic HRA techniques like THERP (technique for human error rate prediction), HEART (human error assessment and reduction technique) or SHERPA (systematic human error reduction and prediction approach) are well represented in the literature and enough information is available to carry out an analysis. Furthermore, the importance of obtaining a precise final value of HEP depends on the intended final use of this numerical value. Kern and Refflinghaus [73] used assembly specific databases as part of MTQM, to calculate precise estimates of HEP. This is necessary because HEP values are used as part of a production planning tool to conduct cost–benefit analysis. More recently, Torres et al. [74] proposed an intervention framework for the analysis of human error in manual assembly. This framework is based on the use of well-known HRA techniques and is in line with the idea proposed by Bubb [15], who suggests using HRA to identify error modes and calculate human error probabilities (HEP) in manual assembly.
Table 1. Some developments and applications of human reliability analysis (HRA) to manual assembly in manufacturing.
Author ReferenceType of DocumentObjectiveOverviewIn Pasquale et al. [16]
[71]Journal paperAn analytical framework is proposed: HEDOMS—Human Error and Disturbance Occurrence in Manufacturing Systems.The framework has two modules. Module 1 discusses the selection of critical tasks to be analyzed (based on data, statistics and initial solutions). Module 2 is a modification of classic human reliability analysis techniques. No application was reported. No
[67]Conference paperA novel technique developed specifically to identify manual assembly errors is proposed: “Assembly FMEA”. Assembly defect levels are related to assembly complexity, which can be estimated using “Design for Assembly” (DFA) time penalties. Hence, Assembly FMEA uses a series of DFA-related questions to elicit potential assembly defects. No
[15]Journal paperA reflection is conducted on how HRA can help to improve quality in manual assembly through the use of literature and examples.The article describes the major tenets of HRA and its relationship with quality in production. THERP (technique for human error rate prediction) is used in a study case from manual electronic assembly.Yes
[75]Thesis DissertationA methodology is proposed to support engineers and technicians in the selection of the best error-proofing actions during product development. This is intended to minimize errors from the design phase.The proposed methodology is based on historical data and the FMEA technique. It offers a list of 36 error-proofing approaches to consider. The selection of the best approaches is based on cost calculations and the impact on quality. The methodology is based on Toyota’s production system. Application reported in a mixed production assembly of a three-wheeled motorcycle.No
[6]Conference paperA “novel” mixed methodology is proposed to analyze quality issues related to human errors in engine assembly. The methodology combines a modified version of CREAM (cognitive reliability and error analysis method) with FTA (fault tree analysis). Application reported on an assembly line of automobile engines.No
[69]Journal paperAn assembly planning method is developed: MTQM (methods time and quality measurement) that allows the calculation of human error probabilities linked to predetermined motion times.The taxonomy of error types was harmonized with nomenclature from MTM. Specific human error probabilities are based on data from German automotive manufacturing. Application reported in the automotive industry [72].Yes
[76]Conference paperA human reliability model for assembly line manual workers is developed based on statistical analysis of personal factors. The model was built using Cox proportional-hazards regression. Nine factors were evaluated in 120 assembly line operators using psychometric tests. Factors included in the model were: stress, motivation, memory, and personality. The model was developed in an electronic assembly.No
[77]Thesis DissertationThe objective was to capture the structure of human errors in a production line and to describe the frequency in which these errors occur. Principles of Resilience Engineering were also explored.A detailed analysis of error types and error probabilities; the findings are intended to be incorporated into future planning and development operations. A system theory model was used to understand specific human behaviors and their adaptation to disturbance variables. Application at an engine production facility. No
[37]Conference paperA quantitative model is developed to assess errors in kitting processes for assembly line feeding. The model allows quantifying costs of error-related quality issues.Event trees are adopted to keep track of unwanted events and error correction opportunities during the entire logistic process, starting from material picking in the warehouse to kit delivery at workstations and parts assembly. An application example is included.No
[70]Journal paperA new human reliability analysis (HRA) method is presented: The simulator for human error probability analysis (SHERPA).A theoretical framework is provided, and human reliability is estimated as a function of the performed task, the performance shaping factors (PSF) and the time worked.Yes

3. Materials and Methods

We focused on one case study of complex mechanical manual assembly. The case study was a realistic case distilled from the actual case that is confidential. Several data collection and analysis methods were used to support the human error analysis process. This includes searching quality records to select critical tasks based on statistical analysis, familiarization and analysis of work instructions from the manufacturing execution system (MES), field observations of the tasks execution, unstructured interviews and focus group meetings with line supervisors, quality specialists and assemblers. This methodological approach is known as mixed-methods [78]. The whole process was led and supervised by experienced engineers and researchers in ergonomics and manufacturing. The participation was completely voluntary and the whole study received approval from École de technologie supérieure’s research ethics committee (7 November 2018).

3.1. Human Error Analysis Process

The five steps of the human error analysis process used in this study are presented in Figure 2. Although these steps are presented sequentially, following a logical order, the approach employed in the field was iterative and holistic. Thus, the diagram in Figure 2 should be seen as a simplification of the actual analysis process associated with the case study. The techniques included in the human error analysis process (HTA, SHERPA and HEART) were selected according to operational criteria from the literature (Holroyd and Bell 2009; Lyons 2009) and considerations crucial to the manufacturing context: time, simplicity, availability of information, level of validation and analyst-oriented techniques. Further information about HTA [79], SHERPA [80] and HEART [81] can be found in the literature. A brief description of each of the five steps in Figure 2 is presented subsequently.

3.1.1. Step 1: Selection of Critical Tasks

The selection of the tasks to be analyzed was based on data from the company’s records. To this, quality records were explored for a 36-month period prior to the study. The objective was to find a group of tasks that were a frequent source of error-related quality issues. Firstly, descriptive statistics allowed one to identify the assembly parts that represented a high proportion of quality issues. Secondly, the rate of quality issues per 10 thousand labor hours allowed one to select the specific assembly line and workstations where the research should focus on.

3.1.2. Step 2: Task Description

Once the tasks to be analyzed were chosen, each of them was broken down into the subtasks required to achieve the overall goal of the task. This was achieved using the hierarchical task analysis technique developed by Anett [79]. The description of the tasks was based on the study of work procedures, as described in the manufacturing execution system (MES). Additionally, a total of 40 h of field observations supported this and other steps within the human error analysis process. Five assemblers were observed during an entire workday (eight hours) at their respective workstations. However, these field observations focused primarily on the execution of tasks. The main goal was to understand the structure and sequencing of tasks and subtasks in a real context (work as done). No personal data about the assemblers was collected. The assembly line and workstations to be observed were identified based on results from the analysis of quality records.

3.1.3. Step 3: Identification of Human Errors

SHERPA (systematic human error reduction and prediction approach) was used to identify human error modes associated with the tasks analyzed [82]. For this, each bottom-level subtask from the HTA was associated with one or more error modes proposed in the SHERPA taxonomy of errors. The error modes are described, and corrected strategies are identified. Information is then compiled and presented in the tabular form. In this study, a focus group composed of line supervisors, quality specialists and experienced assemblers provided the necessary information for the process of classifying human errors. Three meetings of approximately 1.5 h each were carried with the focus group.

3.1.4. Step 4: Quantification of Human Error

The quantitative analysis in this step was performed based on HEART (human error assessment and reduction technique). HEART contains three main elements, which are the following:
  • Generic task type (GTT): the analyst should specify which of the eight generic task types proposed in HEART best match the task object of analysis and determines the nominal HEP for the task based on the mean HEP value associated with the corresponding GTT.
  • Error producing condition (EPC): these are conditions that may influence the human reliability, mathematically they represent modification weights for the nominal HEP. HEART proposes a table with a list of 40 EPCs and their relative maximum effect on performance in the form of a numerical value (EPCs are also known as performance shaping factors or PSFs).
  • Calculation method: the method for calculation of human error probability evaluates the EPCs weights based on their relative importance to each other in the task context. In this manner, an assessed proportion of the error producing conditions (APOA) is obtained. The final HEP can be yielded, as shown in Equations (1) and (2):
H E P = G T T i   ×   W F j
W F j = E P C j 1 × A P O A j + 1
where WFj = weighting effect for the jth EPC; EPCj  = error-producing condition for the jth condition; APOAj = assessed proportion of ‘affect’ for that condition; HEP = final human error probability; GTTi  = central value of the HEP task (distribution) that is associated with a task i; GTT = generic task type.

3.2. Description of the Case Study

The case consists of a mechanical assembly worker installing various components to the main structure of the object being assembled. Instructions are delivered by the manufacturing execution system (MES) and displayed on a computer terminal at the workbench (PC stationary screen), which is located approximately 2 m from the assembly position. Instructions consist of text and 2D drawings providing basic visual descriptions of assembly steps. Parts are stored in bins at the workbench. The worker moves around the assembly position at the center of the workstation as needed. Figure 3 shows the schematic representation of the assembly workstation’s layout and the general workflow. The assembly line consists of six workstations with similar characteristics to the workstation shown in Figure 3. The main assembly structure is transferred from one workstation to the next using a dolly. The height and direction of the main structure of assembly can be modified by the worker to gain access more easily.

4. Results

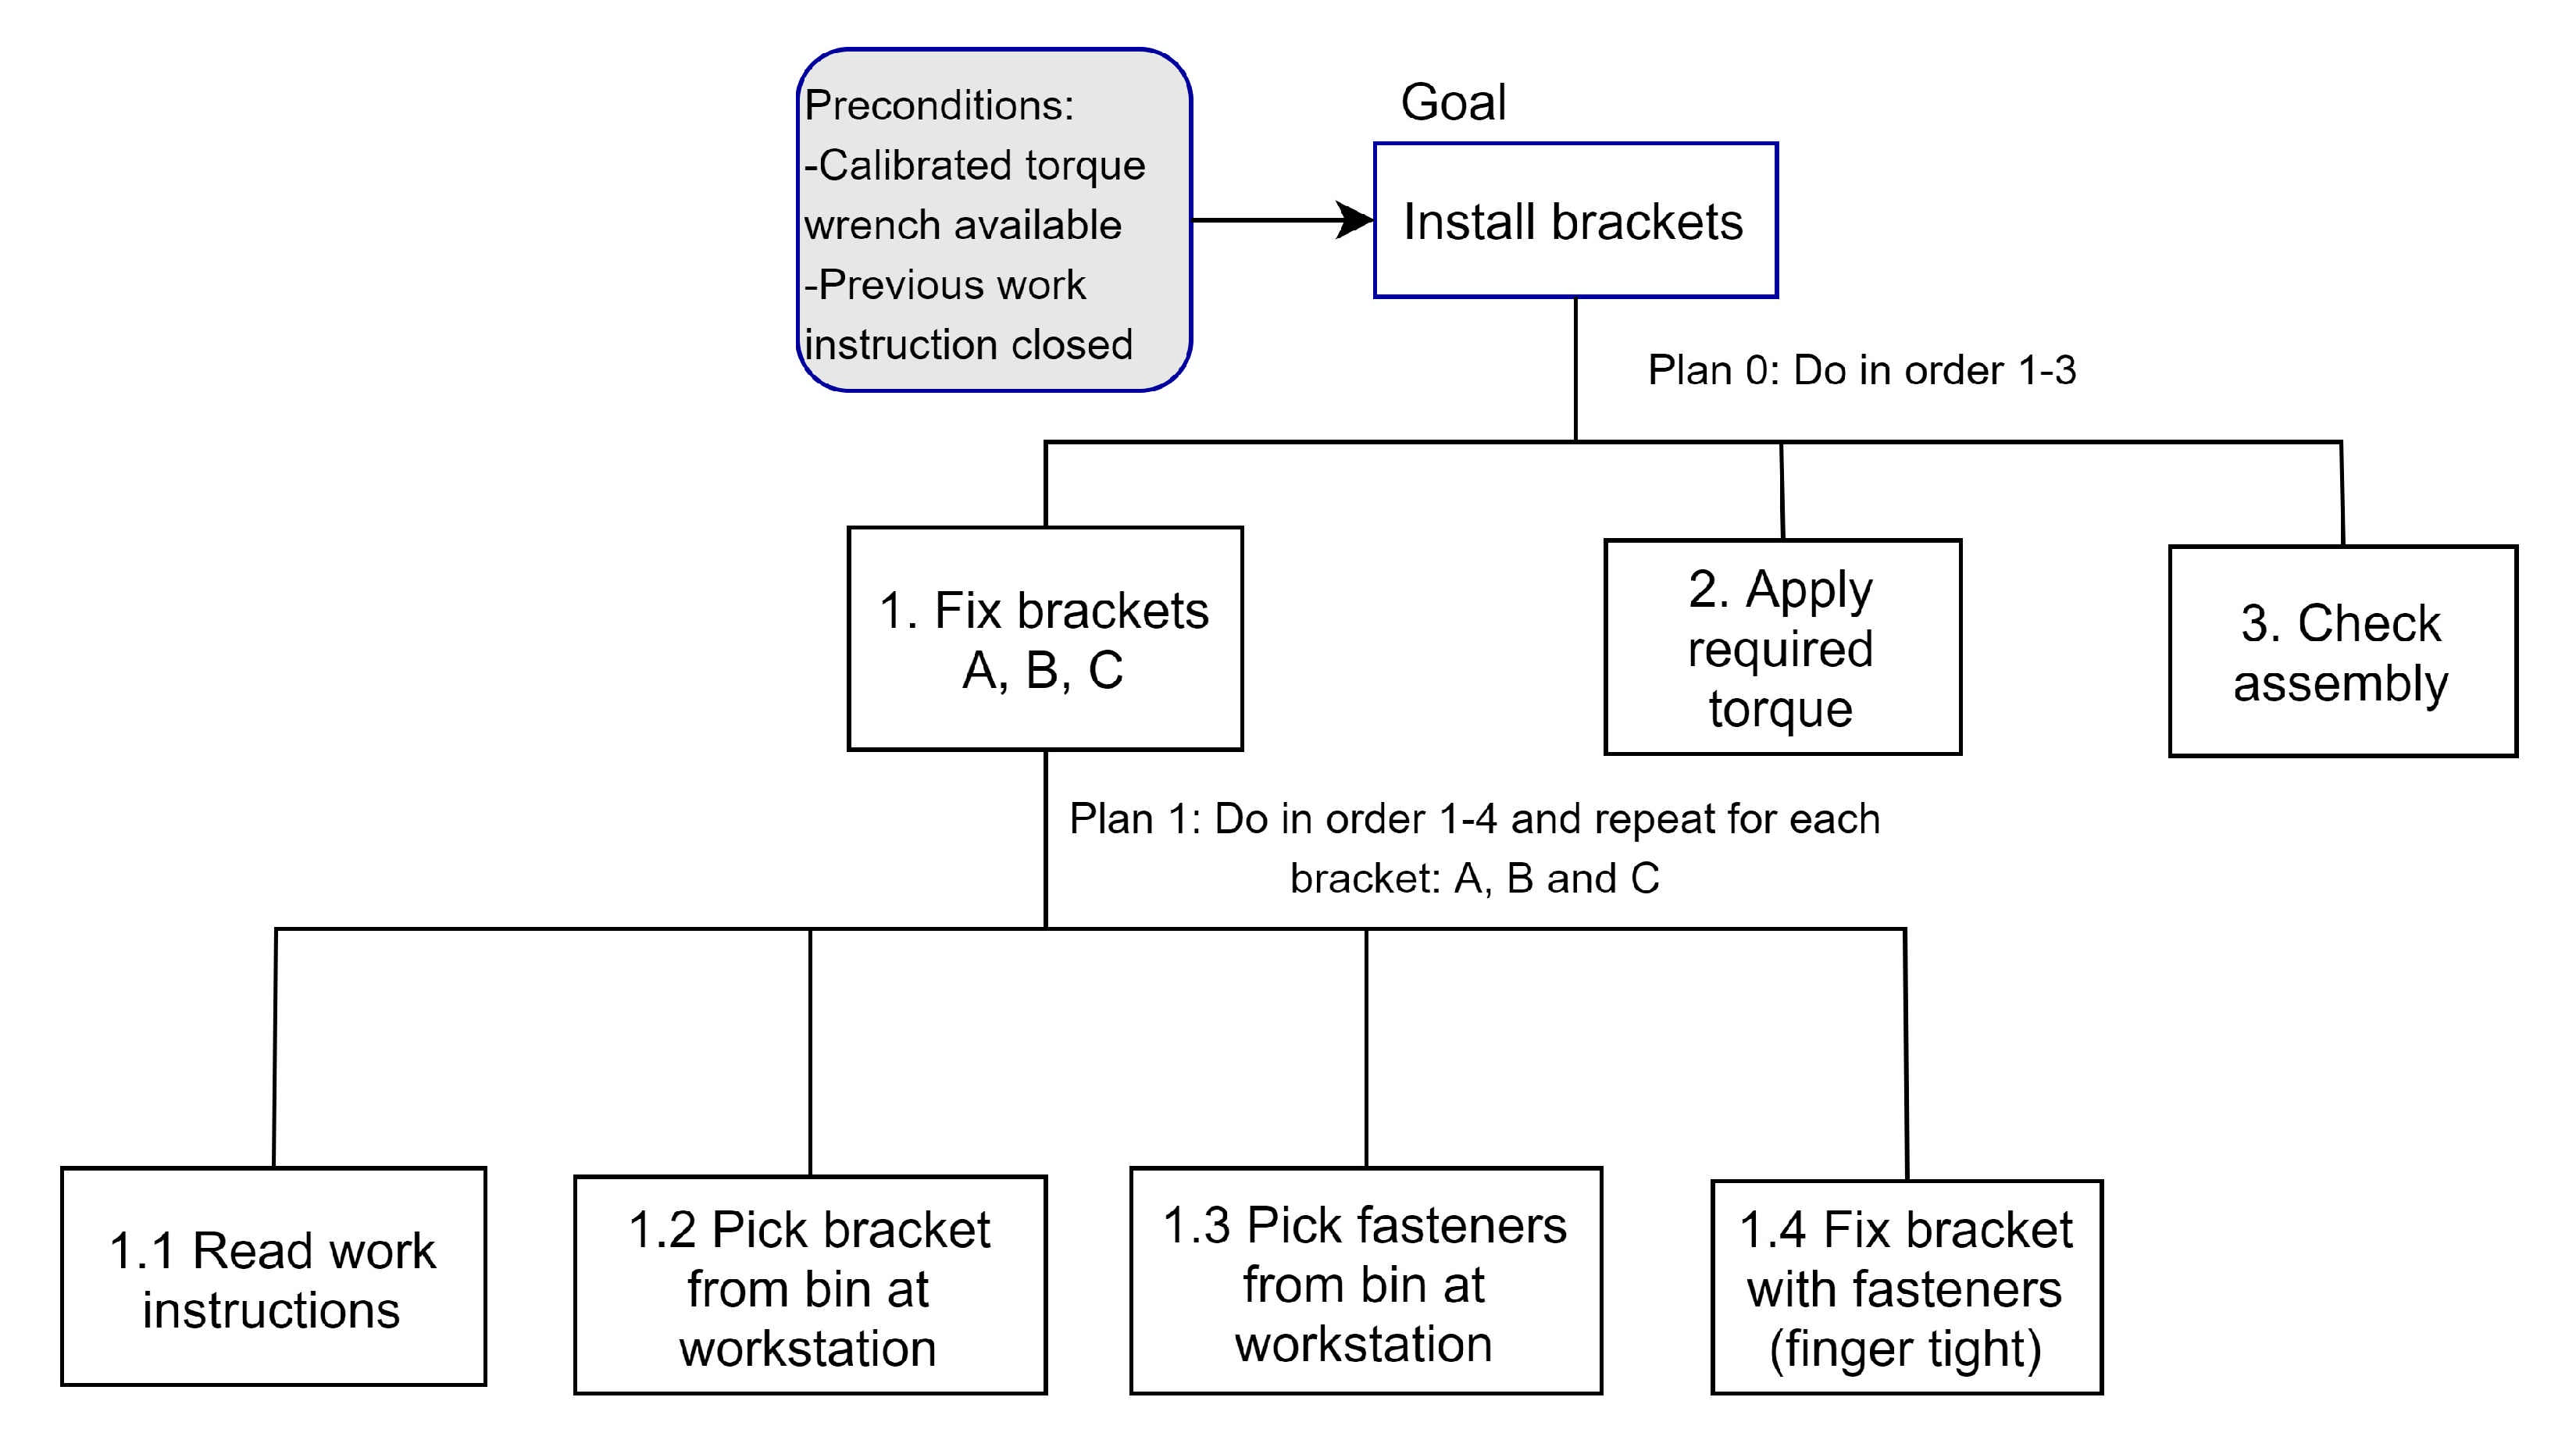
4.1. Selection and Description of Critical Tasks

Numerous manual assembly tasks are performed on the assembly line, but for the purpose of the case study presented in this paper, three basic tasks were selected as critical tasks. These tasks are related to assembly parts that represent a substantial proportion of the company’s quality issues. Results showed that, during the 36-month period prior to the study, 67% of all wrongly installed parts were associated with brackets (27%), loop clamps (25%) and bolts (15%). Similarly, 65% of all missing parts were associated with cap covers (40%), brackets (13%) and loop clamps (12%). Following this, the three basic critical tasks selected were:
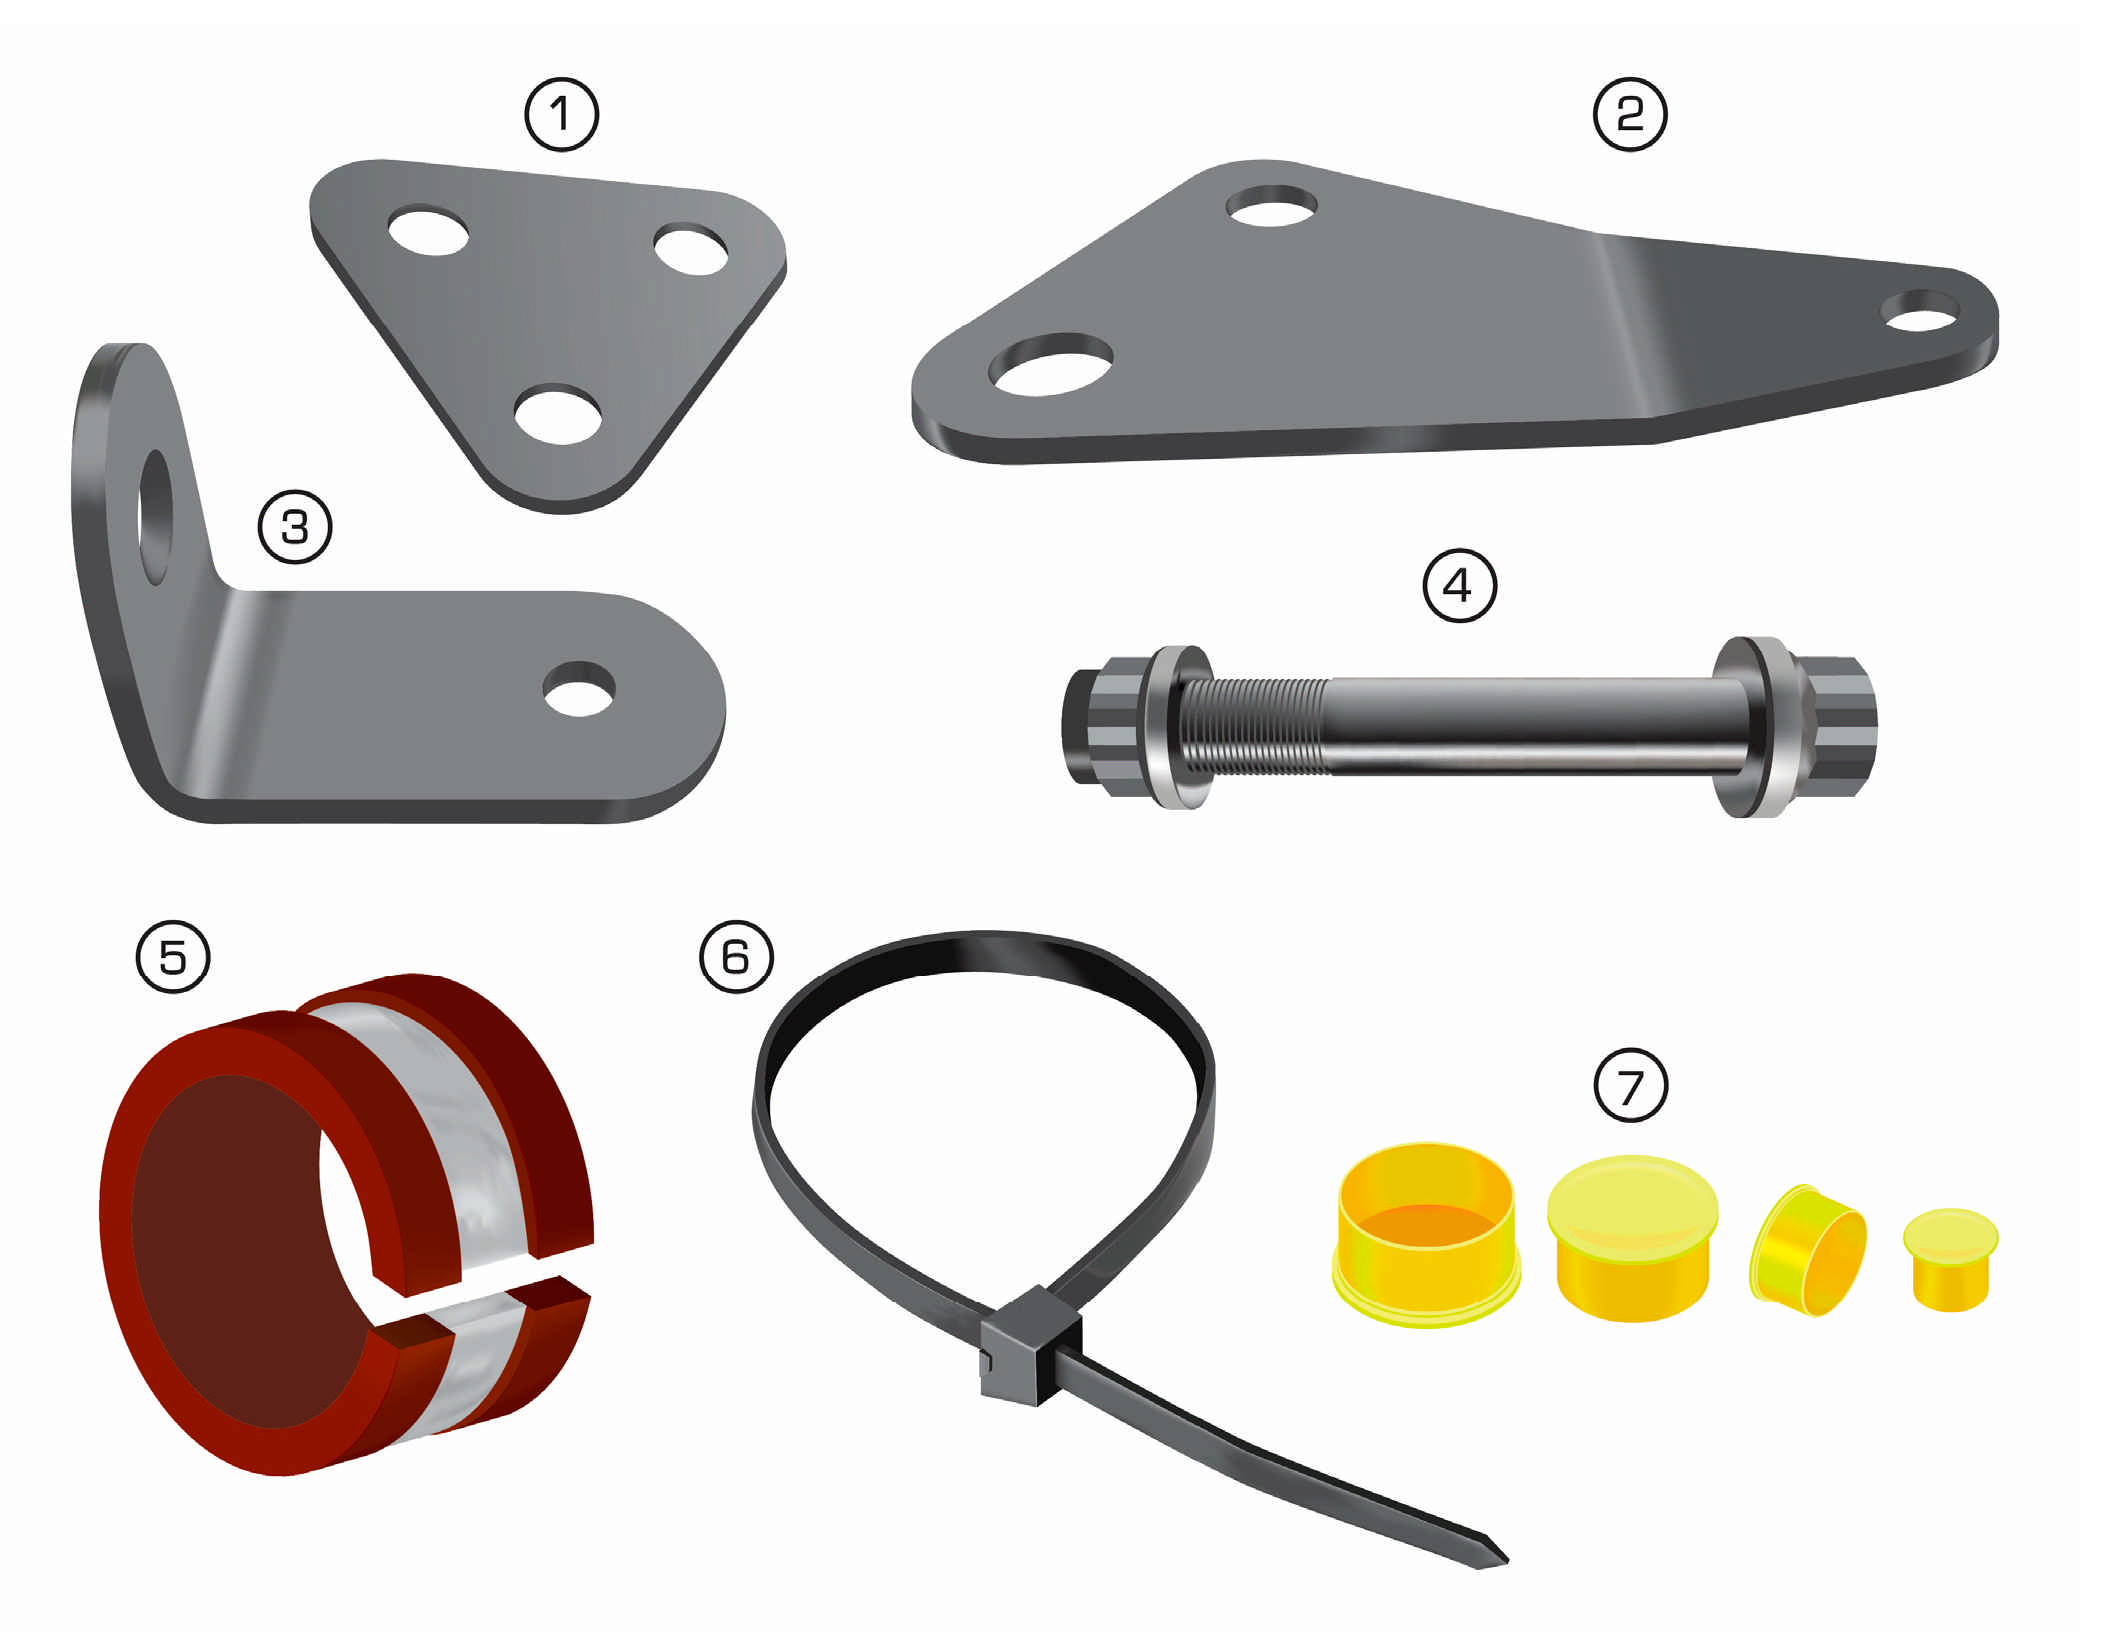
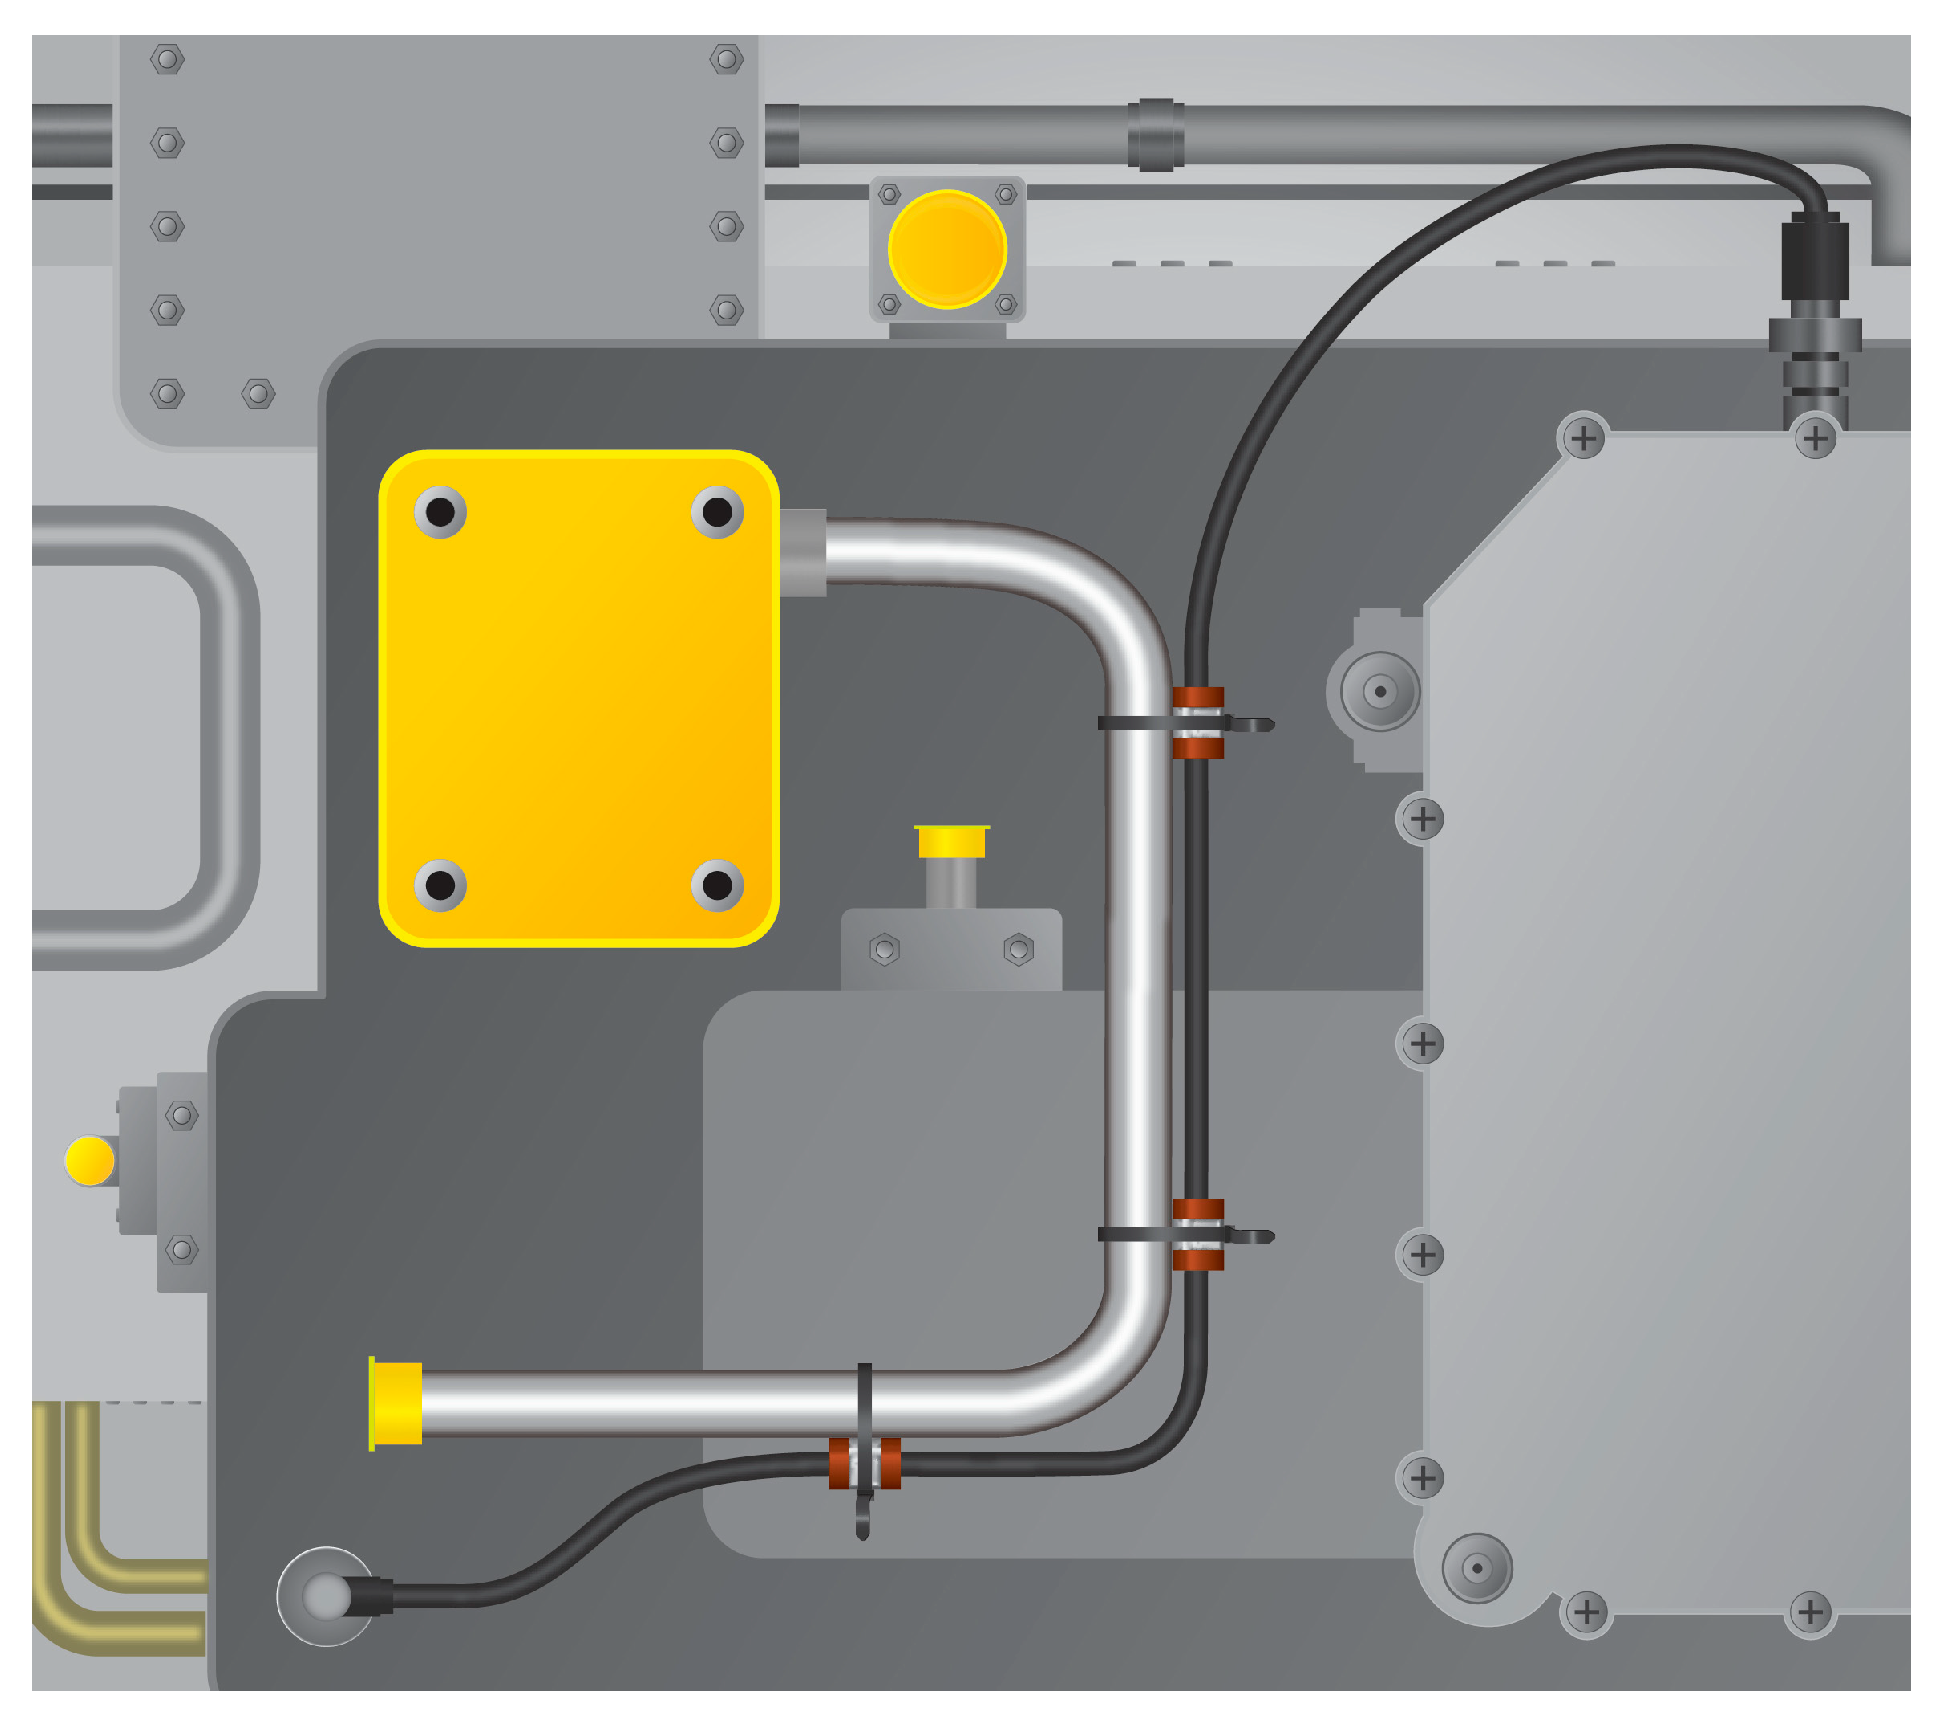
  • Install three brackets at specific locations according to the work procedure.
  • Secure a data cable to the main structure with three cushioned loop clamps.
  • Install four cap covers to protect access points to the structure.
To provide a comparative idea of the different cycle times, these were estimated using MTM-1 (method-time measurement), a predetermined motion time system (PMTS) [83]. The estimated cycle times for the tasks analyzed were 155 s, 51 s and 28 s, respectively. Basic cycle times, calculated with PMTS, are often used as part of different models developed for complexity assessment in manual assembly operations [84,85]. However, the cycle times calculated here are not part of any formal complexity assessment of the assembly tasks under study. Therefore, these values must be interpreted with this element in mind even when, to some extent, they might express differences in complexity between the tasks analyzed. Brackets are secured with nuts and bolts, while cushioned loop clamps are attached to the main structure with tie wraps. Torque is applied with a wrench according to specifications provided in the assembly instructions. Parts used in the assembly tasks are presented in Figure 4. A check for missing parts is carried out by the worker at the end of each task cycle. The selected tasks can be considered representative, to some extent, of the manual assembly process under study.
An example of a 2D drawing provided to the assembler in the work instruction of task No. 1 (install three brackets) is shown in Figure 5. Work instructions are displayed on a 19-inch stationary PC monitor. The computer’s input devices are a mouse and a keyboard, both connected by cables to the PC. Figure 6 shows bracket A installed and secured with two bolts to the assembly structure. Similarly, Figure 7 shows the data cable and the cap covers installed on the assembled object. The data cable was secured to the structure using cushioned loop clamps and tie wraps. Cushioned loop clamps were used to avoid damage to the data cable in an operational context. Cap covers were installed to protect different inlets.
Figure 8 shows the breakdown of the critical basic task No.1 (install brackets). This HTA diagram is presented as an extract of the diagrams developed for the breakdown of each of the critical tasks under analysis. Subtasks 1.1–1.4 repeat for each of the brackets A, B and C, representing 12 subtasks. For the sake of diagram simplification, repetitions are not included.

4.2. Identification and Description of Error Modes

HTA and SHERPA techniques were applied to each task under evaluation, yielding a total of 59 identified error modes. The installation of brackets accounted for the highest number of error modes with 34 (58%), followed by the installation of cushioned loop clamps with 19 error modes (32%), and the installation of cap covers with six error modes (10%). We found errors in four of the five categories proposed by the SHERPA taxonomy: action, retrieval, checking and selection. The absence of communication errors could be explained by the limited amount of teamwork in the context under study where the necessary information is usually supplied to the worker electronically by the MES. For the sake of simplification and the need to avoid repeated tables, only an extract of the SHERPA output table associated with critical task No.1 (install brackets) is presented in Table 2. Similar tables were obtained as a result of SHERPA analysis of the rest of the critical tasks object of study. The consolidated results of the error modes obtained during the SHERPA analysis are presented in Table 3. Estimated cycle times are also presented at the end of Table 3 for comparison purposes. A more detailed description of each error mode is presented subsequently.
A3 Operation in the wrong direction: The six errors in this category were identified in the installation of brackets and the installation of cushioned loop clamps (secure data cable). All these parts must follow a specific spatial orientation according to drawings shown in the assembly instructions.
A4 Too little/much operation: Fasteners must be tightened by applying torque with a specific amount of force. An operation is considered out of specifications if the fastener is too loose or too tight. Five bolts are required to install brackets, which accounts for the five error modes in this category.
A5 Misalignment: Like operation in the wrong direction (A3), misalignment is especially prevalent during the installation of brackets and cushioned loop clamps. A bracket can be fastened to one of several holes. It is, therefore, possible to install a bracket in a shifted position from the one specified on the instructions. Cushioned loop clamps are also subject to this kind of error mode because the correct position of the cushioned loop clamps could be hard to determine. Six error modes have been identified in this category.
A8 Operation omitted: Workers can omit to install brackets, bolts, cushioned loop clamps, tie-wraps or cap covers. They can also omit to apply the required force to fasteners. These multiple causes explain why this error mode is the most prevalent with 19 counts.
R2 Wrong information obtained: This error mode covers instances in which the work instructions were incorrectly assimilated. The installation of each bracket requires the retrieval of specific spatial information. All cushioned loop clamps are considered part of the same subassembly and information is captured once. In total, four error modes were counted.
R3 Information retrieval incomplete: Like wrong information obtained (R2), this kind of error is related to work instructions. In this case, the worker interpreted the work instructions correctly but only read part of them. Four error modes were identified in the same circumstances as for R2.
C1 Check omitted: Checking is considered a normal part of the assembly cycle, as opposed to an inspection activity. Three error modes were identified, one for the verification expected at the end of each task.
C2 Check incomplete: One or more component(s) were not checked during the verification at the end of a task cycle. Incomplete checking is equivalent to a partial omission of the check. There are three error modes in this category, the same as for C1.
S2 Wrong selection made: The assembler must obtain the required part from a bin at the workbench. Parts are often similar, which could lead the worker to pick the wrong one: several brackets, cushioned loop clamp and fastener variants can be found in the bins. Nine error modes were counted.

4.3. Human Error Probabilities Calculation

A human error probability (HEP) was calculated for the incorrect installation of each of four types of parts: brackets, cushioned loop clamps, cap covers and the generic part fasteners. The calculations followed the guidelines provided by William [81] in the original article describing the HEART technique. The generic task type assigned to each part installation was routine, highly practiced, rapid task involving relatively low level of skill, which corresponds to task type E in the HEART nomenclature. The generic error probability for this task type is 0.02. The number of error producing conditions (EPCs, also known as performance shaping factors or PSFs) was limited to no more than five for each of the parts analyzed. Although HEART provides a list of 40 error producing conditions, Boring [86] acknowledges that three to nine PSFs are generally sufficient to arrive at a screening value in the quantification phase. For the sake of simplification and the need to avoid repeated calculations, only an extract of the HEART calculation table for the critical task of installing a bracket is presented in Table 4. The consolidated results of the HEART analysis are presented in Table 5.
The first and second columns of Table 5 show the identified EPC and the proposed multiplier according to HEART analysis. The percentages in the other columns represent the contribution of each EPC to the probability of failure for each component. Table 5’s bottom row shows the total human error probabilities.

5. Discussion

SHERPA analysis shows that brackets and cushioned loop clamps are particularly sensitive to operation in the wrong direction (A3) and to misalignment (A5). These error modes can be considered geometry-related since the proper installation of these parts requires some spatial abilities. Information errors such as the acquisition of the wrong information (R2) and incomplete information retrieval (R3), also identified during SHERPA analysis, can be considered precursors to geometry-related errors because of the impact of the information system on the assembler’s cognitive load [25]. Simultaneously, HEART results show that brackets and cushioned loop clamps had the highest human error probabilities (0.62 and 0.47 respectively) compared to fasteners (0.29) and cap covers (0.09). Interestingly, the lack of a means of conveying spatial and functional information to operators in a form that they can readily assimilate is a major error producing condition (EPC) in the HEP calculation. This EPC was the single most important in the HEART analysis (×8 multiplier) and represented 49% and 42% of the total contribution to human error probabilities for brackets and cushioned loop clamps respectively. The results obtained by using HEART were consistent with results from an empirical study in truck engine assembly where the potential error reduction obtained as a consequence of changing the information system was in the order of 40% [28].
It is important to highlight that the work instructions were provided as text and 2D drawing sheets on a stationary PC display, which has been found to be less effective than 3D instructions when spatial abilities are required [87]. It has been acknowledged that work instructions are often deficient or underused in final assembly [25,26]. Another point of concern is how the assembler interacts with the work instructions. The computer screen displaying the instructions in the study case is located on the workbench. However, the worker is frequently at some distance from the screen during the actual assembly. Instructions may not be easily readable from a distance, nor may the worker be able to figure out details on the drawings. This will demand frequent trips from the assembly position to the workbench to retrieve information. Larger screens could help, although the worker’s movement around the assembly position might still frequently leave the screens out of sight. This situation was reported by Mayrhofer et al. [35]: a large overhead screen was installed on an aircraft part assembly line, but the worker had to move to retrieve the information because the screen was not visible from all angles and working positions. Neither do wide screens solve the need to move to the workbench to interact with the work instructions (validate, close instructions, go to following instruction, etc.), which is done primarily with a mouse and keyboard. Optimizing the content of work instructions, their display and the interaction process between worker and instructions seems to be paramount to complex assembly performance.
As the SHERPA analysis shows, two major error modes are associated with the systematic application of force to fasteners during assembly: the application of too little/much force (A4) and the omission of the operation (A8). In both cases, specifications are not met, and the integrity of the assembly can be compromised. Results from HEART show that the most important contributors to human error probability of failure in this context are distractions and task interruptions (34%) and poor, ambiguous or ill-matched system feedback (30%). The latter refers to the fact that the system provides no direct feedback to the assembler when a bolt is missing, too tight or loose: the responsibility for verification falls to the assembler. A torque wrench can provide direct feedback while tightening, but this does not solve the issue of missing fasteners and introduces calibration/certification challenges [88]. The worker may also forget to check the applied torque value. Feeding parts to the assembly line in kits constitutes a more traditional way to avoid errors of omission (A8), as the omitted part will remain in the kitting container, thus providing direct feedback to the worker. The number of parts provided by the kitting system should match the needs of the associated task, so that there are neither missing nor superfluous parts in the kitting box or rack (depending on the size of parts). As explained in the literature review, kitting systems also ease the process of selecting parts from bins, thus decreasing the probability of encountering the wrong part selected (S2) error mode. Wireless-enabled tightening systems that improve torque application reliability constitute a support to the assembler [89]. Error-proofing fastening tools have been successfully used in assembly since the late 1980s, when power tools equipped with electronic sensors to control torque became available [90]. Artificial intelligence and machine vision can further develop the potential of these error-proofing systems.
The checks performed by the assembler at the end of each cycle can be treated as a low-key form of inspection because the search for nonconformity is more casual than during active inspection, where a person is directed to inspect specific items of equipment, usually using specific written procedures like checklists [11]. Error modes C1 (check omitted) and C2 (check incomplete) constitute failures of these low-key inspections. While checks performed by the assembler act as a barrier to the propagation of errors, this type of barrier can be sensitive to attention and interruptions and the well-known limitations of visual inspection [43,91]. Further along the assembly line, in-process active inspection is carried out by other assemblers following specific instructions, sometimes in teams to provide human redundancy, but these measures are susceptible to the same shortcomings, which is why automated visual inspection is often used at the end of the assembly process. It would be reasonable to expect automated visual inspection to become more flexible as computer vision improves. For this reason, the deployment of automated visual inspection at the assembly workstation itself should be explored. This would result in a shift from a centralized automated inspection to an in-process, ubiquitous automated inspection carried out with a smart assistance system.
According to HEART, distractions and interruptions affect the probability of human error during the installation of all the parts under study to various degrees, i.e., from 16% for brackets to 42% for cap covers. Attention failures have been associated with many skill-based errors in the Rasmussen SRK model [92], such as the breakdown in visual scan patterns, the inadvertent activation of controls, and the disordering of steps in a procedure [93,94]. Distractions represent the drawing of attention away from the task, potentially causing confusion and increasing the likelihood of task failure. Either way, the potential impact on performance during manual assembly must be considered. Kilbeinsson et al. [95] issue guidelines for the design of interruption systems that minimize errors and delays during assembly.
Criticism of human reliability analysis (HRA) has focused on the accuracy of human error probability computations [62] and on the assumption that human errors and machine failures can be treated similarly [59] despite extensive variability among humans. Further, most of the research that supports HRA techniques was conducted in the nuclear sector, including the validation of HRA itself [96]. For these reasons, some authors support the use of human error identification (HEI) techniques like SHERPA but exclude the quantitative aspects of HRA [97]. In the present study, human error probabilities calculated with HEART are not intended to be used in probabilistic safety analysis (PSA) but they can be used for comparisons. The analysis shows that the installation of brackets has the highest probability of failure (0.62) compared with cushioned loop clamps (0.47), fasteners (0.29) or cap covers (0.09), which suggests an explanation for the differences between the number of quality issues associated with each of the parts. The probabilities calculated in this study are roughly similar to those reported by Richards [98] for failure of properly installing an oil cap during aircraft maintenance (0.48–0.78). However, in both cases, the numerical values of human error probabilities should be treated as tools for human error prevention rather than for prediction, i.e., task planning of novel assembly/maintenance operations. Quantification allows the importance of the various factors affecting assembler performance to be compared but it could lack precision since most of the HRA techniques were not specifically developed for the manufacturing context. We argue that, despite its limitations, the quantification process constitutes a useful guide for the analyst during the search for solutions and, further, an important complement to the identification of human error modes.

Limitations of the Study and Future Research

Even though the authors took care to represent the real context upon which the case was built as accurately as possible, it is often difficult to represent simply the complexity examined. Possible generalizations must be seen in the light of the characteristics of the context in which the study was carried out [99]. Besides, the study focused mainly on factors directly associated with the execution of the assembly tasks by the workers at their respective workstations. However, several other factors associated with the work organization can also have an impact on human performance and they should be addressed in future studies on manual assembly. This includes workload variations due to fluctuations in production demands, the overtime allocation practices and the arrangement of working hours, among others. Similarly, personal factors like worker’s training level and experience are enablers affecting human performance that were out of the scope of the study. Even when HEART technique considers some of the mentioned factors, they have low multiplier values, which explains that we chose to exclude them from this analysis. Future research about complex manual assembly should explore these organizational and individual factors using different approaches as a complement to human reliability analysis (HRA). Furthermore, the relationship between the complexity of manual assembly operations, cycle times (both basic and operational) and human error probabilities need to be further examined in an integrative manner.

6. Conclusions

The paper shows how human reliability analysis (HRA) can be effectively applied in a manufacturing context. SHERPA and HEART, both classic HRA methods initially developed for safety-critical domains, allowed the identification of potential errors and evaluation of the factors contributing to these errors. From the three critical assembly tasks initially selected, a total of 23 subtasks and 59 error modes were identified with SHERPA: 36 action errors, nine selection errors, eight information retrieval errors and six checking errors. According to HEART the highest human error probabilities were associated with assembly parts sensitive to geometry-related errors (brackets and cushioned loop clamps). The computed values of human error probabilities should be interpreted with caution because their greatest value lies in preventing and managing human error rather than in prediction. Nevertheless, HEART supports the analyst by providing a list of proven factors that can affect human performance and whose influence can be compared through their relative impact on human error probabilities. This process can shed light on the best possible strategies to improve assembler performance. For example, the study shows that when spatial abilities are required, the probability of errors can be reduced by providing assembly instructions that engage the worker’s senses more effectively. This supports the idea, already discussed in the literature, that assembly work instructions have a major impact on dynamic complexity and should be optimized to decrease the cognitive workload.
The study also identified enhanced inspection processes, better operations tracking, better feedback to the worker and the reduction of distractions and interruptions as ways to reduce error probabilities and improve overall assembly performance. Although some of these can be achieved by traditional means (e.g., kitting system, poka-yoke, human redundancy, etc.), technology can also decrease workers’ cognitive load and reduce the dynamic complexity of assembly. With the development of human support technologies within the framework of the Operator 4.0 [33,100], the integration of several technologies into assembly guidance systems could benefit workers and system performance. Questions remain regarding the proper selection and deployment of these technologies, particularly in relation to utility, usability, risks and practical acceptability [101]. Humans must remain at the heart of the reflection. Ergonomic analysis of the work systems, including human errors and reliability analysis, is a necessary step along the way.

Author Contributions

Conceptualization, Y.T., S.N. and K.L.; Formal analysis, Y.T.; Funding acquisition, Y.T., S.N. and K.L.; Investigation, Y.T.; Methodology, Y.T., S.N. and K.L.; Project administration, S.N.; Supervision, S.N. and K.L.; Writing—original draft, Y.T.; Writing—review & editing, S.N. and K.L. All authors have read and agreed to the published version of the manuscript.

Funding

This research was funded by MITACS, grant number IT12360 and the Natural Sciences and Engineering Research Council of Canada (NSERC).

Institutional Review Board Statement

The study was approved by the Ethics Committee of École de technologie supérieure (reference number H20181004 and date of approval 7 November 2018).

Informed Consent Statement

Not applicable.

Data Availability Statement

The data related to the study are subject to a confidentiality agreement and therefore are not publicly available.

Acknowledgments

Authors would like to acknowledge the funding and infrastructure support of the industrial partner and École de technologie supérieure.

Conflicts of Interest

The authors declare no conflict of interest.

References

  1. Lotter, B.; Wiendahl, H.-P. Changeable and Reconfigurable Assembly Systems. In Changeable and Reconfigurable Manufacturing Systems; ElMaraghy, H.A., Ed.; Springer: London, UK, 2009; pp. 127–142. [Google Scholar]
  2. Dinlersoz, E.; Wolf, Z. Automation, Labor Share, and Productivity: Plant-Level Evidence from US Manufacturing. US Census Bur. Cent. Econ. Stud. Work. Pap. 2018, 18–39. [Google Scholar]
  3. Correia, D. Improving manual assembly lines devoted to complex electronic devices by applying Lean tools. Procedia Manuf. 2018, 17, 663–671. [Google Scholar] [CrossRef]
  4. Judt, D.; Lawson, C.; Lockett, H. Experimental investigation into aircraft system manual assembly performance under varying structural component orientations. Proc. Inst. Mech. Eng. 2020, 234, 840–855. [Google Scholar] [CrossRef]
  5. Beuß, F.; Sender, J.; Flügge, W. Ergonomics Simulation in Aircraft Manufacturing—Methods and Potentials. Procedia CIRP 2019, 81, 742–746. [Google Scholar] [CrossRef]
  6. Yang, L.; Su, Q.; Shen, L. A novel method of analyzing quality defects due to human errors in engine assembly line. In Proceedings of the 2012 International Conference on Information Management, Innovation Management and Industrial Engineering, Sanya, China, 20–21 October 2012. [Google Scholar]
  7. Krugh, M. Prediction of Defect Propensity for the Manual Assembly of Automotive Electrical Connectors. Procedia Manuf. 2016, 5, 144–157. [Google Scholar] [CrossRef] [Green Version]
  8. Falck, A.-C.; Örtengren, R.; Högberg, D. The impact of poor assembly ergonomics on product quality: A cost–benefit analysis in car manufacturing. Hum. Factors Ergon. Manuf. Serv. Ind. 2010, 20, 24–41. [Google Scholar] [CrossRef]
  9. Botti, L.; Mora, C.; Regattieri, A. Integrating ergonomics and lean manufacturing principles in a hybrid assembly line. Comput. Ind. Eng. 2017, 111, 481–491. [Google Scholar] [CrossRef]
  10. Bao, S.; Mathiassen, S.E.; Winkel, J. Ergonomic effects of a management-based rationalization in assembly work—A case study. Appl. Ergon. 1996, 27, 89–99. [Google Scholar] [CrossRef]
  11. Swain, A.D.; Guttmann, H.E. Handbook of Human-Reliability Analysis with Emphasis on Nuclear Power Plant Applications; Final Report; Sandia National Labs: Albuquerque, NM, USA, 1983. [Google Scholar]
  12. Wong, Y.C.; Wong, K.Y.; Ali, A. Key Practice Areas of Lean Manufacturing. In Proceedings of the 2009 International Association of Computer Science and Information Technology-Spring Conference, Singapore, 17–20 April 2009. [Google Scholar]
  13. Kagermann, H. Recommendations for Implementing the Strategic Initiative INDUSTRIE 4.0: Securing the Future of German Manufacturing Industry; Final Report of the Industrie 4.0 Working Group; Forschungsunion: Berlin, Germany, 2013.
  14. Thoben, K.-D.; Wiesner, S.; Wuest, T. Industrie 4.0 and Smart Manufacturing—A Review of Research Issues and Application Examples. Int. J. Autom. Technol. 2017, 11, 4–19. [Google Scholar] [CrossRef] [Green Version]
  15. Bubb, H. Human reliability: A key to improved quality in manufacturing. Hum. Factors Ergon. Manuf. Serv. Ind. 2005, 15, 353–368. [Google Scholar] [CrossRef]
  16. Pasquale, V.D. Human reliability in manual assembly systems: A Systematic Literature Review. IFAC-PapersOnLine 2018, 51, 675–680. [Google Scholar] [CrossRef]
  17. Easton, G. Critical realism in case study research. Ind. Mark. Manag. 2010, 39, 118–128. [Google Scholar] [CrossRef]
  18. Yin, R.K. A (very) brief refresher on the case study method. Appl. Case Study Res. 2012, 3, 18. [Google Scholar]
  19. Richardson, M. Identifying the Task Variables That Predict Object Assembly Difficulty. Hum. Factors 2006, 48, 511–525. [Google Scholar] [CrossRef] [PubMed] [Green Version]
  20. Landau, K.; Brauchler, R.; Rohmert, W. The AET method of job evaluation. In Occupational Ergonomics Principles of Work Design; CRC Press: Boca Raton, FL, USA, 2003; p. 20. [Google Scholar]
  21. Frizelle, G.; Woodcock, E. Measuring complexity as an aid to developing operational strategy. Int. J. Oper. Prod. Manag. 1995, 15, 26–39. [Google Scholar] [CrossRef]
  22. Kuzgunkaya, O.; Elmaraghy, H.A. Assessing the structural complexity of manufacturing systems configurations. Int. J. Flex. Manuf. Syst. 2006, 18, 145–171. [Google Scholar] [CrossRef]
  23. Falck, A.-C.; Örtengren, R.; Rosenqvist, M.; Söderberg, R. Criteria for Assessment of Basic Manual Assembly Complexity. Procedia CIRP 2016, 44, 424–428. [Google Scholar] [CrossRef] [Green Version]
  24. Swift, K.G.; Booker, J.D. Chapter 10—Assembly Systems. In Manufacturing Process Selection Handbook; Swift, K.G., Booker, J.D., Eds.; Butterworth-Heinemann: Oxford, UK, 2013; pp. 281–289. [Google Scholar]
  25. Brolin, A.; Thorvald, P.; Case, K. Experimental study of cognitive aspects affecting human performance in manual assembly. Prod. Manuf. Res. 2017, 5, 141–163. [Google Scholar] [CrossRef] [Green Version]
  26. Li, D.; Fast-Berglund, Å.; Salunkhe, O.; Fast-Berglund, Å.; Skoogh, A.; Broberg, J. Effects of Information Content in Work Instructions for Operator Performance. Procedia Manuf. 2018, 25, 628–635. [Google Scholar] [CrossRef]
  27. Mattsson, S.; Li, D.; Fast-Berglund, Å. Application of design principles for assembly instructions—Evaluation of practitioner use. Procedia CIRP 2018, 76, 42–47. [Google Scholar] [CrossRef]
  28. Backstrand, G. The impact of information presentation on work environment and product quality: A case study. In Proceedings of the Fortieth Annual Conference of the Nordic Ergonomics Society, Reykjavik, Iceland, 11–13 August 2008. [Google Scholar]
  29. Atsuko, E. “Assembly-navigation System” that Supports Manufacturing around the World. 2014. Available online: http://www.hitachi.com/rd/portal/contents/story/assembly_navigation/index.html (accessed on 15 October 2019).
  30. Mattsson, S.; Fast-Berglund, Å.; Li, D. Evaluation of Guidelines for Assembly Instructions. IFAC-PapersOnLine 2016, 49, 209–214. [Google Scholar] [CrossRef]
  31. Hagan, R.; Lichtner, D.; Senesac, C. Three-dimensional model based manufacturing work instructions. In Proceedings of the 65th Annual Forum-American Helicopter Society, Grapevine, TX, USA, 27–29 May 2009. [Google Scholar]
  32. Geng, J.; Zhang, S.; Yang, B. A Publishing Method of Lightweight Three-Dimensional Assembly Instruction for Complex Products. J. Comput. Inf. Sci. Eng. 2015, 15, 031004. [Google Scholar] [CrossRef]
  33. Torres, Y.; Nadeau, S. Operator 4.0 in Manufacturing: Trends, Potential Technologies and Future Perspectives. In Kongress der Gesellschaft für Arbeitswissenschaft; GfA-Press: Berlin, Germany, 2020. [Google Scholar]
  34. Bottani, E.; Vignali, G. Augmented reality technology in the manufacturing industry: A review of the last decade. IISE Trans. 2019, 51, 284–310. [Google Scholar] [CrossRef] [Green Version]
  35. Mayrhofer, W.; Rupprecht, P.; Schlund, S. One-Fits-All vs. Tailor-Made: User-Centered Workstations for Field Assembly with an Application in Aircraft Parts Manufacturing. Procedia Manuf. 2019, 39, 149–157. [Google Scholar] [CrossRef]
  36. Brolin, A. The use of kitting to ease assemblers’ cognitive workload. In Proceedings of the 43rd Annual Nordic Ergonomics Society Conference, Oulu, Finland, 18–21 September 2011. [Google Scholar]
  37. Caputo, A.C.; Pelagagge, P.M.; Salini, P. Modeling Errors in Kitting Processes for Assembly Lines Feeding. IFAC-PapersOnLine 2015, 48, 338–344. [Google Scholar] [CrossRef]
  38. Christmansson, M.; Medbo, L.; Hansson, G.-Å.; Ohlsson, K.; Byström, J.U.; Moller, T.; Forsman, M. A case study of a principally new way of materials kitting—an evaluation of time consumption and physical workload. Int. J. Ind. Ergon. 2002, 30, 49–65. [Google Scholar] [CrossRef]
  39. Medbo, L. Assembly work execution and materials kit functionality in parallel flow assembly systems. Int. J. Ind. Ergon. 2003, 31, 263–281. [Google Scholar] [CrossRef]
  40. Caputo, A.C.; Pelagagge, P.M.; Salini, P. Modelling human errors and quality issues in kitting processes for assembly lines feeding. Comput. Ind. Eng. 2017, 111, 492–506. [Google Scholar] [CrossRef]
  41. Hollnagel, E. Looking for errors of omission and commission or The Hunting of the Snark revisited. Reliab. Eng. Syst. Saf. 2000, 68, 135–145. [Google Scholar] [CrossRef]
  42. See, J.E.; Drury, C.G.; Speed, A.; Williams, A.; Khalandi, N. The Role of Visual Inspection in the 21st Century. Proc. Hum. Factors Ergon. Soc. Annu. Meet. 2017, 61, 262–266. [Google Scholar] [CrossRef]
  43. Jebaraj, D.; Tyrrell, R.A.; Gramopadhye, A.K. Industrial inspection performance depends on both viewing distance and oculomotor characteristics. Appl. Ergon. 1999, 30, 223–228. [Google Scholar] [CrossRef]
  44. Drury, C.; Fox, J. The imperfect inspector. In Human Reliability in Quality Control; Halsted Press: New York, NY, USA, 1975; pp. 11–16. [Google Scholar]
  45. Suresh, B.R.; Fundakowski, R.A.; Levitt, T.S.; Overland, J.E. A Real-Time Automated Visual Inspection System for Hot Steel Slabs. IEEE Trans. Pattern Anal. Mach. Intell. 1983, 5, 563–572. [Google Scholar] [CrossRef] [PubMed]
  46. König, A.; Windirsch, P.; Gasteier, M.; Glesner, M. Visual inspection in industrial manufacturing. IEEE Micro 1995, 15, 26–31. [Google Scholar] [CrossRef]
  47. Edinbarough, I.; Balderas, R.; Bose, S. A vision and robot based on-line inspection monitoring system for electronic manufacturing. Comput. Ind. 2005, 56, 986–996. [Google Scholar] [CrossRef]
  48. Sobel, J.O.N. Liberating Machine Vision from the Machines. 2019. Available online: https://www.wired.com/insights/2014/01/liberating-machine-vision-machines/ (accessed on 12 September 2020).
  49. Gupta, S.; Jain, S.K. A literature review of lean manufacturing. Int. J. Manag. Sci. Eng. Manag. 2013, 8, 241–249. [Google Scholar] [CrossRef]
  50. Zheng, L.; Liu, X.; An, Z.; Li, S.; Zhang, R. A smart assistance system for cable assembly by combining wearable augmented reality with portable visual inspection. Virtual Real. Intell. Hardw. 2020, 2, 12–27. [Google Scholar] [CrossRef]
  51. Eschen, H.; Kötter, T.; Rodeck, R.; Harnisch, M.; Schüppstuhl, T. Augmented and Virtual Reality for Inspection and Maintenance Processes in the Aviation Industry. Procedia Manuf. 2018, 19, 156–163. [Google Scholar] [CrossRef]
  52. Leidenkrantz, A.; Westbrandt, E. Implementation of Machine Vision on a Collaborative Robot. In Automation Engineering; University of Skovde: Skövde, Sweden, 2018; p. 60. [Google Scholar]
  53. Makrini, I.E. Design of a collaborative architecture for human-robot assembly tasks. In Proceedings of the 2017 IEEE/RSJ International Conference on Intelligent Robots and Systems (IROS), Vancouver, BC, Canada, 24–28 September 2017. [Google Scholar]
  54. Embrey, D. Chapter 4-Assessment and Prediction of Human Reliability. In Health, Safety and Ergonomics; Nicholson, A.S., Ridd, J.E., Eds.; Butterworth-Heinemann: Oxford, UK, 1988; pp. 33–47. [Google Scholar]
  55. Boring, R. Is Human Reliability Relevant to Human Factors? In Proceedings of the Human Factors and Ergonomics Society Annual Meeting, Houston, TX, USA, 27 September–1 October 1999. [Google Scholar]
  56. Holroyd, J.; Bell, J. Review of Human Reliability Assessment Methods; Health and Safety Laboratory: Derbyshire, UK, 2009.
  57. Lyons, M.N. Towards a framework to select techniques for error prediction: Supporting novice users in the healthcare sector. Appl. Ergon. 2009, 40, 379–395. [Google Scholar] [CrossRef]
  58. IAEA. Human Error Classification and Data Collection; The International Atomic Energy Agency: Vienna, Austria, 1989; p. 167. [Google Scholar]
  59. IEEE. IEEE Guide for Incorporating Human Reliability Analysis into Probabilistic Risk Assessments for Nuclear Power Generating Stations and Other Nuclear Facilities; IEEE: New York, NY, USA, 2018; pp. 1–34. [Google Scholar]
  60. Yang, K.; Tao, L.; Bai, J. Assessment of Flight Crew Errors Based on THERP. Procedia Eng. 2014, 80, 49–58. [Google Scholar] [CrossRef] [Green Version]
  61. Calixto, E. Chapter 5-Human Reliability Analysis. In Gas and Oil Reliability Engineering, 2nd ed.; Calixto, E., Ed.; Gulf Professional Publishing: Boston, MA, USA, 2016; pp. 471–552. [Google Scholar]
  62. Hollnagel, E. Human reliability assessment in context. Nucl. Eng. Technol. 2005, 37, 159–166. [Google Scholar]
  63. Høyland, A.; Rausand, M. System Reliability Theory: Models and Statistical Methods; John Wiley & Sons: Hoboken, NJ, USA, 2009. [Google Scholar]
  64. Oxstrand, J.; Bladh, K.; Collier, S. Qualitative Analysis Makes Simple HRA Methods a Competitive Alternative. In Proceedings of the 10th International Probabilistic Safety Assessment & Management Conference, Seattle, WA, USA, 7–11 June 2010. [Google Scholar]
  65. CCPS. Qualitative and Quantitative Prediction of Human Error in Risk Assessment. In Guidelines for Preventing Human Error in Process Safety; Center for Chemical Process Safety: New York, NY, USA, 2004; pp. 201–245. [Google Scholar]
  66. Stamatis, D.H. Failure Mode and Effect Analysis: FMEA from Theory to Execution; Quality Press: Seattle, WA, USA, 2003. [Google Scholar]
  67. Kmenta, S.; Cheldelin, B.; Ishii, K. Assembly FMEA: A Simplified Method for Identifying Assembly Errors. In Heat Transfer; ASME International: Houston, TX, USA, 2003; Volume 4, pp. 315–323. [Google Scholar]
  68. Armacost, R.; Balakrishnan, D.; Pet-Armacost, J. Design for Remanufacturability Using QFD. In Proceedings of the 11th Annual Industrial Engineering Research Conference, Reno, NV, USA, 21–25 May 2011. [Google Scholar]
  69. Kern, C.; Refflinghaus, R. Cross-disciplinary method for predicting and reducing human error probabilities in manual assembly operations. Total Qual. Manag. Bus. Excell. 2013, 24, 847–858. [Google Scholar] [CrossRef]
  70. Di Pasquale, V.; Miranda, S.; Iannone, R.; Riemma, S. A Simulator for Human Error Probability Analysis (SHERPA). Reliab. Eng. Syst. Saf. 2015, 139, 17–32. [Google Scholar] [CrossRef]
  71. Paz Barroso, M.; Wilson, J.R. HEDOMS—Human Error and Disturbance Occurrence in Manufacturing Systems: Toward the development of an analytical framework. Hum. Factors Ergon. Manuf. Serv. Ind. 1999, 9, 87–104. [Google Scholar] [CrossRef]
  72. Refflinghaus, R.; Kern, C. On the track of human errors—Procedure and results of an innovative assembly planning method. Procedia Manuf. 2018, 21, 157–164. [Google Scholar] [CrossRef]
  73. Kern, C.; Refflinghaus, R. Assembly-specific database for predicting human reliability in assembly operations. Total Qual. Manag. Bus. Excell. 2015, 26, 1056–1070. [Google Scholar] [CrossRef]
  74. Torres, Y.; Nadeau, S.; Landau, K. Application of Human Errors Analysis in Manufacturing: A Proposed Intervention Framework and Techniques Selection. In Kongress der Gesellschaft für Arbeitswissenschaft; GfA-Press: Dresden, Germany, 2019. [Google Scholar]
  75. Blais, G. Méthodologie de Sélection D’anti-erreur à L’assemblage par Calcul de L’efficacité et du Coût Global d’une Application. In MECHANICAL Engineering; École de Technologie Supérieure: Montréal, ON, Canada, 2011. [Google Scholar]
  76. Baez, Y.A.; Rodriguez, M.A.; Limon, J.; Tlapa, D.A. Model of human reliability for manual workers in assembly lines. In Proceedings of the 2014 IEEE International Conference on Industrial Engineering and Engineering Management, Selangor Darul Ehsan, Malaysia, 9–12 December 2014. [Google Scholar]
  77. Meister, M. Resilience in Socio-Technical Systems—A System-Theoretical Analysis of Production Using the Example of a BMW AG Engine (Translated from German). In Lehrstuhl für Ergonomie; Technische Universität München: Munich, Germany, 2014; p. 167. [Google Scholar]
  78. Flick, U. Doing Triangulation and Mixed Methods; SAGE Publications Ltd.: London, UK, 2018. [Google Scholar]
  79. Anett, J. Hierarchical Task Analysis in Handbook of Cognitive Task Design; Hollnagel, E., Ed.; CRC Press: Boca Raton, FL, USA, 2003; pp. 33–51. [Google Scholar]
  80. Embrey, D. Human Reliability SHERPA: A Systematic Human Error Reduction and Prediction Approach; Informa UK Limited: London, UK, 2009; pp. 135–141. [Google Scholar]
  81. Williams, J.C. Heart—A Proposed Method for Achieving High Reliability in Process Operation by Means of Human Factors Engineering Technology. Saf. Reliab. 2015, 35, 5–25. [Google Scholar] [CrossRef]
  82. Embrey, D. SHERPA: A Systematic Human Error Reduction and Prediction Approach to modelling and assessing human reliability in complex tasks. In 22nd European Safety and Reliability annual conference (ESREL 2013); CRC Press: Amsterdam, The Netherlands, 2014. [Google Scholar]
  83. Morlock, F.; Kreggenfeld, N.; Louw, L.; Kreimeier, D.; Kuhlenkoetter, B. Teaching Methods-Time Measurement (MTM) for Workplace Design in Learning Factories. Procedia Manuf. 2017, 9, 369–375. [Google Scholar] [CrossRef]
  84. Alkan, B.; Vera, D.; Ahmad, M.; Ahmad, B.; Harrison, R. A Model for Complexity Assessment in Manual Assembly Operations through Predetermined Motion Time Systems. Procedia CIRP 2016, 44, 429–434. [Google Scholar] [CrossRef] [Green Version]
  85. Zaeh, M.F.; Wiesbeck, M.; Stork, S.; Schubö, A. A multi-dimensional measure for determining the complexity of manual assembly operations. Prod. Eng. 2009, 3, 489–496. [Google Scholar] [CrossRef]
  86. Boring, R.L. How Many Performance Shaping Factors are Necessary for Human Reliability Analysis? In Proceedings of the 10th International Probabilistic Safety Assessment & Management Conference (PSAM10), Seattle, WA, USA, 7–11 June 2010. [Google Scholar]
  87. Hoyek, N.; Collet, C.; Di Rienzo, F.; De Almeida, M.; Guillot, A. Effectiveness of three-dimensional digital animation in teaching human anatomy in an authentic classroom context. Anat. Sci. Educ. 2014, 7, 430–437. [Google Scholar] [CrossRef]
  88. Boeing. Maintenance Error Decision Aid (MEDA)—User’s Guide; The Boeing Company: Seattle, WA, USA, 2013; p. 73. [Google Scholar]
  89. Brands, J. Tightening Technology 4.0: Flexible and Transparent Production with Decentralized Intelligence. Factory Automation 2018. Available online: https://community.boschrexroth.com/t5/Rexroth-Blog/Tightening-technology-4-0-Flexible-and-transparent-production/ba-p/151 (accessed on 5 March 2019).
  90. Camillo, J. Error-Proofing with Power Tools. Assembly Magazine 2010. Available online: https://www.assemblymag.com/articles/87830-error-proofing-with-power-tools (accessed on 10 May 2019).
  91. Dorris, A.L.; Foote, B.L. Inspection errors and statistical quality control: A survey. AIIE Trans. 1978, 10, 184–192. [Google Scholar] [CrossRef]
  92. Rasmussen, J.J. Skills, rules, and knowledge; signals, signs, and symbols, and other distinctions in human performance models. IEEE Trans. Syst. Man Cybern. 1983, 3, 257–266. [Google Scholar] [CrossRef]
  93. Shappell, S.A.; Wiegmann, D.A. The Human Factors Analysis and Classification System (HFACS). 2000. Available online: https://www.skybrary.aero/index.php/Human_Factors_Analysis_and_Classification_System_(HFACS) (accessed on 10 January 2019).
  94. HSE. Understanding Human Failure. 2018. Available online: http://www.hse.gov.uk/construction/lwit/assets/downloads/human-failure.pdf (accessed on 4 January 2019).
  95. Kolbeinsson, A.; Lindblom, J.; Thorvald, P. Missing mediated interruptions in manual assembly: Critical aspects of breakpoint selection. Appl. Ergon. 2017, 61, 90–101. [Google Scholar] [CrossRef] [PubMed]
  96. Massaiu, S. NRC: International HRA Empirical Study—Phase 1 Report (NUREG/IA-0216, Volume 1). In Technical Report November 2009; Office of Nuclear Regulatory Research US Nuclear Regulatory Commission: Rockville, MD, USA, 2018. [Google Scholar]
  97. Stanton, N.A.; Stevenage, S.V. Learning to predict human error: Issues of acceptability, reliability and validity. Ergonomics 1998, 41, 1737–1756. [Google Scholar] [CrossRef] [PubMed]
  98. Richards, B.D. Error Probabilities and Relationships in Assembly and Maintenance of Aircraft Engines. Proc. Hum. Factors Ergon. Soc. Annu. Meet. 2018, 62, 1599–1603. [Google Scholar] [CrossRef]
  99. Hodkinson, P.; Hodkinson, H. The strengths and limitations of case study research. In Proceedings of the Learning and Skills Development Agency Conference, Cambridge, UK, 27–28 February 2020. [Google Scholar]
  100. Romero, D. Towards an Operator 4.0 Typology: A Human-Centric Perspective on the Fourth Industrial Revolution Technologies. In Proceedings of the CIE46, Tianjin, China, 29–31 October 2016. [Google Scholar]
  101. Nadeau, S.; Landau, K. Utility, Advantages and Challenges of Digital Technologies in the Manufacturing Sector. Ergon. Int. J. 2018, 2, 1–15. [Google Scholar]
Figure 1. Utilization areas for manual, hybrid and automated assembly concepts. Reprinted by permission from Springer: Changeable and Reconfigurable Assembly Systems by B. Lotter and H.-P. Wiendahl (COPYRIGHT 2009).
Applsci 11 00749 g001
Figure 2. Human error analysis process used in the study. HTA = hierarchical task analysis; SHERPA = systematic human error reduction and prediction approach; HEART = human error assessment and reduction technique; GTT = generic task type, EPC = error producing condition; APOA = assessed proportion of effect; HEP = human error probability.
Applsci 11 00749 g002
Figure 3. Workstation’s layout (not to scale) and general workflow: (1) read work instruction on the PC, (2) pick the parts from bins, (3) pick tools from the tool cabinet, (4) execute assembly operations and (5) close work instructions on the PC.
Applsci 11 00749 g003
Figure 4. Parts used in the assembly tasks: (1) bracket A, (2) bracket B, (3) bracket C, (4) nut and bolt, (5) cushioned loop clamp, (6) tie-wrap and (7) cap covers.
Applsci 11 00749 g004
Figure 5. 2D drawing showing the exact location where brackets A, B and C should be installed.
Applsci 11 00749 g005
Figure 6. Bracket A secured to the structure in the final assembly location.
Applsci 11 00749 g006
Figure 7. Installation of data cable and cap covers in their respective assembly locations.
Applsci 11 00749 g007
Figure 8. HTA diagram for the breakdown of the critical task No.1 (install brackets).
Applsci 11 00749 g008
Table 2. SHERPA output-human error analysis table for critical task No.1 (install brackets) 1.
Task StepTask DescriptionError ModeError DescriptionConsequenceRecoveryRemedial Strategy
1.1Read work instructionsR2: Wrong information obtained.
R3: Information retrieval incomplete.
Improper interpretation of drawings.
Incomplete reading of work instructions.
A wrong mental representation of the task to be completed leading to improper execution.NoneImprove work instructions: e.g., use interactive 3D models.
Improve instruction delivery systems.
1.2Pick the bracket from bins at workstationS2: Wrong selection made.
A8: Operation omitted.
Selection of a different bracket model.
Bracket not picked.
A different bracket installed.
A missing bracket in the assembly
Step 3Clearly identifiable and labeled bins or validation with a barcode system.
Introduction of kitting feeding system.
1.3Pick fasteners from bins at the workstationS2: Wrong selection made.
A8: Operation omitted.
Selection of a different fastener.
Fasteners not picked.
A different fastener installed, e.g., shorter bolt same caliber.
A missing fastener in the assembly.
Step 1.4Better tracking and guidance during the assembly process.
Introduction of kitting feeding system.
1.4Fix the bracket in proper position.A3: Operation in wrong direction.
A5: Misalignment.
Bracket installed in the wrong direction.
Bracket installed in the wrong position (wrong holes).
A misplaced bracket installed on the assembly not according to design specifications.Step 3Access to more realistic work instructions directly or near the assembly place.
2.Apply required torque.A4: Too little/much operation.
A8: Operation omitted.
Torque applied but out of specifications.
Torque not applied.
Loose fasteners or fasteners too tight. Damage to nuts and boltsStep 3Torque wrench & Error proofing system.
Better tracking and guidance during the assembly process.
3.Check assemblyC1: Check omitted.
C2: Check incomplete.
Omission to check previously installed parts.
Check not done thoroughly.
An undetected quality issue which crosses the recovery barrier.NoneAvoid distractions and interruptions.
In situ visual automated inspection.
1 Similar tables were obtained as a result of the SHERPA analysis for the other two critical tasks. The consolidated results of the identified error modes for the three critical tasks are presented in Table 3. Mitigation strategies are addressed in more detail in the discussion section of this paper. R2, R3, S2, etc., correspond to error codes in the SHERPA taxonomy.
Table 3. Consolidated results of error modes obtained with SHERPA for the three critical tasks under study 1.
Error ModesInstall BracketsSecure Data CableInstall Cap CoversTotal
A3 Operation in wrong direction33-6
A4 Too little/much operation5--5
A5 Misalignment33-6
A8 Operation omitted96419
R2 Wrong information obtained31-4
R3 Information retrieval incomplete31-4
C1 Check omitted1113
C2 Check incomplete1113
S2 Wrong selection made63-9
Total34196
Cycle times155 s51 s28 s
1 Symbol - indicates that no error mode of the associated category (row) was found during the analysis of the task under consideration (column).
Table 4. HEART calculation of the human error probability (HEP) for brackets 1.
Generic Task Type EGeneric Error Probability: 0.02
EPCsMaximum MultiplierAssessed Proportion Of EffectAssessed Effect% Contribution to HEP
(5) No means of conveying spatial and functional information to operators in a form which they can readily assimilate×80.7= ((8 − 1) × 0.7) +1 = 5.949%
(39) Distraction and task interruptions×40.3= ((4 − 1) × 0.3) +1 = 1.915.6%
(12) A mismatch between perceived and real risk×40.2= ((4 − 1) × 0.2) +1 = 1.613.2%
(17) Little or no independent checking or testing of output×30.3= ((3 − 1) × 0.3) +1 = 1.613.2%
(31) Low workforce morale×1.20.2= ((1.2 − 1) × 0.4) +1 = 1.089%
HEP= 0.02 × 5.9 × 1.9 × 1.6 × 1.6 × 1.08 = 0.62
1 Similar calculations of human error probabilities were conducted for the rest of assembly parts under analysis. The consolidated results are presented in Table 5.
Table 5. Consolidated results of HEP calculations and error producing conditions with their respective % contribution 1.
EPCsMaximum MultiplierBracketsCushioned Loop Clamps:Fasteners (Bolts-Nuts)Cap-Covers
(5) No means of conveying spatial and functional information to operators in a form which they can readily assimilate×849%42%--
(12) A mismatch between perceived and real risk×413%15%--
(13) Poor, ambiguous or ill-matched system feedback×4--30%-
(17) Little or no independent checking or testing of output×313%15%22%35%
(26) No obvious way to keep track of progress during an activity×1.4--14%23%
(31) Low workforce moral×1.29%10%--
(39) Distraction and task interruptions×416%18%34%42%
Human Error Probability 0.620.470.290.09
1 Symbol - indicates that the corresponding EPC (row) was not identified during the analysis of the part under consideration (column).
Publisher’s Note: MDPI stays neutral with regard to jurisdictional claims in published maps and institutional affiliations.

