1. Introduction
Developmental progress, consisting of interrelated processes related to maturation, physical growth and learning, may be observed from genetic and environmental adaptation [
1]. The functioning action system in the neonate gives development a flying start. In the first months of life, the maturation of the nervous system allows the acquisition of new abilities [
2] like oculomotor control, which marks a deep improvement in competences of young infants [
3].
The visual-perceptual and cognitive development in childhood requires adequate motor development [
4], which is traditionally divided into gross and fine motor development. We are interested in fine motor skills, including the use of smaller muscles for manipulating objects and drawing [
5].
Some authors have shown that the correct acquisition of fine motor skills has a direct relation with successful academic results [
6]. In addition, the acquisition of both motor and control skills is needed in the daily relationship between children and the surrounding world [
7] and has important implications on different aspects of child and adolescent development [
8]. Therefore, an early intervention designed to correct those motor and control difficulties contributing to the child’s development is fundamental.
Motor and coordination developmental assessment is clinically important in the context of screening, diagnosis and intervention for different reasons [
1]. Signs of motor delay or abnormal motor performance in children may indicate a motor disorder or other developmental problems [
9,
10]. Developmental coordination disorders (DCD) are characterized by a significant delay in the acquisition of gross and fine motor skills and deterioration in the performance of coordinated motor skills, manifested by clumsiness, slowness or motor inaccuracy [
11], but these children are usually not delayed and do not have an easily recognizable neurological disorder [
12].
There is a wide and varied range of tools designed for the assessment of motor competence and coordination in children [
13]. Since the beginning of the 20th century, this has been a field of interest due to the high incidence of childhood pathologies that have presented deficits in agility, balance, strength or the combination of complex movements [
14]. Although most of those tests have become obsolete, their principles and characteristics have served to lay the basis for subsequent investigations [
15]. The use of validated scales like the Movement Assessment Battery for Children 2 (MABC-2) [
16] and the McCarron assessment of neuromuscular development (MAND) [
17] is useful for the screening and identification of DCD, but in these tools there exists a highly subjective component, which depends on the interpretation of the evaluator and can sometimes generate a bias when detecting minimal errors. In addition, some authors suggest that the ‘‘new fine motor skills” that children are developing due to the use of touch screen devices [
18] are not measured by traditional tests like the the Fine Motor Composite of the Bruininks Oseretsky Test of Motor Proficiency, 2nd Edition (BOT-2) [
19].
In this way, the relevance of creating computer tools that can report objective information about the precision of the child’s movements becomes evident. These tools can be used for the evaluation and for the monitoring of the evolution of visual-motor coordination during any type of training or rehabilitation program that is applied. Therefore, informatics tools to identify and analyze the evolution of motor coordination development in children could be useful for any professional directly involved with children’s motor development, such as educational psychologists, physical therapists, occupational therapists and, of course, children themselves [
20].
In this work, we present a mobile application (app) for the analysis of fine motor development in children. The interface displays an object that moves along a path at a certain speed. The children must follow the object by dragging their finger on the screen as close to the object as possible. For later analysis, the app records objective data regarding the child’s performance in each session. The activities can be designed to follow the evolution of the children and to match each individual’s needs for reinforcement. Thus, aspects such as the shape of the path, the type of object moving along it, the speed of the object or the number of attempts, among others, can be configured so various levels of difficulty can be adapted to the child’s motor development.
We determined the ability of the app to assess fine motor coordination in children by obtaining preliminary reference values of fine movements from children during early school years for their use in a future clinical trial. The results obtained with our app cannot be directly compared with those obtained by the tools that are currently more widely used to assess children’s motor coordination problems. Many of these tools measure motor coordination as a function of task execution time, which refers to the child’s speed when performing an activity, however which give us little information about the precision and quality of movement [
16,
21]. Other tools base their function on detecting the number of errors made by the child during the execution of a tracking task [
16,
22], but they do not quantify the magnitude of the error.
2. Materials and Methods
2.1. Mobile Device
In our study we used an ASUS K010 tablet (10.1 inches).
2.2. Mobile App
The mobile app has been developed for the Android operating system. Our objective is to provide a tool for the development of exercises for the evaluation of fine motor skills in children. The exercises are based on tracking the movement of an object (target) along different paths. The app implements a user-friendly interface for designing arbitrary paths and configuring several exercise parameters, such as the speed of the object or whether the path and/or the object will be visible during the exercise, which allow different degrees of difficulty. Exercises that share similar properties can be grouped in levels, which allows the physiotherapists to follow the children’s progression more easily.
For the study presented in this work, we designed three levels, denoted as Level 1, Level 2 and Level 3, each one corresponding to a different path: a straight diagonal line, a parabola-like curve and a zigzag open polygonal line, respectively (
Figure 1). Motor coordination is more in demand when the movements include changing patterns. Sudden direction changes pose a greater difficulty for children who are still developing it [
23].
For each of these levels, three configurations of increasing difficulty were chosen: slow speed (3 cm/s for grades 1st to 3rd and 4 cm/s for grades 4th to 6th), fast speed (6 cm/s for grades 1st to 3rd and 8 cm/s for grades 4th to 6th) and fast speed with hiding of the trajectory of the moving object (with the same speeds as in the previous case). We will refer to them as Mode 1, Mode 2 and Mode 3 in the following (
Table 1).
The slow basal speeds were taken from reference speeds established by previous studies on the performance of children’s writing and drawing tasks on a tablet [
24,
25].
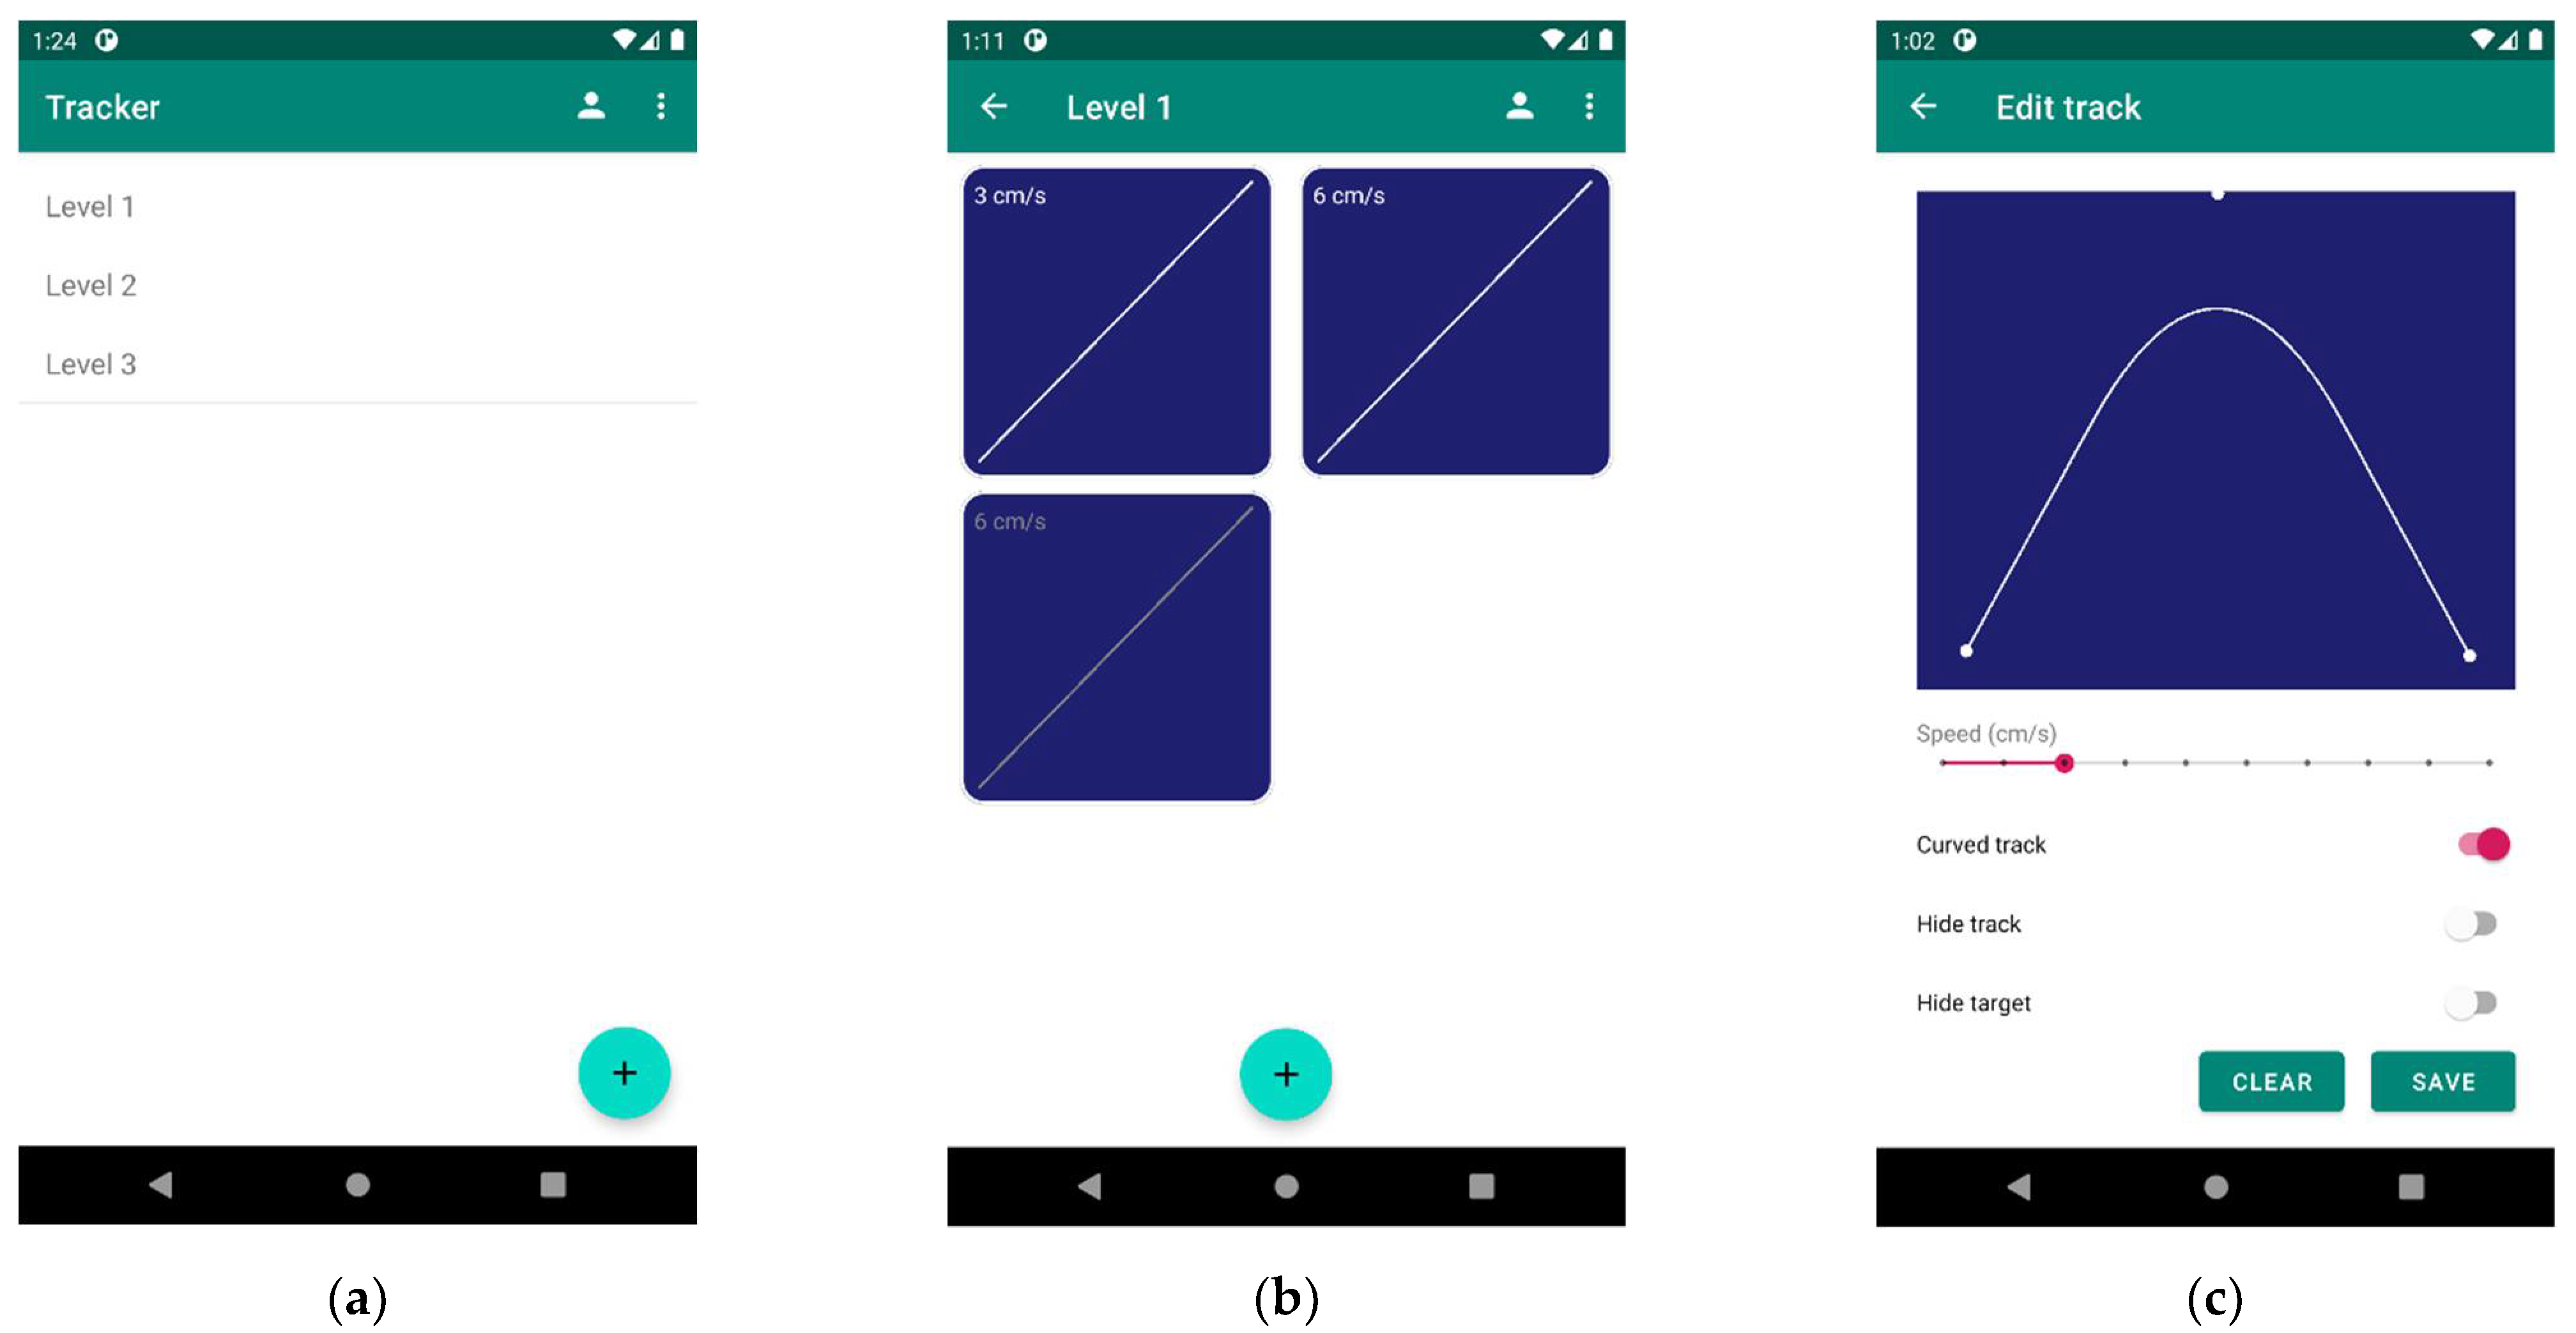
Figure 2a shows the app configured with the three levels;
Figure 2b shows the three modes that are contained in Level 1 for grades 1st to 3rd; and
Figure 2c shows the configuration of Mode 1 in Level 2.
During the assessment, the child must follow the path shown as closely as possible by dragging the finger at the same speed as the object. Depending on the options selected in the exercise configuration, the path, the object or both may disappear during the game, so that the child must remember the path shown at the start of the exercise. The results are displayed when the object reaches the end of the path.
Figure 3 shows the screen before,
Figure 3a, during,
Figure 3b, and after,
Figure 3c, the exercise. The green line in
Figure 3c is the path that the user followed with his/her finger. In order to determine the difference between the target path and the user path, the app polls the position of display touch events periodically. For most Android devices, the polling interval is
. Thus, for each time instant
, if a touch is detected, the app calculates the instantaneous error made by the user as the squared Euclidean distance between the touch event and the target:
where
is the position of the target and
is the detected touch position, both measured in centimeters from the top left corner of the display. If no touch is detected at the time of polling, no action is done. Each of the red lines in
Figure 3c represents one detected touch event, joining points
and
All error measurements are stored to calculate the final score
at the end of the exercise as the mean value of all the instantaneous errors. The score
is shown at the top of the display in
Figure 2c.
Since only detected touch positions are considered in the computation of the final score, the app discards an attempt when the number of touch events is deemed too small. This may happen when the child raises the finger in the middle of the exercise. The maximum number of poll events allowed where no touch is detected is 20% of the total number of polls. If the percentage is higher, the app considers the attempt invalid and displays the final score in red.
The retry button below the score moves the object back to the starting position of
Figure 3a to allow the child to perform further attempts.
2.3. Study Participants
The participants were randomly selected from students of a school in the area of A Coruña (CEIP Francisco Vales Villamarín, Betanzos, A Coruña, Spain) involved in the detection and promotion of motor coordination. Children from primary education (from first grade to sixth grade, ages from 6 to 12) voluntarily participated in this study. Each grade group had 7 or 8 children, for a total of 45 children (24 males, 21 females, mean age 9 ± SD 2.2) enrolled in the study.
Physical Education teachers evaluated the motor coordination state of the children through the administration of the Movement Assessment Battery for Children Second Version (MABC-2) [
16] during the normal course of the class sessions.
The aim of this study was to obtain reference results from the general population of early school years using our app, so the enrolment criteria included only those children without problems at the motor level, according to the previous assessments.
A short test (writing their names) was carried out to check the dominance of the children. All the children were right-handed.
The Clinical Research Ethics Committee of Galicia (CEIC) approved this study and the ethical principles agreed in the Declaration of Helsinki have been respected for all study procedures. Parents and legal guardians signed the free informed consent to collect the clinical data used in the study.
2.4. Study Procedure
The experimental design of this research was cross-sectional. A physiotherapist conducted the procedure. The assessments were carried out in a school classroom, with a relaxed sitting position and with the mobile device placed on a table. The estimated duration of the session was 25 min per child, distributed as follows:
Explanation: The app functioning was explained in the first 10 min. The physiotherapist emphasized that the target on the screen had to be touched in order to start each exercise and that the finger should not be lifted from it at any time until the target reached the end of the path. The levels and the different modes (
Figure 1 and
Table 1) were also explained in this step.
Training: Five minutes were dedicated to guided practice of the three exercises in each level.
Execution: In the remaining 10 min, data were recorded until each child finished three valid complete repetitions of all the exercises contained in the three levels.
All children completed the sessions, showing a good adherence to the study.
2.5. Data Analysis
The app has been designed so that physiotherapists can retrieve all the data recorded by the app for further processing. Before the device (tablet or phone) is given to a child, the therapist must first select the name or identification (ID) from a list previously configured in the app. After the desired number of attempts are done for a given track, a comma-separated value (CSV) file is generated in the external storage with the data from all the attempts. Each attempt in the file starts with one line for the configuration and the global results of that attempt (track ID, speed in , whether the attempt is valid or not, the obtained score and the DPI of the display of the device) followed by as many lines as polls were done during the attempt: time in from the start of the attempt, the coordinates of the target in , the coordinates of the detected touch event in (or if no touch was detected), the instantaneous error in and the estimated user speed in .
For a better understanding of the results, we displayed them using a boxplot. This plot is a common way of displaying data based on the sample median and the first and third quartiles. This boxplot is constituted by the box, drawn from the first quartile () to the third quartile (), and two whiskers corresponding to data below and above . Outliers are represented by a plus sign when below or above , and by a circle when below or above , with the interquartile range. The limits of the whiskers correspond to the minimum and maximum values, not counting outliers. The red line inside the box represents the median.
3. Results
In this section we will show the results from the data recorded by the app using the materials and following the method explained in the previous section. As mentioned before, we tested three trajectories (
Figure 1), with three difficulty modes for each one (
Table 1). Since each child repeated the exercise three times for each trajectory and mode, as explained in the Execution phase of
Section 2.4, each child performed a total of 27 valid attempts.
The first trajectory (
Figure 1a) corresponds to a straight line, which is a very simple exercise that can be done with little concentration.
Figure 4 shows the boxplot of the error
made by the children of the six grades. For each grade, the three attempts were considered as different data points. Since each grade had seven or eight students, each box consisted of either 21 or 24 data points.
We can see that for all modes, plotted in
Figure 4a–c, the median error decreased as the student’s grade increased, even though the speed of grades 4th to 6th was higher than that of grades 1st to 3rd. If we compare the different modes, the error increased with higher speeds (
Figure 4a,b) and grew even more when the path disappeared during the exercise (
Figure 4c). Moreover, we see that Mode 3 resulted in a higher error for all grades. The boxplot also seems to indicate that the 1st grade had a significantly larger dispersion (as measured by the IQR) than the rest at Mode 1 and 2, but at Mode 3 the dispersions were more similar. The motor coordination in 1st grade was not good even for easier modes, which explains this behavior.
Figure 5 shows the results for the parabola-like path (
Figure 1b). Again, the error at all levels decreased as the grade increased. Comparing the different modes, we observed again that Mode 3 produced higher errors. Regarding the dispersion of values, we again observed a decreasing trend in Modes 1 and 2 as the grade increased. Mode 3 did not present this effect.
Figure 6 shows the results for the zigzag path (
Figure 1c). The same trend of a reduction in error as the grade increased was observed, but now the dispersion values were very different at all modes.
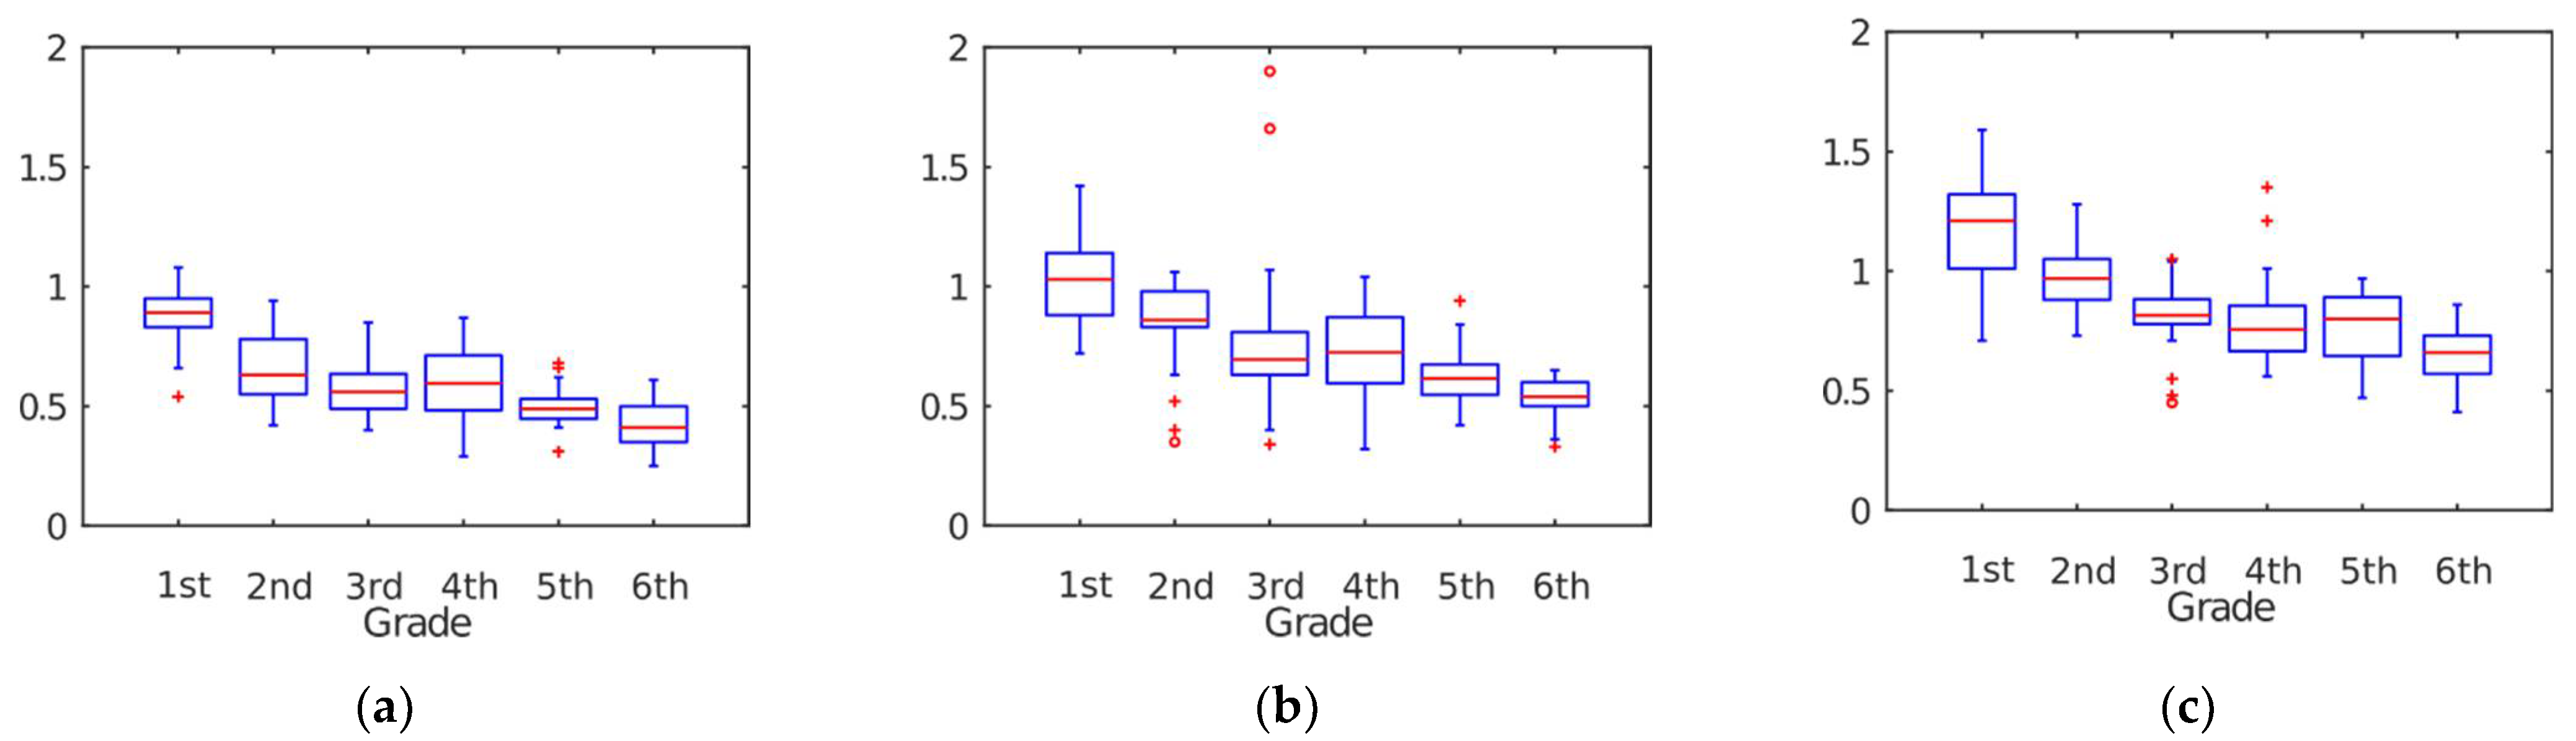
Finally,
Figure 7 shows the results for the different paths: line,
Figure 7a, parabola,
Figure 7b, and zigzag,
Figure 7c. In each figure, the data corresponding to the three modes and the three attempts have been grouped together. Therefore, taking into account our sample of seven to eight participants per grade, each box consists of 63–72 values. In general, we can see that the median decreased with the grade for the three levels. The dispersion for Level 1 was smaller than for the other levels for the 1st, 2nd and 3rd grades. We can also see that Level 3 presented higher errors, since a path with changes in the direction of the trajectory results in more motor difficulty, especially for the first two grades. It is convenient to remark that the differences between the third and the fourth year for all paths were smaller due to the higher speed used for the same mode in the 4th to 6th grades.
Thus, the trend in all figures was as expected. It is also possible to extract reference values for a comparison between users affected by motor coordination disorders and those not affected by them, as considered in this study.
Table 2 shows the mean, median, standard deviation (STD) and interquartile range (IQR) values for each level, considering data from all modes. Clearly, for all cases the mean and the median decreased with the grade and increased with the path’s motor difficulty, as was apparent from the previous figures. In general, we also observed a reduction in terms of dispersion (both in STD and IQR) when we compared the higher grades to the lower grades, which is in line with the degree of motor maturation in children of these ages.
4. Discussion
The study presents a mobile app for the analysis of fine motor development in children. The app proved to be useful in analyzing the fine motor performance during a specific finger task using a progressive trajectory and different speeds, detecting clear differences between movements of children from the first school years. In addition, it was easily managed by children and physiotherapists and showed a high level of satisfaction from all agents involved.
The results show that the error obtained by the children decreases as age advances. The most notable differences were obtained between the first school years. Fundamentally, this decrease in error is associated with the neurodevelopmental and motor learning that children experience as they age [
26]. The differences found between the first years show the importance of the early detection of any motor problem, because at those ages neuronal plasticity is higher and adaptation to stimuli and motor learning are more effective [
27,
28].
When we compare the behavior of visual-motor coordination for each path (straight, parabola and zigzag paths), we see that the error increases as the execution speed increases, and is even greater when the target moves in the absence of the trajectory. These findings are directly related with the activation of brain areas related to imitation or replication of movements. When trying to follow the trajectory established by the ball, children respond better to stimuli presented at slow speeds, which allows them to adapt the movement at each moment of the trajectory more easily than at fast speeds [
29,
30]. The hiding of the trajectory during the exercise requires that the child generates detailed reference copies (mental diagrams of the execution of a movement or task that allow one to anticipate it) of the exercise for its correct execution [
31,
32]. For this reason, we emphasize the importance of the inclusion of this type of activity when detecting possible problems in visual-motor coordination and work to reinforce it.
Finally, when we compared the levels or path types, we observed how the error increased as the children advanced in level. This was due to the incremental difficulty of the requested movements. Sudden direction changes require greater activation of the visual-motor coordination areas by the child, which translates into a significant increase in execution error at young ages where the neuromotor development of these areas is not completed. This effect will be even more accentuated in children with motor coordination problems [
33].
Another point to take into account is handedness dominance. The development of dominance takes place throughout childhood, and several authors have even reflected how this specialization continues in adult life, finding stronger asymmetries in right-handed than left-handed people [
34,
35]. In the present study, all participants were right hand dominant and the use of the dominant hand was controlled during all activity times by the evaluators. This control intended to eliminate any possible bias related to dominance, guaranteeing that the hand used by children for the required tasks was the same hand that they were used in their day-to-day life, especially in the youngest cases.
Thanks to the registered data, this app allows users to quantify the fine motor coordination of a child based on measuring the error in the execution of the child’s movement, which has not been addressed by previous works that are traditionally more focused on execution time [
16,
21,
22]. In addition, the use of external tools for the study of performance in precision activities (such as a pencil or a pen in a manual recording, or a pen or a mouse in a computer recording) can lead to a bias when assessing the movement quality, since the information obtained will be more related to the specific manipulation of the object than to the child’s basal visual-motor coordination. In the case of the MABC-2 tests, used as a screening tool in this study, the records related to trace precision only quantify the number of errors made by the child when leaving the established path without reflecting the magnitude of that error, i.e., a child who deviates 0.1 cm from the path and a child who deviates 1 cm would obtain the same record at that point, which is one error for both cases. For this reason, the data presented here must be taken into account as a precise, objective and quantifiable measurement of movement quality in children.
To our knowledge, this is the first study exploring a mobile app as a resource for assessing fine motor development in children in primary education. Some authors suggest that children may be developing new fine motor skills due to the use of touch screen devices such as phones or tablets [
18]. Therefore, the use of new technologies in education and rehabilitation might be increasingly necessary.
In the infant and primary school stages, the need for an educational reinforcement that allows an improvement in the learning of fine motor skills is frequent. Thus, an appropriate early intervention with the support of informatics tools could facilitate not only the detection of some common problems but could also contribute to the follow-up of these children during their rehabilitation process.
Although our preliminary data were limited due to the small sample size, we consider that the results might provide an incentive for multidisciplinary investigation in this area. These studies should be aimed not only at establishing that mobile applications are useful as support tools during the rehabilitation of children with difficulties in fine motor function, but also at investigating precise reference values that are present in children with developmental coordination disorders in order to implement early problem detection.

 ,
, 


