Article

Evaluation of the Reaction Time and Accuracy Rate in Normal Subjects, MCI, and Dementia Using Serious Games

1
Department of Electrical Engineering, Southern Taiwan University of Science and Technology, Tainan 701, Taiwan
2
Department of Psychiatry, Chiayi Bran Taichung Veterans General Hospital, Chiayi City 600, Taiwan
3
MOST AI Biomedical Research Center at NCKU, Tainan 701, Taiwan
4
Department of Social Welfare, National Chung Cheng University, Chiayi City 620, Taiwan
*
Author to whom correspondence should be addressed.
Appl. Sci. 2021, 11(2), 628; https://doi.org/10.3390/app11020628
Submission received: 23 December 2020 / Revised: 5 January 2021 / Accepted: 7 January 2021 / Published: 11 January 2021
(This article belongs to the Special Issue Serious Games and Mixed Reality Applications for Healthcare)

Abstract

:
The main purpose of this research is to evaluate the differences in the reaction time and accuracy rate of three categories of subjects using our serious games. Thirty-seven subjects were divided into three groups: normal (n1 = 16), MCI (Mild Cognitive Impairment) (n2 = 10), and dementia—moderate-to-severe (n3 = 11) groups based on the MMSE (Mini Mental State Examination). Two serious games were designed: (1) whack-a-mole and (2) hit-the-ball. Two dependent variables, reaction time and accuracy rate, were statistically analyzed to compare elders’ performances in the games among the three groups for three levels of speed: slow, medium, and fast. There were significance differences between the normal group, the MCI group, and the moderate-to-severe dementia group in both the reaction-time and accuracy-rate analyses. We determined that the reaction times of the MCI and dementia groups were shorter compared to those of the normal group, with poorer results also observed in accuracy rate. Therefore, we conclude that our serious games have the feasibility to evaluate reaction performance and could be used in the daily lives of elders followed by clinical treatment in the future.

1. Introduction

The World Health Organization (WHO) estimates that around 50 million people have dementia, with nearly 10 million new cases every year [1]. Dementia refers to deterioration of cognitive function in the elderly. This syndrome affects memory, thinking, orientation, comprehension, calculations, learning capacity, language, and judgment. It also affects individual quality of life and is a financial burden for families due to expensive costs for healthcare [2]. According to the Alzheimer’s association (2019), 36% of people aged 85 or older have Alzheimer’s Disease (AD) [3]. Dementia and other cognitive impairment diseases have become an important global issue, as the number of elderly people is increasing. In 2025, it is predicted that Taiwan will become a super-aged society (National Development Council in Taiwan, 2016). As age increases, problems in cognitive abilities, such as divided attention, memory decline, etc., also increase [4].
Simple reaction times are valid for measuring cognitive function in both patients and normal subjects [5]. Furthermore, the authors in [6] also noted that accuracy rate can correlate significantly with episodic memory performance and other cognitive functions. Reaction time and accuracy rate are thus related to cognitive functions [5,6,7]. Most previous research used neuropsychological tests, such as the Flanker test, the Cambridge Neuropsychological Test Automated Battery, and Repeatable Battery for the Assessment of Neuropsychological Status [6,7]. Therefore, in this study, our main objective is to determine the difference in the reaction time and accuracy rate between the aforementioned three categories of subjects (normal subjects, Mild Cognitive Impairment (MCI), and dementia) using our own designed serious games. We intended to determine whether the response performance (also mentioned in [7]) can differentiate between these three categories. A study by Phillips et al. [8] found that patients with MCI and Alzheimer’s disease had significantly longer reaction times than normal aging control groups, with reaction times that did not eliminate individual differences. When the factors related to the different reaction times of individuals are excluded, patients with MCI actually behaved similarly to the normal aging control group, but the responses of patients with Alzheimer’s disease, after excluding the effects of individual differences, were still not as good as those of the other two groups.
Numerous methods have been developed to examine Alzheimer’s disease and MCI. Invasive methods are used to collect data from inside the human body and are not considered safe and comfortable for subjects [9]. Valladares-Rodriguez et al. [10] found that using noninvasive methods like serious games can detect the onset of MCI or Alzheimer’s disease. In our study, we applied the same method noninvasively by designing PC-based serious games to evaluate the reaction times and accuracy rates related to the cognitive abilities among normal subjects, MCI subjects, and dementia subjects. Our approach was to compare the results of the performance of an elder individual when playing the game using neuropsychological tests of cognitive function based on the MMSE (Mini Mental State Examination).
There are many neuropsychological tests and clinical questionnaires used to assess dementia levels among the elderly. Clinical questionnaires, such as the Mini Mental State Examination (MMSE) [11] and the Montreal Cognitive Assessment (MoCA) [12], are a popular way to evaluate cognitive abilities via clinical measurements. Costaz et al. [13] used an Augmented Reality (AR) serious game called Smartkuber to perform cognitive screening among the elderly. To validate the relationship between game results and MoCa results, the authors used the Pearson correlation statistical method [13,14,15]. In our research, we use the MMSE to evaluate the level of dementia among the elderly due to the heterogeneity of the age-group. A study was conducted by the authors of [16] in Greece to validate the performance of the MMSE, and the result proved that an MMSE score of 23/24 is a credible test for diagnosis of dementia.
Several well-designed serious video games have been proposed and should be helpful for evaluating cognitive abilities [10,11,17,18,19]. Fontana, E et al. [19] developed a serious game called TrainBrain, designed to improve concentration and to minimize the effects of the cognitive decline in attention for the elderly and children with ADHD (Attention Deficit Hyperactivity Disorder). In recent years, the products currently on the mainstream market for video and mobile games were designed for young people to experience exciting sight and sound stimulation, which may not be adaptable for the elderly. The development of a serious game is very challenging, especially when addressing dementia patients. Many factors must be considered, such as the needs of the subjects, human–computer interactions, emotions, comfortability, etc., which make development more complicated. A well-designed GUI (Graphical User Interface) is one of the most important aspects to help subjects focus on the game [20]. In [21], the authors built a whack-a-mole game for tablets (Android-based). The game was divided into different speeds, and the time was used to record the subject’s score and response time. The authors proved that this game can be used to assess some executive functions, especially those related to inhibition, in their recent study [22]. They also suggested that this game can be developed for the elderly to assess other executive functions [22,23].
In this present study, two serious games were designed to meet the standards of play for the elderly. The purpose of our PC-based games was to measure response performance (reaction time and accuracy rate). Psychologists and clinicians were continuously consulted during system development to obtain a better understanding about the complexity of the external appearance of cognitive functions and the reactions of the elderly. Based on [22], first, we built a similar whack-a-mole game without distractors (the objects in addition to the mole) to focus only on reaction time and accuracy rate when playing the game, as the game’s target is to collect information on the reaction time and accuracy rate of the subjects. Then, we designed the second game, hit-the-ball (with a distractor), also to assess judgment ability and to observe how the subjects distinguish between objects. Another issue, as explained in [
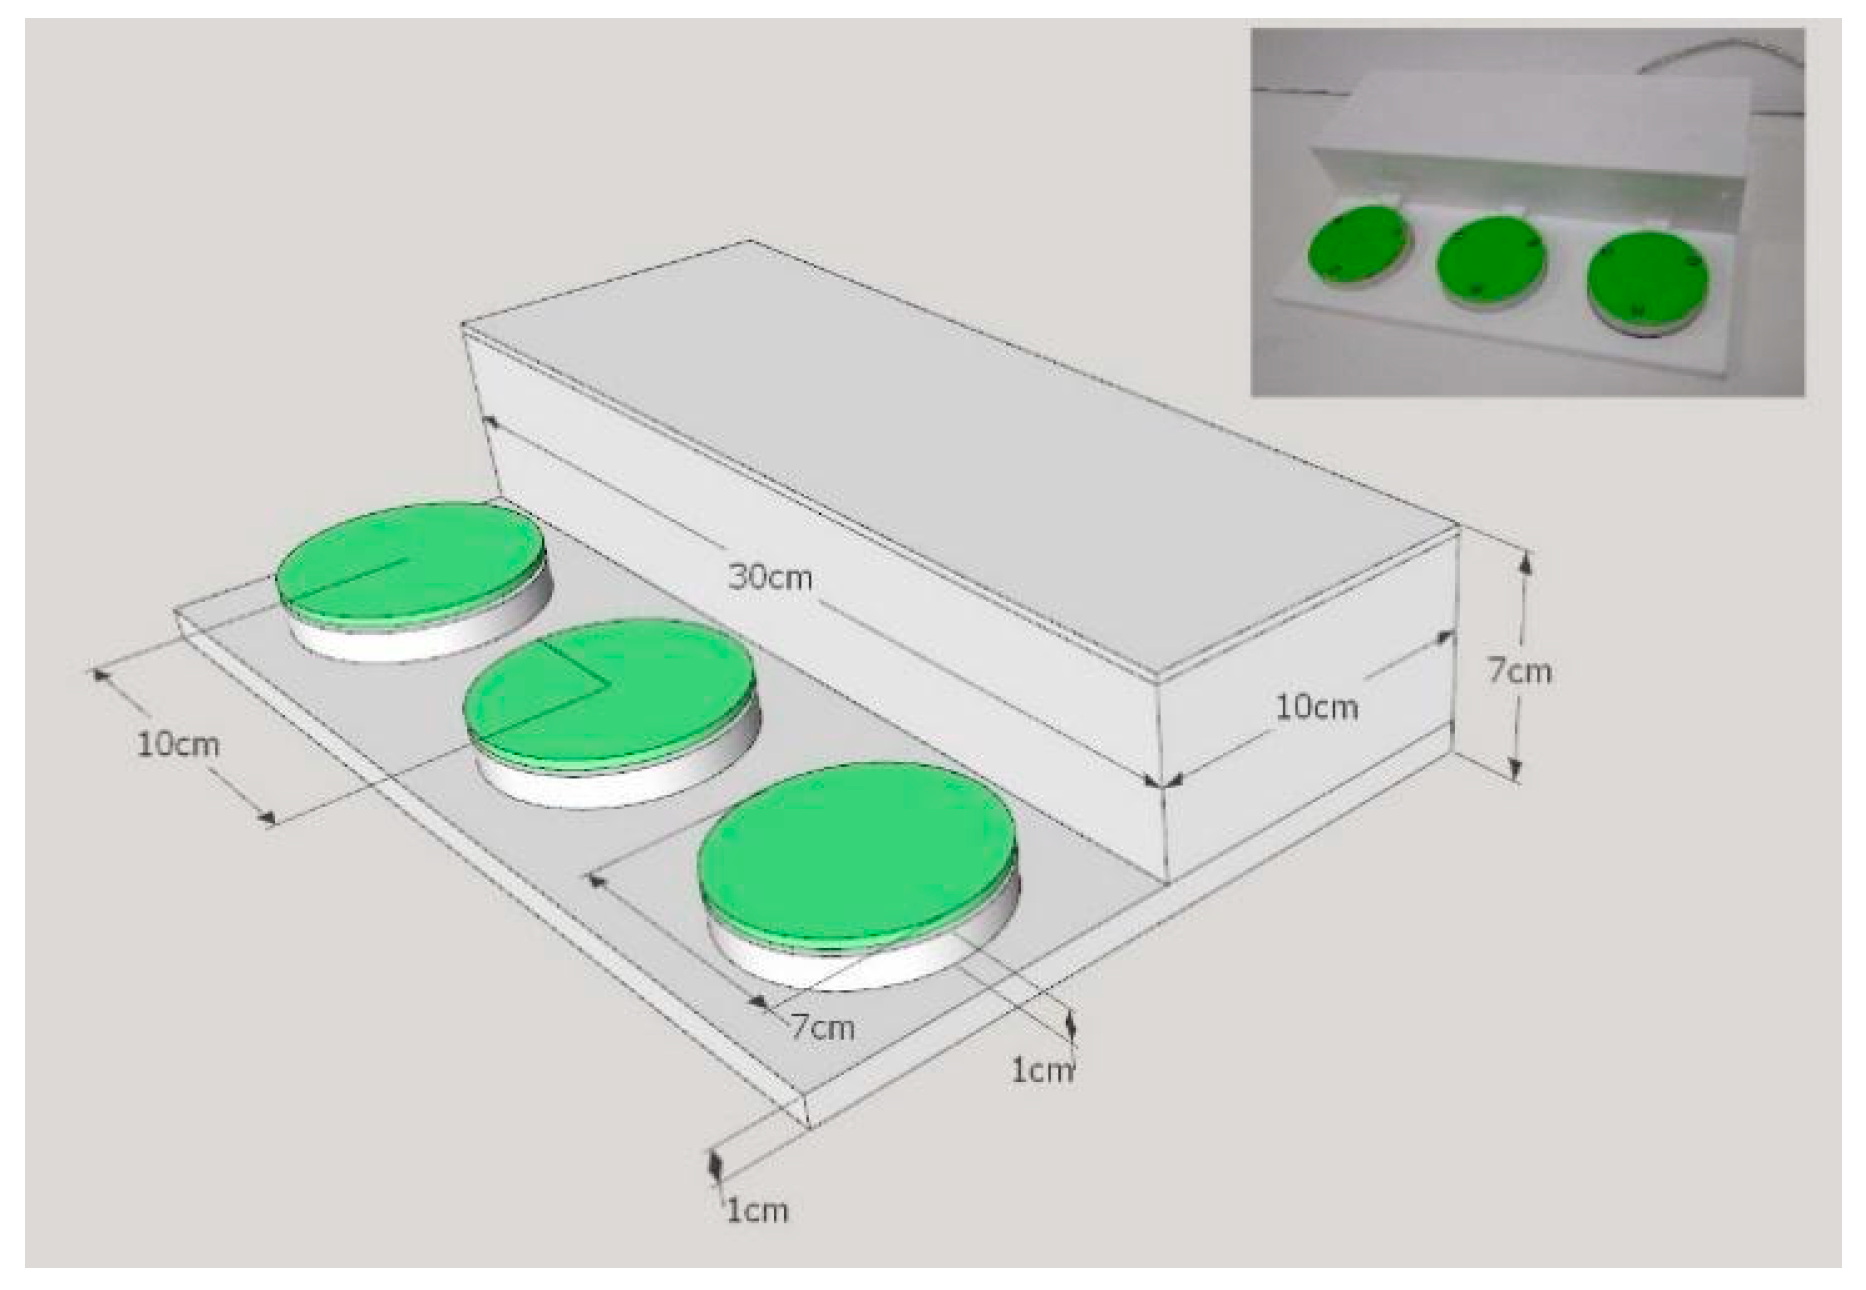
24], is that elderly people may think that computers are not friendly for them, making these games uncomfortable to play. Therefore, our games were designed to be as simple as possible and easy to play, considering that the subjects are old and that most of them have never experienced playing PC-based games before. It was found that the traditional whack-a-mole machine game was a famous game in the past for Taiwanese people. We designed a special board-button to allow the subjects to be more familiar and comfortable with the game. In our discussion, we analyze and explain the response time and the accuracy rate as the dependent variables. We used the MMSE score (normal group, MCI group, and moderate-to-severe dementia group) and game level (slow, medium, and fast) as the independent variables. We also analyzed judgment ability for the hit-the-ball game. All results were calculated using statistical methods (Kruskal–Wallis Test and Friedman Test) for accuracy rate and one-way ANOVA for reaction time. We found that there are significant differences between these three categories of subjects.

2. Methods and Experimental Design

2.1. Game Design

2.1.1. Whack-a-Mole

The typical whack-a-mole machine was historically very popular at playgrounds in Taiwan. The PC-based whack-a-mole game was designed to simulate the gameplay of a real whack-a-mole game machine. Based on the work in [22], we built the game with only three holes and hidden moles that pop up randomly. The players need to hit the correct button on the button array immediately next to the hole when the mole pops up randomly. Unlike the authors in [22], we did not use another object as a distractor, such as a similar mole with a hat or another object to assess inhibition ability, as our main concern here was the differences in reaction times and accuracy rates between our subjects. We designed the game with 3 holes, as shown in Figure 1, and Table 1 shows the three levels of speed: (1) slow, (2) medium, and (3) fast.

2.1.2. Hit-the-Ball

Based on the whack-a-mole game, we built a second game called hit-the-ball. This game has almost the same purpose as that of the whack-a-mole game but with differences to assess judgment ability. We also designed it in a 3D environment. We designed this game considering the participant’s mood since they played the games in sequence, which we assumed would be a relatively long time for an elder. This game has three fairways. Every fairway has three segments for evaluating reaction time. Balls are launched far from the end of the fairway and roll toward the player. In this case, the subject has time to think about and anticipate the right ball. The player needs to hit the balls that roll into the red zone of the fairway, while some metal meteors that should not be hit are used to distract the player’s judgement. We used a judgment analysis to determine if the subjects had any difficulty in differentiating between the objects. The number of balls and metal meteors are the same and appear randomly. Figure 2 shows the design of the hit-the-ball game, and Table 2 shows the three levels of speed for the hit-the-ball game. Three modes with different rolling speeds (from slow to fast) were designed to test reactive ability. A screen demonstration is shown in Figure 3. For further investigations, we included a time-unlimited mode, where we recorded the time when the subject pressed the button even after the ball disappeared.

2.2. Experimental Design

These games were designed using Unity 2018 and the C# platform with Microsoft Visual Studio 2016. Statistical analyses were performed using the SPSS 25 software package (IBM Corporation, Armonk, NY, USA). The designed board-button was made with an Arduino UNO R3 with FSR sensor as the input. We designed the board-buttons for both of the games since we were concerned about the comfort of the patients (some of them have never played PC-based games with a keyboard or mouse). We considered also the size and distance between the button, which should be as large as when they played the game in an amusement park. The width for each button was 7 cm, with the distance between the centers being 10 cm. For detailed information, Figure 3 shows the specification of the designed board-button. Figure 4 shows the subject playing in front of the screen using the designed board-button.
This study was approved by the ethics committee of Taichung Veterans General Hospital in Taiwan and conducted in accordance with good clinical practice procedures and the current revision of the Declaration of Helsinki. There were a total of 37 subjects enrolled in this study, including 16 males and 24 females between the ages of 70 and 90 years, with a mean of 75.38 ± 11.41 SD (16 normal subjects, 10 mild cognitive impairment subjects, and 11 moderate-to-severe dementia subjects). Table 3 shows the demographics of the subjects with the clinical questionnaire MMSE scores.

2.2.1. Clinical Evaluation: MMSE (Mini Mental State Examination)

We used the clinical questionnaire MMSE (Mini Mental State Examination) to categorize our subjects into three different groups: the normal group, the MCI group, and the dementia (moderate-to-severe) group. The MMSE questionnaires were examined by a psychologist along with a doctor specialized in healthcare for the elderly.

2.2.2. Procedure and Consent

The participants signed their consent to ensure they knew all the regulations and the consequences related to the experiments. All participants were instructed before playing to familiarize them with the PC-based games. They also had practice time. In the practice mode, they played in the slow-speed mode for each game and were assisted by the instructor to ensure that they knew how to play the games. They only played both games once, and all data were recorded for analysis. Recorded data during practice were not included.

2.2.3. Modes

In these two games, we separated the measurements into the time-limited mode and time-unlimited mode. The time-limited mode features a limited time to respond when the ball/mole appears, while the time-unlimited mode gives the patients more time to react after the ball/mole disappears. We divided the games this way because we assumed that some of the subjects would be slow to respond to the correct ball and the mole even if they recognized the ball/mole. We believe that the subjects had awareness, even though they reacted slowly. This was proven when they hit the button after the ball had passed the fairway.

2.2.4. Parameters

  • Independent Variable
    To easily observe performance in the hit-the-ball game, the subjects were divided into three groups for observation according to the total score of the subject’s MMSE scale: the normal group (MMSE ≥ 24), MCI group (18 ≤ MMSE ≤ 23), and moderate-to-severe group (MMSE ≤ 17).
  • Dependent Variable
  • The hit-the-ball game
  • Accuracy rate of the ball
    In the hit-the-ball game, the accuracy rate considered only correct balls hit by our subjects. Every speed level has 5 balls, and the accuracy rate was calculated for the time-limited and time-unlimited modes in each group of subjects. Time-limited here means the time when the subjects pressed the button while the ball was within the red zone. Time-unlimited is considered the time when the ball appeared until the time the next ball appeared.
  • Response time
    This variable includes all response times when the subject presses the button for the three different speed levels. Here, we consider the time-limited and time-unlimited modes to observe the differences between the three different groups.
  • Accuracy rate of the ball and metal meteor (Judgement)
    In this variable, we consider the balls and the metal meteors to observe the judgement of the subjects. There are 5 balls and 5 meteors balls for every speed level. Every subject has to hit the correct ball and not hit the metal meteors to obtain a point. If the subject presses the metal meteors, he or she misses one point.
  • The Whack-A-Mole game
  • Accuracy rate of the mole
    In the whack-a-mole game, the accuracy rate was calculated by all the correct answers when the subjects responded to the mole. There are ten moles for every speed level in this game.
  • Response Time
    The response time for the time-limited mode is the time when the subjects press the button when the mole appears, and for the time unlimited mode, the response time is when the mole appears and disappears before the next mole is launched.

2.3. Statistical Methods

A normality test of the data was performed to determine the use of parametric or nonparametric statistical methods. In the hit-the-ball and whack-a-mole games, the Kruskal–Wallis test was used to compare the accuracy rates among the normal (n1 = 16), MCI (n2 = 10), and moderate-to-severe dementia (n3 = 11) groups. A comparison of the two groups using a Mann–Whitney test was performed after the null hypothesis in the Kruskal–Wallis test was rejected. The median difference among the repeated measures of the 3 speed levels in the game for each group was compared using a Friedman test. A Wilcoxon signed-rank test was used to test the null hypothesis that the median difference between two speed levels is equal to 0. The average response time of the 3 groups was compared by a one-way ANOVA. A post hoc analysis for comparison of the two groups was performed after the null hypothesis in the one-way ANOVA was rejected. The significance level for the statistical analysis was 0.05.

3. Results and Discussion

3.1. Whack-a-Mole

3.1.1. Accuracy Rate Analysis

Table 4 shows the accuracy rate and the results of the Kruskal–Wallis test for comparisons of the three groups at different speed levels for accuracy-rate analysis. In the time-limited mode, the Kruskal–Wallis test was used to observe whether the performance of the three groups was different for the three game speed modes. The results show that the three groups had significant differences at medium speed ( X 2 = 17.147, p < 0.05) and fast speed ( X 2 = 10.187, p < 0.05). The results of the posterior comparison with a Mann–Whitney U test indicated that there was a significant difference between the moderate-to-severe and normal groups (p < 0.05) as well as a significant difference between the MCI and moderate-to-severe groups (p < 0.05) at medium speed. Further, when the speed was fast, the normal and moderate-to-severe groups showed significant differences (p < 0.05), and there was also a significant difference between the MCI group and the moderate-to-severe group (p < 0.05).
In the time-unlimited mode, the Kruskal–Wallis test was used to observe whether the three groups were different at the three game speed levels. The results showed that the three groups were significantly different in the fast speed mode (p < 0.05). The Mann–Whitney U test was then used to perform posterior comparisons, and the results showed that, when the speed was fast, there was a significant difference between the moderate-to-severe group and the normal group (p < 0.05). This means that the time-unlimited mode was relatively easy for the normal group but difficult for the moderate-to-severe group. Some subjects in the MCI group performed well, while others performed poorly.
Table 5 presents posterior comparisons of the impacts of the different game speeds on test scores using a Friedman Test for the time-limited mode to observe whether game speed was different for the three groups. The results show that the differences of all three groups are significant (p < 0.05). A Wilcoxon signed-rank test was used to perform the posterior comparison, and the results showed that the performance in the moderate-to-severe group was significantly different between the medium to fast, slow to fast, and medium to slow speeds (p < 0.05). The normal group, on the other hand, showed a significant difference (p < 0.05) in performance under the medium to fast and slow to fast speeds but no significant difference in slow to medium speeds; the MCI group also had a similar performance. This means that, for the subjects in the moderate-to-severe group, the three speeds provide three different levels of difficulty. For the normal group, there was no difference in performance between the slow and medium speeds. The MCI group presented a similar performance.
In the case of the time-unlimited group, a Friedman test was performed to check if the game speeds of every group of MMSE were significantly different. The results showed that, among the three groups, the normal group and the moderate-to-severe groups had significant speed performance differences (p < 0.05). A Wilcoxon signed-rank test was used to perform the posterior comparison, and the results showed that the performance under slow-to-fast and medium-to-fast speeds in the moderate-to-severe group was significantly different (p < 0.05). This result indicates that, for the subjects in the moderate-to-severe group, each speed is significantly different from the other two speeds.

3.1.2. Reaction-Time Analysis

Table 6 shows the response time(s) of each group of MMSE in the time-limited mode at different game speeds. The table shows that the reaction time decreases as the game speed increases. For the fast speed level, the time taken by the MCI and dementia groups is shorter than that of the normal group. We assume that this occurred because the subjects did not pay attention to which hole the mole appeared in instead of simply pressing the button randomly (which can be observed by the accuracy rate explained in Table 4). For the time-limited mode, after the null hypothesis of the one-way ANOVA was rejected, a post hoc analysis for comparison of two groups was performed and showed differences between the normal group and the moderate-to-severe group, with a T-score = −0.24238 for the slow speed and −0.24998 for medium speed. For the normal group and the MCI group, the T-score was −0.18751 for medium speed. Significance levels were 0.05 for all analyses.
Table 7 shows the response time(s) of different MMSE groups at different game speeds in the time-unlimited mode. In the case of the time-unlimited mode, the response time of the normal group was usually shorter than that of the MCI group and the response time of the MCI group was also shorter than that of the moderate-to-severe group at all three speed levels.
For the time unlimited mode, after rejecting the null hypothesis in one-way ANOVA, a post hoc analysis for a comparison of the two groups was performed and showed differences between the normal group and the moderate-to-severe group only, with a T-score = −0.20988 for slow speed, −0.29224 for medium speed, and −0.9224 for fast speed. The results for the normal group with the MCI group presented a T-score = −0.20037 for medium speed and −0.18090 for fast speed. The significance level was 0.05 for all analyses.

3.2. Hit-the-Ball

3.2.1. Accuracy-Rate Analysis

Table 8 shows the accuracy rate and the results of the Kruskal–Wallis test for comparisons of the three groups at different speed levels for accuracy-rate analysis. In the three groups grouped by MMSE in the time-limited case, the Kruskal–Wallis test was used to observe whether the three groups were different at the three speed levels of the hit-the-ball game. After the posterior test with the Mann–Whitney U test, the results showed that, when the speed is fast, there is a significant difference between the moderate-to-severe group and the normal group (p < 0.05) but there is no significant difference between the moderate-to-severe group and the MCI group (p > 0.05) as well as no significant difference between the normal group and MCI group (p > 0.05). In the time-limited mode, when the game speed is fast, the normal group and the moderate-to-severe group can be distinguished but the normal and MCI groups cannot be distinguished. In Table 8, we can observe that, when the game speed is fast, the performance of those in the normal group and the MCI group is much better than that of those in the moderate-to-severe group.
In the time-unlimited mode, the Kruskal–Wallis test was used to observe whether the three groups were different under the three game speed modes. The results showed that the performance of the three groups under the three game speeds was significantly different (p < 0.05). After a posterior comparison with the Mann–Whitney U test, the results show that, when the speed is slow and fast, there is a significant difference between the moderate-to-severe group and the normal group (p < 0.05) as well as a significant difference between the MCI and moderate-to-severe group (p < 0.05); when the speed is medium, there is a significant difference between the normal group and the moderate-to-severe group (p < 0.05). This means that time-unlimited play is relatively simple for the normal group and the MCI group while the moderate-to-severe group will have some difficulties.
To determine the judgment abilities of the three groups divided by MMSE, by using the Kruskal–Wallis test to observe whether the three groups are different under the three game speeds, the results showed that there were significant differences in performance (p < 0.05) between the three groups. After posterior comparison with the Mann–Whitney U test, the results showed a significant difference between the moderate-to-severe group and the normal group (p < 0.05) in all three speed modes. There were also significant differences between the MCI and moderate-to-severe groups (p < 0.05). This means that it is relatively easy to judge the ball type for the normal and MCI groups, while this same task will be difficult for the moderate-to-severe group.
In the case of the time-limited mode, the performance of the three groups at the three game speeds was analyzed based on Friedman’s two-factor level variation. The results show that the groups have significant performance differences at different speeds (p < 0.05). In addition, a Wilcoxon signed-rank test was used to perform a posterior comparison and the results showed that the speed score was significant (p < 0.05) for the medium vs. fast modes in every group as well as the slow vs. fast modes (p < 0.05). This might indicate that the speed was too fast for all subjects, which is why they performed poorly.
For the three game speeds under the time-unlimited mode, the Friedman test was used to observe whether the game speeds produced significant differences between the three groups. The results showed that only the moderate-to-severe groups had significant differences (p < 0.05). In addition, the Wilcoxon signed-rank test was used to perform the posterior comparison, and the results showed that there were significant differences (p < 0.05) between the speeds of the medium vs. fast and slow vs. fast modes in the moderate-to-severe group. Therefore, for the subjects in the moderate-to-severe group, there will be a large difference in the accuracy rates under high speed compared to other speeds.
For the three groups, judgment ability was discriminated by the different speeds. The analysis was based on the Friedman test, and the MCI group presented significant (p < 0.05) results at the different speeds. However, the results showed no significant difference (p > 0.05) using the comparison with the Wilcoxon signed-rank test. Therefore, for the subjects in the moderate-to-severe group, there is a slight difference in judging the ball compared to the other two groups, but there is no large difference. The time-limited mode can, therefore, better classify the performance of the three groups than the time-unlimited mode. Table 9 shows the posterior comparisons of the results of different game speeds by test scores using the Friedman Test.

3.2.2. Reaction-Time Analysis

The response time here is the time from the ball appearing at the start point to the subject pressing the button. Every group uses the response time of each person as an individual datum for analysis. Without considering individual differences, some people may have responded slightly slower and were only able to react when the ball entered the red zone. Reaction time is used to indicate reaction ability in this evaluation. As the game speed increases, the response time gradually decreased in all groups. The response times under different game speeds are shown in Table 10.
Like in the whack-a-mole game, at medium and fast speed levels, the MCI group has a shorter reaction time than the normal group, but the accuracy rate is very low (see Table 8). Because the three groups of data were used for the normality analysis and found to be normal, a one-way ANOVA was used to test whether the groups were different, and then a post hoc analysis was performed to compare the differences between the groups.
For the time-limited mode, after the null hypothesis was rejected in the one-way ANOVA, a post hoc analysis for comparison of the two groups was performed, and the results showed differences between the normal group and the MCI group, with a T-score = −0.27715 for medium speed; between the normal group and the MCI group, with a T-score = −0.12272 for fast speed; and between the normal group and the moderate-to-severe group, with a T-score = −0.14359 for fast speed. All significance levels were 0.05 for the analyses.
However, when individual differences are considered, the reaction time in the time-unlimited mode did not increase with an increase in the game speed. However, in the three groups, we found that moderate-to-severe subjects needed a longer response time than the normal and MCI groups (as shown in Table 11), which may also indirectly lead to a lower accuracy rate when game speed is faster.

4. Conclusions

In this study, we found that the response performance of subjects with mild cognitive impairment and dementia were poor compared to normal subjects comprehensively evaluated by reaction time and accuracy rate. Although in the reaction-time analysis, the performance times of the MCI and dementia groups seemed to be shorter than those of the normal group for the same speed level, the accuracy-rate analysis showed poor performance for both the MCI and dementia groups. We observed that these groups reacted randomly by pressing the button when the speed was increased, without considering the accuracy of the object in both the whack-a-mole and hit-the-ball games. Our results, along with those in [6,7], show that those subjects had significantly poorer performance when measured by simple reaction time and accuracy rate. Moreover, we successfully differentiated these three categories of subjects using our serious games. For the reaction-time analysis, we established that the time-unlimited mode in our experiment is a better method to explain the results.
We also found that, even though the two games were designed together to evaluate the reaction performance of the subjects, there were some observable differences in the results of each game. Most subjects had better results with the whack-a-mole game than with the hit-the-ball game. The first reason for this result may be because the hit-the-ball game provides some time for the subject to wait before the ball is on the fairway, which might be related to other cognitive abilities. Further related investigations could be explored in the future. The second reason is because the subjects had to choose between the ball or the meteor ball, which might be related to inhibition ability mentioned by [23], which affect reaction time. This result could also be because the subjects played a similar game (like a whack-a-mole machine at an amusement park (especially in Taiwan)) in the past. This result could, thus, indicate muscle memory that was trained several years ago.
Finally, we concluded that the reaction time and accuracy rates can be evaluated using our two serious games while distinguishing between the three different subjects. However, participation of more subjects will be an important factor for future research. We also believe that these research results could be developed to investigate cognitive function for healthy subjects and patients because such results are associated with neural functioning [5,7]. Therefore, we will also observe potential neural cognitive dysfunction using noninvasive methods such as EEG, MRI, and FMRI with our PC-based serious game. We will also conduct intraindividual variability analysis in future studies to observe the behavior of these subjects. Our hope is that these serious games will be used in the daily life lives of elders to evaluate their performance, followed by and to be followed-up by clinical treatment in the future.

Author Contributions

Y.-T.C., C.-J.H., M.-W.H., and Y.-Y.W. planned and supervised the study, and S.-B.H. designed the study. Analyses were performed by N.D. All authors have read and agreed to the published version of the manuscript.

Funding

The authors acknowledge the financial support for this research from the Ministry of Science and Technology Taiwan (grant No. MOST 107-2218-E-367-001 and MOST 108-2634-F-367-001) and the Higher Education Sprout Project of the Ministry of Education (grant No. 13001090182-EDU).

Institutional Review Board Statement

The study was conducted according to the guidelines of the Declaration of Helsinki and approved by the Institutional Review Board (or Ethics Committee) of Taichung Veteran General Hospital (protocol code SF18297A and 2019/01/16).

Informed Consent Statement

Informed consent was obtained from all subjects involved in the study.

Data Availability Statement

Data available on request due to restrictions eg privacy or ethical. The data presented in this study are available on request from the corresponding author. The data are not publicly available due to [Privacy of the Subjects].

Conflicts of Interest

The authors declare no conflict of interest.

References

  1. World Health Organization (WHO). Available online: https://www.who.int/news-room/fact-sheets/detail/dementia (accessed on 12 December 2019).
  2. Bruce, W.; Rafik, G.; Frank, K.; Mihaela, P.; Alex, M. Design of Games for Measurement of Cognitive Impairment. In Proceedings of the IEEE-EMBS International Conference on Biomedical and Health Informatics (BHI), Valencia, Spain, 1–4 June 2014. [Google Scholar] [CrossRef]
  3. Alzheimer’s Disease International. World Alzheimer Report 2019: Attitude to Dementia; Alzheimer’s Disease International: London, UK, 2019. [Google Scholar]
  4. Lu, M.-H.; Lin, W.; Yueh, H.-P. Development and Evaluation of a Cognitive Training Game for Older People: A Design-based Approach. Front. Psychol. 2017, 8, 1837. [Google Scholar] [CrossRef] [PubMed]
  5. Jakobsen, L.H.; Sorensen, J.M.; Rask, I.K.; Jensen, B.S.; Kondrup, J. Validation of reaction time as a measure of cognitive function and quality of life in healthy subjects and patients. Nutrition 2011, 27, 561–570. [Google Scholar] [CrossRef] [PubMed]
  6. Christ, B.U.; Combrinck, M.I.; Thomas, K.G.F. Thomas Both Reaction Time and Accuracy Measures of Intraindividual Variability Predict Cognitive Performance in Alzheimer’s Disease. Front. Hum. Neurosci. 2018, 12, 124. [Google Scholar] [CrossRef] [PubMed] [Green Version]
  7. Chen, K.; Weng, C.; Hsiao, S.; Tsao, W.; Koo, M. Cognitive decline and slower reaction time in elderly individuals with mild cognitive impairment. Jpn. Psychogeriatr. Soc. 2017, 17, 364–370. [Google Scholar] [CrossRef] [PubMed]
  8. Phillips, M.; Rogers, P.; Haworth, J.; Bayer, A.; Tales, A. Intra-Individual Reaction Time Variability in Mild Cognitive Impairment and Alzheimer’s Disease: Gender, Processing Load and Speed Factors. PLoS ONE 2013, 8, e65712. [Google Scholar] [CrossRef] [PubMed] [Green Version]
  9. Juan, M.F.M.; Vasileios, A. Diagnosis of Alzheimer’s Disease Based on Virtual Environments; Information, Intelligence, Systems and Applications (IISA): Sandton, South Africa, 2015. [Google Scholar]
  10. Valladares-Rodríguez, S.; Perez-Rodriguez, R.; Facal, D.; Fernández-Iglesias, M.J.; Anido-Rifon, L.; Mouriño-Garcia, M. Design process and preliminary psychometric study of a video game to detect cognitive impairment in senior adults. PeerJ 2017, 5, e3508. [Google Scholar] [CrossRef] [PubMed] [Green Version]
  11. McCallum, S.; Boletsis, C. Dementia Games: A Literature Review of Dementia-Related Serious Games. In Proceedings of the 4th International Conference on Serious Games Development and Applications (SGDA 2013), Trondheim, Norway, 25–27 September 2013. [Google Scholar]
  12. Regal, P.; Carter, A. Instrumental Activities of Daily Living Questionnaire for Dementia and Mild Cognitive Impairment. J. Neurol. Res. 2015, 5, 153–159. [Google Scholar] [CrossRef] [Green Version]
  13. Costas, B.; Simon, M. Smartkuber: A Serious Game for Cognitive Health Screening of Elderly Players. Games Health J. 2016, 5, 241–251. [Google Scholar]
  14. Costas, B.; Simon, M. Evaluating a Gaming System for Cognitive Screening and Sleep Duration Assessment of Elderly Players: A Pilot Study. In Games and Learning Alliance. GALA 2016; Lecture Notes in Computer Science; Springer: Berlin/Heidelberg, Germany, 2016; Volume 10056, pp. 107–119. [Google Scholar]
  15. Costas, B.; Simon, M. Augmented Reality Cube Game for Cognitive Training: An Interaction Study. Stud. Health Technol. Inform. 2014, 200, 81–87. [Google Scholar] [CrossRef]
  16. Fountoulakis, K.N.; Tsolaki, M.; Chantzi, H.; Kazis, A. Mini mental state examination (MMSE): A validation study in Greece. Am. J. Alzheimer’s Dis. Other Dementiasr. 2000, 15, 342–345. [Google Scholar] [CrossRef]
  17. Chi, H.; Agama, E.; Prodanoff, Z.G. Developing serious games to promote cognitive abilities for the elderly. In Proceedings of the 2017 IEEE 5th International Conference on Serious Games and Applications for Health (SeGAH), Perth, Australia, 2–4 April 2017. [Google Scholar]
  18. Allain, P.; Foloppe, D.; Besnard, J.; Yamaguchi, T.; Etcharry-Bouyx, F.; Le Gall, D.; Nolin, P.; Richard, P. Detecting Everyday Action Deficits in Alzheimer’s Disease Using a Nonimmersive Virtual Reality Kitchen. J. Int. Neuropsychol. Soc. 2014, 20, 468–477. [Google Scholar] [CrossRef] [PubMed] [Green Version]
  19. Fontana, E.; Gregorio, R.; Lucia, E.; Carolina, A. TrainBrain: A Serious Game for Attention Training. Int. J. Comput. Appl. 2017, 160, 1–6. [Google Scholar] [CrossRef]
  20. Fotis, L.; Kurt, D.; Athanasios, V.; Panagiotis, P.; Alina, E. Comparing interaction techniques for serious games through brain-computer interfaces: A user perception evaluation study. Entertain. Comput. 2014, 5, 391–399. [Google Scholar]
  21. Tong, T.; Chignell, M.; Tierney, M.C.; Lee, J. Developing a Serious Game for Cognitive Assessment:2014 Choosing Settings and Measuring Performance. JMIR Serious Games 2016, 4, e7. [Google Scholar] [CrossRef] [PubMed]
  22. Tong, T.; Chignell, M.; DeGuzman, C.A. Using a serious game to measure executive functioning: Response inhibition ability. Appl. Neuropsychol. Adult 2019, 1–12. [Google Scholar] [CrossRef] [PubMed]
  23. Tong, T.; Chignell, M.; Tierney, M.C.; Lee, J.S. Test Retest Reliability of a Serious Game for Delirium Screening in the Emergency Department. Front. Aging Neurosci. 2016, 8, 258. [Google Scholar] [CrossRef] [PubMed]
  24. Shamsuddin, S.N.W.; Ugail, H.; Lesk, V.; Walters, E. VREAD: A Virtual Simulation to Investigate Cognitive Function in the Elderly. In Proceedings of the 2012 International Conference on Cyberworlds, Darmstadt, Germany, 25–27 September 2012. [Google Scholar]
Figure 1. Screenshot demonstration of the whack-a-mole game.
Applsci 11 00628 g001
Figure 2. Screen shots of the first stage of the hit-the-ball game: (a) the scene, (b) the ball, and (c) the metal meteor.
Applsci 11 00628 g002
Figure 3. A designed board-button.
Applsci 11 00628 g003
Figure 4. A subject playing a PC serious game in our experimental room using a designed board-button.
Applsci 11 00628 g004
Table 1. Time difference based on the speed level of the whack-a-mole game (in seconds).
Speed-LevelTime DurationTime Interval between the Mole Appearing
Slow31
Medium21
Fast11
Table 2. Time difference based on the speed of the hit-the-ball game (in seconds).
Speed-LevelTime DurationTime Interval between the BallsTime on the Redzone
Slow3.751.6
Medium2.841
Fast1.840.5
Table 3. Demographic of the subjects with the clinical questionnaire MMSE (Mini Mental State Examination) scores.
SubjectsPeople (Percentage)Mean and Standard Deviations
Age 3775.38 ± 11.41
Sex
Male13 (35%)
Female24 (65%)
MMSE
Normal16 (43%)27.81 ± 1.97
MCI (Mild Cognitive Impairment)10 (27%)20.50 ± 1.51
Moderate10 (27%)14.30 ± 1.49
Severe1 (3%)6 ± 0
Table 4. Posterior comparisons of the different groups by test scores using Kruskal–Wallis.
Game LevelMMSEKruskal–Wallis
Normal (1)MCI (2)Moderate-to-Severe (3) X 2 p-Value
Mean ± SD aMean ± SD aMean ± SD a
Time-limitedSlow0.98 ± 0.050.98 ± 0.040.97 ± 0.060.2290.892
Medium0.99 ± 0.030.99 ± 0.030.88 ± 0.1017.1470.000 *
Fast0.41 ± 0.330.11 ± 0.160.06 ± 0.0910.1870.006 *
Time
unlimited
Slow0.99 ± 0.030.99 ± 0.030.97 ± 0.061.0570.590
Medium1.00 ± 0.001.00 ± 0.000.95 ± 0.104.8590.088
Fast0.97 ± 0.060.86 ± 0.190.80 ± 0.206.2470.044 *
a SD indicates standard deviation. * p < 0.05. The null hypothesis that the medians of the three populations are equal is rejected.
Table 5. Posterior comparisons of different speeds based on test scores using a Friedman Test.
MMSEGame LevelFriedman
Slow(A)Medium(B)Fast(C) X 2 p-Value
Mean ± SD aMean ± SD aMean ± SD a
Time-limitedNormal0.98 ± 0.050.99 ± 0.030.41 ± 0.3328.1670.000 *
MCI0.98 ± 0.040.99 ± 0.030.11 ± 0.1619.4190.000 *
Moderate-to-Severe0.97 ± 0.060.88 ± 0.100.06 ± 0.0920.6000.000 *
Time-unlimitedNormal0.99 ± 0.031.00 ± 0.000.97 ± 0.066.5000.039 *
MCI0.99 ± 0.001.00 ± 0.000.86 ± 0.197.0000.030*
Moderate-to-Severe0.97 ± 0.060.95 ± 0.100.80 ± 0.2011.2170.004 *
a SD indicates standard deviation. * p < 0.05. The null hypothesis that the medians of the three populations are equal is rejected.
Table 6. Time-limited mode: the response time(s) of each group of MMSE at different game speeds.
Game LevelMMSEOne-Way ANOVA
Normal (1)MCI (2)Moderate-to-Severe (3)Fp-Value
Mean ± SD aMean ± SD aMean ± SD a
slow1.10 ± 0.181.27 ± 0.191.34 ± 0.215.6750.007 *
medium1.07 ± 0.191.26 ± 0.121.32 ± 0.187.8650.002 *
fast0.71 ± 0.360.40 ± 0.460.68 ± 0.413.5810.039 *
a SD indicates standard deviation. * p < 0.05.
Table 7. Time-unlimited mode: posterior comparison of each group of MMSE at different game speeds.
Game LevelMMSEOne-Way ANOVA
Normal (1)MCI (2)Moderate-to-Severe (3)Fp-Value
Mean ± SD aMean ± SD aMean ± SD a
slow1.13 ± 0.191.29 ± 0.241.34 ± 0.213.6370.037 *
medium1.08 ± 0.201.28 ± 0.151.38 ± 0.198.7920.001 *
fast1.05 ± 0.171.23 ± 0.161.31 ± 0.169.1140.001 *
a SD indicates standard deviation. * p < 0.05.
Table 8. The accuracy rate and the results of the Kruskal–Wallis test for comparisons of the three groups under different speed levels.
Speed Levels of GameGroupsKruskal–Wallis Test
Normal
Mean ± SD a
MCI
Mean ± SD a
Moderate-to-Severe
Mean ± SD a
X 2 p-Value
Time-limitedSlow0.86 ± 0.170.68 ± 0.380.58 ± 0.296.5870.037 *
Medium0.83 ± 0.240.68 ± 0.400.60 ± 0.373.0960.213
Fast0.50 ± 0.430.16 ± 0.260.02 ± 0.069.9720.007 *
Time-unlimitedSlow1.00 ± 0.000.96 ± 0.130.78 ± 0.2812.6750.002 *
Medium1.00 ± 0.000.98 ± 0.060.78 ± 0.347.6370.022 *
Fast0.98 ± 0.070.88 ± 0.210.56 ± 0.2519.0730.000 *
JudgmentSlow0.98 ± 0.050.95 ± 0.160.76 ± 0.1616.8260.000 *
Medium0.99 ± 0.050.96 ± 0.100.80 ± 0.209.7780.008 *
Fast0.96 ± 0.100.89 ± 0.120.71 ± 0.1917.1750.000 *
a SD indicates standard deviation. * p < 0.05. The null hypothesis that the medians of the three populations are equal is rejected.
Table 9. Posterior comparisons of the results of different game speeds by test scores using the Friedman Test.
MMSEGame LevelFriedman
Slow(A)Medium(B)Fast(C) X 2 p-Value
Mean ± SD aMean ± SD aMean ± SD a
Time-limitedNormal0.86 ± 0.170.83 ± 0.240.50 ± 0.4313.3780.001 *
MCI0.68 ± 0.380.68 ± 0.400.16 ± 0.2612.0000.002 *
Moderate-to-Severe0.58 ± 0.290.60 ± 0.370.02 ± 0.0613.6500.001 *
Time-unlimitedNormal1.00 ± 0.001.00 ± 0.000.98 ± 0.074.0000.135
MCI0.96 ± 0.130.98 ± 0.060.88 ± 0.212.9230.232
Moderate-to-Severe0.78 ± 0.280.78 ± 0.340.56 ± 0.257.0320.030 *
JudgementNormal0.98 ± 0.050.99 ± 0.050.96 ± 0.106.5000.039 *
MCI0.95 ± 0.160.96 ± 0.100.89 ± 0.126.4210.040 *
Moderate-to-Severe0.76 ± 0.160.80 ± 0.200.71 ± 0.194.1710.124
a SD indicates standard deviation. * p < 0.05. The null hypothesis that the medians of the three populations are equal is rejected.
Table 10. Response times of subjects at different game level(s) (time-limited).
Game LevelMMSEOne-Way Anova
Normal (1)MCI (2)Moderate-to-Severe (3)Fp-Value
Mean ± SD aMean ± SD aMean ± SD a
slow0.29 ± 0.210.32 ± 0.260.37 ± 0.270.9500.391
medium0.22 ± 0.130.25 ± 0.150.25 ± 0.130.5870.558
fast0.14 ± 0.070.12 ± 0.070.15 ± 0.000.1630.850
a SD indicates standard deviation. p < 0.05.
Table 11. Response times of subjects at different game level(s) (time-unlimited).
Game LevelMMSEOne-Way ANOVA
Normal (1)MCI (2)Moderate-to-Severe (3)Fp-Value
Mean ± SD aMean ± SD aMean ± SD a
slow0.17 ± 0.380.11 ± 0.550.28 0.511.2130.301
medium0.22 ± 0.470.49 ± 0.470.34 ± 0.229.3420.000 *
fast0.34 ± 0.230.46 ± 0.270.48 ± 0.166.2610.002 *
a SD indicates standard deviation. * p < 0.05.
Publisher’s Note: MDPI stays neutral with regard to jurisdictional claims in published maps and institutional affiliations.

