1. Introduction
To move towards more eco-compatible and environmentally friendly living conditions, the use of plastic in the world, including the food packaging sector, is gradually being reduced [
1]. Plastic bags are composed mainly of LDPE (low-density polyethylene), which is used for both high- and light-weight plastic bags. In recent decades, European policy has paid a lot of attention to plastic pollution, driven by public pressure and social media. Recently, the regulation on plastic was outlined by the Commission Communication with the “EU Plastics Strategy” presented in January 2018, followed by the emanation of the “Single-Use Plastic Directive (2019/904)”, which aims to promote circular plastic economy [
2]. Marine plastic pollution is perceived by the public as having a great impact on the flora and fauna of the globe, and plastic bags are considered the main responsible culprits for this pollution, since once released into the environment, they are particularly difficult to destroy [
3]. In addition, they are able to spread in the aquatic environments in which they are released, thanks to their lightness and their parachute shape, which allow them to be pushed away by the wind and water streams. Pollution of the aquatic world is extremely important, as disperse plastics can persist for years due to their low rate of degradation. Concerning the impact of plastics pollution on the ocean’s ecosystems, there is an increasing knowledge about their deleterious impacts on marine biota [
4]. The threats to marine life are primarily mechanical due to ingestion of plastic debris and entanglement in packaging bands, synthetic ropes and lines, or drift nets. Plastic particles were found in the stomachs of 8 out of the 11 seabird species caught as bycatch. Marine debris affect a significant number of species, including at least 267 species worldwide, 86% of all sea turtle species, 44% of all seabird species, and 43% of all marine mammal species [
4]. Additionally, there is also potential danger to marine ecosystems from the accumulation of plastic debris on the sea floor. Consequently, to address this issue, governments have introduced specific restrictions and, meanwhile, the goal of limiting the release of plastic into the environment has become an area of growing global scientific interest [
5]. In this context, the EU Commission has drafted the “Packaging and Packaging Waste Directive 94/62/EC”, concerning the use and re-use of plastic bags, that was later amended by the “Directive (EU) 2015/720”, which focused on the consumption of light-weight bags (less than 50 µm thick), whose use was no longer free for costumers. This later legislative document calls for EU Member States to undertake initiatives aiming at reducing the average annual consumption of plastic bags to 40 per person by 2025 [
6]. However, long before the European procedures, national policies against plastic bags were adopted in some countries. Germany and Denmark introduced taxes for importing and producing non-biodegradable products in the early 90, Ireland in 2002, while even earlier in 1988, Italian law imposed a tax to importers and producers of non-biodegradable products [
7]. Furthermore, with the legislative “Decree 152/2006 (Testo Unico Ambientale)”, Italy banned plastic bags. In particular, following repeated interventions by the Italian legislator, since 2011, a ban on non-compostable bags was decreed and their gradual replacement with certified compostable bioplastic bags was enabled [
8].
As regards light-weight plastic bags, the ban was adopted in January 2013 anticipating the “Directive (EU) 2015/720” [
9]. With the legislative “Decree 91/2014” [
10], the Italian government obliged producers to market light-weight biodegradable bags according to UNI EN13432 of 2002 [
11]. The last legislative intervention happened in 2017, when the Italian Parliament, approving the Mezzogiorno decree, and from 1 January 2018 imposed the use of biodegradable ultralight bags for weighing and pricing bulk products, such as fruits and vegetables, with a small charge visible on the receipt [
12]. The decree incorporated the “EU directive 2015/720” [
9] and repeals the previous discipline (Article 2 of Legislative Decree 2/2012) and was applied to all plastic bags (
Table 1).
According to the law [
12], ultralight bags (with a thickness less than 20 µm) must be biodegradable and 100% compostable, and by 2021, they will have to be composed of at least 60% of renewable raw materials (vegetable). According to Plastic Consult (2020), which, since 1979, offers consulting and business intelligence in the petrochemical and plastic materials sector, in 2019, 30% of shoppers present in the market were still not in compliance with regulations [
13]. It is therefore clear that the development of a rapid method, usable by authorities, customers, and dealers to rapidly establish the components of the shopping bags could be extremely useful. Italy, as well as several European countries, with the aim of protecting consumers and the environment, with the law “UNI EN 13432:2002” [
11], also requires the manufacturer ensure that the films of the shopping bags are controlled by a third party. This in order to verify the actual compostability of the products placed on the market.
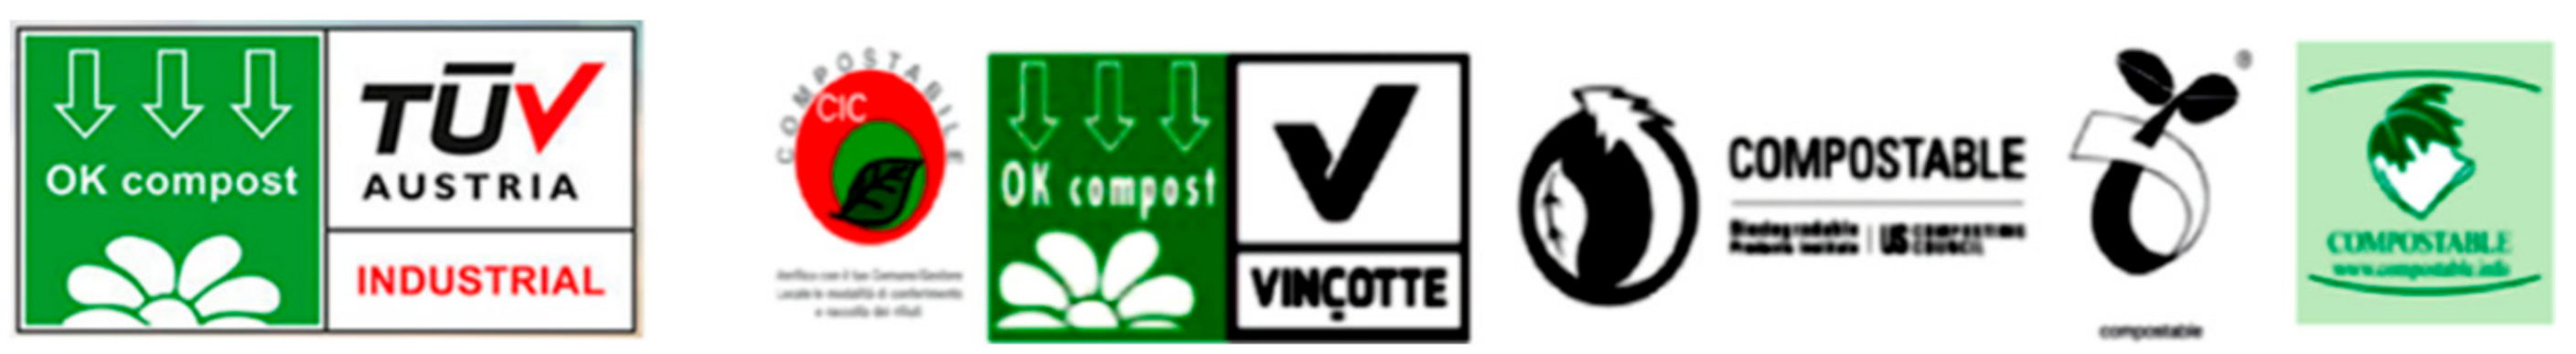
Manufacturers of compostable products can obtain certification from a number of certification bodies, which must evaluate and certify their compliance with a specified standard, primarily EN 13432 or ASTM D6400. In Europe, the most important certification schemes for establishing the compliance to EN 13432 are the DIN-CERTCO (Berlin, Germany), the OK-Compost label of TÜV AUSTRIA (formerly the Belgian OK-Compost label of VINÇOTTE), and the Italian COMPOSTABILE–CIC schemes. The bodies in charge of verification have no connection with the producers of these bags, other than the commercial one. In this way, the utmost seriousness, professionalism, and independence are guaranteed in carrying out the evaluation procedures. Products that meet the test criteria specified in the standards are eligible to receive the certification. Examples of certification labels are shown in
Figure 1.
Once obtained, the certification of conformity is valid generally for five years and confers the right to use the brand for marketing and advertisement purposes. During this period, the certification bodies can perform verification tests on the physicochemical characteristics of films produced by packaging industries responsible for the certified film products. In this regard, Fourier-Transform Infrared (FTIR) spectroscopy is an analytical technique routinely applied in various sectors of industry for performing similar studies. To obtain reliable information from the FTIR spectra of several samples, very similar to each other in terms of physicochemical characteristics, it is necessary to resort to specific analytical techniques, able to work on a series of very complex data, arranged in very large matrices, such as multivariate analysis (MVR), including Principal Component Analysis (PCA) [
14]. In PCA, multi-dimensional data are reduced to a small number of new variables, principal components (PCs), which are orthogonal linear combinations of the original ones, which efficiently represent data variability in low dimensions [
15].
Upon request and in collaboration with the company MecPlast, a packaging Italian industry (Savona, Liguria, Italy), certified by TÜV Italy, i.e., the Italian representative of TÜV Austria, a PCA-assisted FTIR study was conducted on populations of shopping bags opportunely assembled, to obtain information on the possible compliance with the standard of three shopper films, recently extruded, before they were subjected to a periodic inspection. Since the content of PLA is, among others, a key parameter for evaluating the compostability of shopping bags, a predictive linear regression model (PLRM) was also developed, which could allow us to estimate, by acquiring a single FTIR spectrum if, after the productive process, PLA content respects the expectations. Unexpectedly, an alarming scenario was unintentionally highlighted by this study, concerning the quantity of irregular, but certified materials, still present on the market, which shows the persistence of a too low sensitivity towards the health of the environment and the quality of life.
3. Results and Discussion
3.1. Essential Technical Details
Improving the natural environment, protecting it, and consequently guaranteeing for the future increasing better living conditions for humanity are fundamental issues in the interest of the world population. A strategy pursued by several countries consists of the total replacement of plastic-based shoppers with biodegradable and compostable ones. Italy was the first European country who took steps in this direction, by decreeing non-biodegradable plastic-based shopping bags as irregular since 2011. Furthermore, a future-oriented agenda of actions, in co-creation with economic factors, consumers, citizens, and civil society organizations, aims to achieve a global circular economy. Such a condition could ensure cleaner and more competitive living conditions, providing an entirely new range of sustainable services, as well as high quality, functional, and safe products that are more efficient, cheaper, more durable, and designed for reuse, repair, and recycling [
18,
19,
20]. Films for making regular non-plastic-based shopping bags, suitable as bulk food packaging or for hygienic purposes, must have the most rigorous requirements, including physicochemical ones, such as a minimum content of renewable raw material (PLA) and a certain thickness.
Curiously, PLA is not a polyacid but a polyester, which can derive from synthesis by polymerization of lactic acid, but PLA for bioplastics should derive completely or partially from biomass resources and renewable raw materials, such as corn starch (in the United States), tapioca roots, potato chips or starch (mainly in Asia), or sugar cane (in the rest of the world) [
21,
22]. However, PLA is too fragile and is not compatible with many packaging manufacturing processes, therefore it should be strengthened with proper additives [
21]. Less restrictive requirements are expected for bags used for the transport of non-bulk foods such as those distributed at the checkout counters of supermarkets, joint businesses, pharmacies, etc. In this context, the shopper manufacturing industries, before placing their products on the market, must obtain a certification of conformity and must maintain it, affording and overcoming periodical checks, also carried out within the validity period of the certification issued.
Starting from the beginning of 2018, according to the UNI EN 13432:2002 standard [
11], all types of light and ultralight bags must be biodegradable and compostable, and must meet specific requirements.
Table 4 shows the main requirements for shoppers intended for the transport of packaged food or as primary packaging for bulk food.
The penalties for violating producers are very severe, with fines ranging from € 2500 to € 25,000, up to as much as € 100,000 if the violation concerns large quantities of plastic bags or if the value of illegal bags exceeds 10% of the turnover of the industrial products [
23].
It is no longer possible to use the old plastic bags marked with the words “for internal use” or “not for goods removal”. With this law, Italy appeared as the first European country that has begun working actively for an innovative path of bio-economy and circular economy. The biodegradability, compostability, and renewable row material content of the different bags must be certified by the accredited bodies previously reported (
Section 1,
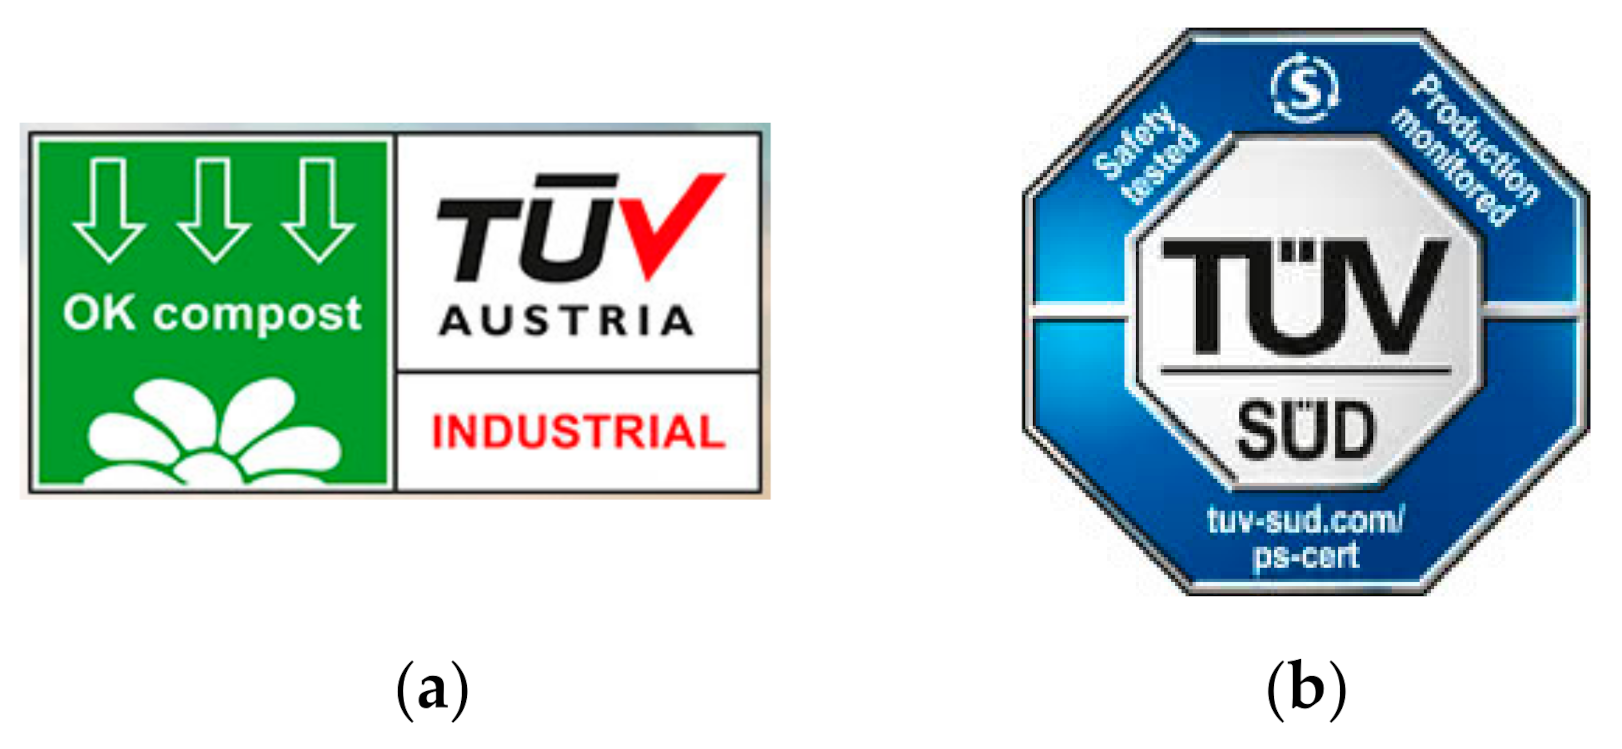
Figure 1). As an example, among those available in Europe, TÜV AUSTRIA (formerly Vinçotte) is the certification body that currently issues the “OK compost” conformity label, similar to the one shown in
Figure 2a.
Among the several tests required in accordance with the standards mentioned above [
11], those relating to chemical characterization, final biodegradability test, disintegration under laboratory conditions, plant compatibility (eco-toxicity test), and earthworm toxicity test (AS 5810 only) are mandatory.
The inspections must be carried out in test laboratories approved by the certification bodies in authority.
In Italy, TÜV Italia issues product certifications through the laboratory activities carried out by TÜV SÜD Product Service, which is an entity recognized all over the world [
24]. TÜV SÜD Product Service allows companies to stamp their certified products with the octagonal TÜV SÜD’s mark known and recognized worldwide (
Figure 2b). The mark certifies that the product, here in particular the shopping bags, has been manufactured in compliance with all safety requirements and that it is subjected to periodical checks. TÜV SÜD Product Service certification requires the execution of several rigorous tests and the maintenance of consistent quality production standards over time [
24].
The assessment of the conformity of the product to the relevant standards, is made by carrying out laboratory tests and verifying the related documentation [
25]. In order to maintain the certification and thus ensure that the certified products are constantly manufactured according to the required quality and safety standards, the experts carry out periodic checks of the physicochemical properties of the production [
25]. In this context, FTIR spectroscopy was herein considered as a fast and easy analytical technique to perform a simulative investigation on samples of shopping bags, and to obtain information on their physicochemical properties and possible conformity.
3.2. FTIR Analysis
FTIR analysis is a spectroscopic technique exploiting electromagnetic radiations ranging from 2500 nm to 25,000 nm of wavelength. FTIR spectroscopic technique provides rapid analytic data which, if properly processed, could provide chemical information concerning samples, therefore reflecting manufacturing processes, samples quality, differences or similarities in chemical composition, appearance, physical characteristics of the samples, etc. [
26]. FTIR spectroscopy, together with other chemical characterizations, is the analytic technique adopted by TÜV Italy and DIN CERTCO to carry out periodic checks of all registered or certified products, and to confirm their certification during the period of validity of the mark [
27]. FTIR technique has the advantages of being usable for both liquid and solid samples, requiring little or no sample preparation and no additional chemicals or consumables [
28,
29]. It is non-destructive, easy to use, fast, reliable, precise, and low cost [
28,
29]. By acquiring the FTIR spectrum on a sample, the instrument provides a graph composed of peaks characterized by an intensity, expressed as a percentage of absorbance or transmittance (A% or T%), as a function of wavenumbers (cm
−1), usually in the range 4000–400 cm
−1. When the spectral data of
n samples are put together in the same matrix, a matrix is achieved whose dimensions depend on the
n value. Sometimes, it is possible to compare the spectral data and detect the physicochemical differences between the samples under study simply by observing the spectra obtained. Otherwise, in most cases, this is not possible, both because the differences are minimal and because the very large number of samples makes the work not feasible.
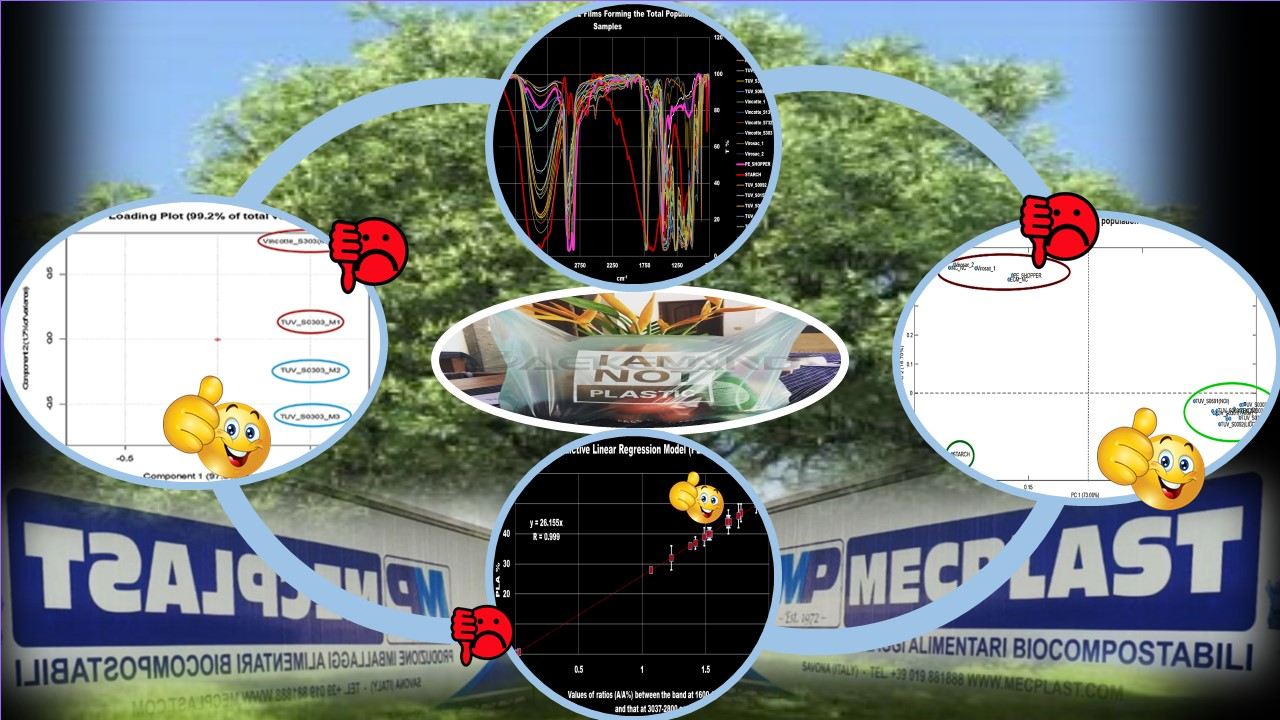
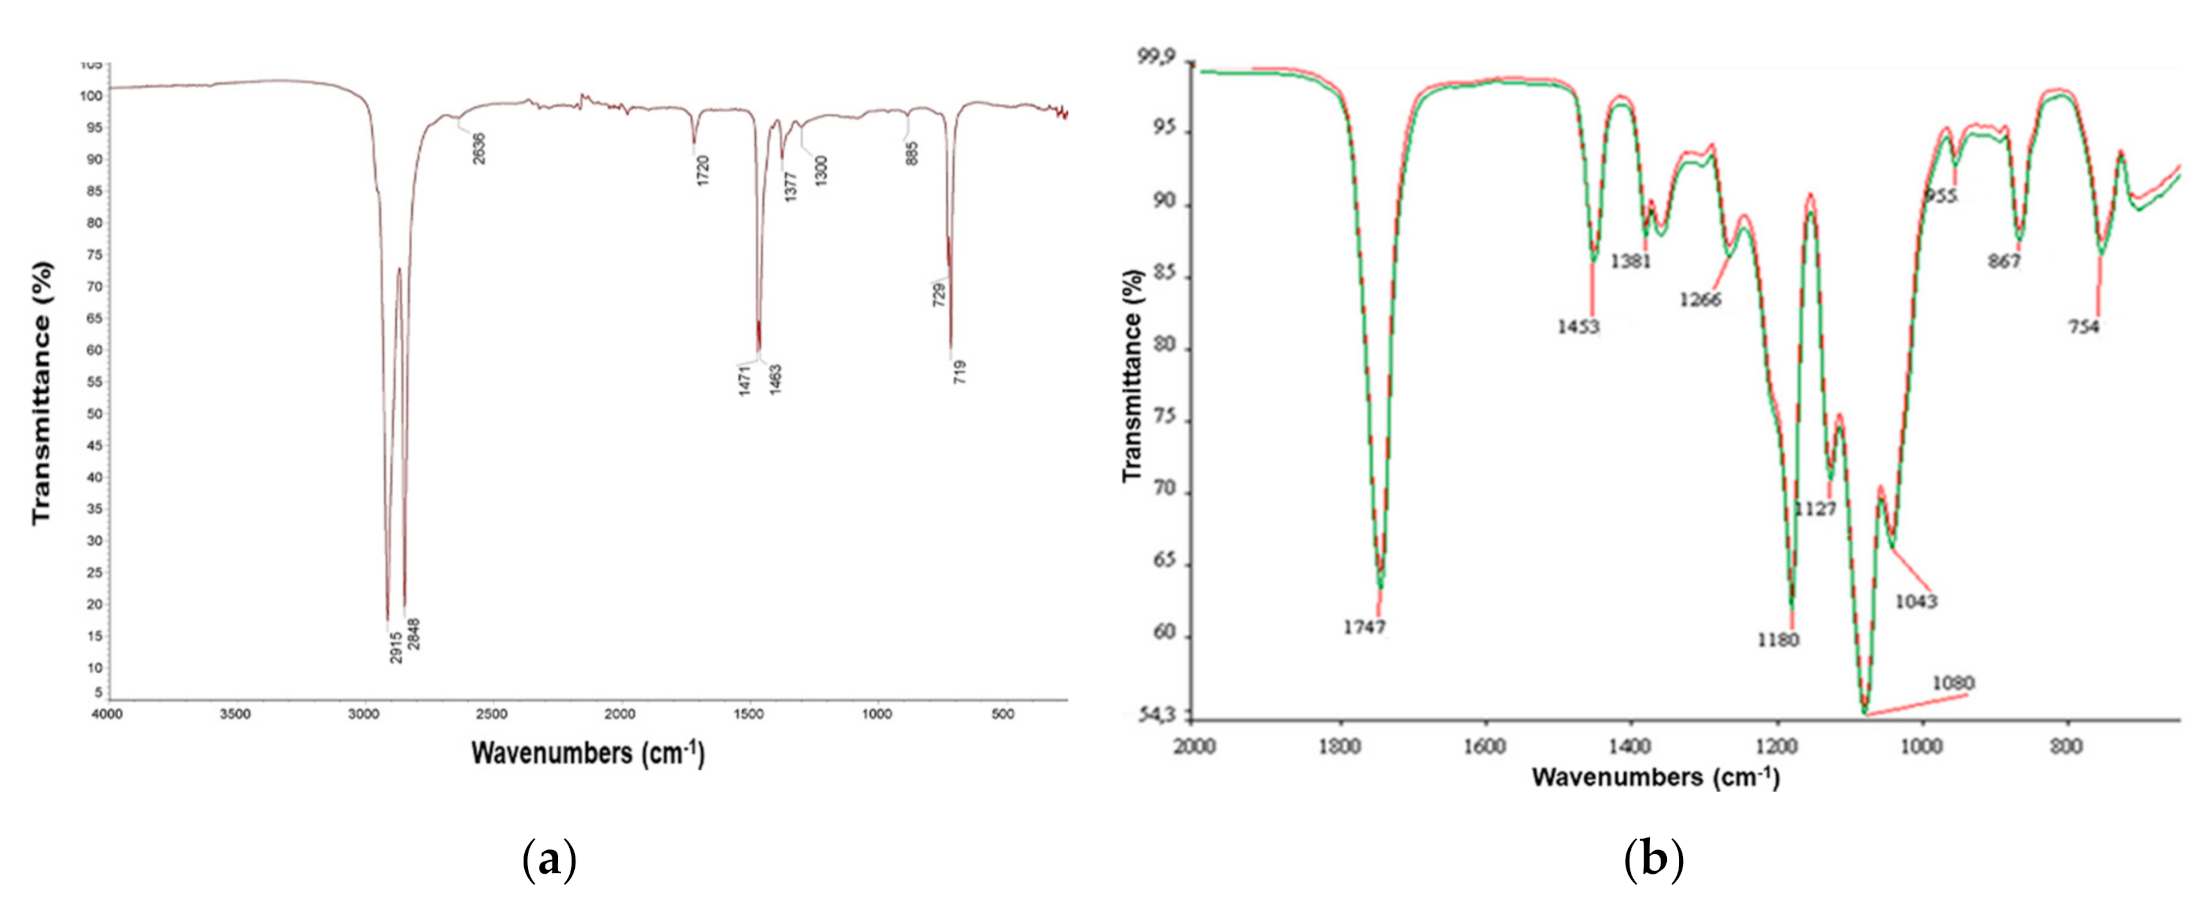
Figure 3a,b report the FTIR spectra of polyethylene (PE) and PLA, respectively, acquired in transmission mode and showed in transmittance scale (T%). They were included to show the substantial differences existing in the spectra of PE and PLA, which are the two polymers typically contained in shopping bags made with old plastics and compostable ones, respectively.
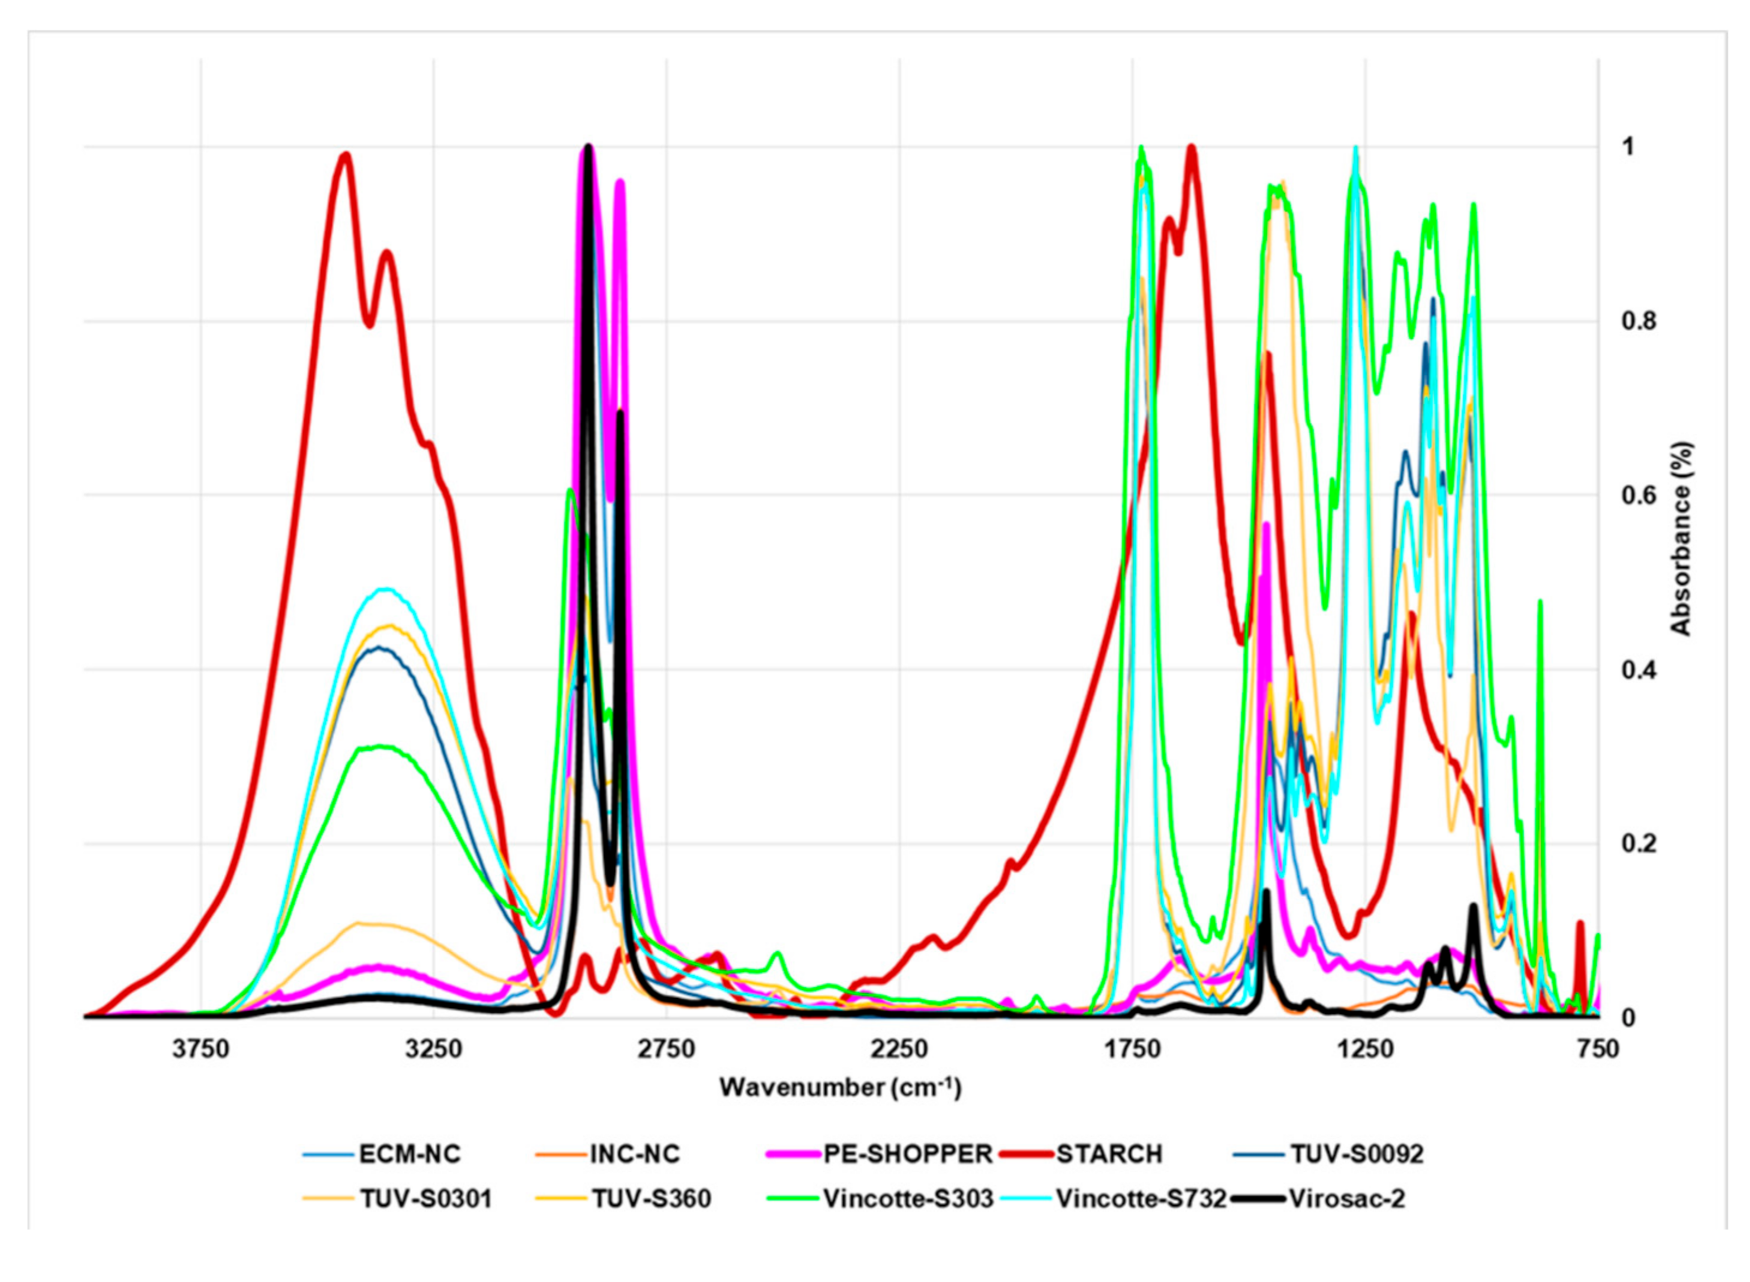
Figure 4 shows the FTIR spectra acquired in transmission mode and reported in absorbance scale of 10 significant samples out of the 22 analyzed in this study and reported in
Section 2.2 (
Table 2).
With the exception of the spectra of starch (thicker red spectrum), PE-based film (thicker fuchsia spectrum), and films of shopping bags, that resulted in not being compliant with the law, as Virosac-2 (thicker black spectrum) (
Figure 4), all other spectra, as those acquired on the three samples provided by the Savona (Liguria, Italy) (
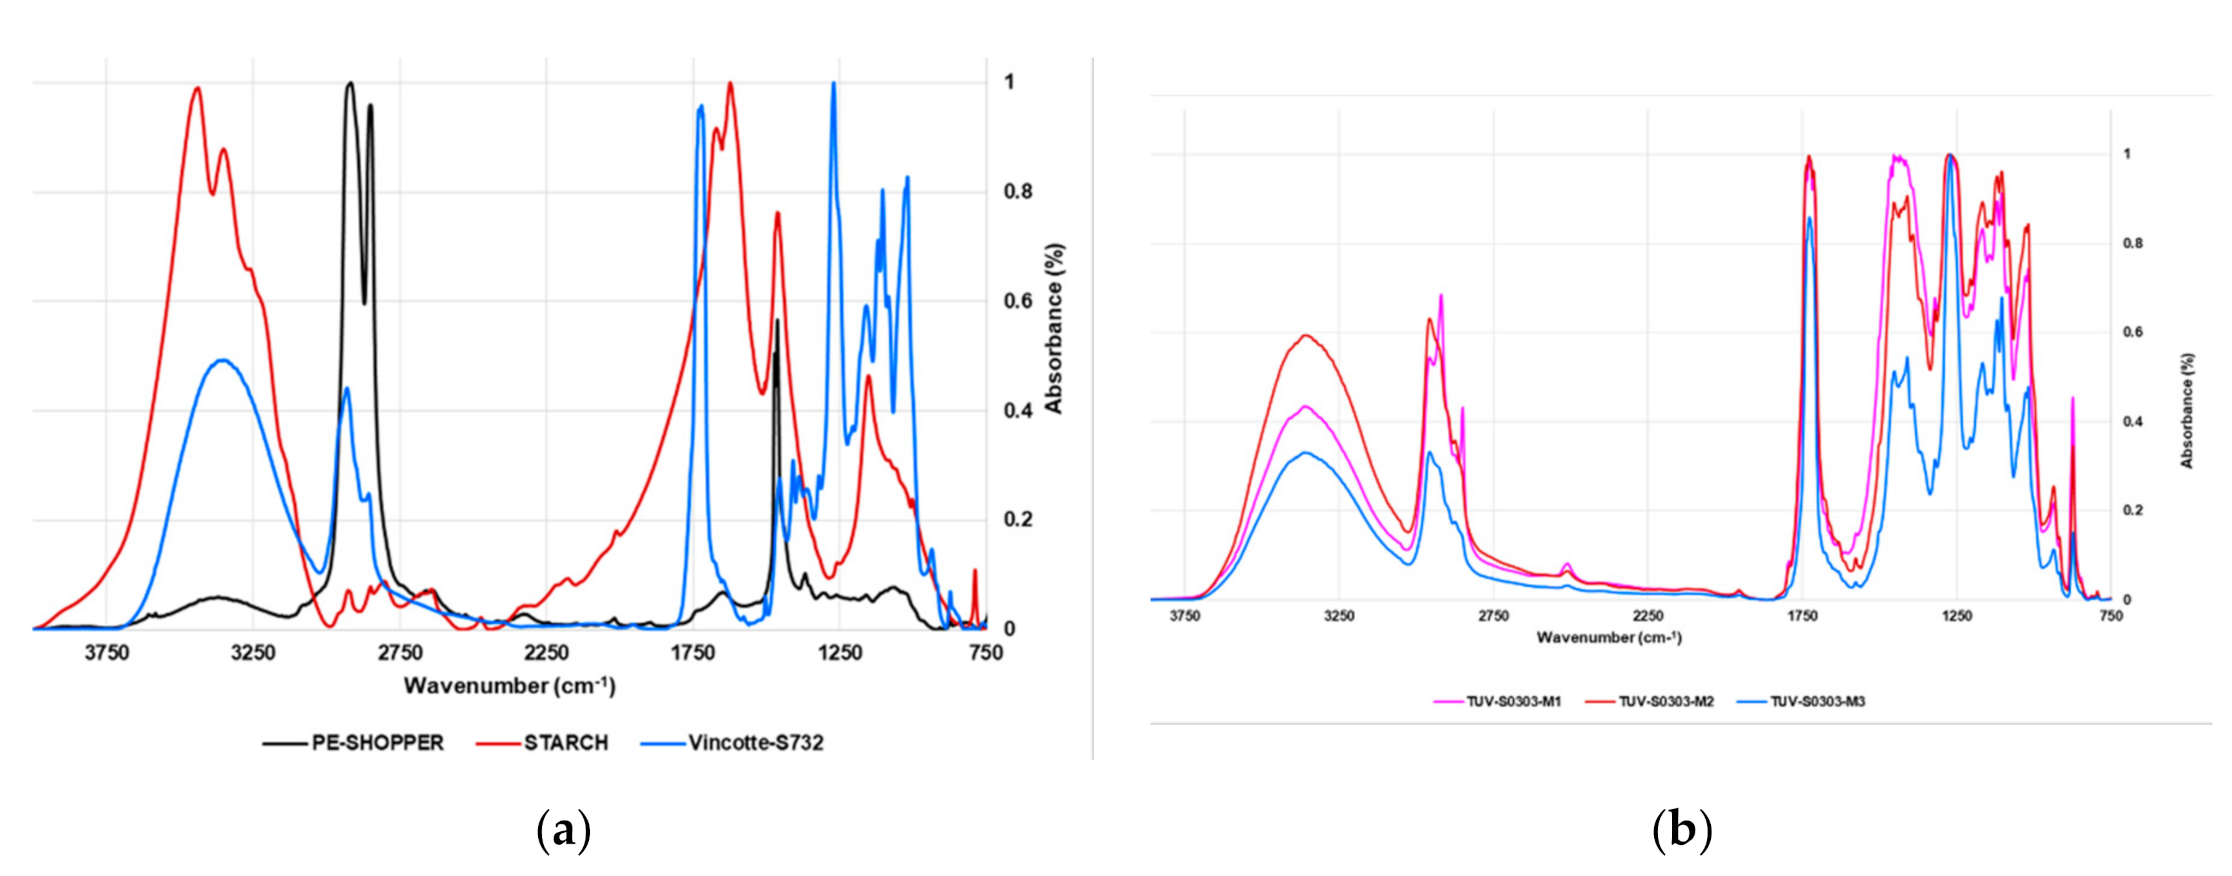
Figure 5b), were very similar to each other, as well as similar to the spectrum of the film with thickness and with PLA content, suitable to be classified as compostable and biodegradable, and also suitable for the transport of bulk food or for hygienic purposes [namely Vinçotte-S732,
Figure 4 (very light blue spectrum) and blue spectrum in
Figure 5a].
In particular, all the spectra obtained were characterized by the presence of an intense band at a wavenumber higher than 1700 cm
−1 (
Figure 4 and
Figure 5a,b), which is missing in the spectra composed essentially by PE (
Figure 4 and
Figure 5a), as well as in the spectrum of PE itself (
Figure 3a). This band belongs to the C=O group of the PLA (
Figure 3b), and clearly indicates that all film samples effectively encompass considerable amounts of renewable raw material, whose presence and content is essential for obtaining the conformity mark.
However, the differences in intensity of the bands and then the differences in PLA% concentrations being minimal, it is impossible to state which samples are actually compliant with regulation, and if the inquired MecPlast samples fall within the population of approved samples.
In situations like this, an analytical tool is needed, that identifies separate clusters of bag samples representing the irregular plastic-based films, compliant materials [
23], and intermediate materials, and that clearly indicates in which cluster the MecPlast samples recently extruded are positioned.
Multivariate analysis (MVA) is a rapid and efficient chemometric tool suitable to study complex instrumental data sets and able to unveil the hidden information in them [
30]. There are more than 20 different ways to perform MVA depending on the type of data and the objectives to be achieved, including Principal Component Analysis (PCA). PCA is the most widely used chemometric technique for handling FTIR spectral data and obtaining the desired information.
3.3. Principal Component Analysis (PCA)
PCA, a widely used method in MVA, often used with spectral data consisting of thousands of variables that necessitate data reduction, was used in the present study for our exploratory purposes.
In PCA, multi-dimensional data are reduced to a small number of new variables, principal components (PCs), which are orthogonal linear combinations of the original ones that efficiently represent data variability in low dimensions. The information carried out by PCs is expressed as a percentage of explained variance. By definition, PC1 has the largest % explained variance, followed by PC2, PC3, and so on [
28,
29].
PCA is able to identify important spectral regions that differentiate the samples belonging to a test population, and is capable of creating clustering patterns on the basis of the spectral data which depend on the physicochemical characteristics of the samples. PCA provides score plots, where one component (e.g., PC1) is displayed versus another (e.g., PC2), and where samples under study assume specific positions, forming groups of similar compounds. The position taken by each sample, on the selected components, provides reliable predictive information on its physicochemical characteristics.
In addition, PCA results can be represented also as loading plots. The loading plot graphs the coefficients (loadings) of each variable considered in the PCA (in our case the variables were the wavenumbers in the range 4000–750 cm−1) for the first component versus the coefficients for the second component. The loading plots allow us to identify which variables, i.e., which wavenumbers, have the largest effect on each component. Loadings can range from −1 to 1. Loadings close to −1 or 1 indicate that the variable strongly influences the component. Loadings close to 0 indicate that the variable has a weak influence on the component. Evaluating the loadings can also help you characterize each component in terms of the variables.
The results of PCA performed on all the samples allowed us to cluster compostable and non-compostable films and to visualize which population the new samples supplied by MecPlast belong to. Moreover, it allowed a further separation inside the compostable population and to visualize which samples were more similar to starch. Additional PCAs performed only on M1, M2, and M3 and opportunely selected compostable samples taken as references, allowed to detect differences/similarities among the three samples and to detect the sample film closest to physicochemical composition of Vinçotte-S732 (with certified PLA% content ≥40% and thickness < 15 µm).
3.3.1. Conformity Prediction
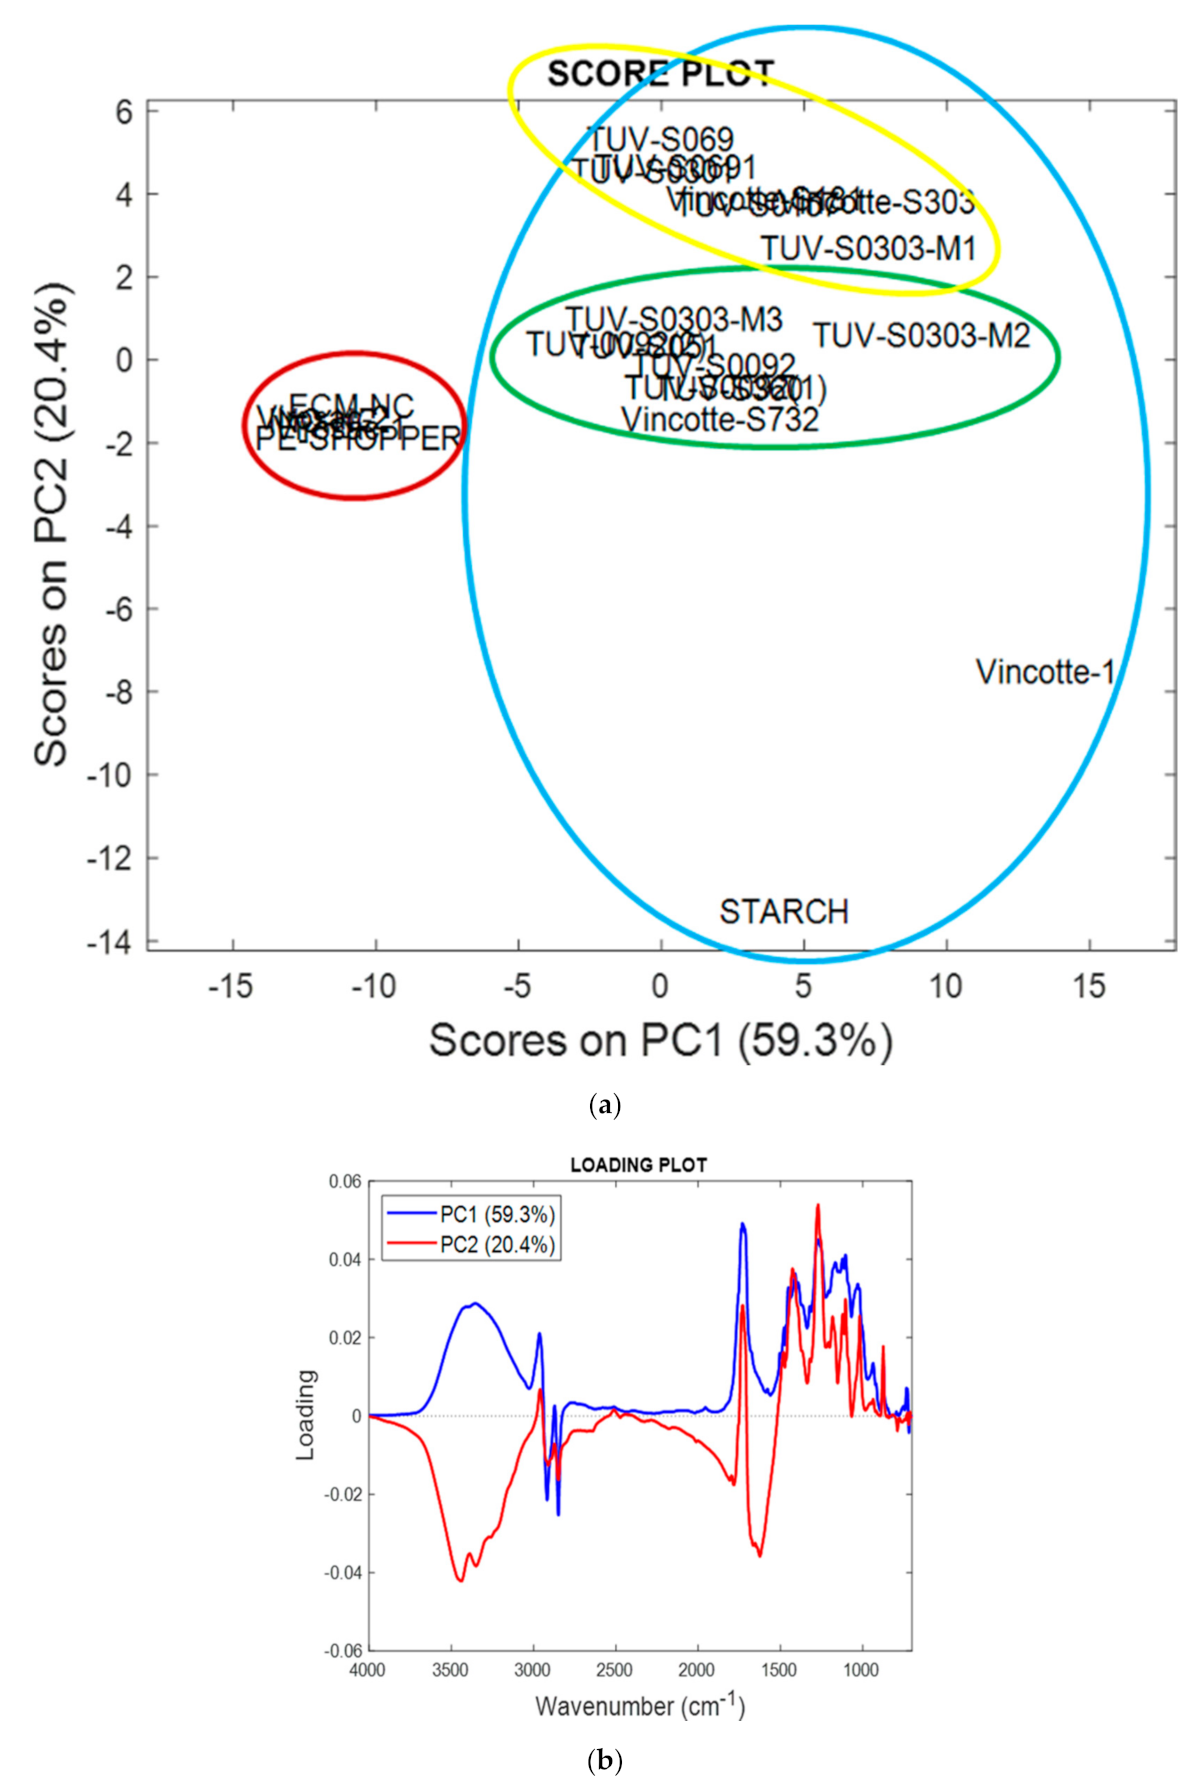
Figure 6 showed the PCA results obtained processing the matrix containing the spectral data of all 22 samples, using R software, represented both as a score plot (
Figure 6a) and a loading plot (
Figure 6b). Accordingly, all three new MecPlast films were found to be part of the population of films clustered in the right side of the score plot, considered compostable and biodegradable, due to the presence of starch (
Figure 6a). This population, circled in light blue, was well separated from the population of films considered to be of irregular plastic, due to the presence of PE-based shopping bag (circled in red) on the principal component 1 (PC1), explaining the 59.3% of variance.
The compostable population resulted furtherly separated into two subgroups, in turn separated from the sample named Vinçotte-1 and from starch, on component 2 (PC2), explaining the 20.4% of variance. In particular, a group of compostable samples was detected, including M1 and Vinçotte-S303 (circled in yellow), separated from a group including M2, M3, and Vinçotte-S732 (circled in green). They were differently distant from starch, representing the renewable material. Rationally, M2, M3, and their group, appearing more close and consequently similar to starch, should have a PLA content higher than that of M1, Vinçotte-S303, and their group, which was more distant and consequently different from starch, as was confirmed developing the PLRM (
Section 3.4). Similarly, Vinçotte-1, which resulted in being separated from both groups and located very close to starch, should have the higher content in renewable material, as was confirmed developing the PLRM (
Section 3.4).
Unfortunately, the PCA results highlighted that only in the delimited area of Genoa, up to 4 films out of a population of 20 (20%), despite being marked for compliance, were found not included in the cluster of the compostable population. Surprisingly they were found very distant from starch, and in the cluster where the entirely non-degradable plastic-based film (PE-shopper) was included (
Figure 6a, circled in red). With insights on the three MecPlast samples (M1, M2, and M3) using selected compostable samples as references,
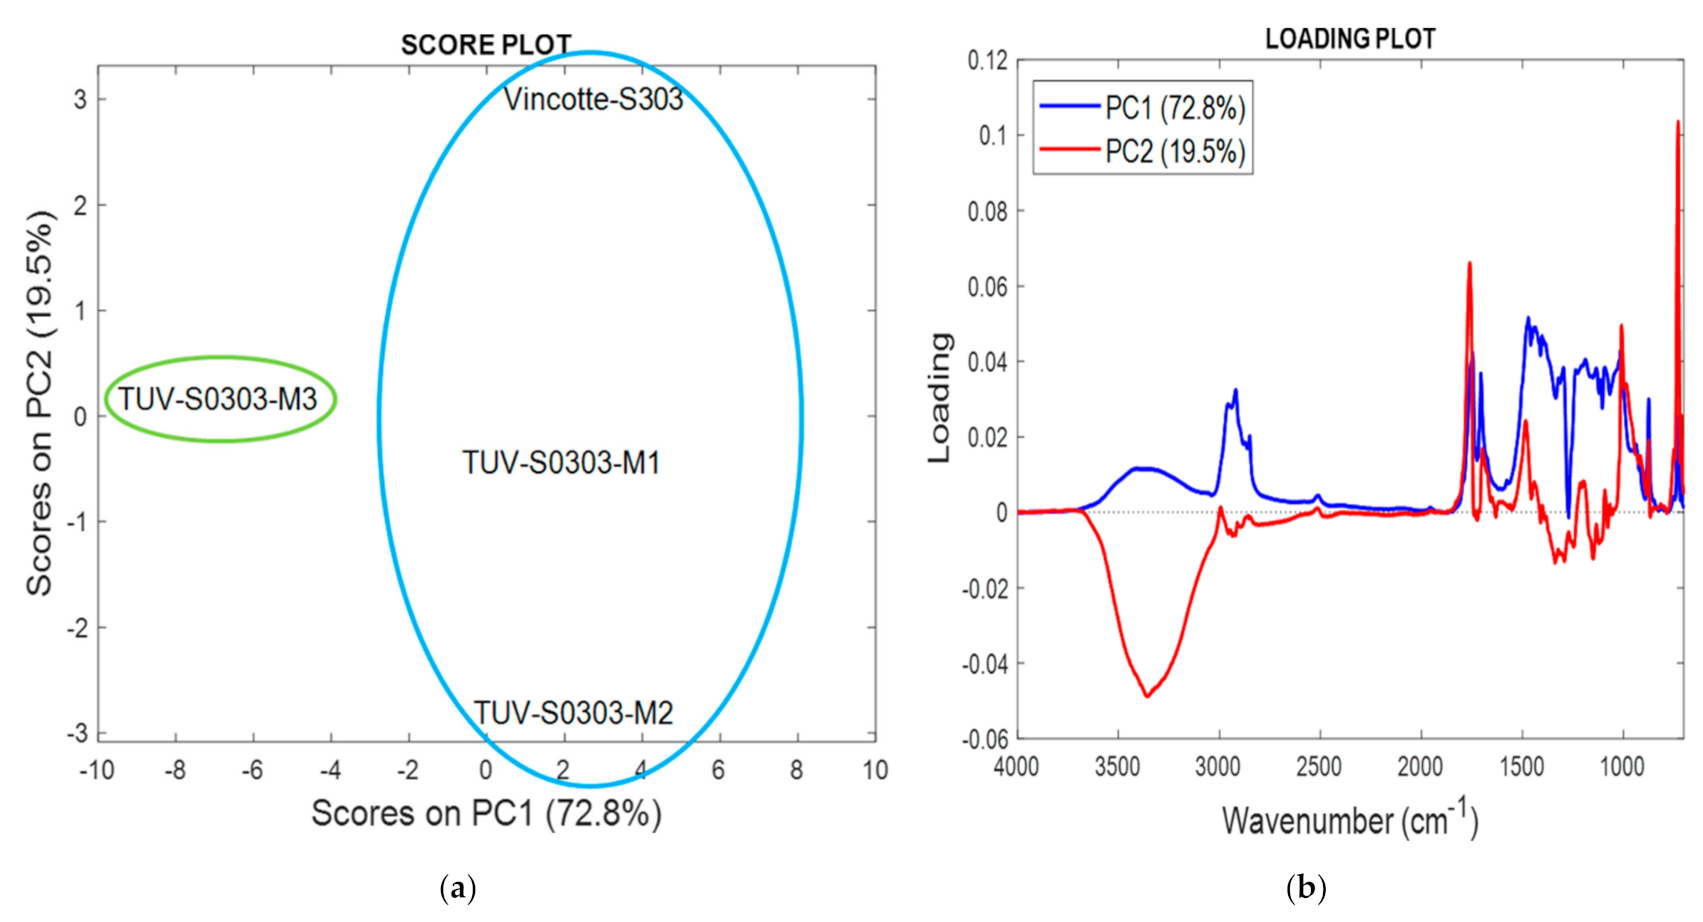
Figure 7 shows the PCA results obtained processing the small matrix collecting spectral data of M1, M2, M3, and of the MecPlast films, which received the TÜV Italy mark in 2017 (Vinçotte-303), and that was inserted as a reference for films approved by TÜV Italy.
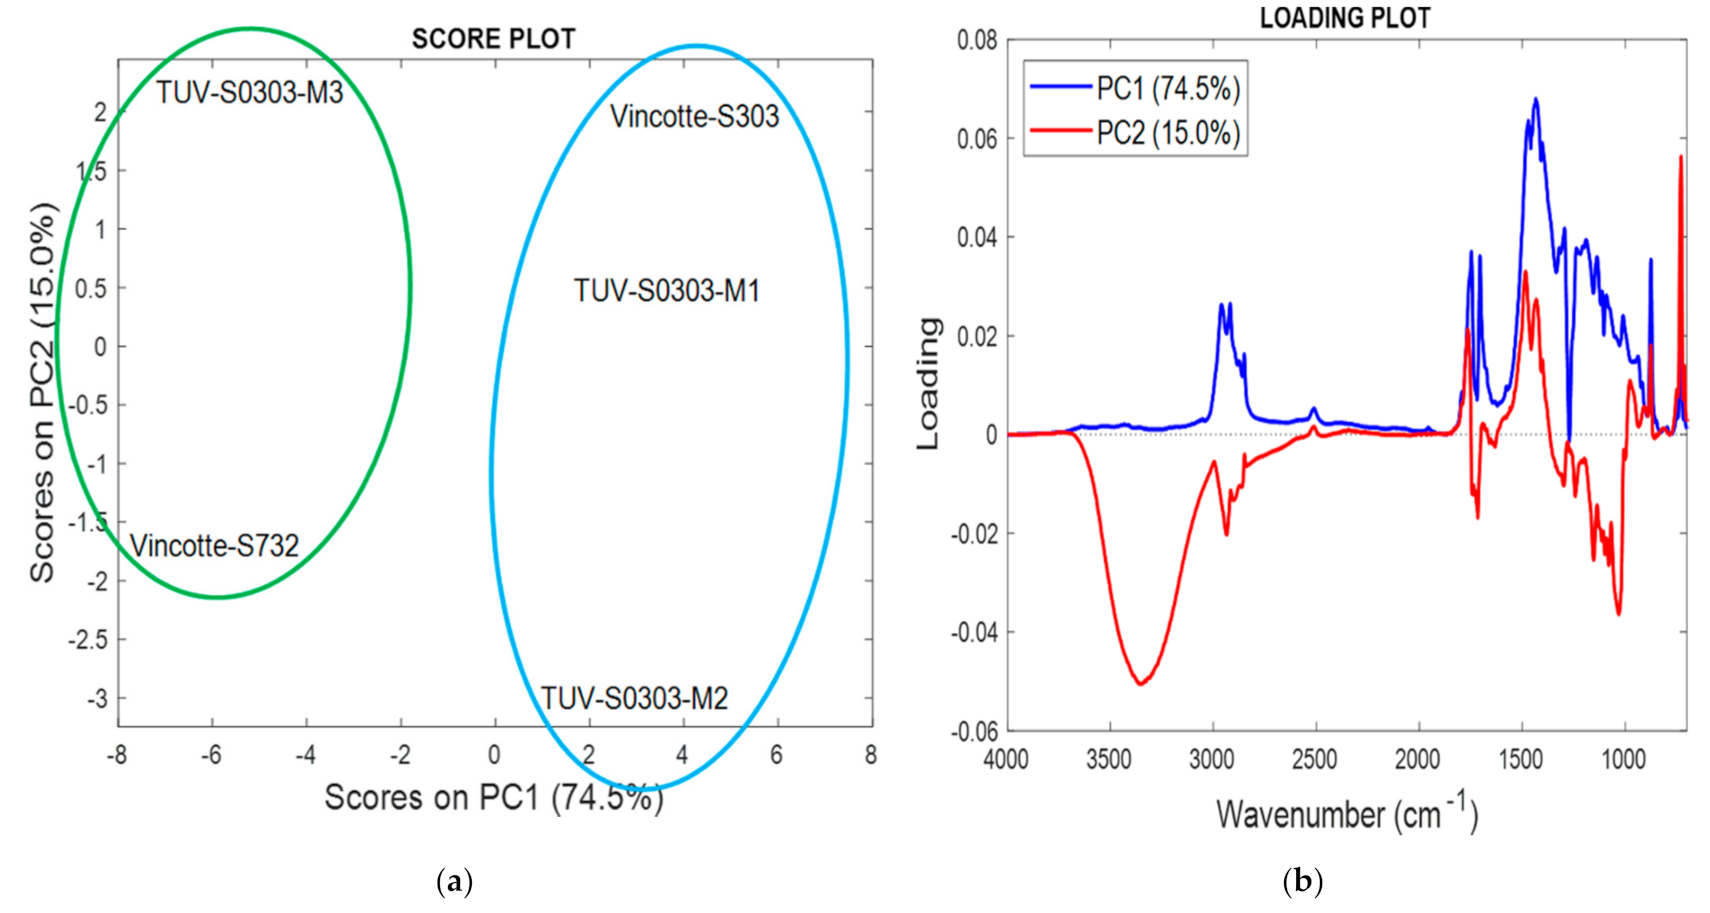
Figure 8 shows PCA results obtained handling the matrix gathering the FTIR data of M1, M2, M3, Vinçotte-303, and Vinçotte-S732, i.e., the film with PLA content ≥ 40% and thickness < 15 µm. It was included as a reference for films with the requirements to be classified as suitable for contact with bulk foods. The PCA were performed using R software, and the results were represented both as score plots (
Figure 7a and
Figure 8a) and loading plots (
Figure 7b and
Figure 8b). In both cases, all samples were well separated on PC1 in two clusters (
Figure 7a and
Figure 8a), thus highlighting a substantial difference between samples S303, M1, and M2, located in the right side of the score plot (circled in light blue), and M3, located in the left side of the score plot (circled in green). These results confirmed what was already visible in the PCA reported in
Figure 6a, where M1 and M3, although belonging to the compostable population separated on PC1, belonged to different populations separated on PC2. It is interesting to note that, concerning separation on PC2 in
Figure 6a, M2 was included in the same population of M3, but observing this group, a further separation of M2 from such group (on PC1) is observable, announcing some significant difference between M3 and M2, as confirmed by PCAs in
Figure 7a and
Figure 8a.
In the presence also of the Vinçotte-S732 spectral data, additional information on the samples was obtained (
Figure 8a). In particular, Vinçotte-S732 was separated from M1, M2, and S303 on PC1, and located in the left side of the score plot together with M3. It was found positioned very far from Vinçotte-S303, both on PC1 and PC2), thus establishing that, even if Vinçotte-S303 obtained the conformity mark in 2017, its PLA% content and probably thickness should be significantly different from the values of 40% and 15 µm certified for Vinçotte-S732. Concerning PLA% content, this finding was later confirmed as observable in
Table 5, and
Figure 9 and
Figure 10. As for MecPlast samples, M3, having a negative score (−6) as Vinçotte-S732, should have the more comparable physicochemical characteristics, while M1 and M2, having the same score as Vinçotte-S303, should have similar PLA% content and thickness. These finding were confirmed developing the PLRM as observable in
Table 5, and
Figure 9 and
Figure 10.
Interestingly, all the loading profiles on PC1 and PC2 (blue and red lines, respectively, in
Figure 6b,
Figure 7b, and
Figure 8b) consistently showed that the FTIR bands strongly involved in explaining the samples separation, included always the bands in the range 1800–1600 cm
−1 and those in the range 3000–2800 cm
−1, whose areas were used to build the PLRM, thus establishing its reliability. However, other bands appeared to affect the separation of samples, such as those in the range 1500–750 cm
−1 and 3500–3000 cm
−1, thus establishing that additional factors, other than PLA content, were substantial for detecting compostable samples.
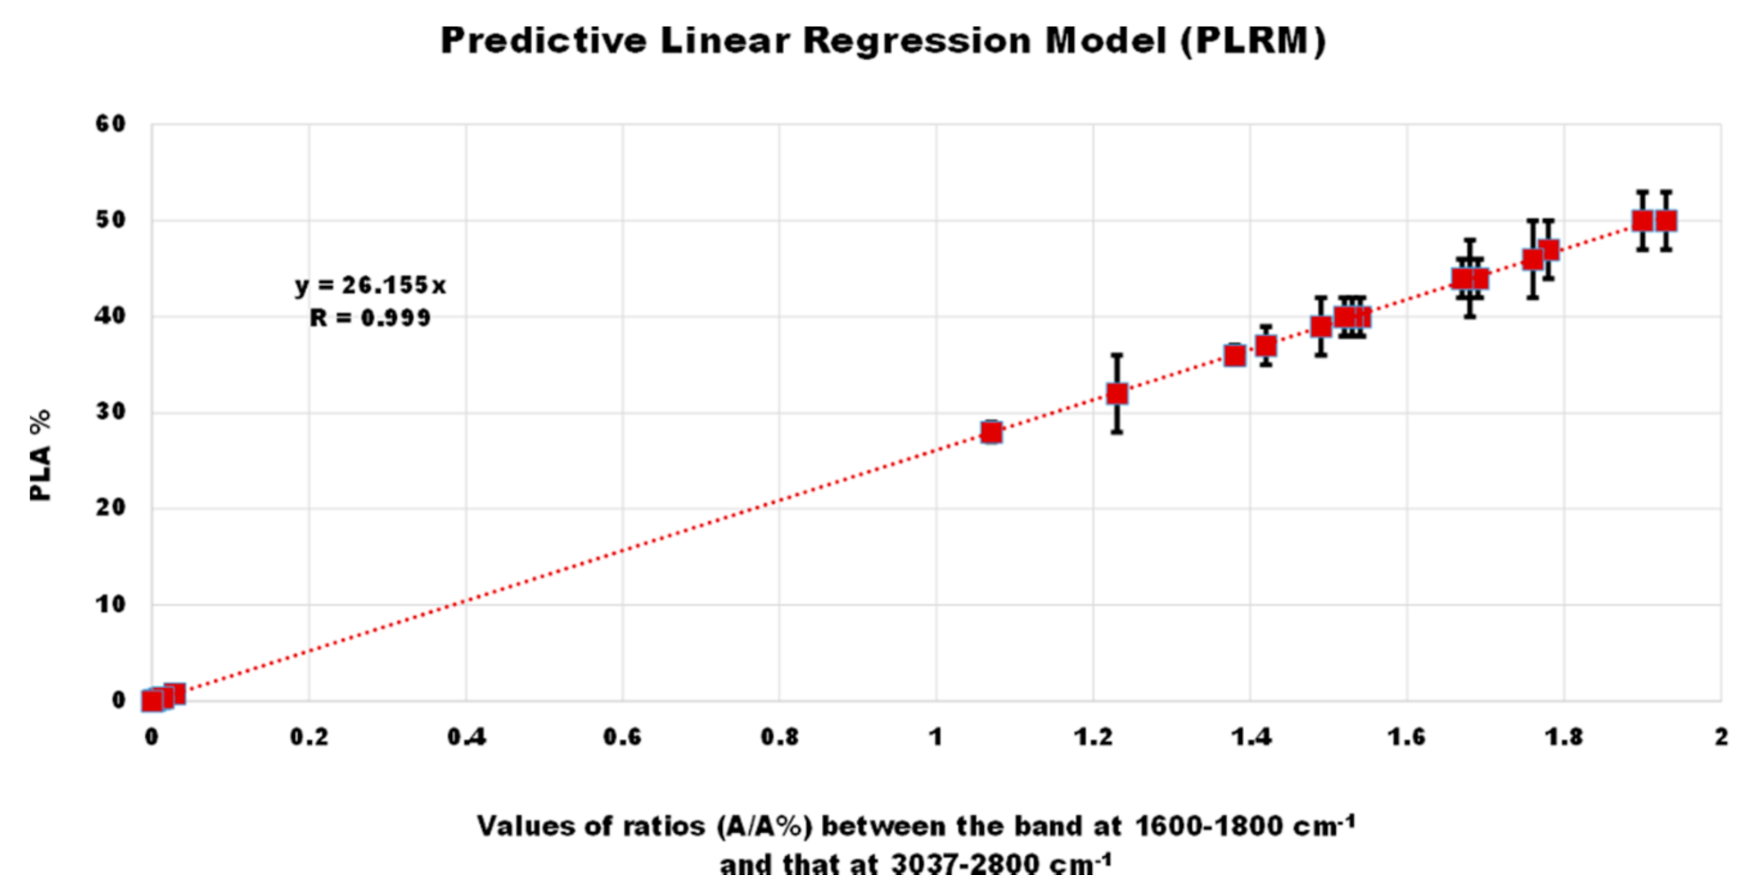
3.4. The Predictive Linear Regression Model (PLRM)
The scope of this part of our study was to build a linear regression model by least squares approach, using selected spectral data and the relative PLA concentrations computable as explained later, to predict information on PLA content of a sample. The model was built to provide MecPlast with a tool for estimating the minimum PLA content in a newly extruded film, prepared with the correct content of PLA, but that for any unforeseen events occurred during the production process, could not respect the expectation. The model was not created to highlight any fraud and identify non-compliant bags, which is the task of the bodies which grant the conformity mark. According to the FTIR spectrum of PLA (
Figure 3b), we decided to calculate the ratio between the areas of bands (A/A%) in the range 1800–1600 cm
−1 and 3037–2800 cm
−1. The measurements were made using FTIR spectra in the absorbance scale automatically, by using the Turbo chrome workstation (version 6.1.1.) equipment software. The band at 1800–1600 cm
−1 (C=O group of PLA) was considered indicative of PLA% content on the basis of the loading plots obtained by the PCAs, and therefore it was selected as significant spectral data, to construct the model. Moreover, in order to minimize the error related to the difference in the optical path of the sample pieces deposited between the KBr dishes, the values of the area ratios (A/A%) between the A% of the band in the range 1800–1600 cm
−1 and that of the bands in the range 3037–2800 cm
−1, also evidenced as significant bands by loading plots, were considered as more reliable spectral data. The relevance of these bands was confirmed by the loadings profiles obtained by the PCAs (
Figure 6b,
Figure 7b, and
Figure 8b). Taking as reference the Vinçotte-S732 sample, having a minimum declared content of PLA of 40% and an A/A% value of 1.52, the minimum PLA percentage content of all the film samples was calculated through the use of mathematic proportions. The data obtained were reported in
Table 5.
Curiously, the minimum PLA content of TUV-S0092(1) was the same of that of Vinçotte-1 (50%), which, since in PCA shown in
Figure 6a, was out of the group of TUV-S0092(1) and very closer to starch, should have a major content in renewable material. This apparent inconsistency derives from the fact, that not only the PLA content determined the separation of the samples in the PCAs, as already confirmed by the loading plots reported in
Figure 6b,
Figure 7b, and
Figure 8b. The PLA% content calculated for each sample was reported on a graph (y axis) as a function of A/A% values (x axis), obtaining the LPRM (R = 0.999), using Microsoft Excel software (
Figure 9). Its equation was Equation (1), and the very high values of the Pearson product-moment correlation coefficient (R = 0.999) and of the coefficient of determination (R
2 = 0.998) suggested a condition of linearity. Obviously, since the value taken as reference (PLA ≥ 40%) is only a declared and not verified value, the PLRM must be considered a self-validated model.
Equation (1) will allow us to estimate the minimum PLA% content in a freshly extruded film, simply by acquiring its FTIR spectrum and A/A% value, which represents the variable x of the model.
The model in
Figure 9 confirmed that, in addition to the irregular PE-based sample, four other samples also have an insignificant PLA content, even if they are present on the market as regular bags. Furthermore, it was found that in the population of films deemed compliant with the regulations on biodegradable and compostable films [
23], only some samples had the requirements to be used as primary packaging for bulk foods or to be supplied for hygienic purposes, while the others were eligible to be used as carrying bags, only.
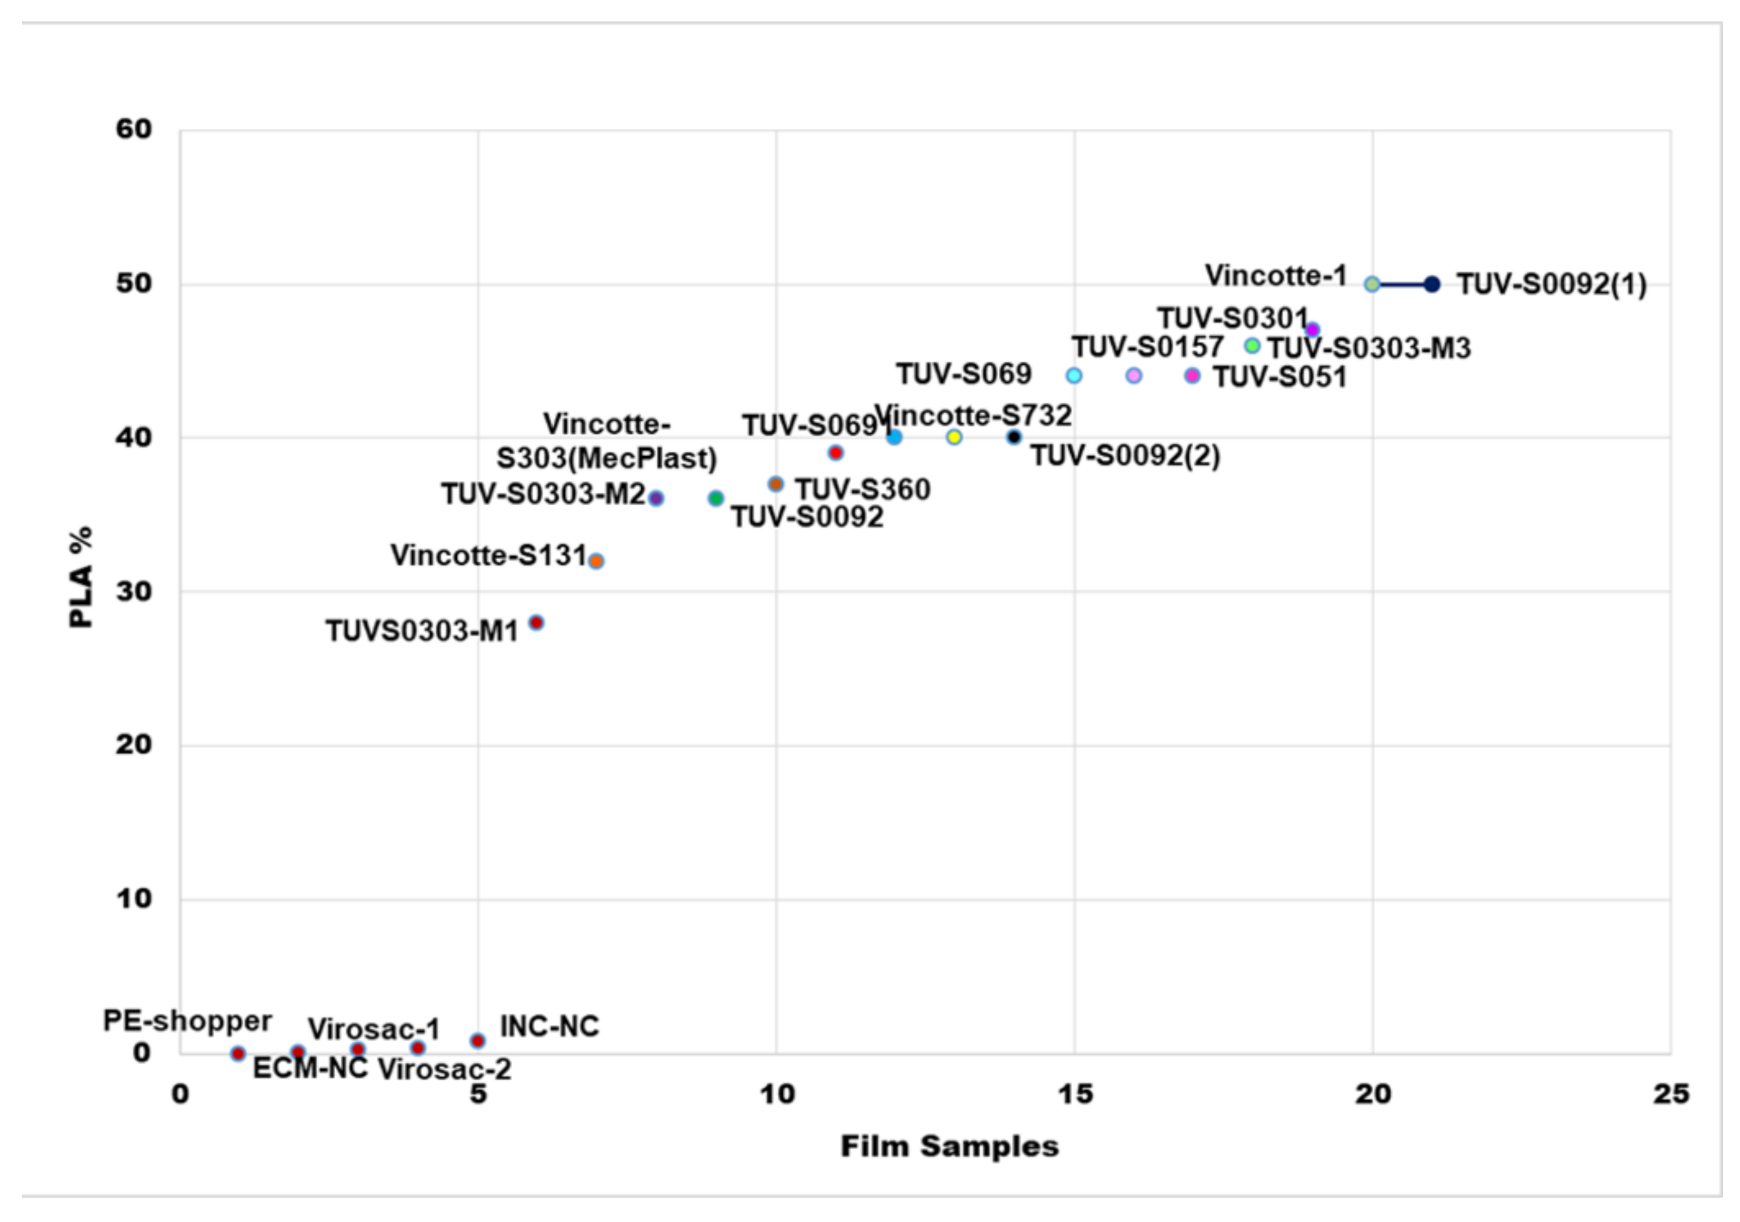
Figure 10 identifies the five plastic-based irregular films with minimum PLA% content of less than 1%, the six samples with a minimum PLA% content less than 40% (and therefore not usable for bulk foods), and the ten films with minimum of PLA% content ≥40% (therefore suitable for bulk food packaging or for hygienic purposes). As for the MecPlast samples, only M3 belonged to this last category (PLA% ≥ 46), while M1 and M2 were found to be compostable, but unsuitable for contact with bulk food. M1 was found to be the sample showing the lowest PLA content (≥28%).
3.5. Student t-Test
On the basis of the A/A% values provided by the FTIR analysis, additional Student
t-tests, were performed to verify, if the MecPlast films could be considered compliant with the compostability regulations and then, to assess which of M1, M2, and M3 could be considered usable for packaging bulk food or for hygienic purposes. Two reference populations of 13 and 9 samples were created based on the results from PCA (
Figure 6a), and on the PLA% content of the films (
Table 5), respectively. The first population was used in the
t-test executed to further evaluate the conformity of M1, M2, and M3, in terms of compostability and biodegradability, as well as their suitability for the TÜV Italy mark. The second population was used in the
t-test carried out for further classifying M1, M2, and M3 as suitable for bulk food packaging or for hygiene purposes, or as eligible for the transport of packaged food or goods, only on the basis of their minimum PLA content. Briefly, the confident intervals at 99% and their outer limits in terms of A/A% values were obtained by the
t-tests. Samples were considered to be significantly different from populations when their A/A% values were outside the limits assessed by the
t-tests. In this regard, the results obtained with this tests were more rigorous than those obtained by both the PCA and the linear model (
Table 6).
Accordingly, M1 was found to be completely irregular. M2 was deemed suitable for obtaining the TÜV Italy mark (but not for packaging bulk food or for hygienic purposes), while M3 was also found suitable.
4. Conclusions
This study has provided the Italian packaging industry MecPlast with reliable information on the compliance and classification of three films for shoppers recently extruded, thus ensuring manufacturers positive outcomes in a possible future verification by TÜV Italy. This goal was realized performing FTIR analysis, elaborated by a MVA technique known as PCA, developing a predictive self-validated linear regression model (PLRM), and finally executing two additional Student t-tests, for confirming or denying, due to more rigorous parameters, the previous results.
For clarity, the PLRM was developed to verify by a single FTIR spectrum measurement, if the minimum PLA% content present in a new finished product, confirms the PLA% loaded before the production process. Overall, the results of the PCA established that all the three new samples of shopping bags recently produced by the company MecPlast, were eligible to obtain the TÜV Italy mark for conformity. Information concerning a further classification of MecPlast films was achieved developing the PLRM. Observing the PLRM graph, it was evident that only the M3 film was approved for contact with bulk food and for hygienic purposes, while M1 and M2 films have only been approved for the transport of packaged foods or of other commercial items. The additional t-test performed considering the population of samples found regular by PCA, and the population of shopping bags with PLA% content ≥40% provided more rigorous results, confirming the conformity for the mark and the intended uses of M2 and M3, but establishing that M1 is significantly different from the population of certified bags.
With great disappointment, from all the investigations carried out in this study, it emerged that only in the limited area of Genoa considered, up to 4 sample films out of a population of 20 (20%) were found to have an insignificant % of PLA content. At all levels of the present investigation, they have been excluded from the compostable population, according to the requirements established by current Italian legislation, despite being marked with the TÜV Italia certification. Non-compliant bags, in fact, were found to belong to the population of non-degradable, irregular, and plastic-based films. This fact should represent a concern and pushes towards the search for solutions to a problem of considerable environmental importance, which, above all, companies in the sector are required to solve.


