Review

Dynamic Impedance Estimation: Challenges and Considerations

by
Mateus M. de Oliveira
1,
Renato R. Aleixo
1,
Denise F. Resende
1,
Leandro R. M. Silva
1,
Rafael S. Salles
2,
Carlos A. Duque
1,* and
Paulo F. Ribeiro
2
1
Electrical Engineering Department, Federal University of Juiz de Fora, 36036-900 Juiz de Fora, Brazil
2
Electrical Engineering Department, Federal University of Itajubá, 37500-903 Itajubá, Brazil
*
Author to whom correspondence should be addressed.
Appl. Sci. 2021, 11(2), 558; https://doi.org/10.3390/app11020558
Submission received: 28 October 2020 / Revised: 23 December 2020 / Accepted: 30 December 2020 / Published: 8 January 2021
(This article belongs to the Special Issue Power Quality in Electrical Power Systems)

Abstract

:
The objective of this paper was to examine the dynamic impedance estimation of electrical systems from online measurements. The paper makes several considerations and highlights the challenges to obtain a precise estimation. Transducer equalization and harmonic synchrophasor estimation (HSpE) are reviewed and discussed. The use of online and adaptive equalization for transducers proves to be a viable solution for improving voltage transducer’s (VT’s) and current transducer’s (CT’s) frequency response. Additionally, the use of oversampling algorithms can mitigate the effects of noise in the HSpE. Furthermore, methods for harmonic impedance estimation are discussed. The independent component analysis ICA-based dynamic impedance estimation is proposed and results presented, which yields excellent agreement. Finally, harmonic modeling and simulation of injected harmonic currents are used to observe resonances through the amplification and attenuations and, consequently, the opportunity to confirm the system self and transfer impedances of a test system. Dynamic impedance estimation will continue to be a great challenge for the power systems engineer as the system complexity increases with the massive insertion of power electronic inverters and the associated required filtering. Real-time signal processing will be an effective tool to determine the dynamic self or transfer impedance.

1. Introduction

Estimating the magnitude and phase of harmonics in electrical power systems (EPS) still presents significant challenges, mainly when we focus on medium voltage (MV) and high voltage (HV) systems and in dynamic scenarios. There are still limitations for these systems, given the complexity and costs of developing measurement equipment that meets the voltage levels and frequency range determined by standards [1,2]. As a consequence, the harmonic measurements performed in the secondary of the transformers do not faithfully represent the distortions present in the primary, thus limiting the analysis of harmonic propagation in MV and HV and their applications, such as: the identification and quantification of the harmonic sources responsibilities, the estimation of the electrical system parameters, the correlation of errors in the protection system with the power quality (PQ), among others.
Methods for correcting the frequency response for voltage and current transducers (VT and CT, respectively) are discussed in the literature. Most of them are based on frequency domain correction [2,3] and require laboratory tests to obtain the frequency response and correction. This procedure makes it impossible to equalize the VT and CT already installed. Additionally, as reported in [1], the transducer’s frequency response depends on temperature and load impedance, among other factors, which often makes the calibration process in the laboratory unsatisfactory.
In addition to the errors caused by VT and CT, errors are arising from the harmonic component estimation algorithms. The estimation of harmonics is generally performed using the discrete Fourier transform (DFT), specifically through its fast algorithm, the fast Fourier transform (FFT). It is known that the estimation of the harmonic phasor by FFT is strongly affected if there is variation in the nominal frequency of the system and the noise level present in the signal is high.
Although the systems are designed for operating at 60 Hz (50 Hz), the imbalance between the generated power and the consumed power causes small variations in the frequency. However, even if less than 1%, these small variations can produce very inaccurate results in high-order harmonics estimations [4]. To reduce the error due to frequency deviation, the most usual solution is the use of interpolators or resamplers that guarantee synchronous sampling, reducing errors due to spectral spreading [4].
Resampling (interpolation) methods work very well when the signal’s noise is low to the level of harmonics. However, when this does not occur, significant errors are introduced. A signal-to-noise ratio (SNR) of 40 dB (typical values in EPS range from 40–60 dB) degrades the interpolation efficiency producing total vector error (TVE) higher than 12% for high order harmonics.
It is important to note that resampling methods are extensively used to estimate the magnitude of harmonics. However, more recently, the harmonic phase’s estimation has aroused great interest from the scientific community and companies, having seen the new applications made possible thanks to GPS synchronization [5,6]. The synchronized estimation of the harmonics’ magnitude and phase can be named harmonic synchrophasor estimation (HSpE), as a direct extension of the concept of synchrophasor estimation. Consequently, the need for improving conventional algorithms to reduce the error in the phase estimation has been identified.
Methods to improve the estimation of harmonic components in noise are also available in the literature. Among them, the ESPRIT method stands out [7,8]. The ESPRIT is a parametric method and, therefore, needs to have a predetermined model order. Although it is a robust method, it has a high computational cost in relation to noise and does not need synchronous sampling, not being suitable for real-time implementation, especially in low-cost electronic systems. Thus, it is necessary to propose some strategies to reduce the noise’s influence in estimating harmonic components through low-cost computational algorithms [9,10].
In considering possible applications of the harmonic synchrophasor, it is worth to mention the harmonic responsibilities attribution and the harmonic network estimation. The first application aims to quantify the responsibility for harmonic distortion, at a given point in the system, by the various harmonic sources [11] and the second allows, for example, performing islanding detection in systems with distributed generation [12], protection system adjustment, and improvement of the system control and operation.
Estimating a network’s harmonic impedance based on online measurements is not an easy task. The methods that try to solve this problem are divided into passive and active methods. Passive methods seek to estimate the impedance from the current and voltage signals available on the measurement point without causing any disturbance in the network, although they can take advantage of any disturbances that affect the system. On the other hand, active methods cause some intentional disturbance in the network [13,14], and from the observation of current and voltage, they can estimate the impedance more accurately. Compared to the passive ones, the disadvantages of active methods are the possible deterioration in the PQ and external devices’ need to cause disturbances in the network.
The injection of small signals called Gaussian modulated signals (GMS), as suggested in [15], does not degrade the PQ and produces accurate impedance estimates. Besides, this injection can be implemented in the control loop of the distributed generators’ power converters. In this case, there is no need for external hardware to inject the GMS pulses. However, since most of the non-linear loads connected to the power system cannot inject the GMS to estimate the impedance, it is also important to investigate methods for estimating impedance by passive approaches.
In this way, estimation methods based on the independent component analysis (ICA) are highlighted [16,17,18]. These works partially solve the problem of estimating the impedance at the point of common coupling (PCC) on the load and utility sides. The challenge is to extend the methodology for estimating the harmonic transfers considering several harmonic sources contributing to a given point in the system.
Regardless of the method used to estimate harmonic impedance of the system, synchronized measurement is required, either of the harmonic phasor or the disturbance waveform (in the case of GMS injection), seeking to mitigate the effects of the fundamental frequency variation of the noise and the errors from instrumentation systems.
In this context, this work will discuss the challenges related to the dynamic impedance estimation and present some solution proposals. Figure 1 illustrates the three main points to be addressed in this work, which will be shown in Section 2, Section 3, and Section 4 of this paper. The conclusions of the work are then presented in Section 5.

2. Transducers Online Equalization

2.1. A. Transducer Equalization Review

With the increasing number of PQ monitors installed in the transmission networks, traditional instrument transformers are also being used for measuring the harmonic components [1,2,19,20]. However, it is well known that traditional measurement transformers, whether in distribution or transmission systems, present distortions in their frequency response, both in magnitude and in phase, which introduces measurement errors in the harmonic components.
The process of correcting the frequency response of measuring instruments, in this paper, will be called instrument equalization, using the terminology equivalent to the equalization of communication channels, whose purpose is exactly to correct the frequency distortions introduced by the communication channels.
Taking this into account, several methods for correcting these errors are further investigated. In [1], the authors investigate two possible approaches: the invasive and the non-invasive methods. The invasive method provides a more accurate correction; however, it requires disconnecting the instrument from the power grid and injecting test signals to obtain the frequency response, which is not always feasible. On the other hand, the non-invasive method is limited to harmonics already present in the investigated network that the instrument is connected to. Additionally, in the non-invasive method, it is necessary to temporarily connect a reference meter (typically a resistive divider) to equalize the already installed meters.
In [2], the authors present a laboratory calibration for three instrument transformers, one of which is used as a reference for measuring the frequency response. The work is based on a two-step procedure that uses isolated high voltage gas capacitors and a digital bridge, a digital current comparator. This procedure is adopted to explore the harmonics’ amplification due to the differentiation circuit to obtain accurate measurements of high order and low magnitude harmonics.
The CTs are covered in more detail in [19]. The authors use the frequency coupling matrix technique, widely used in studies of harmonic penetration in power systems. The experimental results use the compensation technique in commercial CTs up to 10 kHz. The CTs are then characterized, modeled, and tested in the laboratory. Thus, it is possible to analyze their non-linearity, the phase dependence between harmonics, and propose compensation that allows the CT to maintain its accuracy class for a wide frequency range.
A problem scarcely addressed in the literature is CT’s and VT’s online and adaptive equalization. Many works, such as those mentioned above, work with offline techniques. In [3], the authors present an online compensation method, although it is not adaptive. The compensation is performed in real-time, but it is based on the transducer model’s laboratory identification. Once the infinite impulse response (IIR) equalization filter has been identified, the reverse filter’s coefficients are incorporated into the measurement system and are not updated anymore. Thus, if any characteristic of the transducer changes, the equalization will not be significant.

2.2. Adaptive Transducers Equalization

Online equalization of transducers in an adaptive way is a viable strategy but not yet explored in the literature. A possible solution suggested in this work is illustrated in Figure 2.
In this methodology, a reference transducer Hp(z) is installed in substation p. This transducer has a frequency response close to the ideal for the frequency range of interest. For example, a resistive divider can be used as a reference transducer for the entire distribution network. A constant k can approximate the transfer function (TF) of this transducer.
The system transfer function between the p and q buses is considered known at this stage and is described in the z domain by Hp,q(z). However, the frequency response of the transducer Hq(z) is unknown. The objective is to introduce an adaptive equalizer, He(z), to equalize the measurement transformer connected to the bus q, as shown in Figure 2. This adaptive equalizer has as inputs the signal u[n], the signal d[n] (a scaled replica of the measured signal on bus p), and error e[n]. Note that as the bus p and q are geographically distant, the signal d[n] and u[n] must be synchronized by a Global Positioning System (GPS) system for the proper functioning of the adaptive algorithm. Additionally, d[n] must be sent to the transducer equalizer installed on the q bus, so the adaptive algorithms, such as the least mean squares (LMS) or recursive least squares (RLS) [21], can be used to identify the system equalizer. This procedure can be performed online throughout the day, ensuring adaptive equalization.

2.3. Illustrative Results

To illustrate the methodology’s feasibility, a 15-bar system [22] was simulated in Simulink/SimPowerSys. A resistive divider was fixed at bus 2, and inductive VT was connected at bus 10. Figure 3 shows the frequency response of the inductive VT. Note that the transducer has a resonance in the 2.711 kHz component. Thus, the upper harmonics will have their magnitude and phase significantly altered by the transducer.
Now, consider the voltage signal measured on the p-bus, where the reference transducer was connected, is described by:
v ( t ) = A c o s ( ω 0 t ) + 0.025 A c o s ( 5 ω 0 t ) + 0.025 A c o s ( 7 ω 0 t ) + 0.025 A c o s ( 27 ω 0 t ) + 0.025 A c o s ( 34 ω 0 t )
where A is the rated voltage and ω 0 is the fundamental frequency.
The transfer function between nodes p and q was previously estimated and introduced in the methodology presented in Figure 2. The samples of d[n] and u[n] were acquired to be used in equalization. The adaptive RLS algorithm shown in Algorithm 1 was used to estimate the parameters of the equalizer filter. After the coefficients’ convergence, the equalizer is applied, and the harmonic phasors are estimated using the FFT. The results obtained are then compared with those expected, as described in Equation (1).
Algorithm 1 The switching time instants to update the parameterization are integer multiples of a prefixed basic minimum constant sampling interval
1  Inputs:
2    x[n] the voltage (or current) at secondary of VT (or CT)
3    d(n) the voltage (or current) at secondary of the reference VT (or CT)
4    Hpq(z) the transfer function between bus p and q
5  Initialization:
6     P [ 0 ] = δ 1   I     , δ :   s m a l l   p o s i t i v e   c o n s t a n t
7     w ^ [ 0 ] = 0   , or initializes with prior knowledge
8    M order of the equalizer
9    N size for FFT
10  For n = 1 ,   2 ,   . Do:
11     u [ n ] = f i l t e r ( x [ n ] )
12     U [ n ] = [ u [ n ]   u [ n 1 ] u [ n M + 1 ] T
13     k [ n ] = λ 1   P [ n 1 ]   U [ n ] 1 + λ 1   U H [ n ]   P [ n 1 ]   U [ n ]
14     y [ n ] = w ^ [ n 1 ]   U [ n ]
15     [ n ] = d [ n ] y [ n ]
16     w ^ [ n ] = w ^ [ n 1 ] + k [ n ]   * [ n ]
17     P [ n ] = λ 1   P [ n ] λ 1   k [ n ]   U H [ n ]   P [ n ] n 1 )
18    No convergence obtained then go to 3.1
19  Convergence is obtained at n = n 0 :
20    Y= [ y [ n 0 ]   y [ n 0 + 1 ]   y [ n 0 + N 1 ]   ] T
21    Compute FFT(Y)
22    Go to 3.1
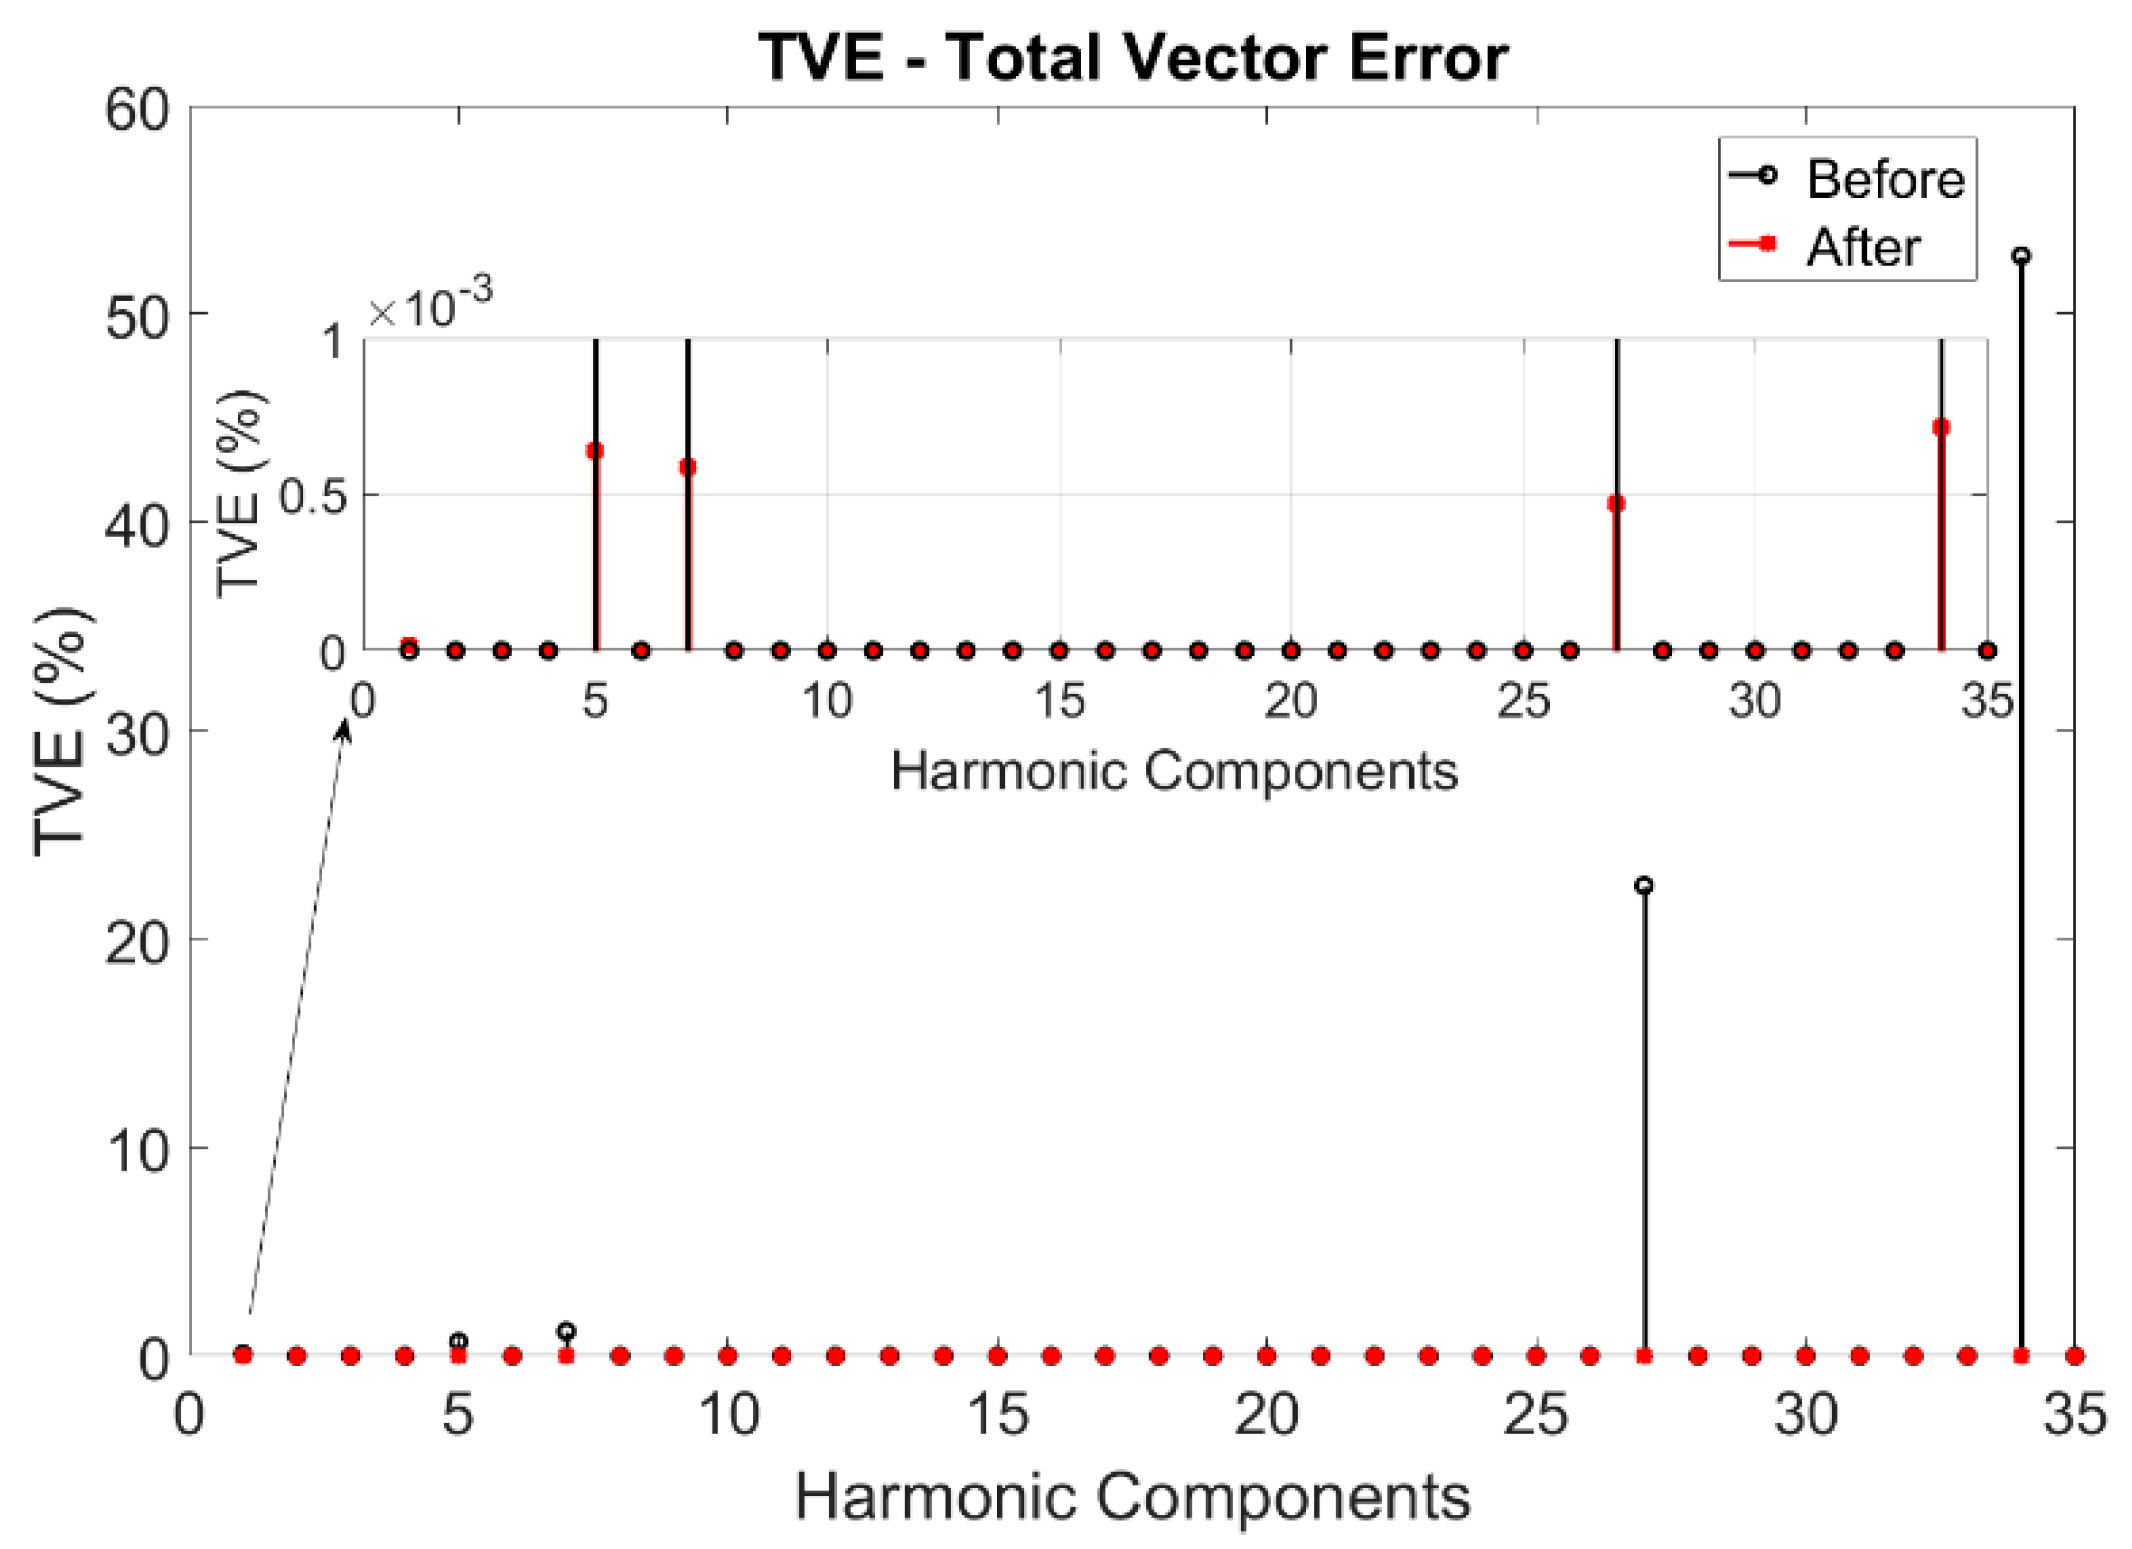
Figure 4 shows the TVE (total vector error) before and after equalization. The IEEE standard C37.118.2-2011 [23] specifies that the maximum TVE should be 1%. Before equalization, the TVE (%) for the transducer (black lines) had high values for interest harmonics. For example, harmonic 34 was close to 53%, as can be seen in the graphic. After the equalization (red lines), it is possible to observe a significant reduction in the TVE for all harmonics, which confirms the transducer frequency response’s improvement. In the zoom, it is possible to note that the errors after the equalization are lower than 0.001%.

2.4. Where to Go

With the advent of synchronized measurements in power systems, applications using the harmonic phasor tend to multiply. However, the CTs and VTs scattered throughout the system do not have an adequate frequency response for these applications. The replacement of these transducers with others with a better response is not economically viable. Thus, online and adaptive equalization seems to be a promising alternative.
The approach shown in this section served only to open the range of issues to be investigated in the coming years, among which are:
  • What is the influence of the estimation error of the transfer function of the Hp,q(z) system on the design of the equalizer? This point is essential, as it is known that the transfer function obtained from design data can present significant variations from the real system. The ideal would be to estimate these transfer functions by online procedure, but this falls into the process of recursive error (tail-chasing);
  • On which bus, or buses, of the system should the reference meters be installed? This question seems similar to another one already addressed in the literature, which concerns the points of the network for PQ meters allocation;
  • In telecommunications systems, it is common to use the blind equalization strategy [23]. The question is whether it is possible to use the same strategy for equalizing transducers.

3. Harmonic Synchrophasor Estimation

3.1. Review Harmonic Synchrophasor Estimation

Estimating the harmonic phasor synchronized by satellite started in the 1990s, with a CHART (continuous harmonic analysis in real-time) [24]. However, it was only after the consolidation of the fundamental phasor estimation techniques, with the phasor measurement unit (PMU), that research for estimating the synchronized harmonic phasors had a new impulse. The harmonic synchrophasor estimation (HSpE) involves techniques and algorithms to simultaneously estimate and synchronize the harmonics’ magnitude and phase.
The works [25,26,27,28,29,30,31,32,33,34,35] show some of the most recent research on this topic. Signal processing techniques can use variations of the Fourier transform [25], as well as more advanced techniques, such as Kalman filter (KF) [26], Taylor transform (TT) [27,28,29], wavelet transform (WT) [30], and the interpolated DFT [31,32,33,34].
In the method described in [28], the authors propose using FFT with the Hanning window to estimate the harmonic phasors. In the frequency domain, a correction is applied based on the system’s instantaneous frequency to improve the estimated phasors’ accuracy. Performance is tested up to the 9th order harmonic component only, in a limited test scenario without quantifying frequency deviations and without the presence of noise.
In [26], a contribution is presented, using KF for the individual estimation of each frequency component. The use of the TT has also been proposed for the task of estimating harmonic phasors [27,28,29], named Taylor weighted least squares (TWLS). Signal contamination by noise in these studies is considered, with cases with a SNR of 60 dB. However, the algorithms have a high computational cost, making their application in low-cost devices difficult.
In [30], the WT is used as an alternative to HSpE for the power system at the distribution level. The method first proposes applying an algorithm known as sample value adjustment (SVA) [31]. After this step, the FFT of the signal is applied, thus identifying the main frequency components. Next, wavelet filters are designed centered on the frequencies with significant energy. The SVA algorithm has the function of adjusting the signal samples, providing synchronous sampling in the FFT window to reduce spectral leakage.
Considering a phasor estimation in scenarios with significant noise contamination, more robust techniques such as ESPRIT [32] and TWLS present better results. However, they are parametric techniques and present high computational cost, being useful only for offline analysis. Besides, choosing the model order is always a challenge for parametric techniques.
In [33,34], it is proposed the use of interpolated DFT in the frequency domain (ipDFT). However, its performance lacks when it is desired to estimate low amplitude components in noise (individual harmonic content lower than 5%). In [35], ipDFT is compared with the improved SVA (MSVA). The phasor estimation results for both methods show that the interpolation in the frequency domain presents worse results concerning the time domain’s interpolation strategy.
Time domain’s interpolation strategy, also named resampling algorithm, seems to be one of the best candidates for HSpE because of the balance between the estimation performance and the computational effort. Figure 5 illustrates the basic idea behind this approach. Note that the algorithm is based on DFT and, consequently, suffers the spectrum leakage problem that can be reduced by the resampling algorithm. That is the key point for a successful harmonic phasor estimation: to choose a good resampling algorithm.
Different algorithms have been reported in the literature for this purpose, among then the SVA and their variations [31,35], Lagrange, and B-Spline algorithms [4]. For example, the MSVA algorithm generates the interpolated samples using the following difference equation [5],
x [ n ] = D 0 x 0 [ n ] + D 1 x 0 [ n 1 ] + D 2 x 0 [ n 2 ] + D + 1 x 0 [ n + 1 ] + D + 2 x 0 [ n + 2 ]
where x[n] is the interpolated sample, x 0 [ n ] is the crude sample, and D i ,   i = 2 , 1 , , 2 are time-varying coefficients given by,
[ D 0 D 1 D 2 D + 1 D + 2 ] = [ 1 0 3 / 4 0 0 2 / 3 1 / 3 1 / 6 0 1 / 12 1 / 24 1 / 12 0 2 / 3 1 / 3 1 / 6 0 1 / 12 1 / 24 1 / 12 ] [ 1 α α 2 α 3 ]
The time-varying coefficients are a function of α that is a function of the actual frequency f (which varies with time) and the time instant n. This parameter is given by,
α = n ( f f 0 f )
Despite the good performance of time-domain interpolation shown in the literature, the noise interference in the resampling algorithm’s quality has been almost neglected. However, there is a degradation of the estimation under adverse conditions from the analyzed methodologies, especially when the SNR is less than 60 dB. In transmission networks, SNRs greater than 50 dB are common, but 45 dB values can be observed in distribution networks. Noise interference seems to be one of the limiting factors in estimating high-order harmonic phasors.
A strategy to mitigate the effect of noise in the resampling process is using the oversampling technique [36]. Figure 6 illustrates this technique. In this case, the signal in continuous time is sampled with L times greater than the necessary. After sampling, an average moving filter (MAF) reduces the noise level, and the signal is then decimated to the required sampling frequency. It is noteworthy that some analog-to-digital converters (ADC) have this methodology as an internal function, which relieves the processor.

3.2. Illustrative Results

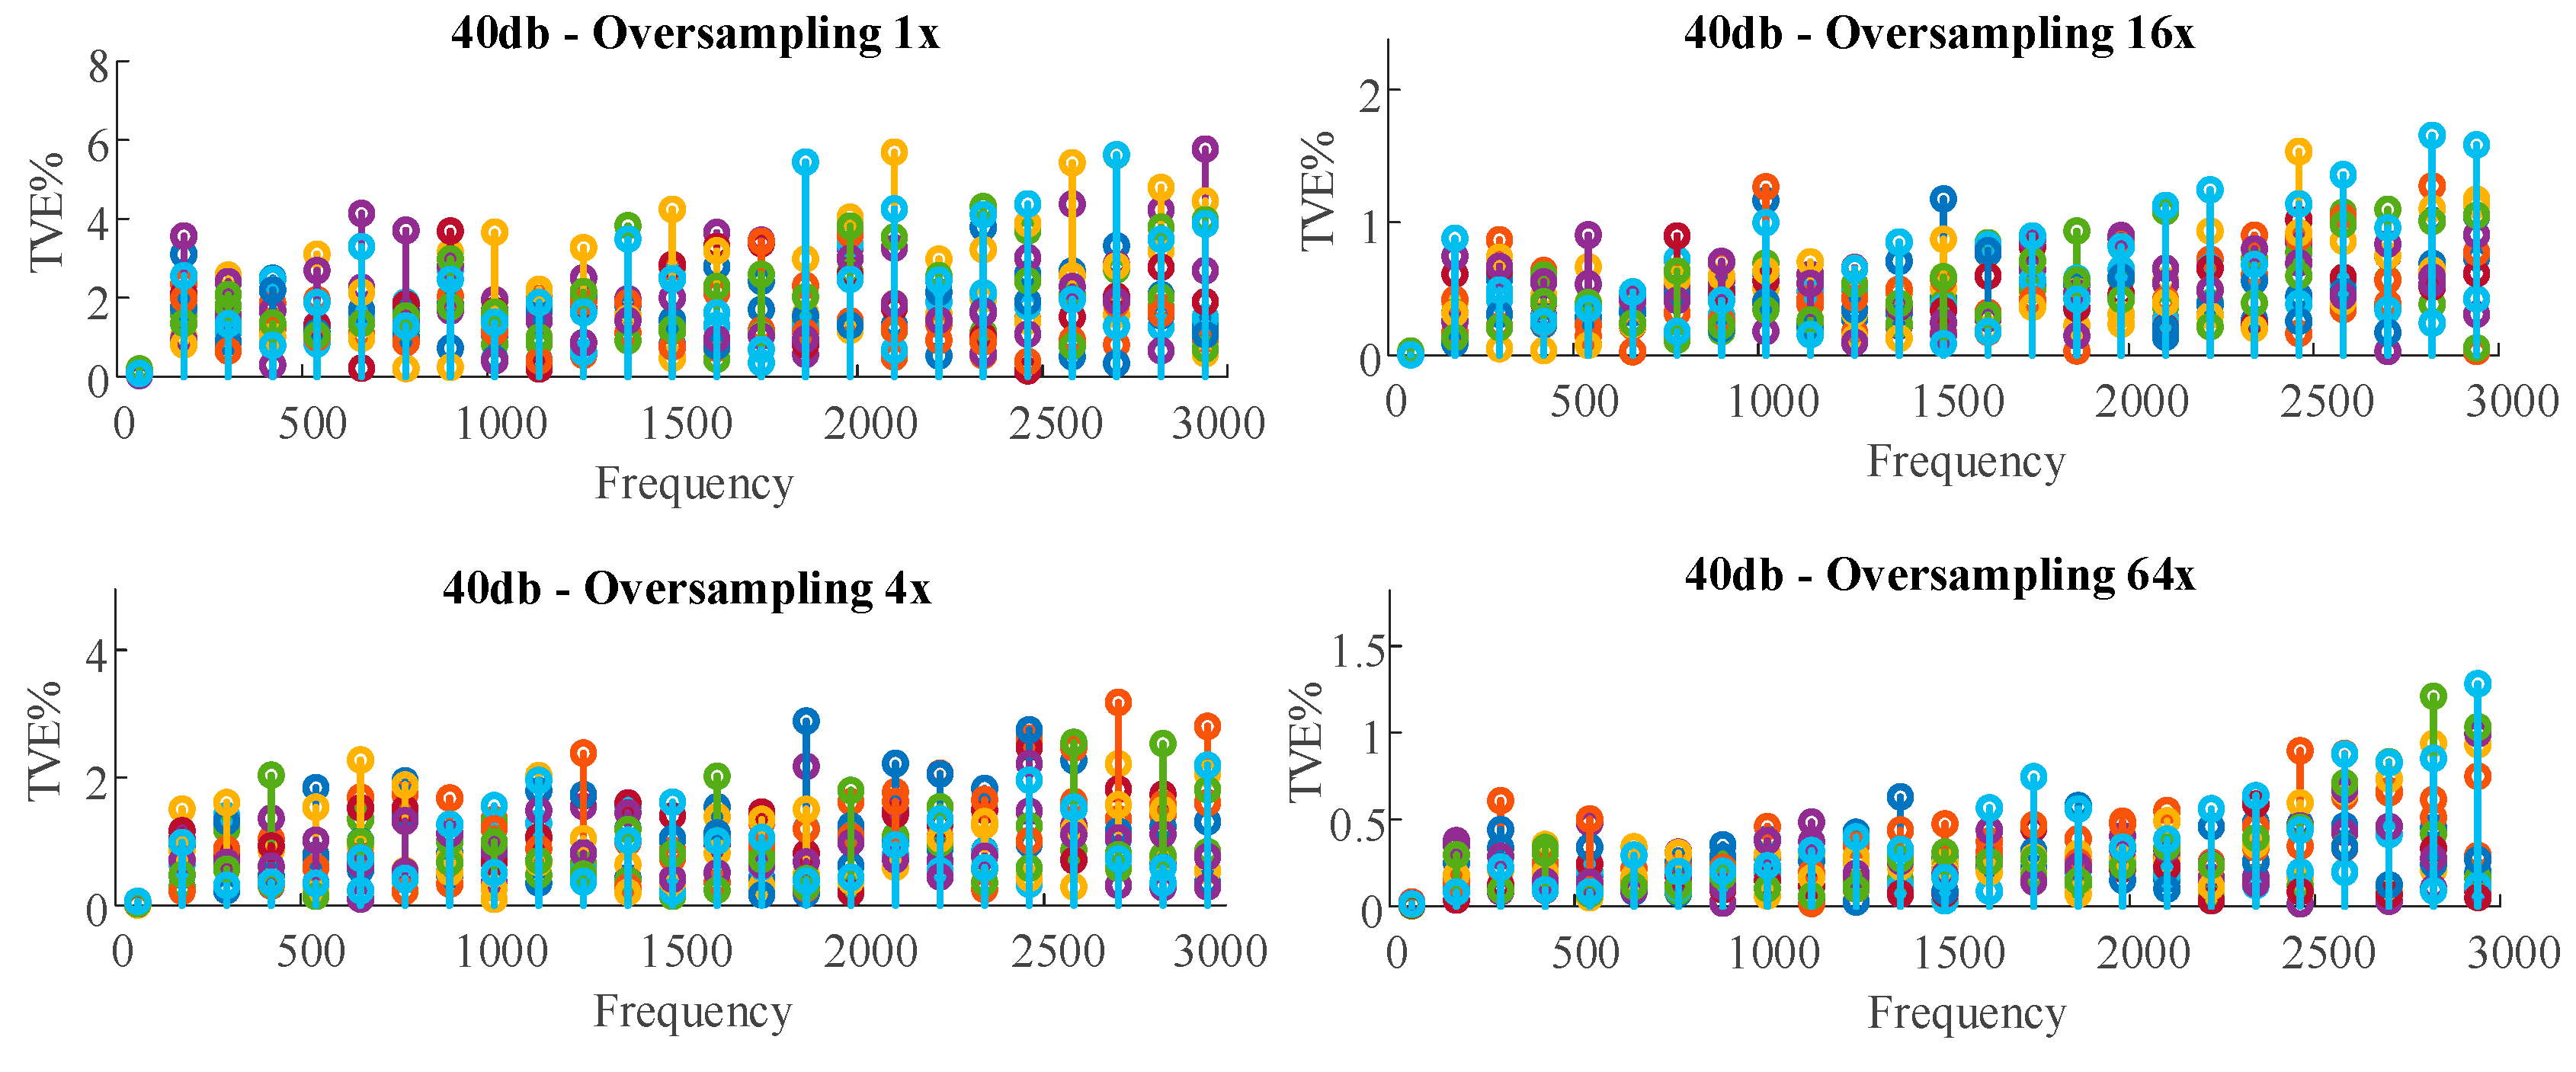
Figure 7 shows the performance of the FFT with a 1 cycle window and sampling frequency of 15,360 kHz for HSpE, considering a signal contaminated by SNR of 40 dB and harmonics, from the 3rd to the 49th components with an amplitude of 5% related to the fundamental component and variations at the system frequency of 57 to 63 Hz. The TVE graph is shown for each harmonic for oversampling values L = 1 (no-oversampling), L = 4, L = 16, and L = 64. Each of the circles shows different off-nominal frequencies. To estimate the harmonics, a 3rd order Lagrange interpolator [37] was used, followed by the FFT. Note that the TVE error is around 6% for L = 1, reducing to 1.5% when L = 64. It shows that noise reduction is an important pre-processing in the harmonic phasor estimation process.
Figure 8 presents the comparison among three time-domain resampling techniques: MSVA, Lagrange (“Lagran” in the plot), and B-Spline (“Bspline” in the plot). The SNR was considered 60 dB, and 6000 cases were generated for each off-nominal frequency varying from 55 to 66 Hz (1 Hz of step-changing). Additionally, the phase was sorted from 0 to 2 π , using a uniform distribution, and the magnitude of all harmonic, up to the 50th harmonic, was kept constant and equal to 5% off the fundamental component. Then the average and the maximum TVE were obtained.
As shown in Figure 8, the B-spline interpolation algorithm presented the best results, followed by the MSVA. The maximum TVE was lower than 2% for the B-Spline algorithm and reached more than 3% for the two other algorithms. Only the B-Spline algorithm complied with the PMU standard for the fundamental frequency. Although there is no standard for the maximum TVE error for the harmonic phasor estimation, the results show a challenge to move the error to below than 1% for all harmonic components.

3.3. Where to Go

In order to obtain reliable harmonic phasor estimations, it is necessary to advance the research on the following points:
  • Develop resampling algorithms to ensure synchronous sampling that is robust to additive noise or to evaluate noise reduction techniques in pre-processing;
  • Investigate the effect of the delay of the frequency estimation on the interpolation performance over time. Since the frequency value used in the resampling process is always delayed about the current frequency value;
  • Define standards for HSpE, such as the TVE error allowed, the dynamic test conditions, the report’s rate, etc.

4. Dynamic Impedance Estimation

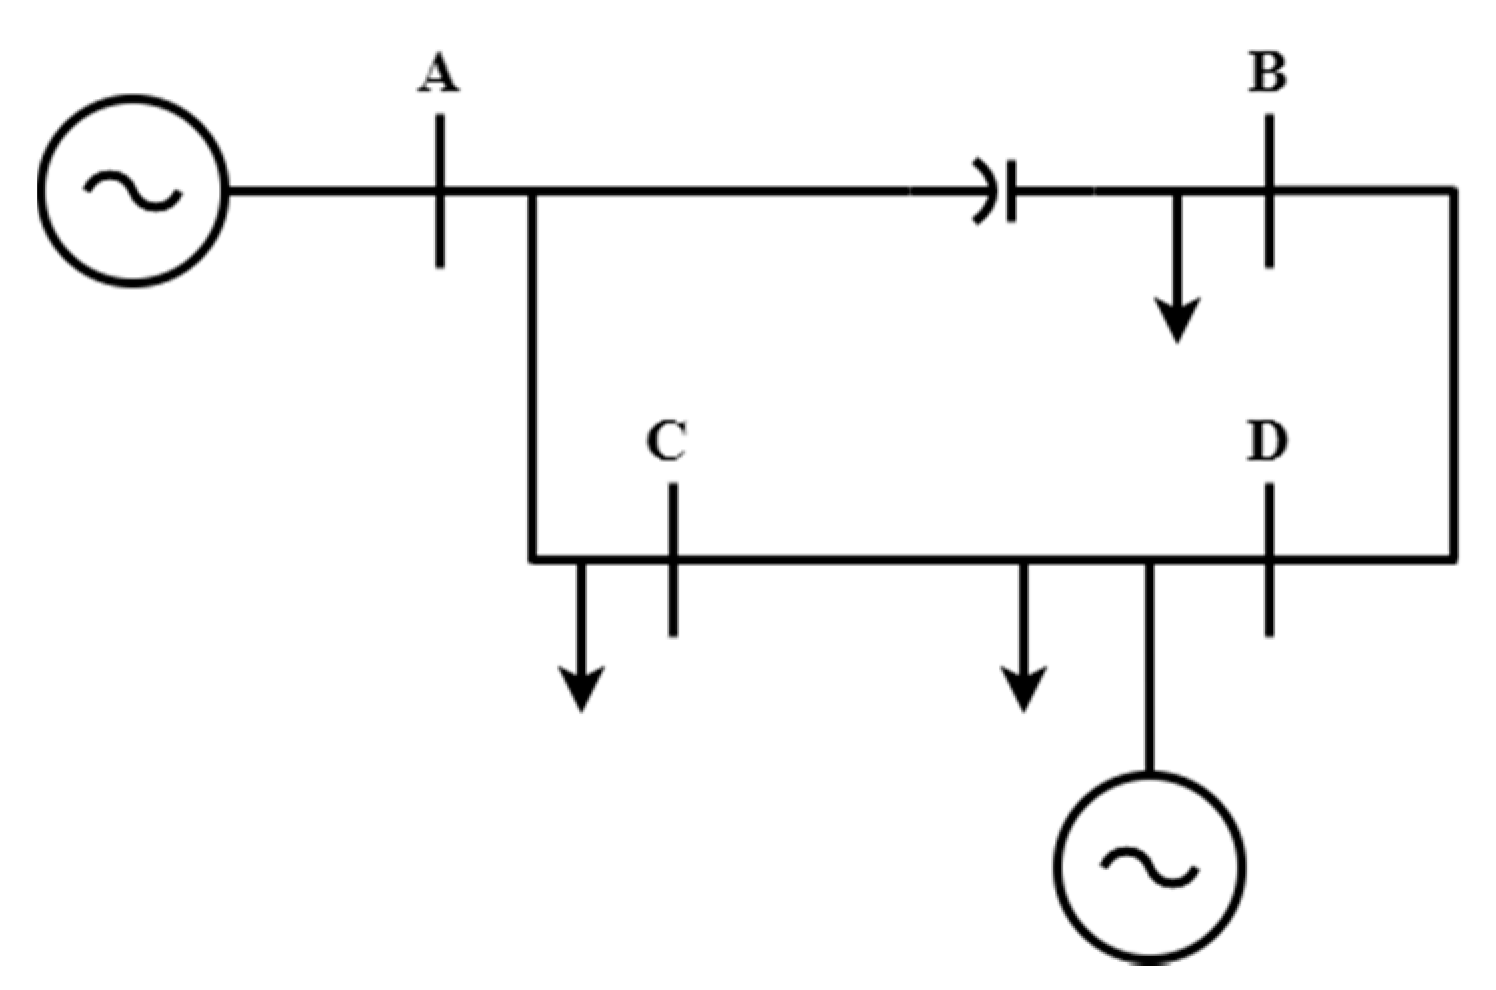
The online estimation of the network impedance is a fundamental step in the study of harmonic propagation, attribution of harmonic responsibility, identification of losses in the network, among others [17,38,39,40,41,42,43,44,45,46]. In recent years, research has focused on estimating impedance at the PCC, both on the load side and the source side [38,39]. However, more information would be obtained if, instead of knowing the PCC’s impedances, it was possible to find the system transfer functions. For example, Figure 9 shows a small section of a real transmission system, with harmonic sources in buses A and C. Knowing the transfer from A to D and from C to D, it would be possible to understand the harmonic propagation in the network, as well as to establish the responsibilities of each source.
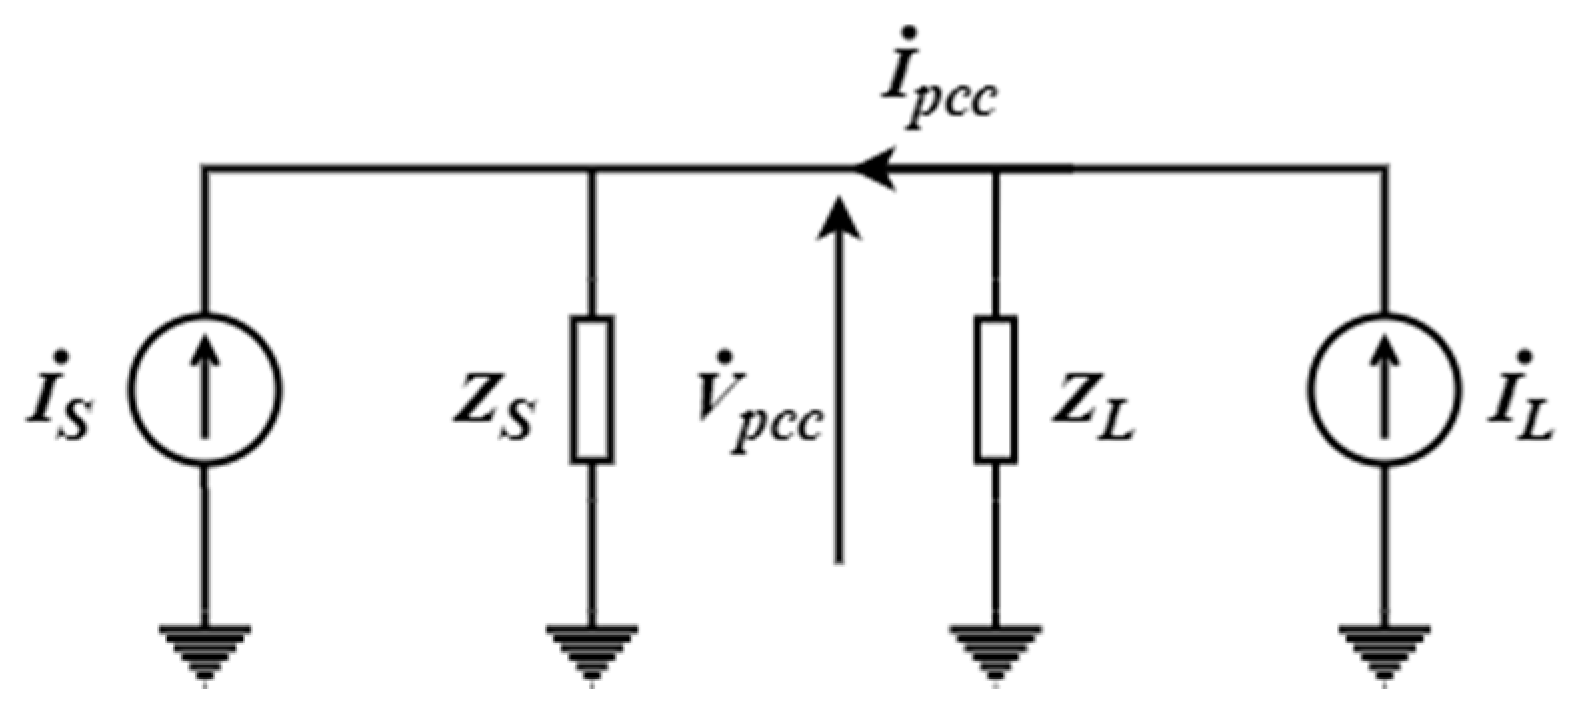
While in the Norton model in Figure 10, there is no need for satellite synchronization of measurements, since all measurements are taken from the same geographical point, the transfer functions’ estimates will require synchronized measurements.

4.1. Impedance Estimation at PCC

The impedances in the Norton model of Figure 10 may be estimated using ICA [11,17,18,41]. The main reason for focusing on this technique is that it is a promising technique to be extended to the more general estimation of the transfer function.
The ICA’s basic concept for impedance estimation in electrical systems consists of measurements made in the electrical system, identifying the individual harmonic sources, and the mixing matrix, which approximates the network’s harmonic transfer matrix. Equation (5) represents the generic form of ICA. In this equation, x is the measurement vector composed by currents and voltages at various points in the network, s   is the vector of the harmonic sources present in the system, but generally unknown, and A is the mixing matrix.
x = A s
To estimate impedances seen from the PCC, the measurement vector is composed of the current and voltage at PCC, taken a long time. The ICA technique then explores these signals’ statistical nature to determine both the individual sources and the mixing matrix. Then the ICA identifies the inverse matrix of A , called decoupling matrix, as described in [11]
s ^ = H x
where, s ^ = [ I ^ s I ^ L ] T is the vector of the estimated sources.
As known from the literature, the ICA has scale indetermination, i.e., the sources are estimated with a scale factor,
[ I ^ s I ^ L ] = [ k 1 I ˙ s k 2 I ˙ L ]
Taking (7) in (6) results,
[ I ^ s I ^ L ] = [ h 11 k 1 h 12 k 1 h 21 k 2 h 22 k 2 ] [ V ˙ P C C I ˙ P C C ]
To overcome the scaling indetermination given in (8), consider the equation of the Norton equivalent circuit shown in Figure 10,
[ V ˙ P C C I ˙ P C C ] = 1 Z s + Z L [ Z s Z L Z s Z L Z s Z L ] [ I ˙ S I ˙ L ]
Taking the inverse of (9) and comparing with (8), one arrives at the final Norton impedance estimation, without scale indetermination:
Z s = h 12 h 11
Z s = h 22 h 21

4.2. Illustrative Results

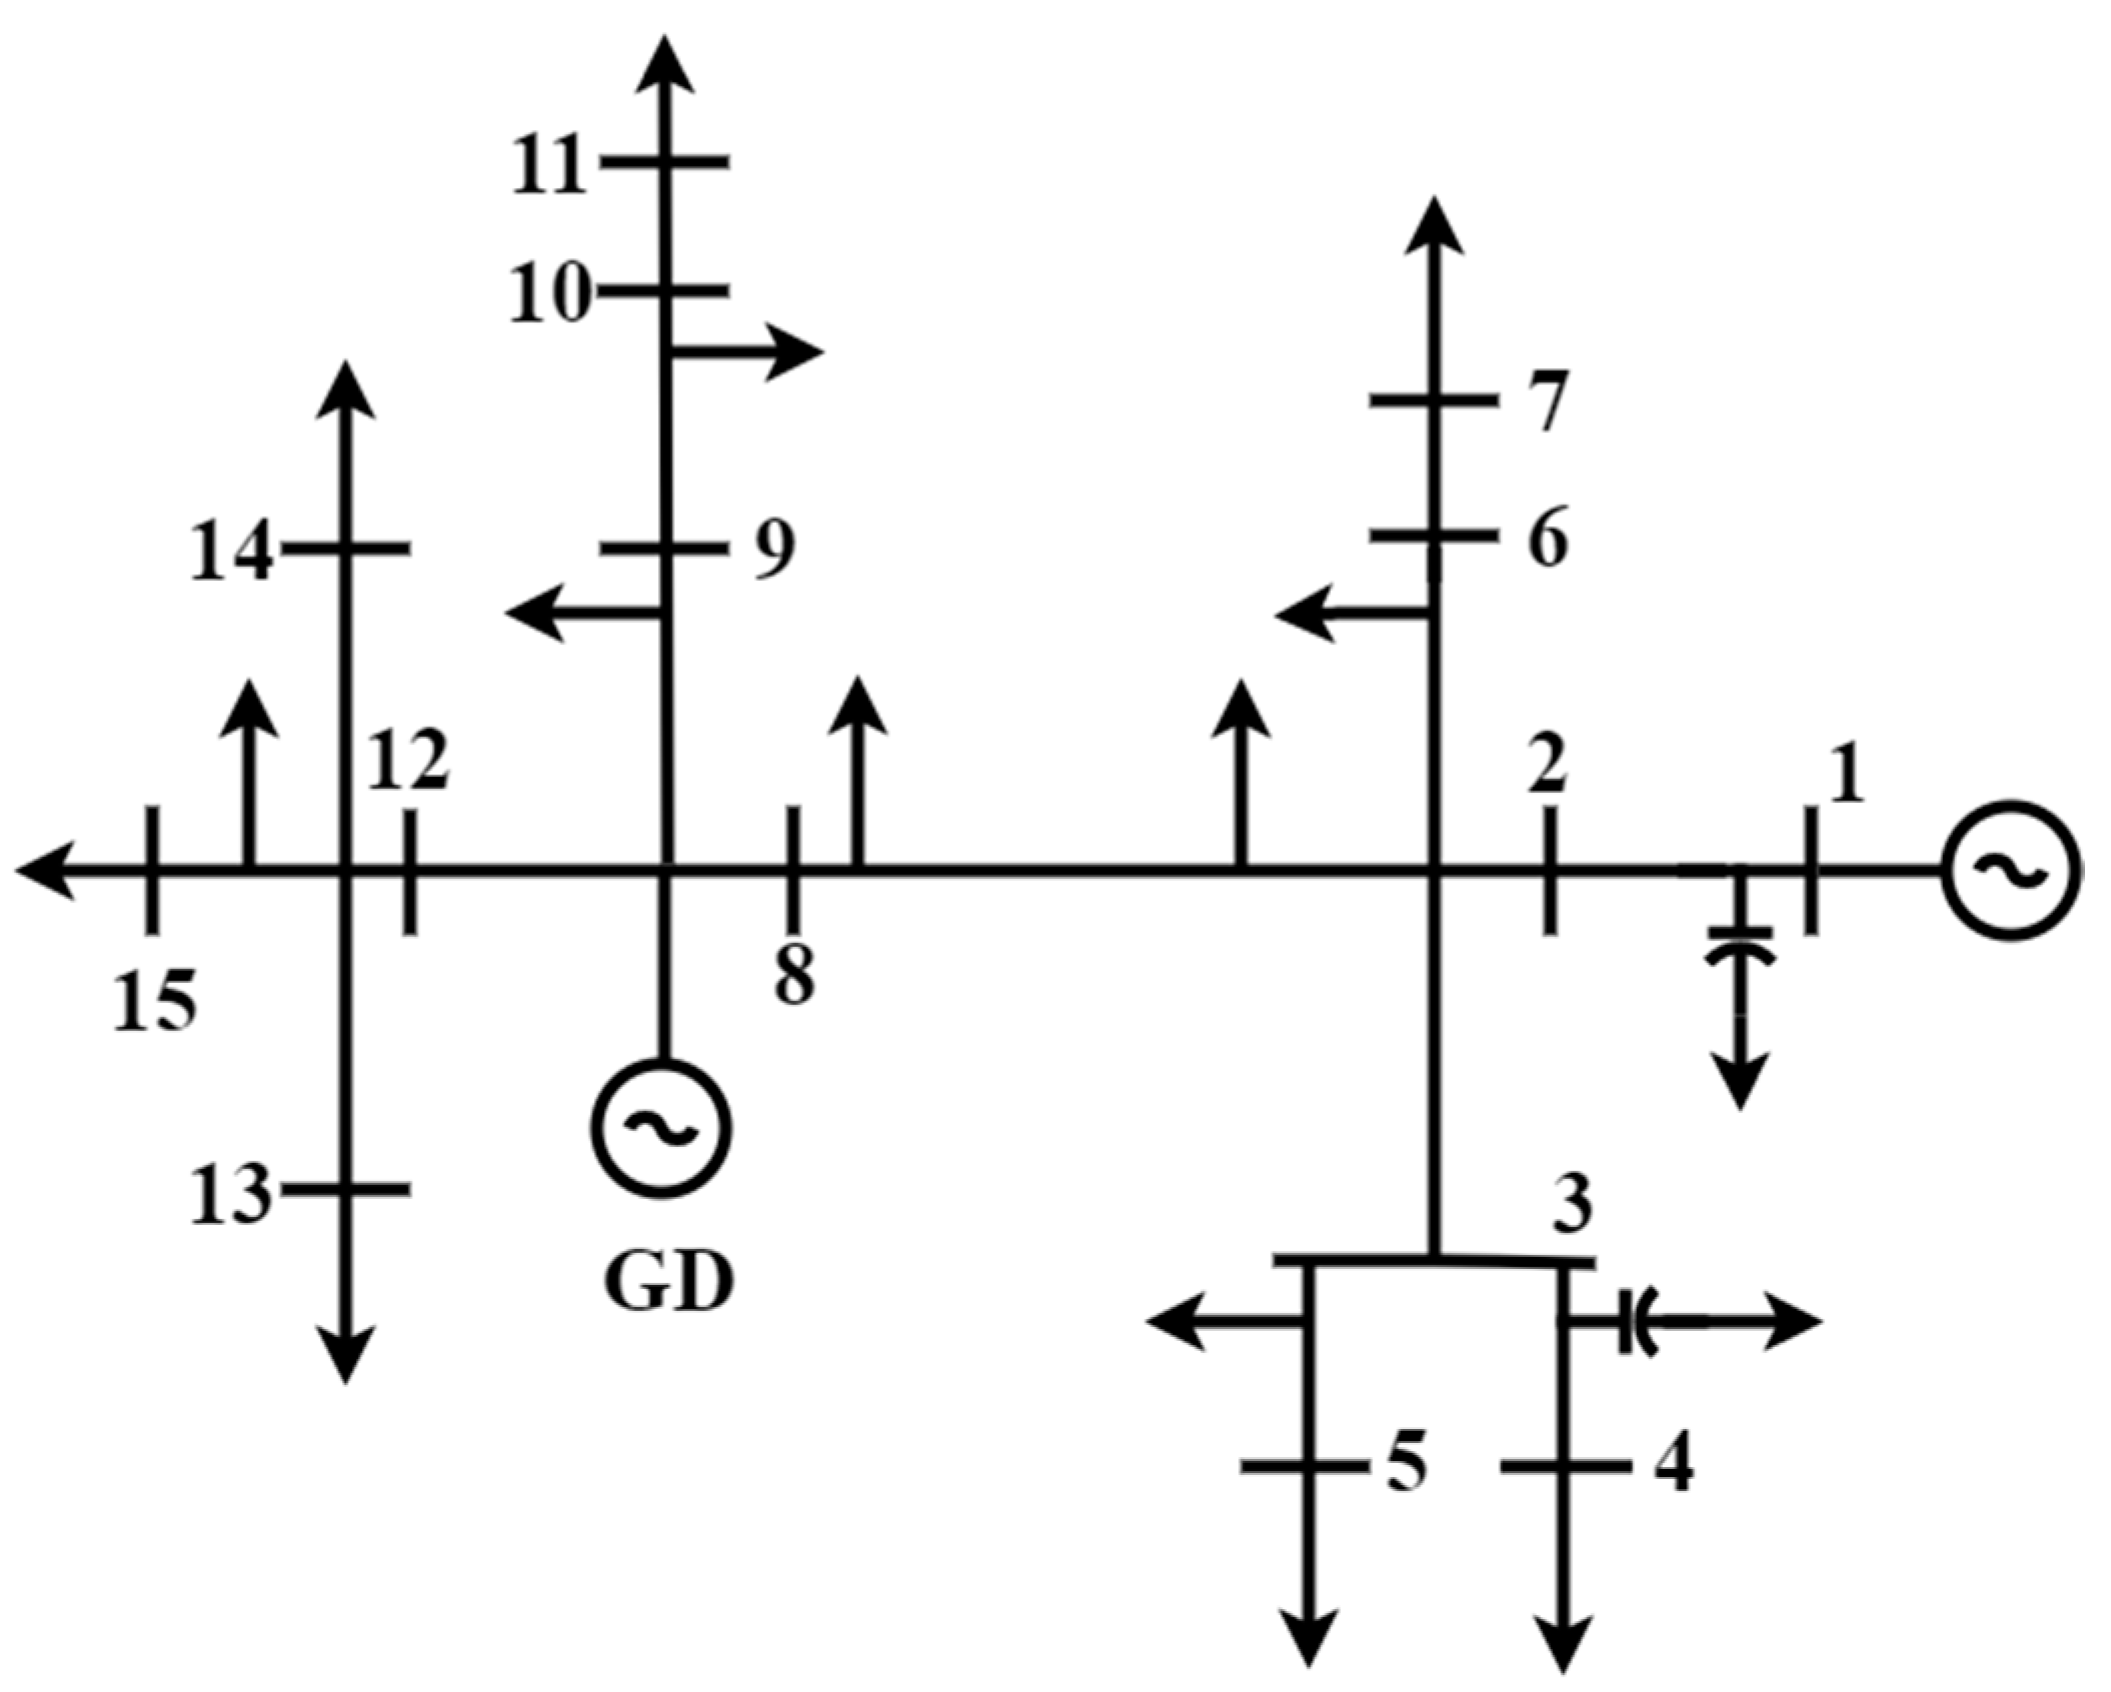
For illustrative purposes, the ICA technique was used to estimate the source and the load impedance of the IEEE 15 bus system (see Figure 11), with the addition of two capacitor banks on buses 1 and 3.
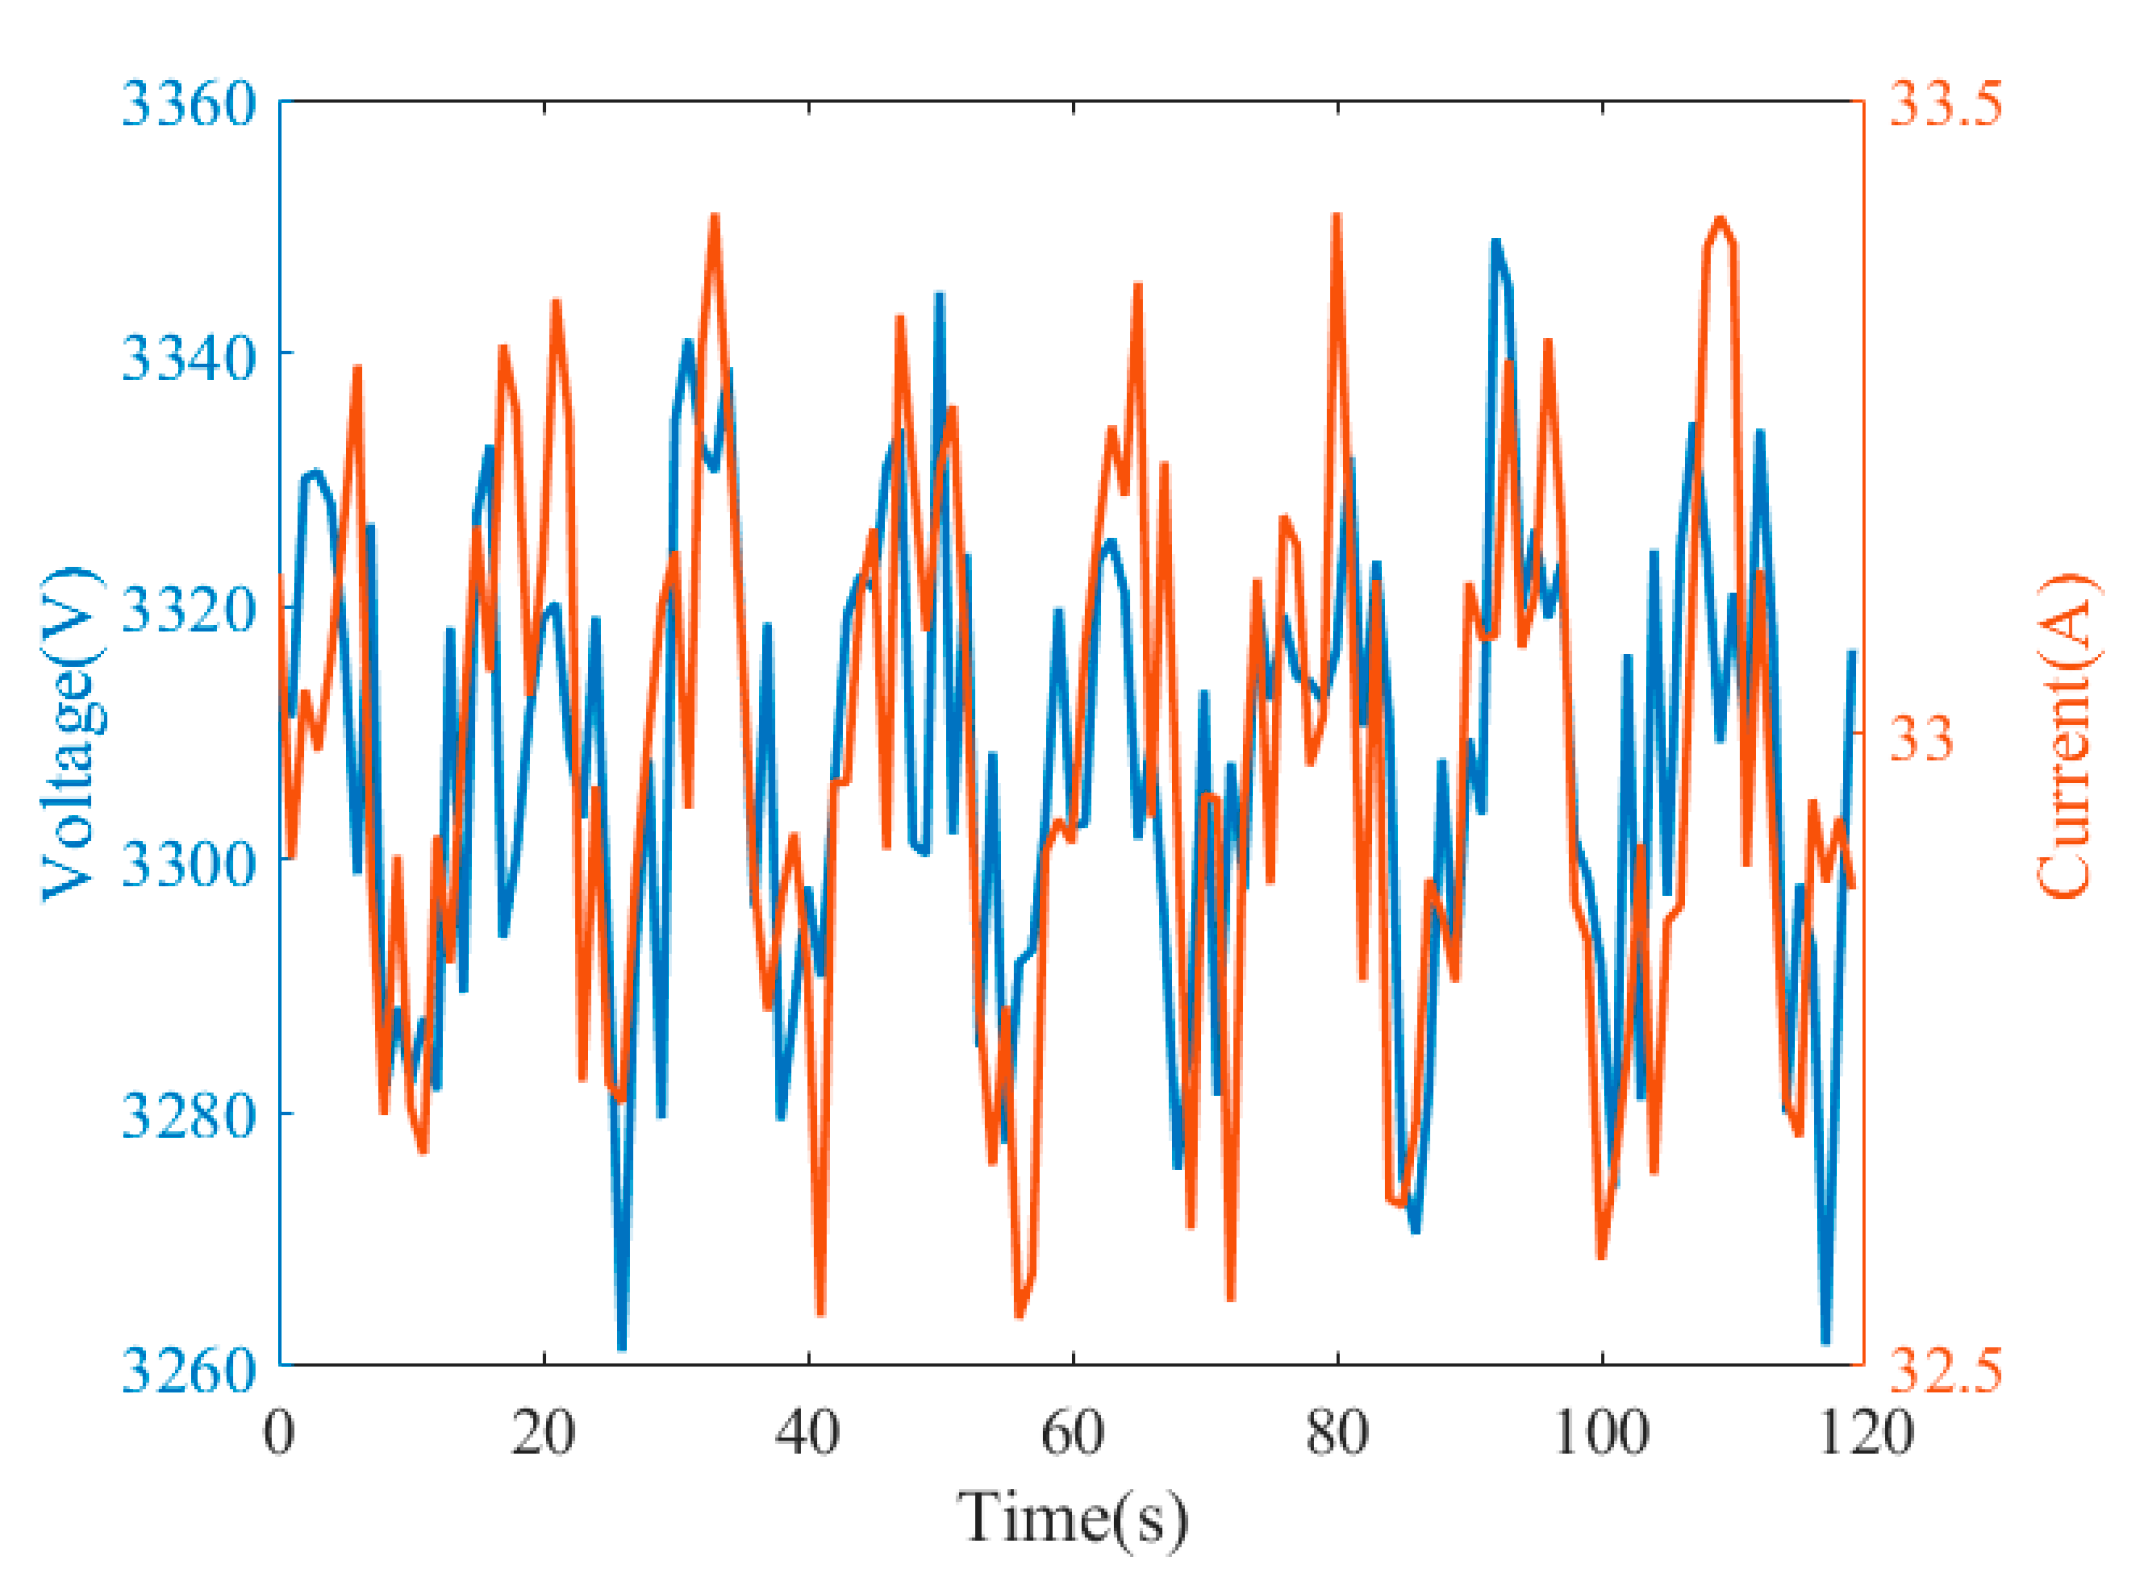
As the ICA is a passive method, the harmonic impedance of order h will only be accurately estimated if this harmonic is present in the system. To assess the performance of the estimation, the existence of all harmonic components up to 50th was assumed. A window containing 2 min of each harmonic samples was acquired at the PCC and processed by the ICA algorithm. Figure 12 shows a typical variation for the 5th harmonic magnitude.
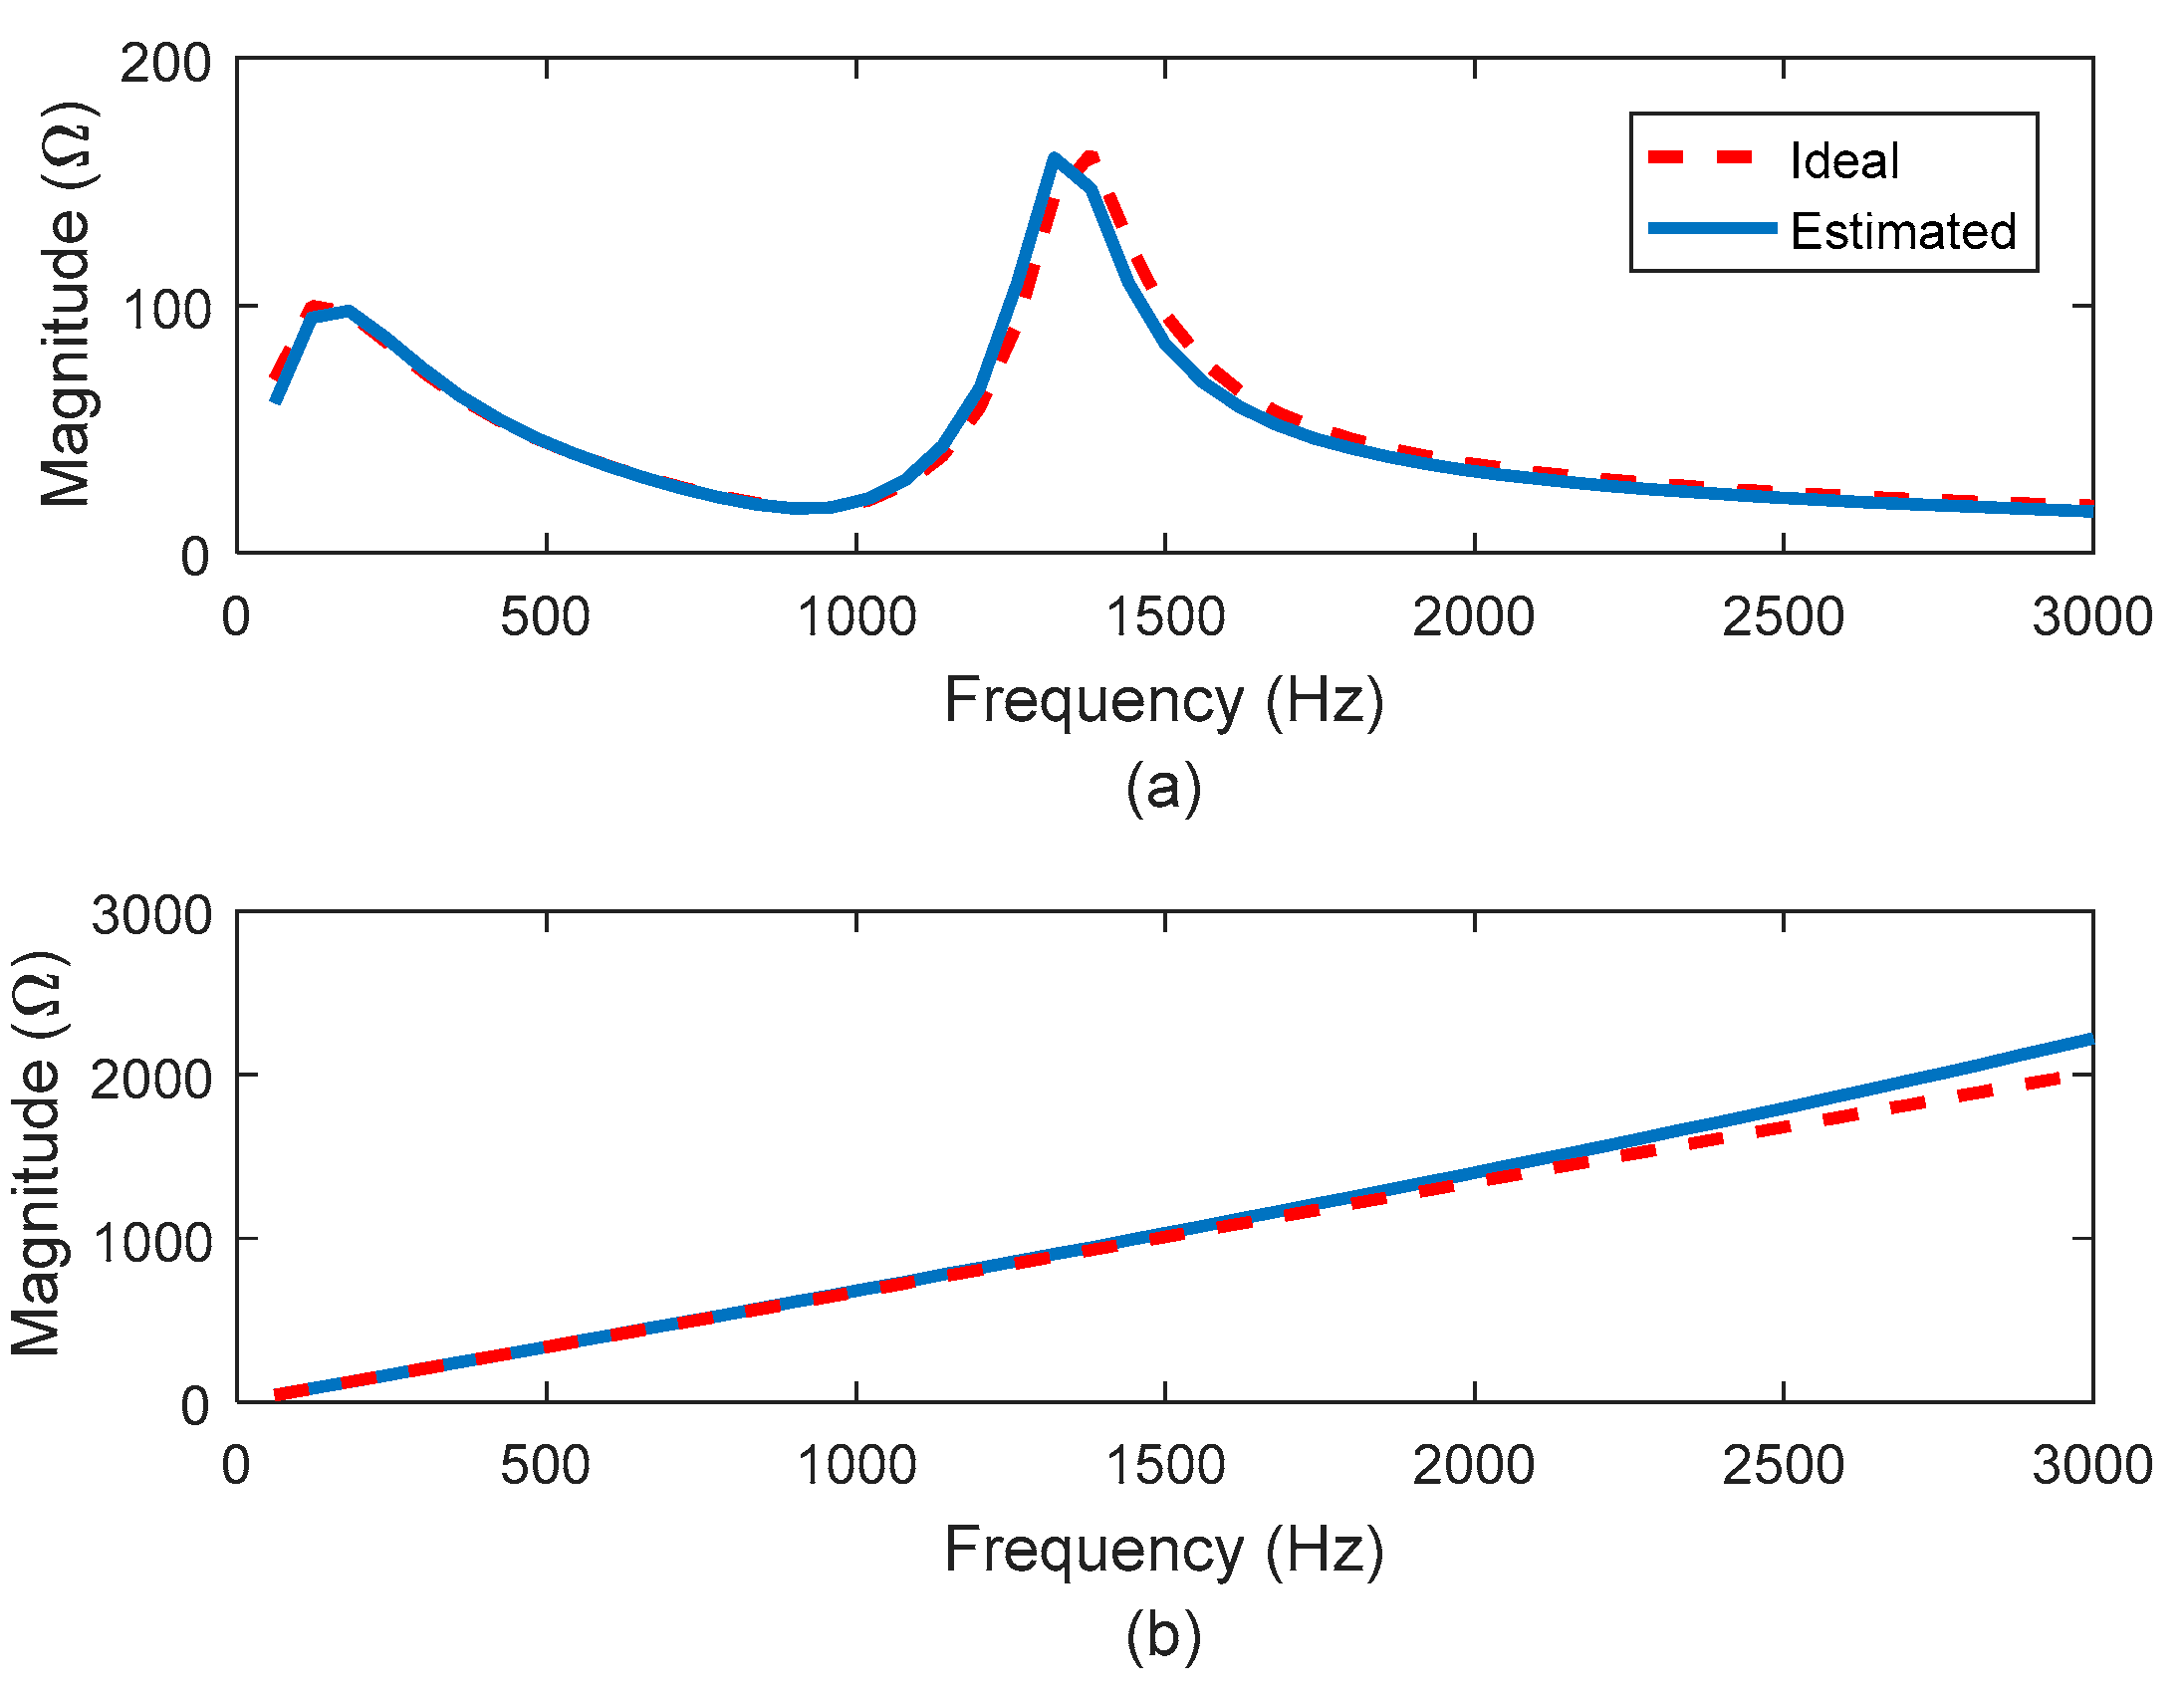
Figure 13a shows the impedance’s magnitude on the source side and Figure 13b on the load side. Note that the ICA method can estimate both impedances with good precision. The phase, although not shown, was also estimated with accuracy.
The ICA technique has some limitations that must be considered for its application. The first limitation is that the harmonic sources must be statistically independent or weakly correlate with each other. Furthermore, ICA is a passive estimation technique, and consequently, it is not possible to estimate the impedance in the frequency with very low energy. Finally, the impedance is assumed constant within the window used for the estimation, and if it changes during the estimation, the results are inconsistent.

4.3. Active Impedance Estimation Method

As previously mentioned, passive methods will only estimate the impedance value for harmonic h if this harmonic is present in the power signal. To overcome this limitation, some disturbance must be caused in the network in a controlled manner to excite the network at interest frequencies. These disturbances can, however, significantly affect the PQ.
A solution proposed in [41,42] is a sequential injection of small short-duration signals and low energy. In this way, it is possible to scan the network’s frequency without significantly affecting the power quality. Another advantage of the injection method is that it is possible to find the harmonic transfers in the system, as long as GPS synchronizes the measurements. Note that depending on the application, one will need not the synchronized phasor but the synchronized waveform.
In the method described in [41], signals called Gaussian Modulated Signal (GMS) are injected at a given point in the network, and the response to this disturbance is captured at other points in the network, determining the harmonic transfer. The GMS is mathematically described by,
i d ( t ) = G e k π h f 1 t 2 2 cos ( 2 π h f 1 t )
where i d ( t ) represents the current injection of the GMS form, f 1 the fundamental frequency of the network, h is the harmonic order whose transfer wants to be estimated, k is a constant that defines the resolution in the frequency, and G controls the pulse energy. The challenge is the injection of the signal in the network. However, when there are electronic converters, it is relatively simple to insert the pulse through their control.

4.4. Illustrative Results

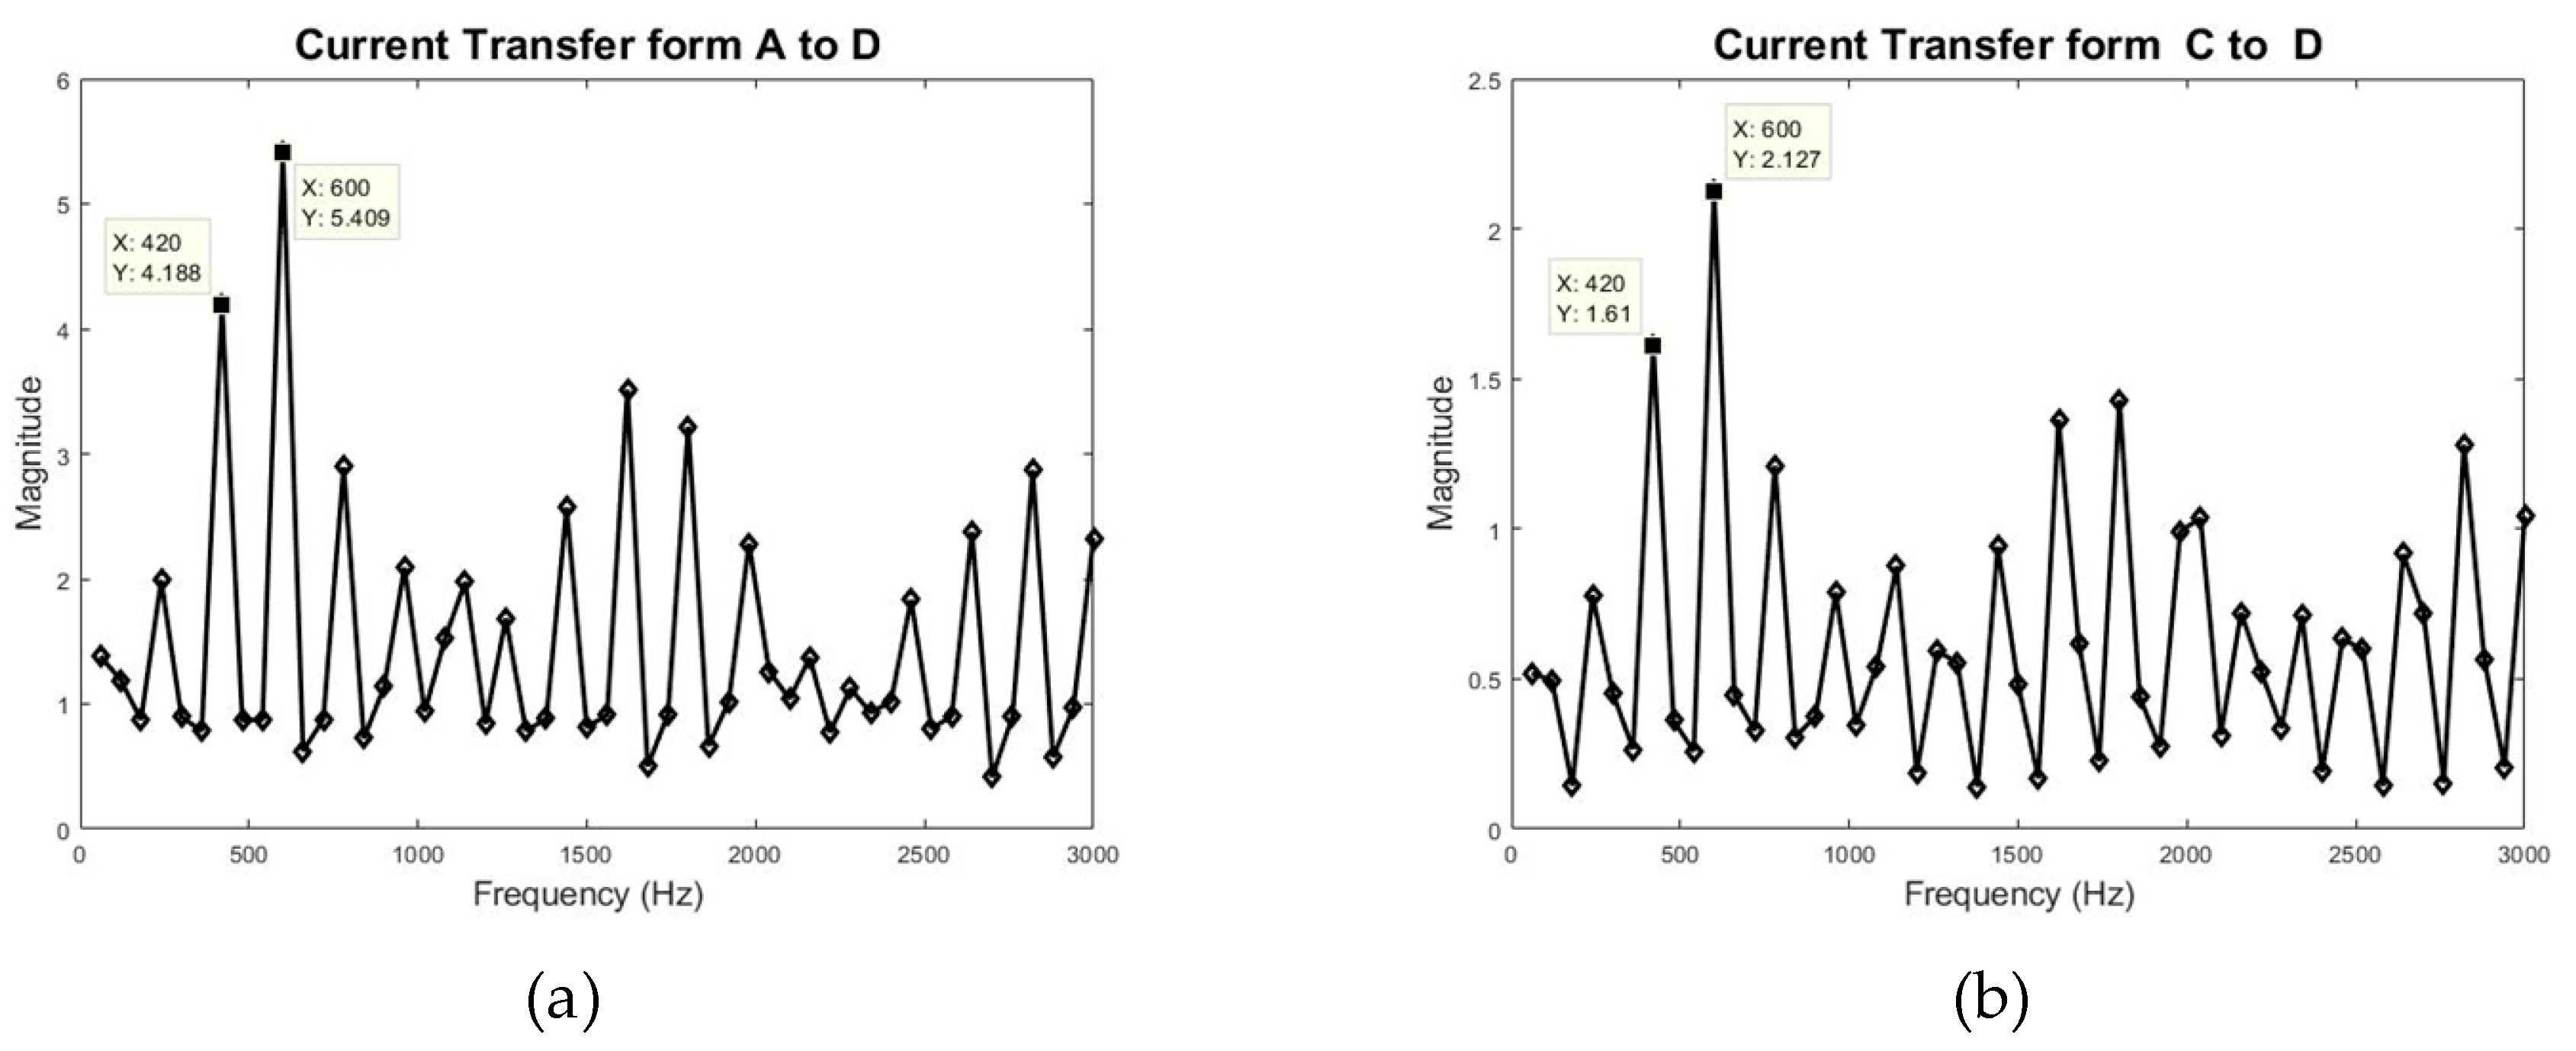
Using this technique, the current transfer from A to D and C to D (Figure 9) was found. As shown in Figure 14 a,b, the present transfers values higher than the 1 for several frequencies. It means that harmonic sources injecting current at bus A or C can be amplified at bus D. It is also possible to observe the behavior of distributed parameters transmission line model by the resonance points.
Figure 15 shows the total impedance seen on bus A. Note that a current injection at this node will cause a high voltage value due to the resonance frequencies.

4.5. Harmonic Amplification

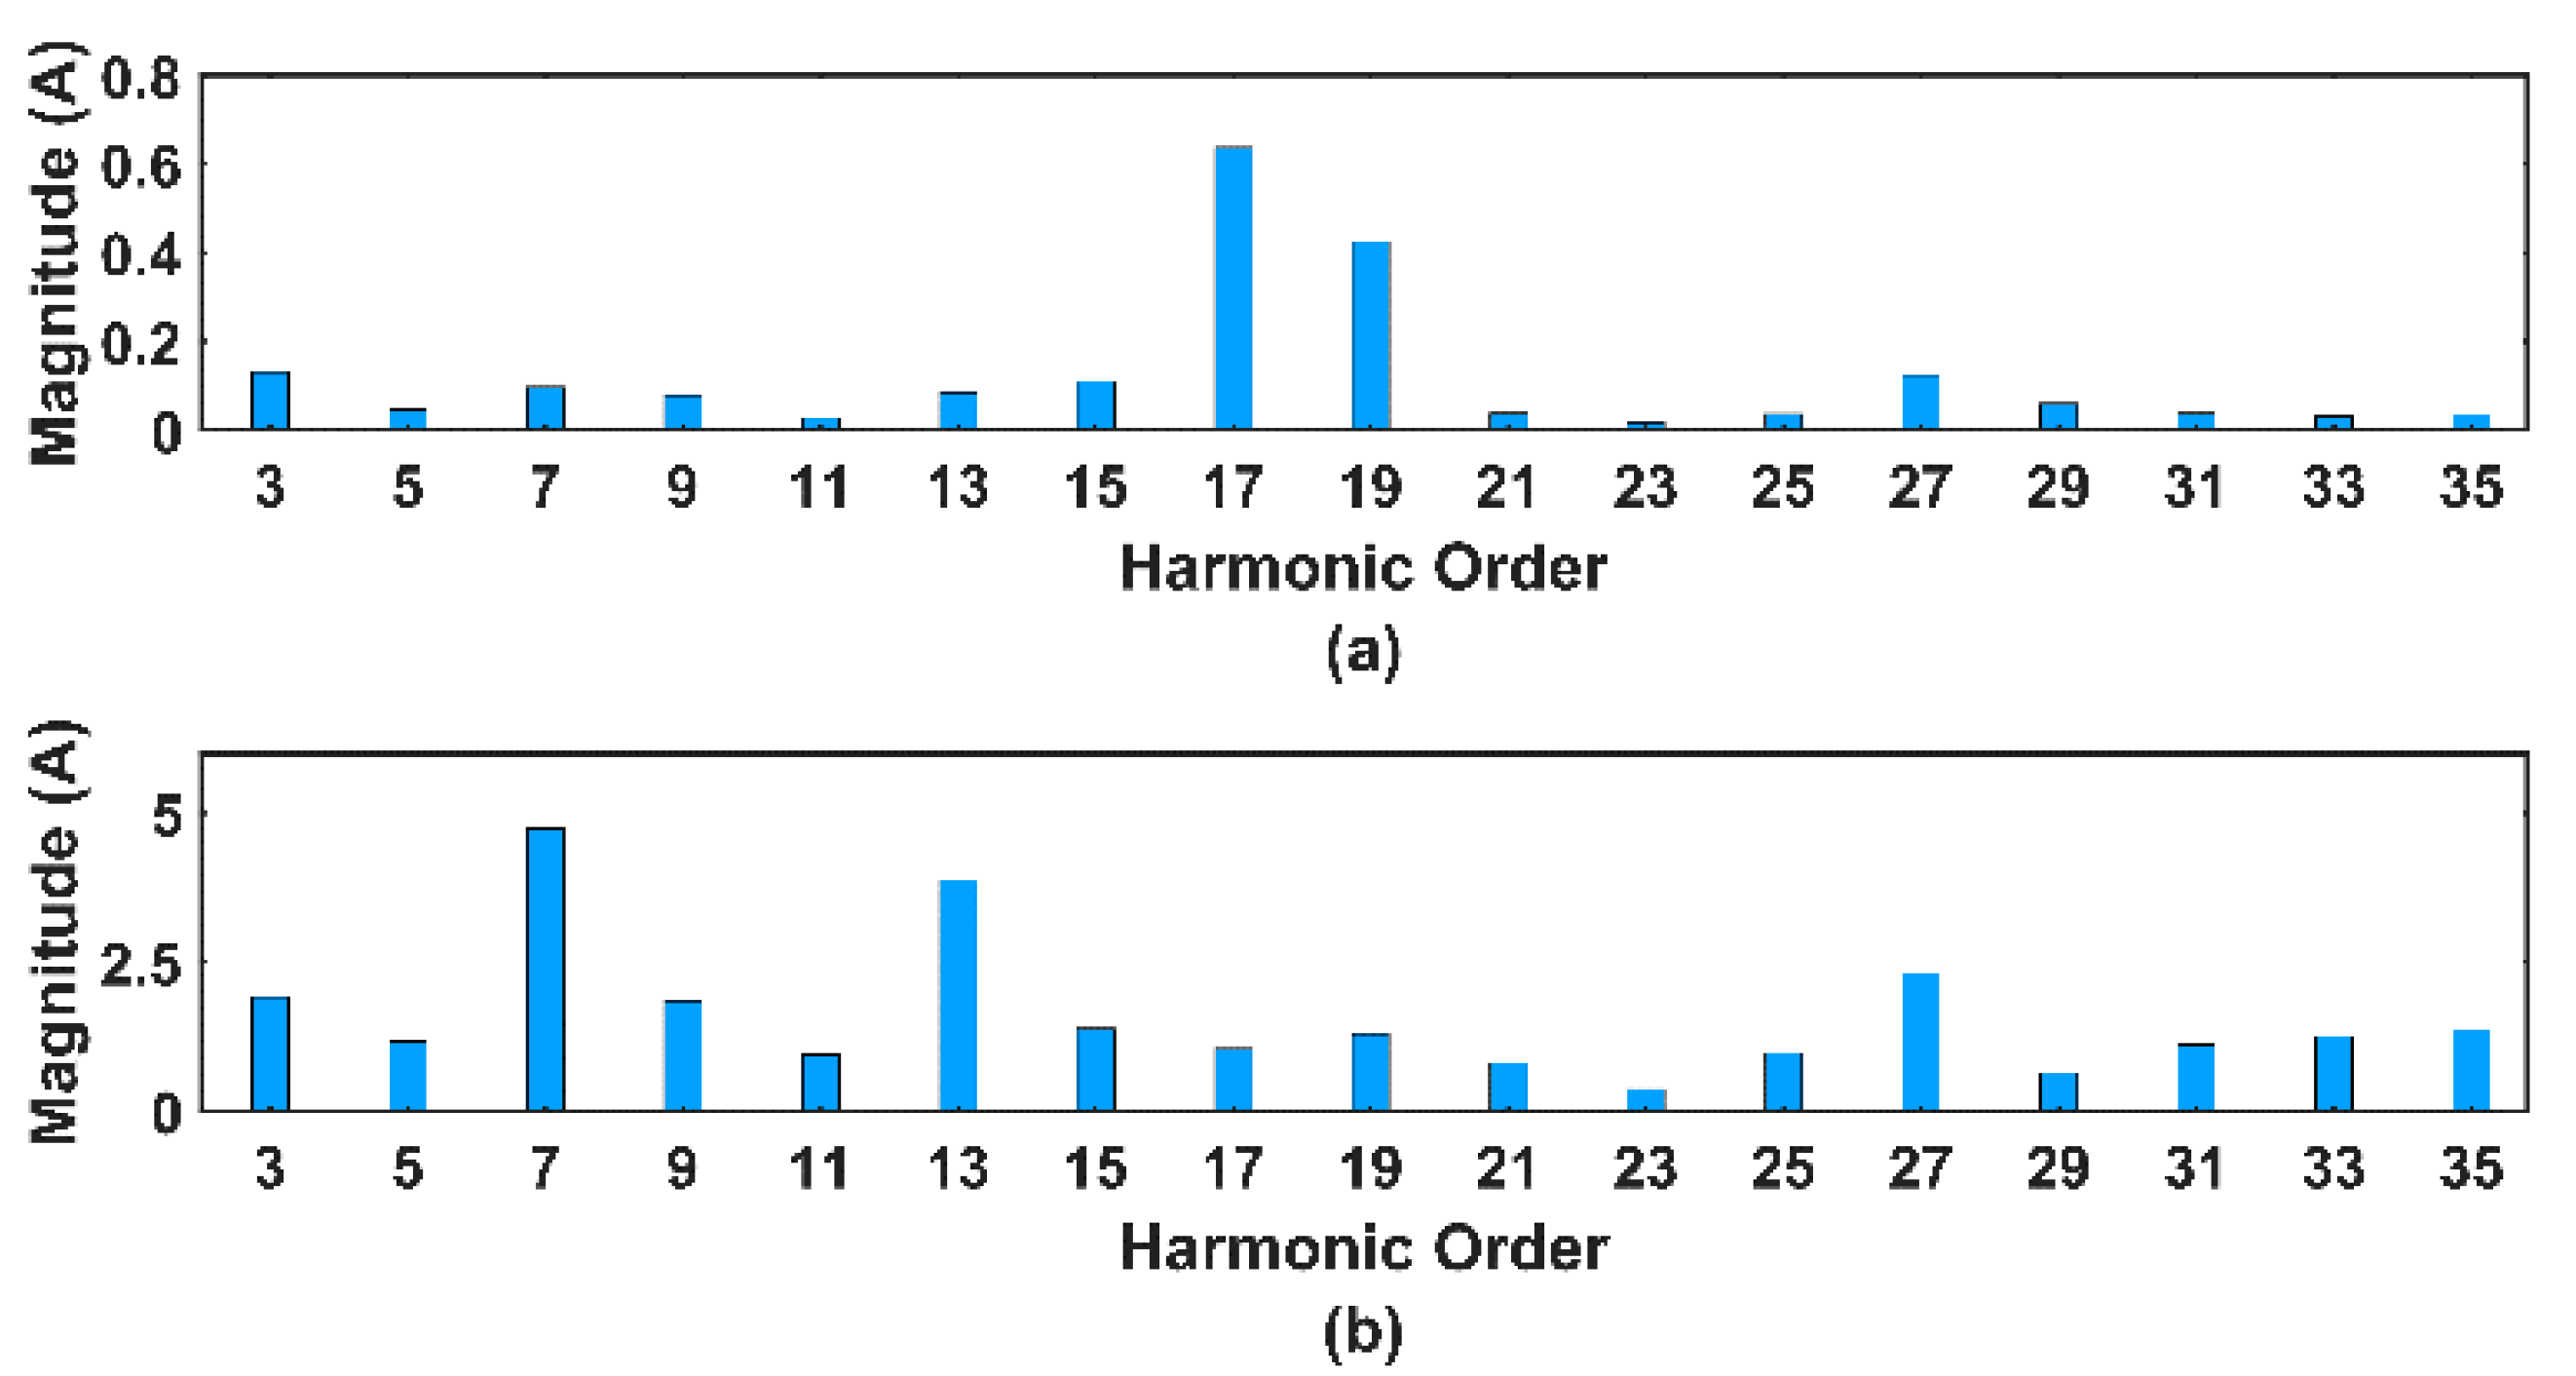
The use of simulation is recurrent in analyzing harmonic distortions in electrical power systems. MATLAB/Simulink software has been increasingly used to analyze electrical networks’ performance and power quality. For the investigation of resonances and the contribution of multiple harmonics sources, the system shown in Figure 8 was modeled using the transmission system’s typical values. So, 1A of three-phase current was injected for each harmonic frequency, up to 35th order (2.1 kHz), in the emitting buses A and C. The harmonic currents are injected with a fixed amplitude value and a typical phase angle.
To observe the distortions arising from these harmonic contributions, current measurement is made on buses B and D. Figure 16 shows the current at buses B and D.
Note that some harmonic currents are amplified at bus D. This is consistent with the current transfer presented in Figure 16, especially for harmonic 7th and 13th.
Using online impedance or transfer information, it is possibly better to understand harmonic propagation behavior at the power system and identify harmonic responsibility among other applications.

5. Conclusions

This paper addressed the main challenges in harmonic synchrophasor estimation (HSpE) and presented some paths for research evolution. The first aspect to be considered when estimating the harmonic phasor concerns the voltage and current transducers’ imperfections. The transducers present in the transmission substations or the distribution networks were designed to respond accurately to the fundamental component, presenting an inadequate frequency response for the harmonic range considered today in the PQ analysis (up to 50th harmonic). This paper presented the adaptive equalization method through algorithms already established in digital signal processing theory adapted to power networks as a proposed solution. For this, the installation of a reference transducer in a previously chosen point of the network and using a satellite synchronization system and availability of a data communication channel to carry out the equalization in a supervised and online manner is suggested. The initial results in this field are auspicious. The second aspect considered was related to the estimation algorithms of the harmonic phasor itself. The harmonic synchronized phasor measurements are still incipient, and further efforts are needed to improve the magnitude and phase estimation algorithms. One of the problems pointed out in this work concerns the error introduced by the resampling system in the magnitude and phase of the harmonic presence in the presence of noise. These errors can generate a TVE greater than 12% for a 40 dB SNR, especially if the harmonics present in the network have low energy, such as less than 5%. It was observed that these errors were introduced in the resampling circuit that is necessary to reduce the leakage error due to the asynchronous sampling rate. In this regard, the proposed solution was using an oversampling technique to reduce the noise level, although the search for new HSpE algorithms is also an exciting path. Finally, two possibilities of estimating the network impedance were presented, one passive using ICA and the other active through the injection of small pulses in the system with controlled frequency content. In particular, the importance of online estimation of network impedance and harmonic transfers was highlighted. The knowledge of these quantities in an online and dynamic way will make it possible to explain phenomena of harmonic propagation in the network and identify polluting agents over time and how each agent contributes to increase or reduce the total harmonic distortion of the network.
Dynamic impedance estimation will continue to be a great challenge for the power systems engineer as the system complexity increases with the massive insertion of power electronic inverters and the associated required filtering. Real-time signal processing will be an effective tool to determine the dynamic self or transfer impedance.

Author Contributions

M.M.d.O., R.S.S. and P.F.R. have worked on the Dynamic Impedance Estimation section; D.F.R. and C.A.D. have worked on the Transducers Online Equalization section; R.R.A. and L.R.M.S. have worked on the Harmonic Synchrophasor Estimation; C.A.D. and P.F.R. have supervised all works and worked on the general review of the article. All authors have read and agreed to the published version of the manuscript.

Funding

This research received no external funding.

Institutional Review Board Statement

Not applicable.

Informed Consent Statement

Not applicable.

Data Availability Statement

Not applicable.

Acknowledgments

The authors also would like to thank CAPES, CNPq, FAPEMIG, INERGE for providing academic and laboratory support.

Conflicts of Interest

The authors declare no conflict of interest.

References

  1. Stiegler, R.; Meyer, J.; Kilter, J.; Konzelmann, S. Assessment of voltage instrument transformers accuracy for harmonic measurements in transmission systems. In Proceedings of the 2016 17th International Conference on Harmonics and Quality of Power (ICHQP), Belo Horizonte, Brazil, 16–19 October 2016; pp. 152–157. [Google Scholar]
  2. Crotti, G.; Gallo, D.; Giordano, D.; Landi, C.; Luiso, M.; Modarres, M. Frequency Response of MV Voltage Transformer under Actual Waveforms. IEEE Trans. Instrum. Meas. 2017, 66, 1146–1154. [Google Scholar] [CrossRef]
  3. Crotti, G.; Gallo, D.; Giordano, D.; Landi, C.; Luiso, M. A Characterized Method for the Real-Time Compensation of Power System Measurement Transducers. IEEE Trans. Instrum. Meas. 2015, 64, 1398–1404. [Google Scholar] [CrossRef]
  4. Ribeiro, P.F.; Duque, C.A.; Ribeiro, P.M.; Cerqueira, A.S. Power Systems Signal Processing for Smart Grids; John Wiley & Sons: Hoboken, NJ, USA, 2013. [Google Scholar]
  5. Reddy, M.V.; Sodhi, R. An Open-Loop Fundamental and Harmonic Phasor Estimator for Single-Phase Voltage Signals. IEEE Trans. Ind. Inform. 2020, 16, 4535–4546. [Google Scholar] [CrossRef]
  6. Cuk, V. Power Quality and EMC Issues with Future Electricity Networks, Joint Working Group C4.24/CIRED; Tech. Brochures; CIGRE: Paris, France, 2018. [Google Scholar]
  7. Santos, E.; Khosravy, M.; Lima, M.A.A.; Cerqueira, A.S.; Duque, C.A.; Yona, A. High Accuracy Power Quality Evaluation under a Colored Noisy Condition by Filter Bank ESPRIT. Electronics 2019, 8, 1259. [Google Scholar] [CrossRef] [Green Version]
  8. Santos, E.; Khosravy, M.; Lima, M.A.; Cerqueira, A.S.; Duque, C.A. ESPRIT associated with filter bank for power-line harmonics, sub-harmonics and inter-harmonics parameters estimation. Int. J. Electr. Power Energy Syst. 2020, 118, 105731. [Google Scholar] [CrossRef]
  9. Aleixo, R.R.; Silva, L.R.; Duque, C.A.; Lima, M.A. Micro-PMU based on Savitzky–Golay filter. IET Gener. Transm. Distrib. 2020, 14, 2092–2099. [Google Scholar] [CrossRef]
  10. Pegoraro, P.A.; Brady, K.; Castello, P.; Muscas, C.; von Meier, A. Line impedance estimation based on synchrophasor measurements for power distribution systems. IEEE Trans. Instrum. Meas. 2019, 68, 1002–1013. [Google Scholar] [CrossRef]
  11. Karimzadeh, F.; Esmaeili, S.; Hosseinian, S.H. Method for determining utility and consumer harmonic contributions based on complex independent component analysis. IET Gener. Transm. Distrib. 2016, 10, 526–534. [Google Scholar] [CrossRef]
  12. Gupta, N.; Garg, R. Algorithm for islanding detection in photovoltaic generator network connected to low-voltage grid. IET Gener. Transm. Distrib. 2018, 12, 2280–2287. [Google Scholar] [CrossRef]
  13. Wang, W.; Nino, E.E.; Xu, W. Harmonic impedance measurement using a thyristor-controlled short circuit. IET Gener. Transm. Distrib. 2007, 1, 707–713. [Google Scholar] [CrossRef]
  14. Serfontein, D.; Rens, J.; Botha, G.; Desmet, J. Continuous Event-Based Harmonic Impedance Assessment Using Online Measurements. IEEE Trans. Instrum. Meas. 2016, 65, 2214–2220. [Google Scholar] [CrossRef]
  15. Monteiro, H.L.; Duque, C.A.; Silva, L.R.; Meyer, J.; Stiegler, R.; Testa, A.; Ribeiro, P.F. Harmonic impedance measurement based on short time current injections. Electr. Power Syst. Res. 2017, 148, 108–116. [Google Scholar] [CrossRef]
  16. Zhao, J.S.; Yang, H.G.; Pan, A.Q.; Xu, F.W. An improved complex ICA based method for wind farm harmonic emission levels evaluation. Electr. Power Syst. Res. 2020, 179, 106105. [Google Scholar] [CrossRef]
  17. Zhao, X.; Yang, H.G. A new method to calculate the utility harmonic impedance based on FastICA. IEEE Trans. Power Deliv. 2015, 31, 381–388. [Google Scholar] [CrossRef]
  18. Xiao, X.Y.; Zheng, X.; Wang, Y.; Xu, S.T.; Zheng, Z.X. A Method for Utility Harmonic Impedance Estimation Based on Constrained Complex Independent Component Analysis. Energies 2018, 11, 2247. [Google Scholar] [CrossRef] [Green Version]
  19. Collin, A.J.; Delle Femine, A.; Gallo, D.; Langella, R.; Luiso, M. Compensation of current transformers non-linearities by tensor linearization. IEEE Trans. Instrum. Meas. 2019, 68, 3841–3849. [Google Scholar] [CrossRef]
  20. Faifer, M.; Laurano, C.; Ottoboni, R.; Toscani, S.; Zanoni, M. Harmonic distortion compensation in voltage transformers for improved power quality measurements. IEEE Trans. Instrum. Meas. 2019, 68, 3823–3830. [Google Scholar] [CrossRef]
  21. Haykin, S.S. Adaptive Filter Theory; Pearson Education: New York, NJ, USA, 2008. [Google Scholar]
  22. IEEE 15BUS. Simulink Model of IEEE 15 Bus Radial Network Power System with Load Flow. Available online: https://www.mathworks.com/matlabcentral/fileexchange/48104-ieee-15-bus-radial-system (accessed on 20 October 2020).
  23. IEEE. C37.118.2b—IEEE Standard for Synchrophasors Data Transfer for Power Systems. 2011. Available online: https://ieeexplore.ieee.org/document/6111222 (accessed on 20 October 2020).
  24. Miller, A.J.V.; Dewe, M.B. Multichannel continuous harmonic analysis in real-time. IEEE Trans. Power Deliv. 1992, 7, 1813–1819. [Google Scholar] [CrossRef]
  25. Carta, A.; Locci, N.; Muscas, C. A PMU for the measurement of synchronized harmonic phasors in three-phase distribution networks. IEEE Trans. Instrum. Meas. 2009, 58, 3723–3730. [Google Scholar] [CrossRef]
  26. Chakir, M.; Kamwa, I.; Le, H. Extended C37. 118.1 PMU algorithms for joint tracking of fundamental and harmonic phasors in stressed power systems and microgrids. IEEE Trans. Power Deliv. 2014, 29, 1465–1480. [Google Scholar]
  27. Belega, D.; Fontanelli, D.; Petri, D. Dynamic phasor and frequency measurements by an improved Taylor weighted least squares algorithm. IEEE Trans. Instrum. Meas. 2015, 64, 2165–2178. [Google Scholar] [CrossRef]
  28. Narduzzi, C.; Bertocco, M.; Frigo, G.; Giorgi, G. Fast-TFM—Multifrequency phasor measurement for distribution networks. IEEE Trans. Instrum. Meas. 2018, 67, 1825–1835. [Google Scholar] [CrossRef]
  29. Chen, L.; Zhao, W.; Wang, F.; Huang, S. Harmonic Phasor Estimator for P-Class Phasor Measurement Units. IEEE Trans. Instrum. Meas. 2019, 69, 1556–1565. [Google Scholar] [CrossRef]
  30. Kapil, C.R.; Venkateswara, M. SODHI, Ranjana. A novel distribution-level phasor estimation algorithm using empirical wavelet transform. IEEE Trans. Ind. Electron. 2018, 65, 7984–7995. [Google Scholar]
  31. Akke, M.; Thorp, J.S. Sample value adjustment improves phasor estimation at off-nominal frequencies. IEEE Trans. Power Deliv. 2010, 25, 2255–2263. [Google Scholar] [CrossRef]
  32. Banerjee, P.; Srivastava, S.C. A subspace-based dynamic phasor estimator for synchrophasor application. IEEE Trans. Instrum. Meas. 2012, 61, 2436–2445. [Google Scholar] [CrossRef]
  33. Romano, P.; Paolone, M. Enhanced interpolated-DFT for synchrophasor estimation in FPGAs: Theory, implementation, and validation of a PMU prototype. IEEE Trans. Instrum. Meas. 2014, 63, 2824–2836. [Google Scholar] [CrossRef]
  34. Derviškadić, A.; Romano, P.; Paolone, M. Iterative-interpolated DFT for synchrophasor estimation: A single algorithm for P-and M-class compliant PMUs. IEEE Trans. Instrum. Meas. 2017, 67, 547–558. [Google Scholar] [CrossRef] [Green Version]
  35. Maharjan, S.; Peng, J.C.; Martinez, J.E.; Xiao, W.; Huang, P.H.; Kirtley, J.L. Improved sample value adjustment forsynchrophasor estimation at off-nominal power system conditions. IEEE Trans. Power Deliv. 2016, 32, 33–44. [Google Scholar] [CrossRef]
  36. STMicroelectronics. AN4629—ADC Hardware Oversampling for Microcontrollers of the STM32 L0 and L4 Series. 2015. Available online: https://webcache.googleusercontent.com/search?q=cache:w20OnufUuqcJ:https://www.st.com/resource/en/application_note/dm00150423-adc-hardware-oversampling-for-microcontrollers-of-the-stm32-l0-and-l4-series-stmicroelectronics.pdf+&cd=1&hl=zh-CN&ct=clnk (accessed on 20 October 2020).
  37. Mitra, S.K.; Kuo, Y. Digital Signal Processing: A Computer-Based Approach; McGraw-Hill: New York, NY, USA, 2006. [Google Scholar]
  38. Safargholi, F.; Malekian, K.; Schufft, W. On the dominant harmonic source identification—Part I: Review of methods. IEEE Trans. Power Deliv. 2017, 33, 1268–1277. [Google Scholar] [CrossRef]
  39. Xu, F.; Yang, H.; Zhao, J.; Wang, Z.; Liu, Y. Study on constraints for harmonic source determination using active power direction. IEEE Trans. Power Deliv. 2018, 33, 2683–2692. [Google Scholar]
  40. Karimzadeh, F.; Esmaeili, S.; Hosseinian, S.H. A novel method for non-invasive estimation of utility harmonic impedance based on complex independent component analysis. IEEE Trans. Power Deliv. 2015, 30, 1843–1852. [Google Scholar] [CrossRef]
  41. Monteiro, H.L.; de Oliveira, M.M.; de Oliveira, R.R.; Silva, L.R.; Duque, C.A. Harmonic impedance estimation in frequency deviation scenario. In Proceedings of the 2018 18th International Conference on Harmonics and Quality of Power (ICHQP), Ljubljana, Slovenia, 13–16 May 2018. [Google Scholar]
  42. Monteiro, H.L.; de Oliveira, M.M.; Aleixo, R.R.; Duque, C.A.; Ribeiro, P.F. A real time implementation of a harmonic impedance estimator. In Proceedings of the 2016 17th International Conference on Harmonics and Quality of Power (ICHQP), Belo Horizonte, Brazil, 16–19 October 2016. [Google Scholar]
  43. Borkowski, D. A new method for non-invasive measurement of grid harmonic impedance with data selection. Int. Trans. Electr. Energy Syst. 2015, 25, 3772–3791. [Google Scholar] [CrossRef]
  44. Zheng, X.; Liu, Y.M.; Chen, F.Y.; Xu, S.T.; Xiao, X.Y. A comparison of typical non-invasive method for utility harmonic impedance estimation. In Proceedings of the 2018 18th International Conference on Harmonics and Quality of Power (ICHQP), Ljubljana, Slovenia, 13–16 May 2018. [Google Scholar]
  45. Sinvula, R.; Abo-Al-Ez, K.M.; Kahn, M.T. Harmonic source detection methods: A systematic literature review. IEEE Access 2019, 7, 74283–74299. [Google Scholar] [CrossRef]
  46. Wilsun, X.; Liu, Y. A method for determining customer and utility harmonic contributions at the point of common coupling. IEEE Trans. Power Deliv. 2000, 15, 804–811. [Google Scholar] [CrossRef] [Green Version]
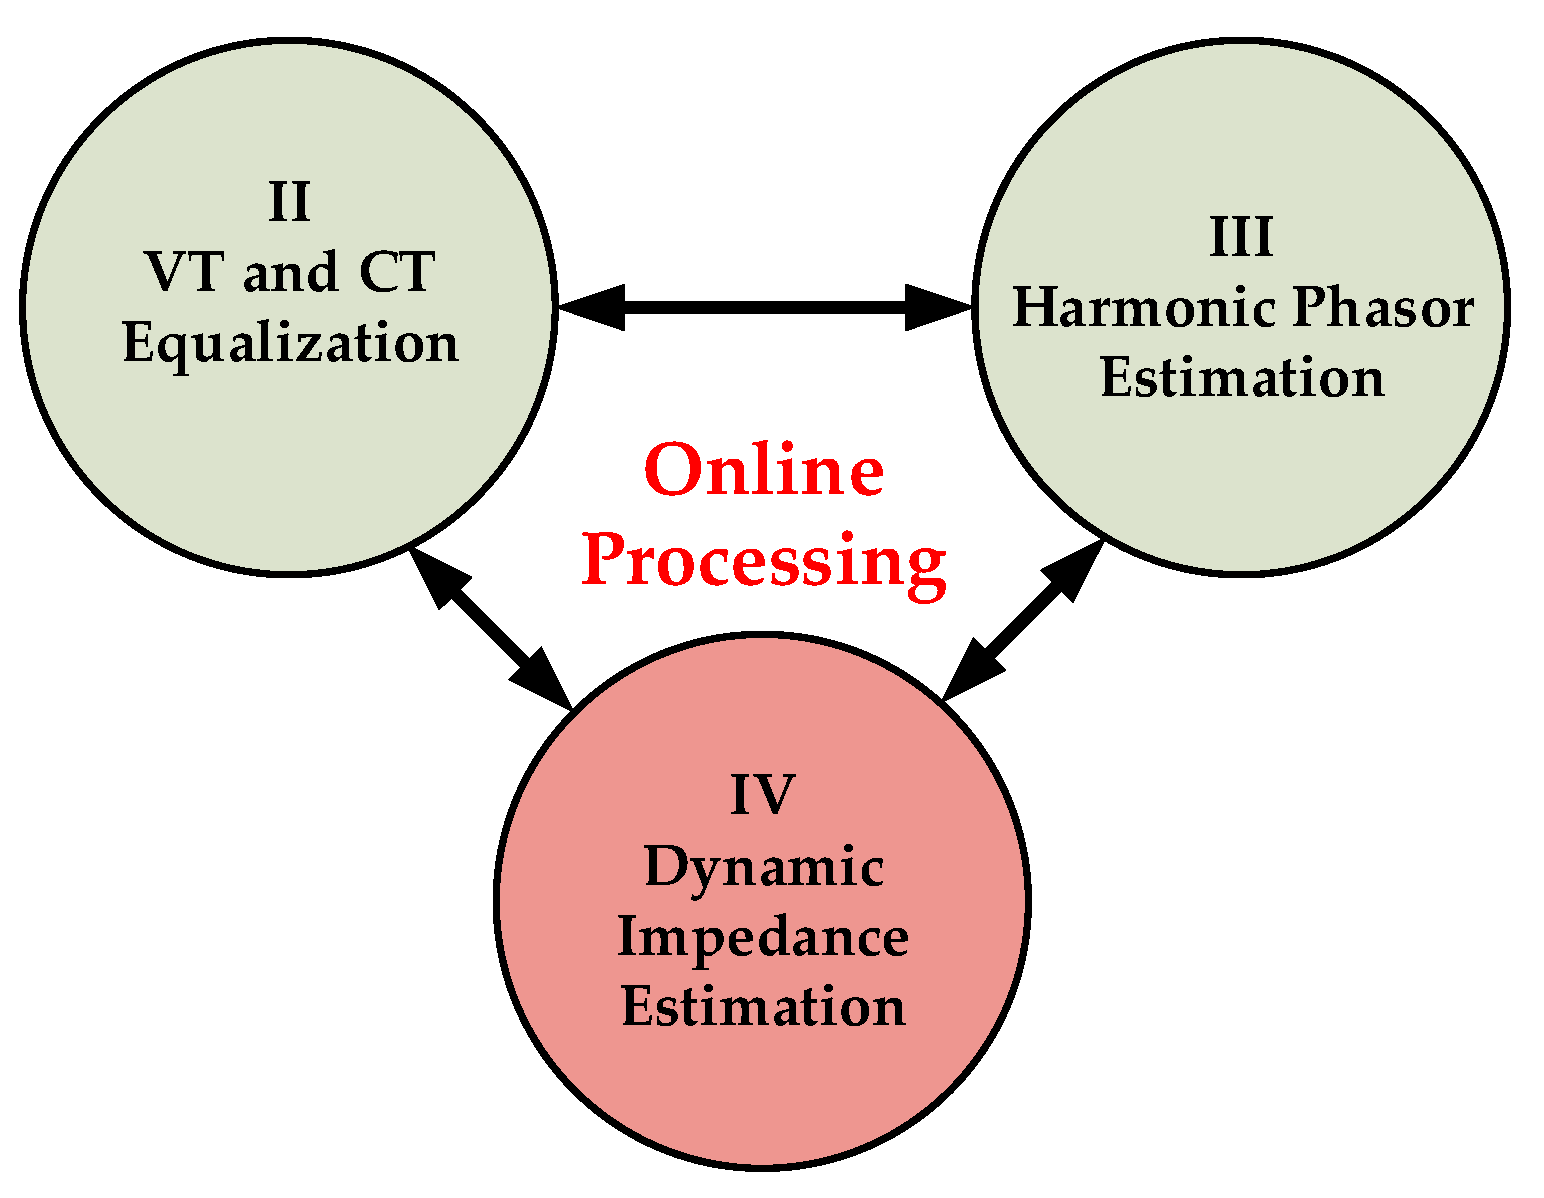
Figure 1. The three subjects addressed in this work and their interdependence.
Applsci 11 00558 g001
Figure 2. Methodology for online and adaptive equalization of transducers.
Applsci 11 00558 g002
Figure 3. The frequency response of a typical voltage transducer.
Applsci 11 00558 g003
Figure 4. Total vector error (TVE) before (black) and after (red) equalization.
Applsci 11 00558 g004
Figure 5. Block diagram of discrete Fourier transform (DFT) passed harmonic synchrophasor estimation (HSpE).
Applsci 11 00558 g005
Figure 6. Oversampling method.
Applsci 11 00558 g006
Figure 7. TVE for the harmonic synchrophasor for a signal with noise and harmonics.
Applsci 11 00558 g007
Figure 8. Maximum and average TVE of harmonic phasors under off-nominal frequency.
Applsci 11 00558 g008
Figure 9. A small section of a real transmission system.
Applsci 11 00558 g009
Figure 10. Norton equivalent circuit for impedance estimation.
Applsci 11 00558 g010
Figure 11. 15 bus system to illustrate the load and source side impedance estimation.
Applsci 11 00558 g011
Figure 12. Magnitude variation for the 5th harmonic voltage and current.
Applsci 11 00558 g012
Figure 13. Harmonic impedance estimation results: (a) magnitude on the source side; (b) magnitude on the load side
Applsci 11 00558 g013
Figure 14. Current transfer function: (a) from bus A to bus D; (b) from bus C to bus D.
Applsci 11 00558 g014
Figure 15. Total Impedance at Bus A: (a) Magnitude and (b) Phase.
Applsci 11 00558 g015
Figure 16. Current magnitude on bus: (a) Bus B; (b) Bus D.
Applsci 11 00558 g016
Publisher’s Note: MDPI stays neutral with regard to jurisdictional claims in published maps and institutional affiliations.