Article

Study of Temporal Variations of Equivalent Black Carbon in a Coastal City in Northwest Spain Using an Atmospheric Aerosol Data Management Software

by
María Piñeiro-Iglesias
1,2,*,
Javier Andrade-Garda
3,
Sonia Suárez-Garaboa
3,
Soledad Muniategui-Lorenzo
1,2,4,
Purificación López-Mahía
1,2,4 and
Darío Prada-Rodríguez
1,2,4
1
Grupo de Química Analítica Aplicada (QANAP), Centro de Investigacións Científicas Avanzadas (CICA), AE CICA-INIBIC, Universidade da Coruña, 15071 A Coruña, Spain
2
Instituto Universitario de Medio Ambiente (IUMA), Universidade da Coruña, 15179 A Coruña, Spain
3
Grupo ISLA, Departamento de Ciencias da Computación e Tecnoloxías da Información, Facultade de Informática, Universidade da Coruña, 15071 A Coruña, Spain
4
Departamento de Química, Facultade de Ciencias, Universidade da Coruña, 15071 A Coruña, Spain
*
Author to whom correspondence should be addressed.
Appl. Sci. 2021, 11(2), 516; https://doi.org/10.3390/app11020516
Submission received: 2 November 2020 / Revised: 18 December 2020 / Accepted: 4 January 2021 / Published: 7 January 2021
(This article belongs to the Special Issue New Insights into Atmospheric Chemistry and Climate)

Abstract

:
Light-absorbing carbonaceous aerosols (including black carbon (BC)) pose serious health issues and play significant roles in atmospheric radiative properties. Two-year measurements (2015–2016) of aerosol light absorption, combined with measurements of sub-micrometric particles, were continuously conducted in A Coruña (northwest (NW) Spain) to determine their light absorption properties: absorption coefficients (σabs) and the absorption Ångström exponent (AAE). The mean and standard deviation of equivalent black carbon (eBC) during the period of study were 0.85 ± 0.83 µg m−3, which are lower than other values measured in urban areas of Spain and Europe. High eBC concentrations found in winter are associated with an increase in emissions from anthropogenic sources in combination with lower mixing layer heights and frequent stagnant conditions. The pronounced diurnal variability suggests a strong influence from local sources. AAE had an average value of 1.26 ± 0.22 which implies that both fossil fuel combustion and biomass burning influenced optical aerosol properties. This also highlights biomass combustion in suburban areas, where the use of wood for domestic heating is encouraged, as an important source of eBC. All data treatment was gathered using SCALA© as atmospheric aerosol data management support software program.

1. Introduction

Atmospheric pollution supposes a risk factor for cancer and cardiovascular and respiratory diseases. However, atmospheric aerosol particles are poorly understood components of the atmosphere. They have a large diversity of sources, formation and transformation processes, which imply a large number of different aerosol species and, therefore, different properties. Hence, and taking into account their large variability, it is necessary to characterize them to know how they behave in the atmosphere in order to assess, for example, their effects on health and climate [1], and even in the degradation of building materials [2].
Black carbon (BC) is the fraction of the carbonaceous aerosol in the atmosphere that is characterized by its strong absorption of visible light [3] and also by its resistance to chemical transformation. BC is a good indicator of primary emissions and it is often used as an indicator for the efficiency of abatement initiatives [4,5]. The importance of BC determination also relies on the fact that BC and organic carbon are the constituents of particulate matter that are most likely to cause adverse health effects [6]. In this manner, the identification of its sources, which rely on the different optical properties of carbonaceous aerosols from different sources [7], is certainly very relevant. Particularly, it is important to distinguish between the contribution of fossil fuel (ff) and biomass burning (bb). This is possible by a multi-wavelength determination of the absorption coefficient [8] using an aethalometer, manufactured by Magee Scientific [9,10]. This instrument forms an important tool for source apportionment of carbonaceous aerosols since it is robust and easy to operate. In fact, it is widespread across Europe [11]. In this sense, when optical absorption methods are used for BC measurement, the term “equivalent black carbon” (eBC) should be used instead of BC [12,13]. Moreover, it is necessary to use a suitable MAC (mass absorption cross-section) value [13] for the conversion of the light absorption coefficient into mass concentration.
Querol et al. [14] concluded that continuous monitoring of eBC by absorption photometers is an adequate strategy for air quality monitoring, mainly at urban sites. The reason is that this parameter can be considered a good tracer of exposure to anthropogenic emissions since it can be emitted by local sources, or transported regionally. In fact, a technical report for the European Environmental Agency concluded that eBC monitoring would be viable in current European air quality networks, where these types of instruments are already present.
Additionally, numerous studies have revealed that exposure to road traffic emissions is best assessed by combining measurements of ultrafine particles (UFP) and eBC concentrations, since these parameters need to be controlled by air quality limit values [15,16,17,18]. One of the recommendations of the CARE (Carbonaceous Aerosol in Rome and Environs) experiment [19] is to update the air quality standards by including measurements of particle composition (at least BC) and particle number (and size) with a shorter data averaging period. This is because several studies about physical aerosol parameters show that elevated aerosol particle concentrations may result in an increased risk of health hazards. This may be due to UFP and BC having higher surface areas per mass to absorb toxic materials rather than larger particles. The reason is their high concentrations and small diameters [20,21].
With regard to UFP, their properties are greatly dependent on their sources. They vary geographically depending on the land use and the atmospheric processing and transport. Thus, the size distribution of the aerosols in the atmosphere at different spatial and temporal scales, as well as their associated effects, can be very different. In situ measurements of aerosol size distributions are therefore needed. Many kinds of instruments can obtain these measurements based on two principles of operation: light scattering and electric field. The differential mobility analyzer (DMA) used in conjunction with a particle counting system (condensation particle counter (CPC) or electrometers), called the Scanning Mobility Particle Sizer (SMPS), is the most common technique employed for long-term characterization of the atmospheric sub-micrometric aerosol fraction [1]. With this equipment, the total number of particles (Nt) in the size range measured is obtained, the daily averages ranging between a few hundred and over 50,000 cm−3 [3].
In order to assess the source apportionment of eBC, the absorption Ångström exponent (AAE) can be used as a source specific parameter to distinguish between wood smoke and diesel exhaust aerosols. Wood smoke contains aerosolized substances that strongly absorb in the blue and ultraviolet (UV) part of the light spectrum and may not absorb in the infrared (IR) parts of the spectrum; that is, brown carbon (BrC) [22]. High aerosol absorption at low wavelengths leads to high AAE values [7]. For wood smoke or smoke resulting from the combustion of biomass, an AAE of around 2 is expected [8], although much higher AAEs have been observed, for example, for the smoldering combustion of peat [23]. Fresh diesel exhaust has an AAE close to 1 [24].
The west of Spain lacks studies on eBC, on eBC in combination with Nt, and on source apportionment of eBC. However, there is a traditional use of wood in this region as an energy source for domestic heating in single family homes outside urban areas. In fact, the Galician Autonomous Government (in the northwest (NW) of Spain) has encouraged the use of biomass for this end.
Taking all the previous information into account, the aim of this study was (i) to evaluate eBC levels and their temporal variability in a residential area in the NW of Spain, (ii) to assess the previous information with data related to Nt, and (iii) to identify eBC primary local and regional sources of emissions from fossil fuel combustion and biomass burning. For this purpose, (i) we carried out a sampling campaign from January 2015 to December 2016, and (ii) we developed new software features/functionalities for the SCALA© software application, which was the atmospheric aerosol data management software used to carry out this work.

2. Materials and Methods

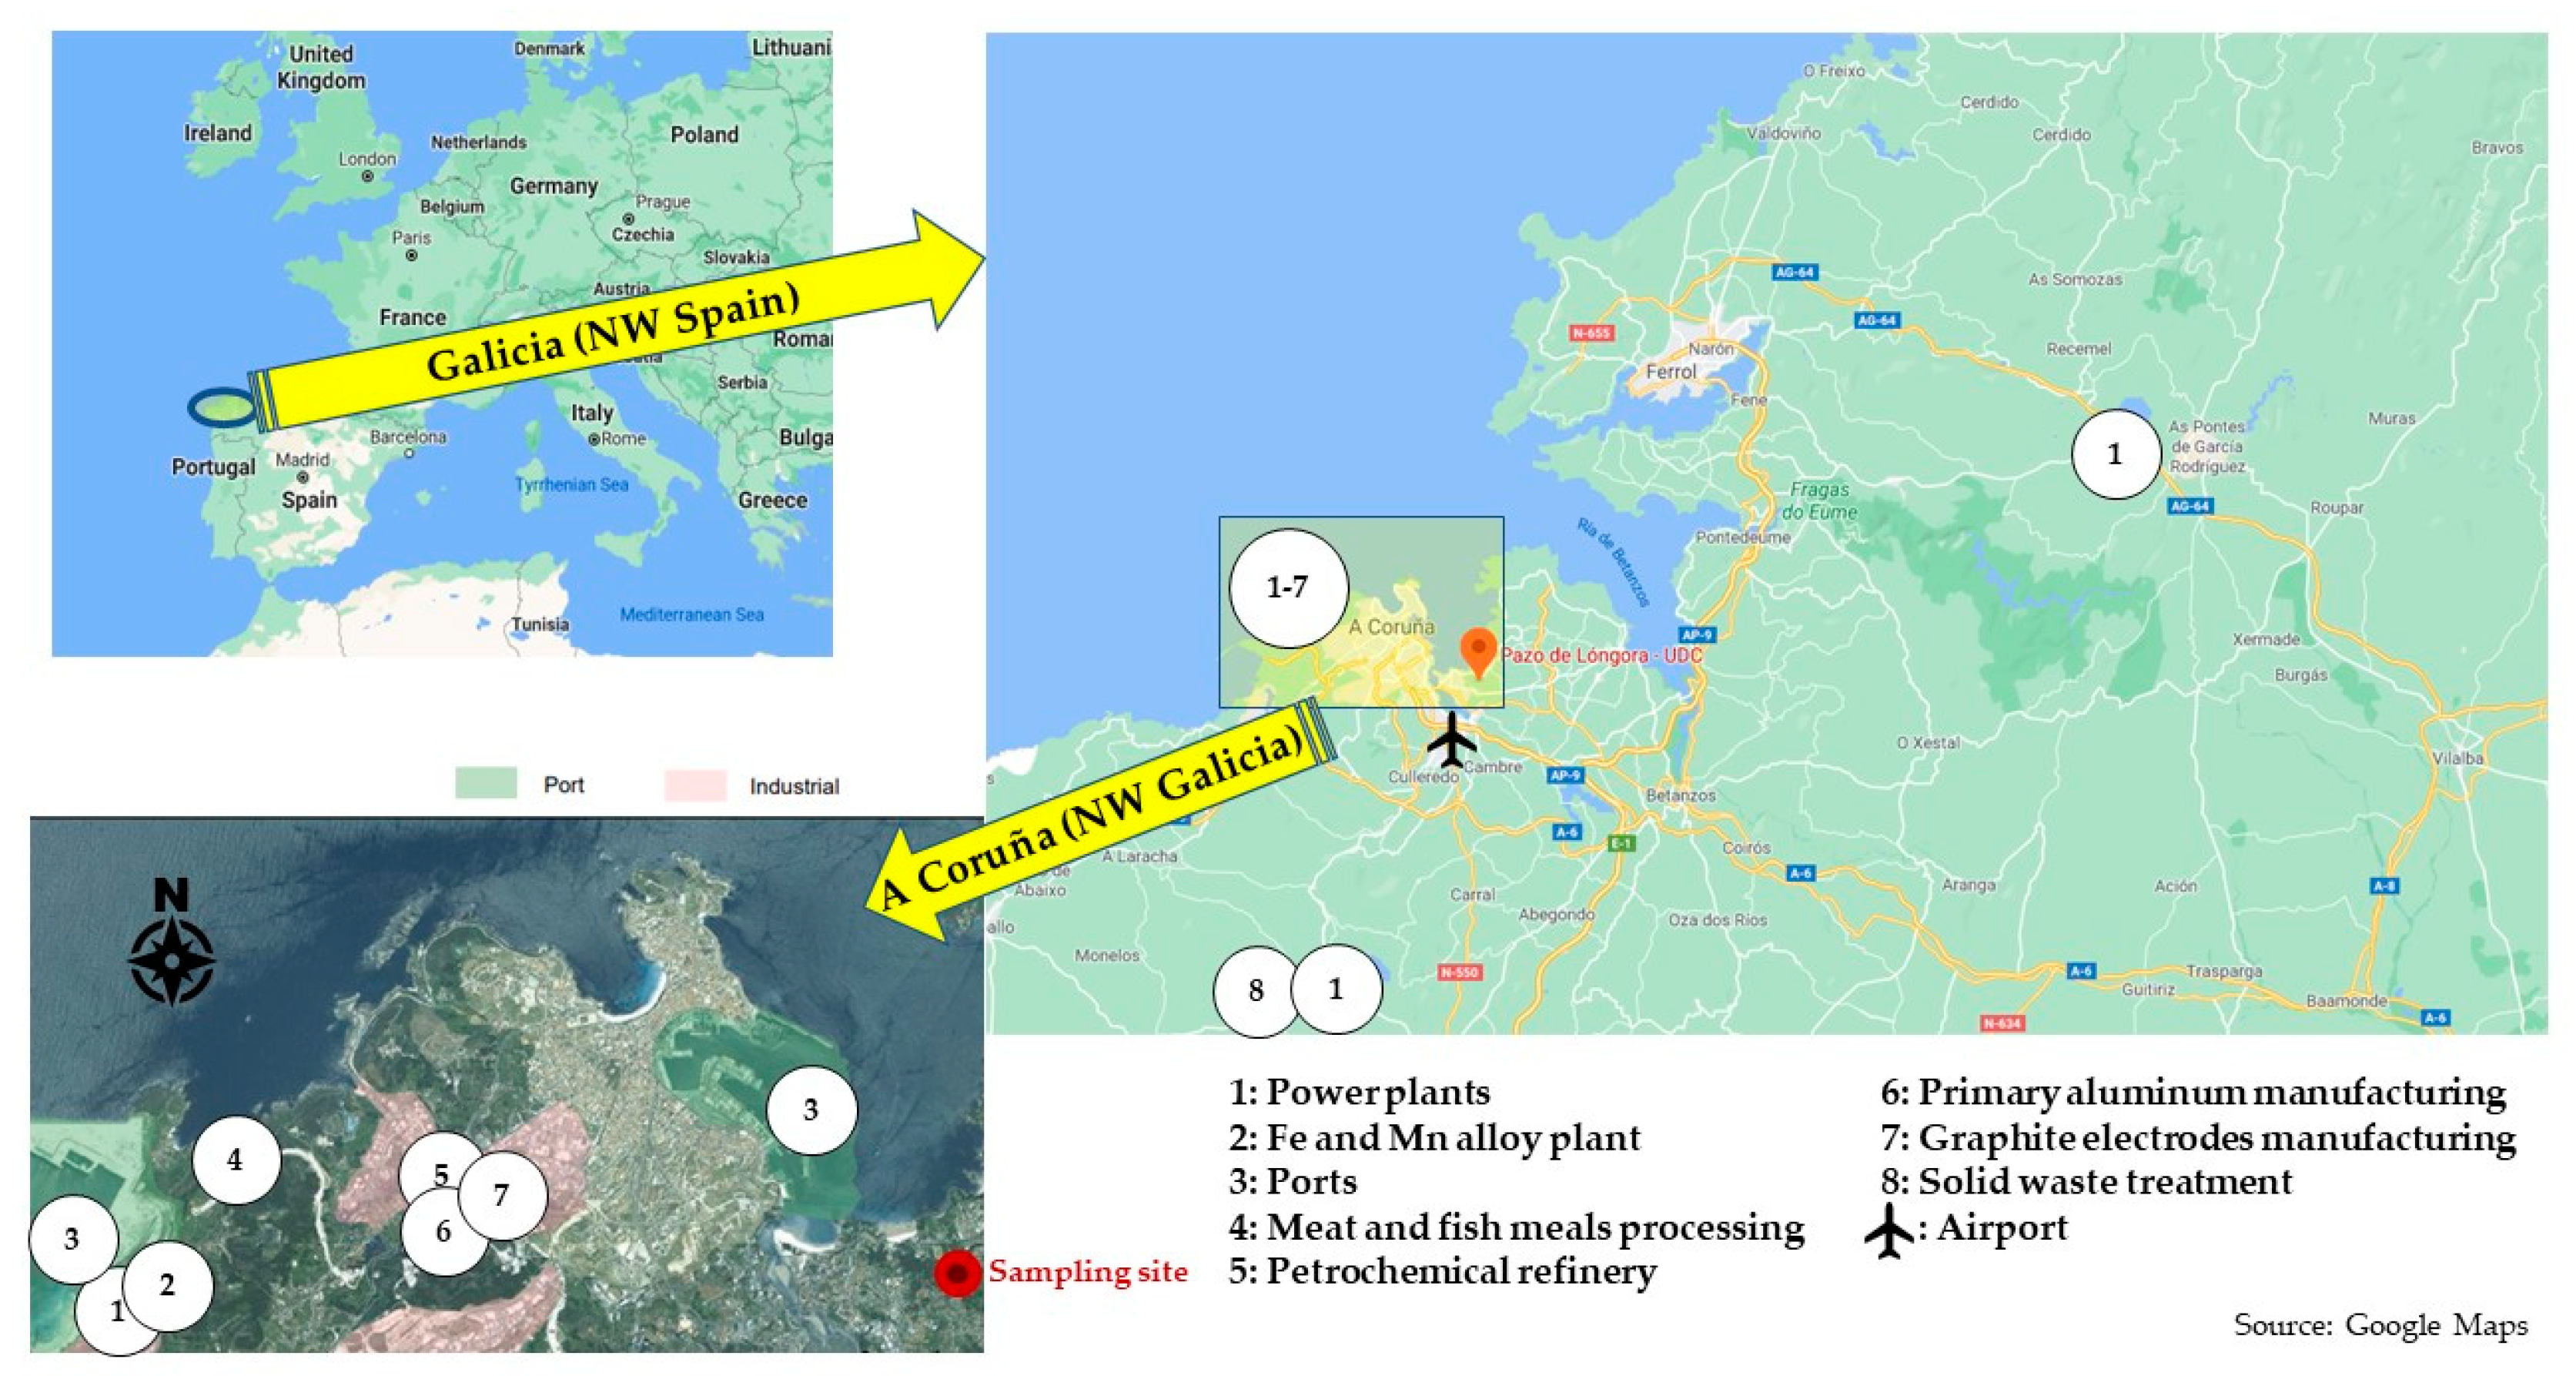
2.1. Measurement Site

The study here presented was carried out at the University Institute of Research in Environmental Studies of the University of A Coruña (43°20′11″ north (N,) 08°21′7″ west (W); Galicia, Spain). Specifically, the Institute is located in Oleiros (Figure 1), in the northwest part of the autonomous region of Galicia (NW of Spain). It is a commuter town with a low population density characterized by (i) medium traffic density, especially in summer due to tourism caused by its beach area [25], and (ii) by single family homes with heating systems based on wood combustion. The nearest populations are two small villages at 2 and 4 km distance. The closest large population is the city of A Coruña (around 250,000 inhabitants) at a distance of 10 km. There are industries close to the sampling site that can influence air quality: three power plants (10 km W, 25 km southwest (SW) and 60 km northeast (NE)), one factory for the production and transformation of metals (9 km W), an industrial area (petrochemical refinery, primary aluminum manufacturing and graphite electrode manufacturing) (10 km W), one solid waste incinerator (25 km SW), several port areas (2–11 km NW) and one airport (4 km SW). There are also other significant activities in a radius of about 15 km: paper manufacturing and processing, food and beverage plants, ports, hospitals, funerary homes, printers and laundries.
The meteorological parameters here used were measured at Alvedro Airport (43°18′00″ N, 08°22′59″ W; NOAA code: 080020-99999), and related data was accessed through the worldmet (v0.9.2; David Carslaw, 2020) package for R.

2.2. Instrumentation

eBC mass concentrations were measured using one multi-wavelength aethalometer (Magee Scientific aethalometer model AE33, Aerosol d.o.o, Slovenia), with a BGI, MiniPM® Inlet at a flow rate of 5 L min−1. Data were recorded with a 1 min time resolution. Filter-based light attenuation by the deposited aerosol particles was measured at 7 wavelengths (370, 470, 520, 590, 660, 880 and 950 nm). The eBC mass concentration was calculated using the measurement at the 950 nm wavelength with a MAC of 7.19 m2 g−1 [9].
The system used to carry out the measurements of UFP was one SMPS, operated in the scanning mode. The SMPS consists of an Electrostatic Classifier (Model 3080, TSI United Kingdom) and a DMA (Model 3081, TSI United Kingdom) connected to a Water Condensation Particle Counter (Model 3785, TSI United Kingdom). Only the data of Nt were used in this study. The sampled aerosol was dried using a Nafion® dryer. Additionally, a pre-impactor with 0.0514 cm nozzle was used. The SMPS was set with a sheath and a polydisperse aerosol flow rate of 10 and 11pm, respectively, to scan the size range between 10 and 289 nm (although this range is not properly UFP (<100 nm); it is called this way in this paper since the range is closer to the ultrafine range than to the fine range (<1 µm)). Every 5 min, the system sampled two 120 s scans per sample. Data were compensated for losses by diffusion and multiple charges with the Aerosol Instrument Manager® software (version 9.0.0., TSI, Inc., St Paul, MN, USA).
Quality control protocols were considered for both instruments, including a weekly check for verifying a correct operation and data acquisition. Sampling flows were checked on a monthly basis for SMPS, and on an annual basis for aethalometer. Moreover, several tests were performed annually for this last instrument (e.g., leakage tests). Finally, SMPS national intercomparison exercises were performed in the framework of the Spanish Network of Environmental DMAs (REDMAAS) [26] in order to evaluate the accuracy, since there are no standards to verify the correct measurement of Nt.
The sampling campaign considered in this paper was performed during the years 2015 and 2016, with data coverage close to 75% for the aethalometer and close to 55% for the SMPS.
The source apportionment of eBC was performed using the two-component model described by Sandradewi et al. [8], using light absorption measurements at 470 nm and 950 nm [27,28], since eBC from fossil fuel has a weak dependence on wavelength (i.e., AAE ~ 1), whereas eBC from biomass burning features a stronger absorption spectral dependence and shows enhanced absorption at a shorter wavelength (i.e., AAE > 1) [29,30]. The absorption at 470 nm was used, instead of the UV channel at 370 nm, to minimize the interferences introduced by types of organic compounds, based on the sensitivity of the aethalometer model due to different wavelength combinations carried out by Zotter et al. [31]. Even though 880 nm is considered the standard channel for eBC measurement by aethalometers, the 950 nm wavelength was used in this research according to the results obtained in the sensitivity of the aethalometer model using different pairs of wavelengths carried out by Zotter et al. [31]. Therefore, the analysis here conducted was based on the wavelength range 470–950 nm.

2.3. SCALA© (Version 1.1, UDC-CIEMAT, Spain)

For the purpose of this research, the software features of the first complete functional version of the web based software application called WEP-PROACLIM, which is an atmospheric aerosol data management program presented by Andrade-Garda et al. [32] and later known as SCALA© (Sampling Campaigns for Aerosols in the Low Atmosphere) (https://proaclim.udc.es) [33], had to be extended. That is to say, new functionalities (i.e., a new software increment following the software development process presented by Andrade-Garda et al. in [33,34]) were developed. Next, we will present the first version of SCALA©, then the new increment will be addressed.
SCALA© is a web-based software application that was incrementally developed in a multidisciplinary way to integrally support the documentation and the management and analysis of atmospheric aerosol data from sampling campaigns. Therefore, this software application allows the comprehensive management of the sampling campaigns’ life cycle (i.e., management of the profiles and processes involved in the start-up, beginning, development and ending of a campaign) and provides support for both intra- and inter-campaign data analysis. Thus, for example, the campaigns involving the different groups belonging to the Spanish REDMAAS are currently managed through SCALA©.
The need for SCALA© arises from the fact that such campaign management was traditionally approached in an eminently manual way. Thus, for example, date(s) and place(s) for a campaign were agreed upon after a huge exchange of mails and, or, telephone calls (or using Doodle in the best case), and data processing and analysis were performed by integrating and managing (through Dropbox or Google Drive in the best case) a hand-made spreadsheet created by the environment technicians. Obviously, a great effort of format standardization was previously required for this integration. After that, to proceed with the data analysis, it was also necessary to have a skilled (error-prone) handling of, for example, a spreadsheet like Excel and/or a programming language like R [35]. In brief, there was no software application supporting, in a holistic way, the work related to all the sampling campaign activities. Accordingly, SCALA© was developed as a holistic solution, avoiding arbitrary errors in the manual handling of data (thus achieving efficacy) and optimizing the effort (thus achieving efficiency). As an example of the latter, it should be pointed out that the effort required to prepare the data files for uploading to the ACTRIS (Aerosols, Clouds and Trace gases Research InfraStructure network; the reference network in Europe [36]) website could be up to a month of work the first time; due to its complex format and, mainly, to the ad hoc work needed depending on each measuring instrument considered. The standardization of the data files for SCALA© takes less than thirty minutes, and much less even if, for example, macros are used. Moreover, the call for campaigns, the work during the campaigns and the data analysis have been fully integrated into a unique software application. Thus, once the data has been uploaded, the data analysis of both intra- and inter-campaigns is available immediately in SCALA©.
SCALA© integrates (i) a public section (in Spanish), to promote and inform about related research activities or projects in the Spanish R&D Plan; and (ii) a private functional section (in English or Spanish, depending on the registered user’s preferences), for managing and analyzing data and documentation from campaigns. There are five user profiles: administrator (technical administrator of the software application), group manager, campaign manager, technical user and external/guest/anonymous user (i.e., a non-registered user, who can request access). Next, the three main profiles are briefly described along with the most relevant features of SCALA©. More details are described by Andrade-Garda et al. [33].
  • Group manager: Responsible for a group of environmental technicians. She/he manages the members and the measuring instruments of her/his group, votes in surveys about the campaigns the group has been invited to, and sets the configuration for the group equipment in campaigns.
  • Campaign manager: The group manager that registers a campaign in SCALA© and, therefore, is responsible for managing the campaign life cycle (i.e., invitations to groups for participation in the campaign, campaign surveys for date and place agreement, campaign opening and campaign closing).
  • Technical user: A member belonging to a group of environmental technicians. Its main features are the following: Data files, documentation and incident uploads, and intra- and inter-campaign analysis (data files selection, charts selection, and exportation options selection).
With regards to the above-mentioned new software increment for SCALA©, required to meet the new management needs arising from the new research presented in this paper, it was developed by a subset of the original multidisciplinary team following the same software development model used for the first version. This new increment mainly considered the possibility of adding aethalometers into the measurement instruments set managed by a group manager, along with the corresponding new functionalities regarding data file uploads, graphical representations and statistical analysis. Basically, and for what concerns here, this new software increment focused on the technical integration of SCALA© with R in order to (i) embed new plots (percentile rose plots, conditional probability function plots, and bivariate polar plots) into SCALA© and (ii) represent eBC concentrations from the aethalometers jointly with data already in SCALA© (i.e., particle number size distributions from SMPSs). The statistical elaborations here presented were embedded into SCALA© thanks to the mentioned technical integration with R; specifically, with R’s openair [37] package. Briefly, SCALA© server actually invokes (i.e., “exec” in Computing) R features (in the SCALA© server), and the results coming from R are embedded into the web pages served to the user (web browser). In this manner, the R programming and testing activities are completely hidden from the user (environmental technician). Moreover, the user does not need to have R installed in her/his computer (computationally speaking, the client). All this (i) avoids computing and testing activities by non-technical users, (ii) avoids handling errors, (iii) automates and integrates the analysis into a single environment and (iv) reduces the required client’s computational power.

3. Results and Discussion

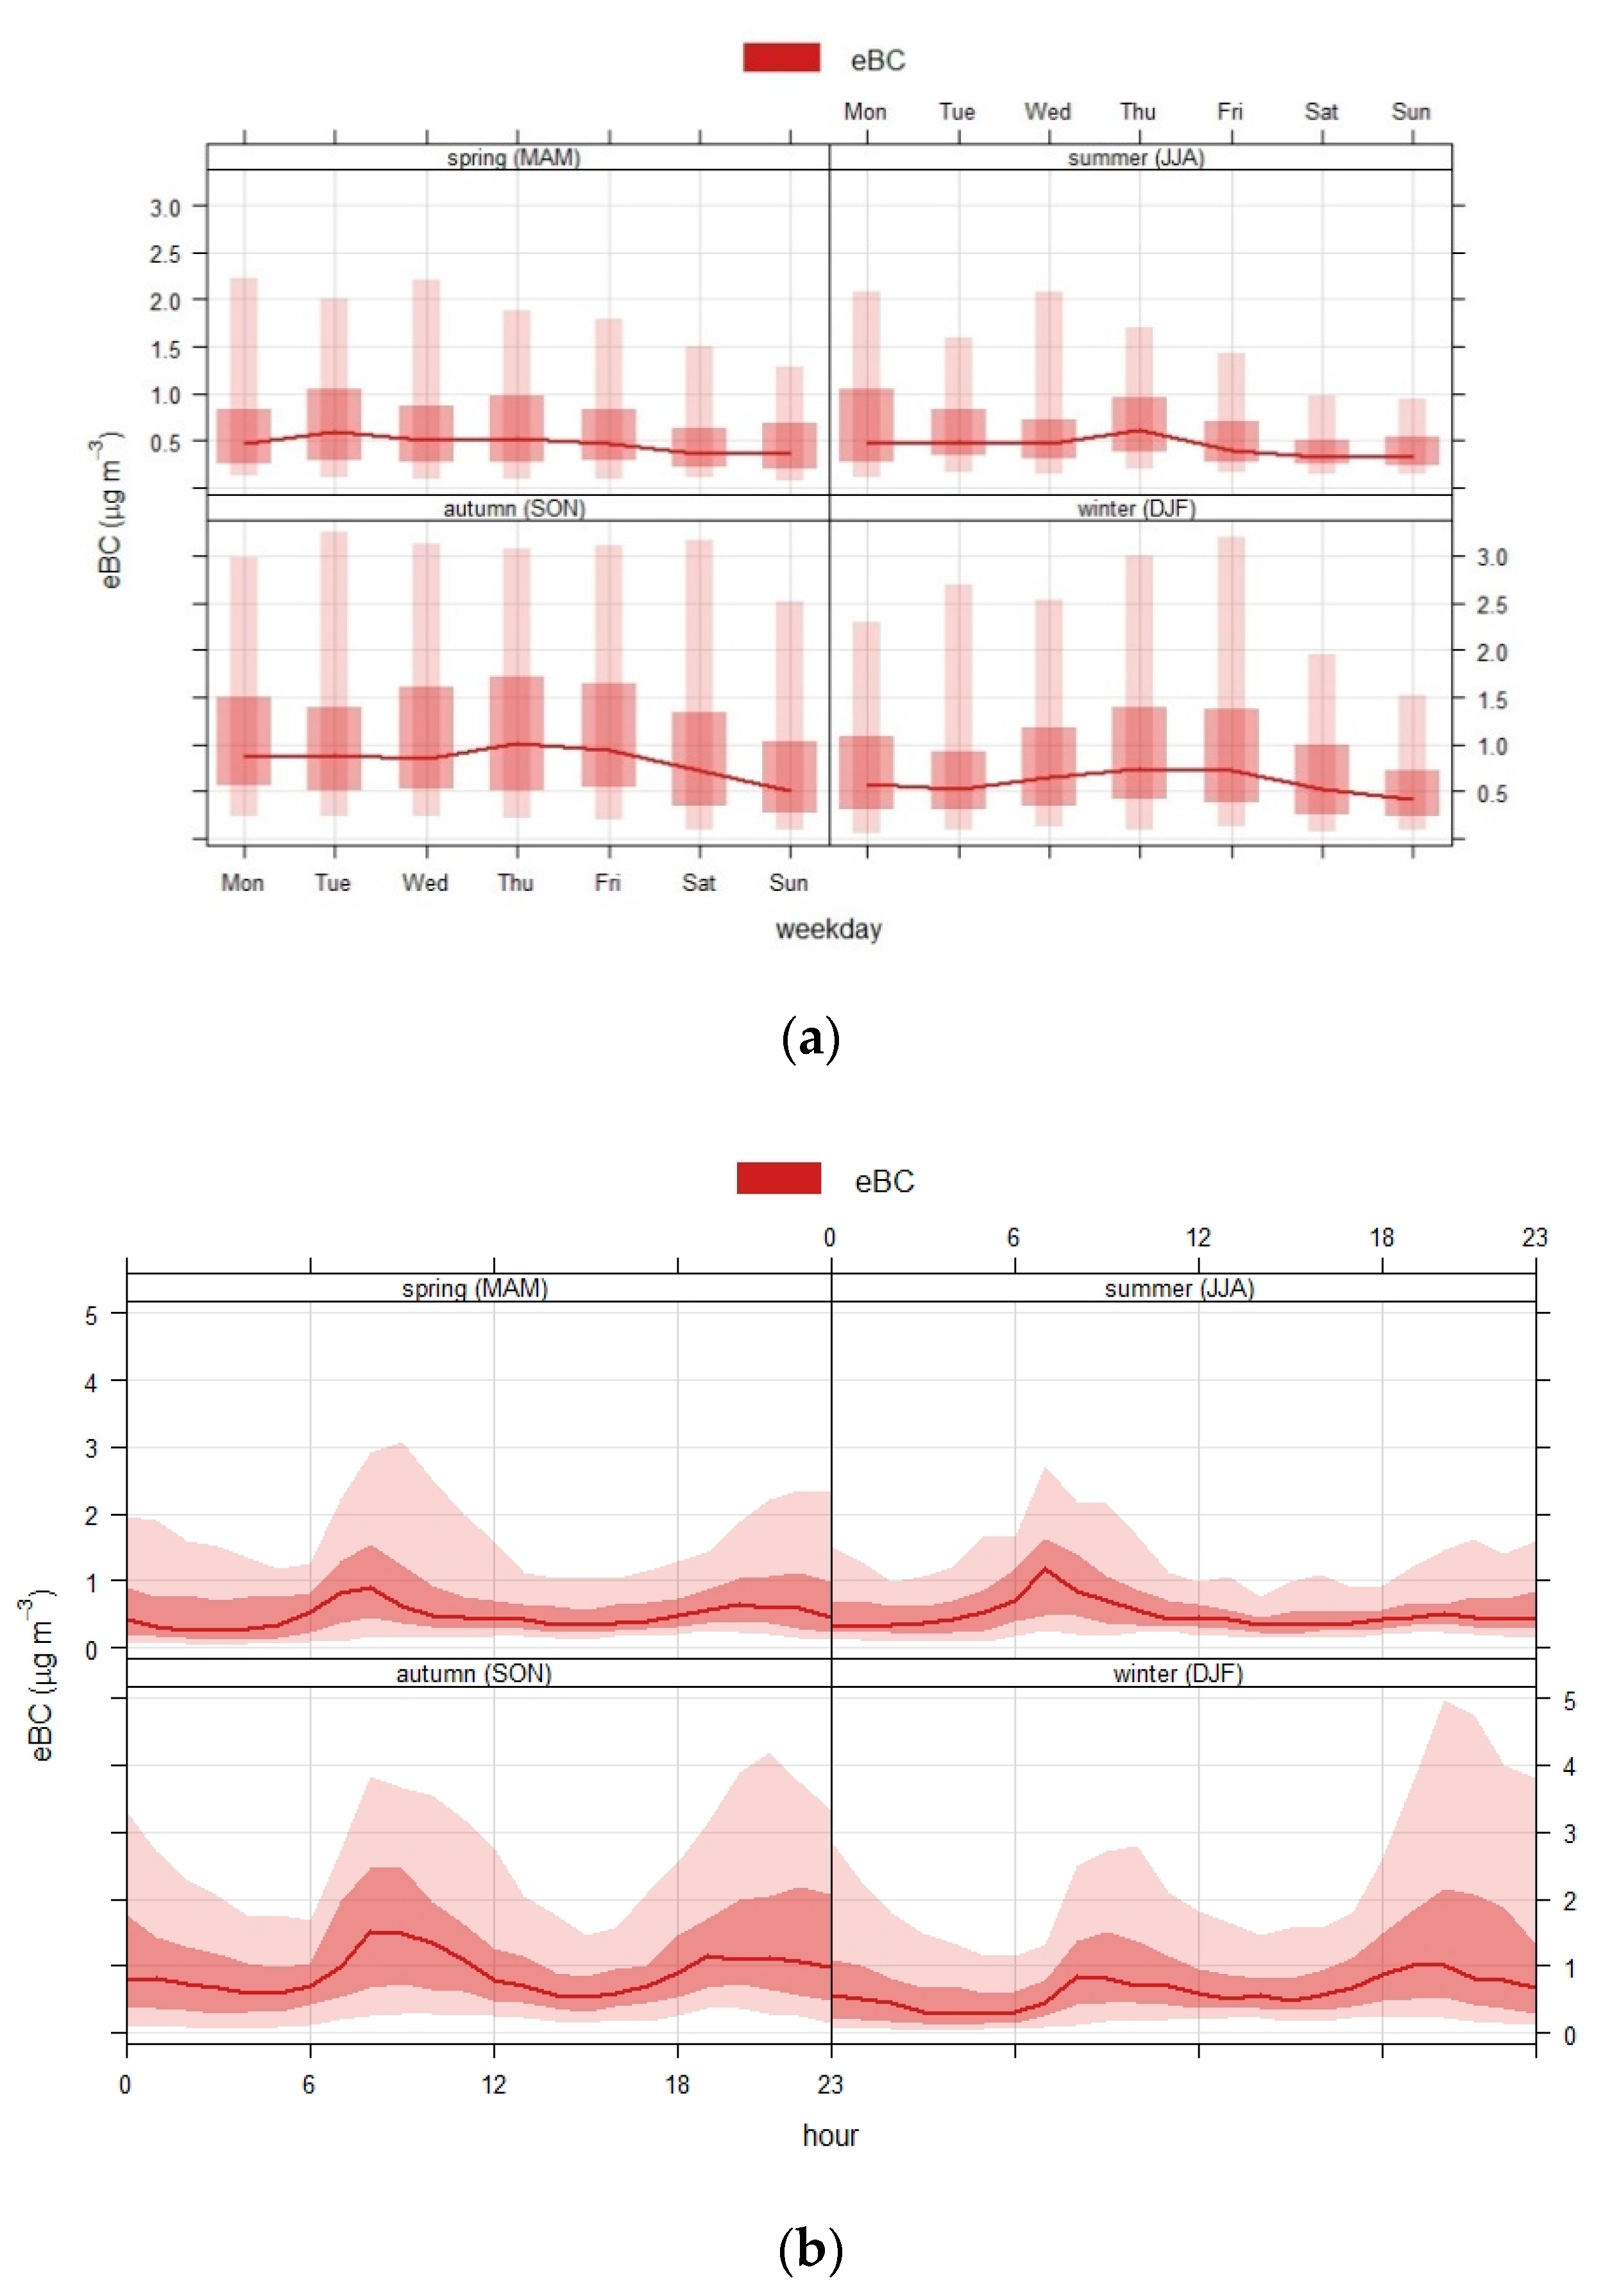
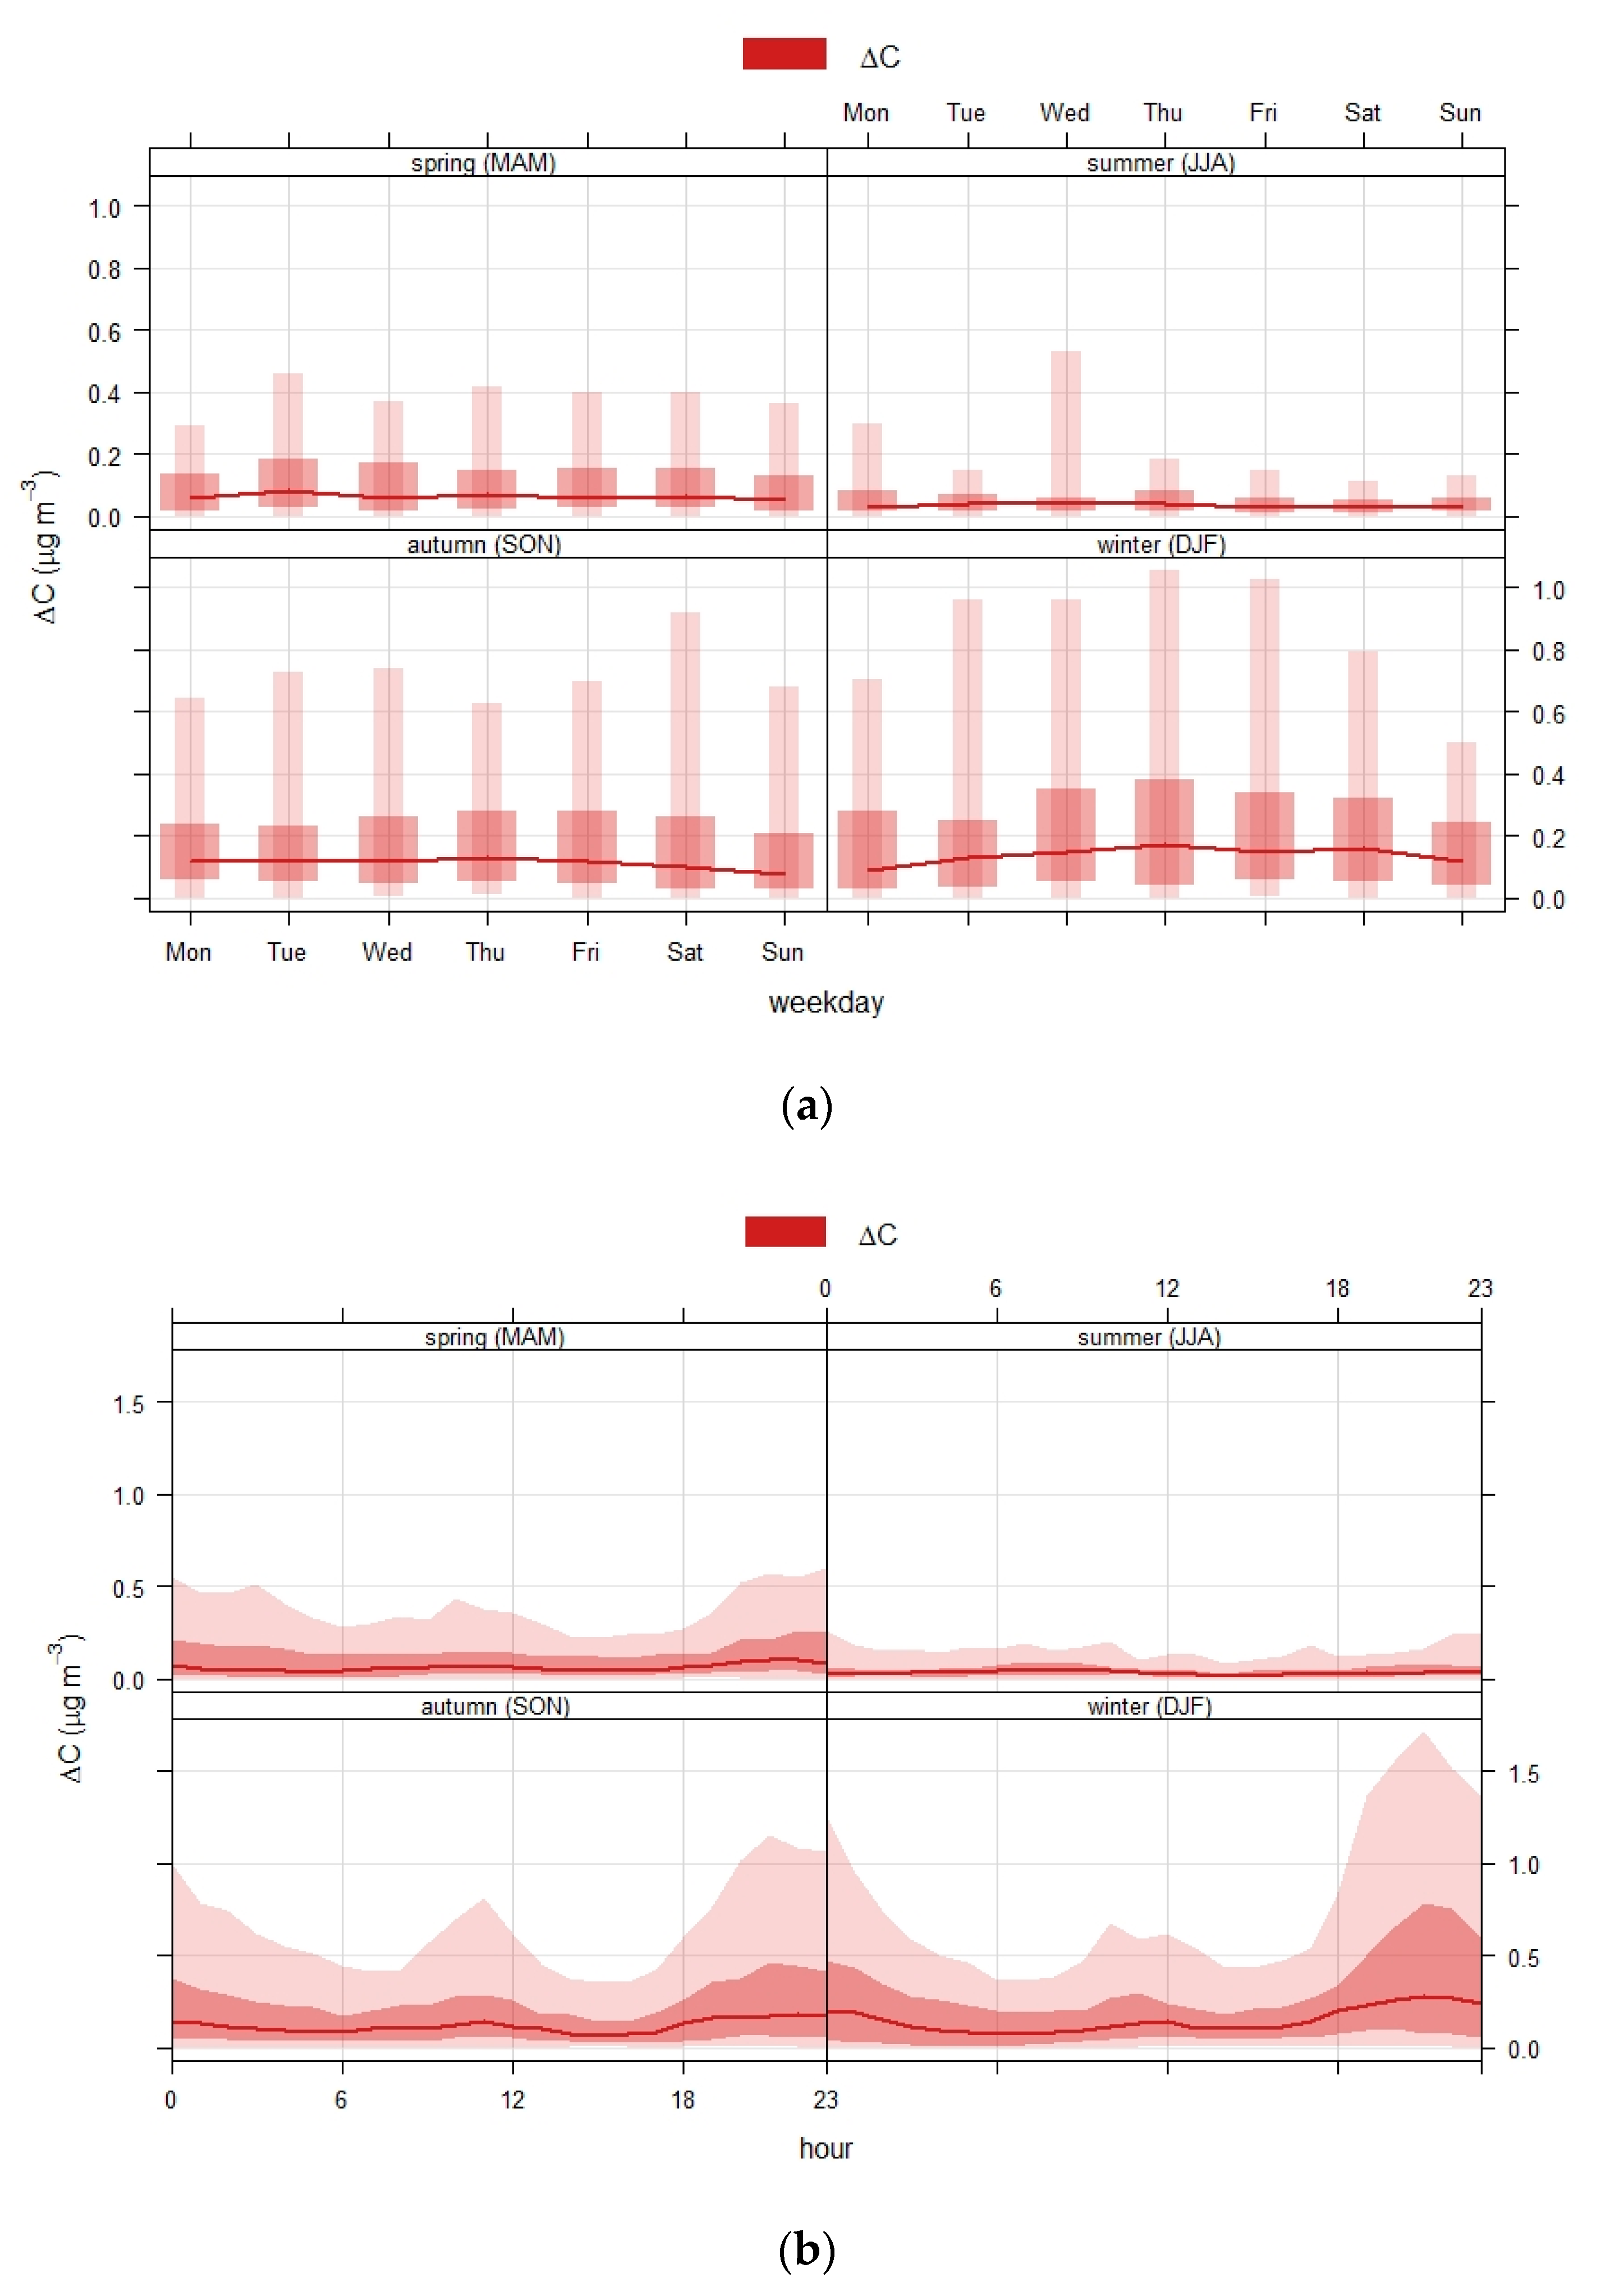
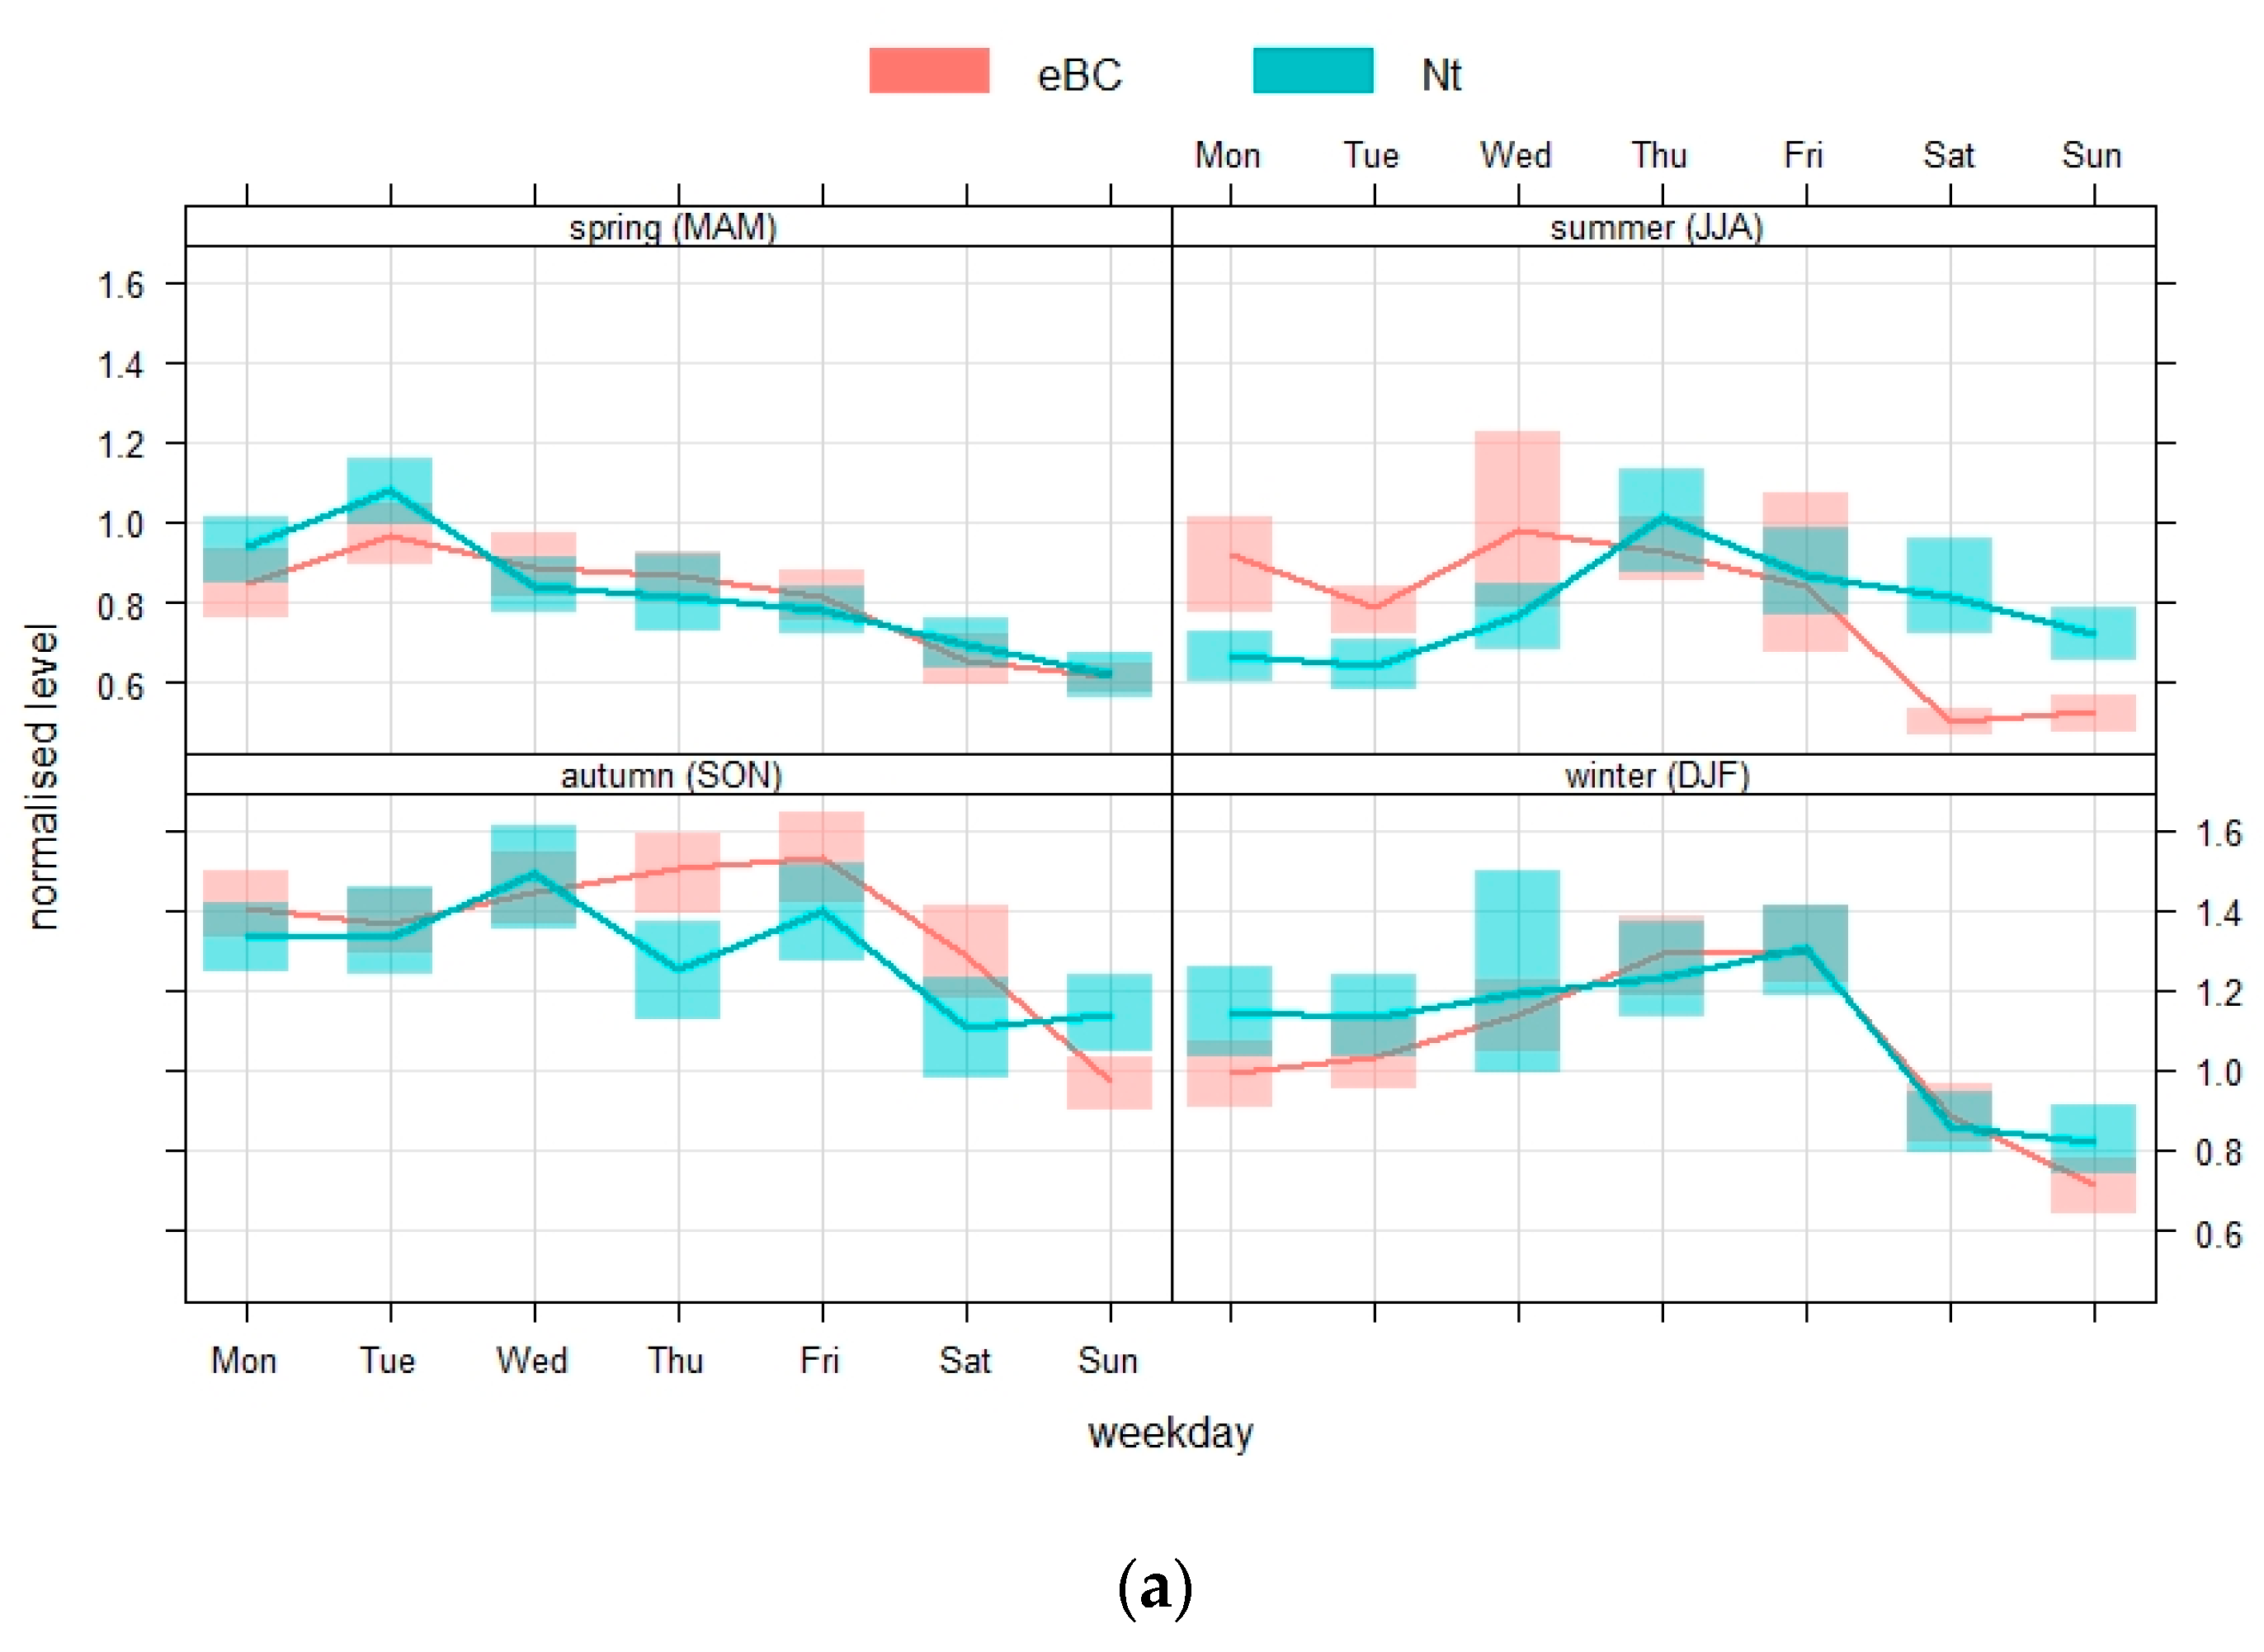
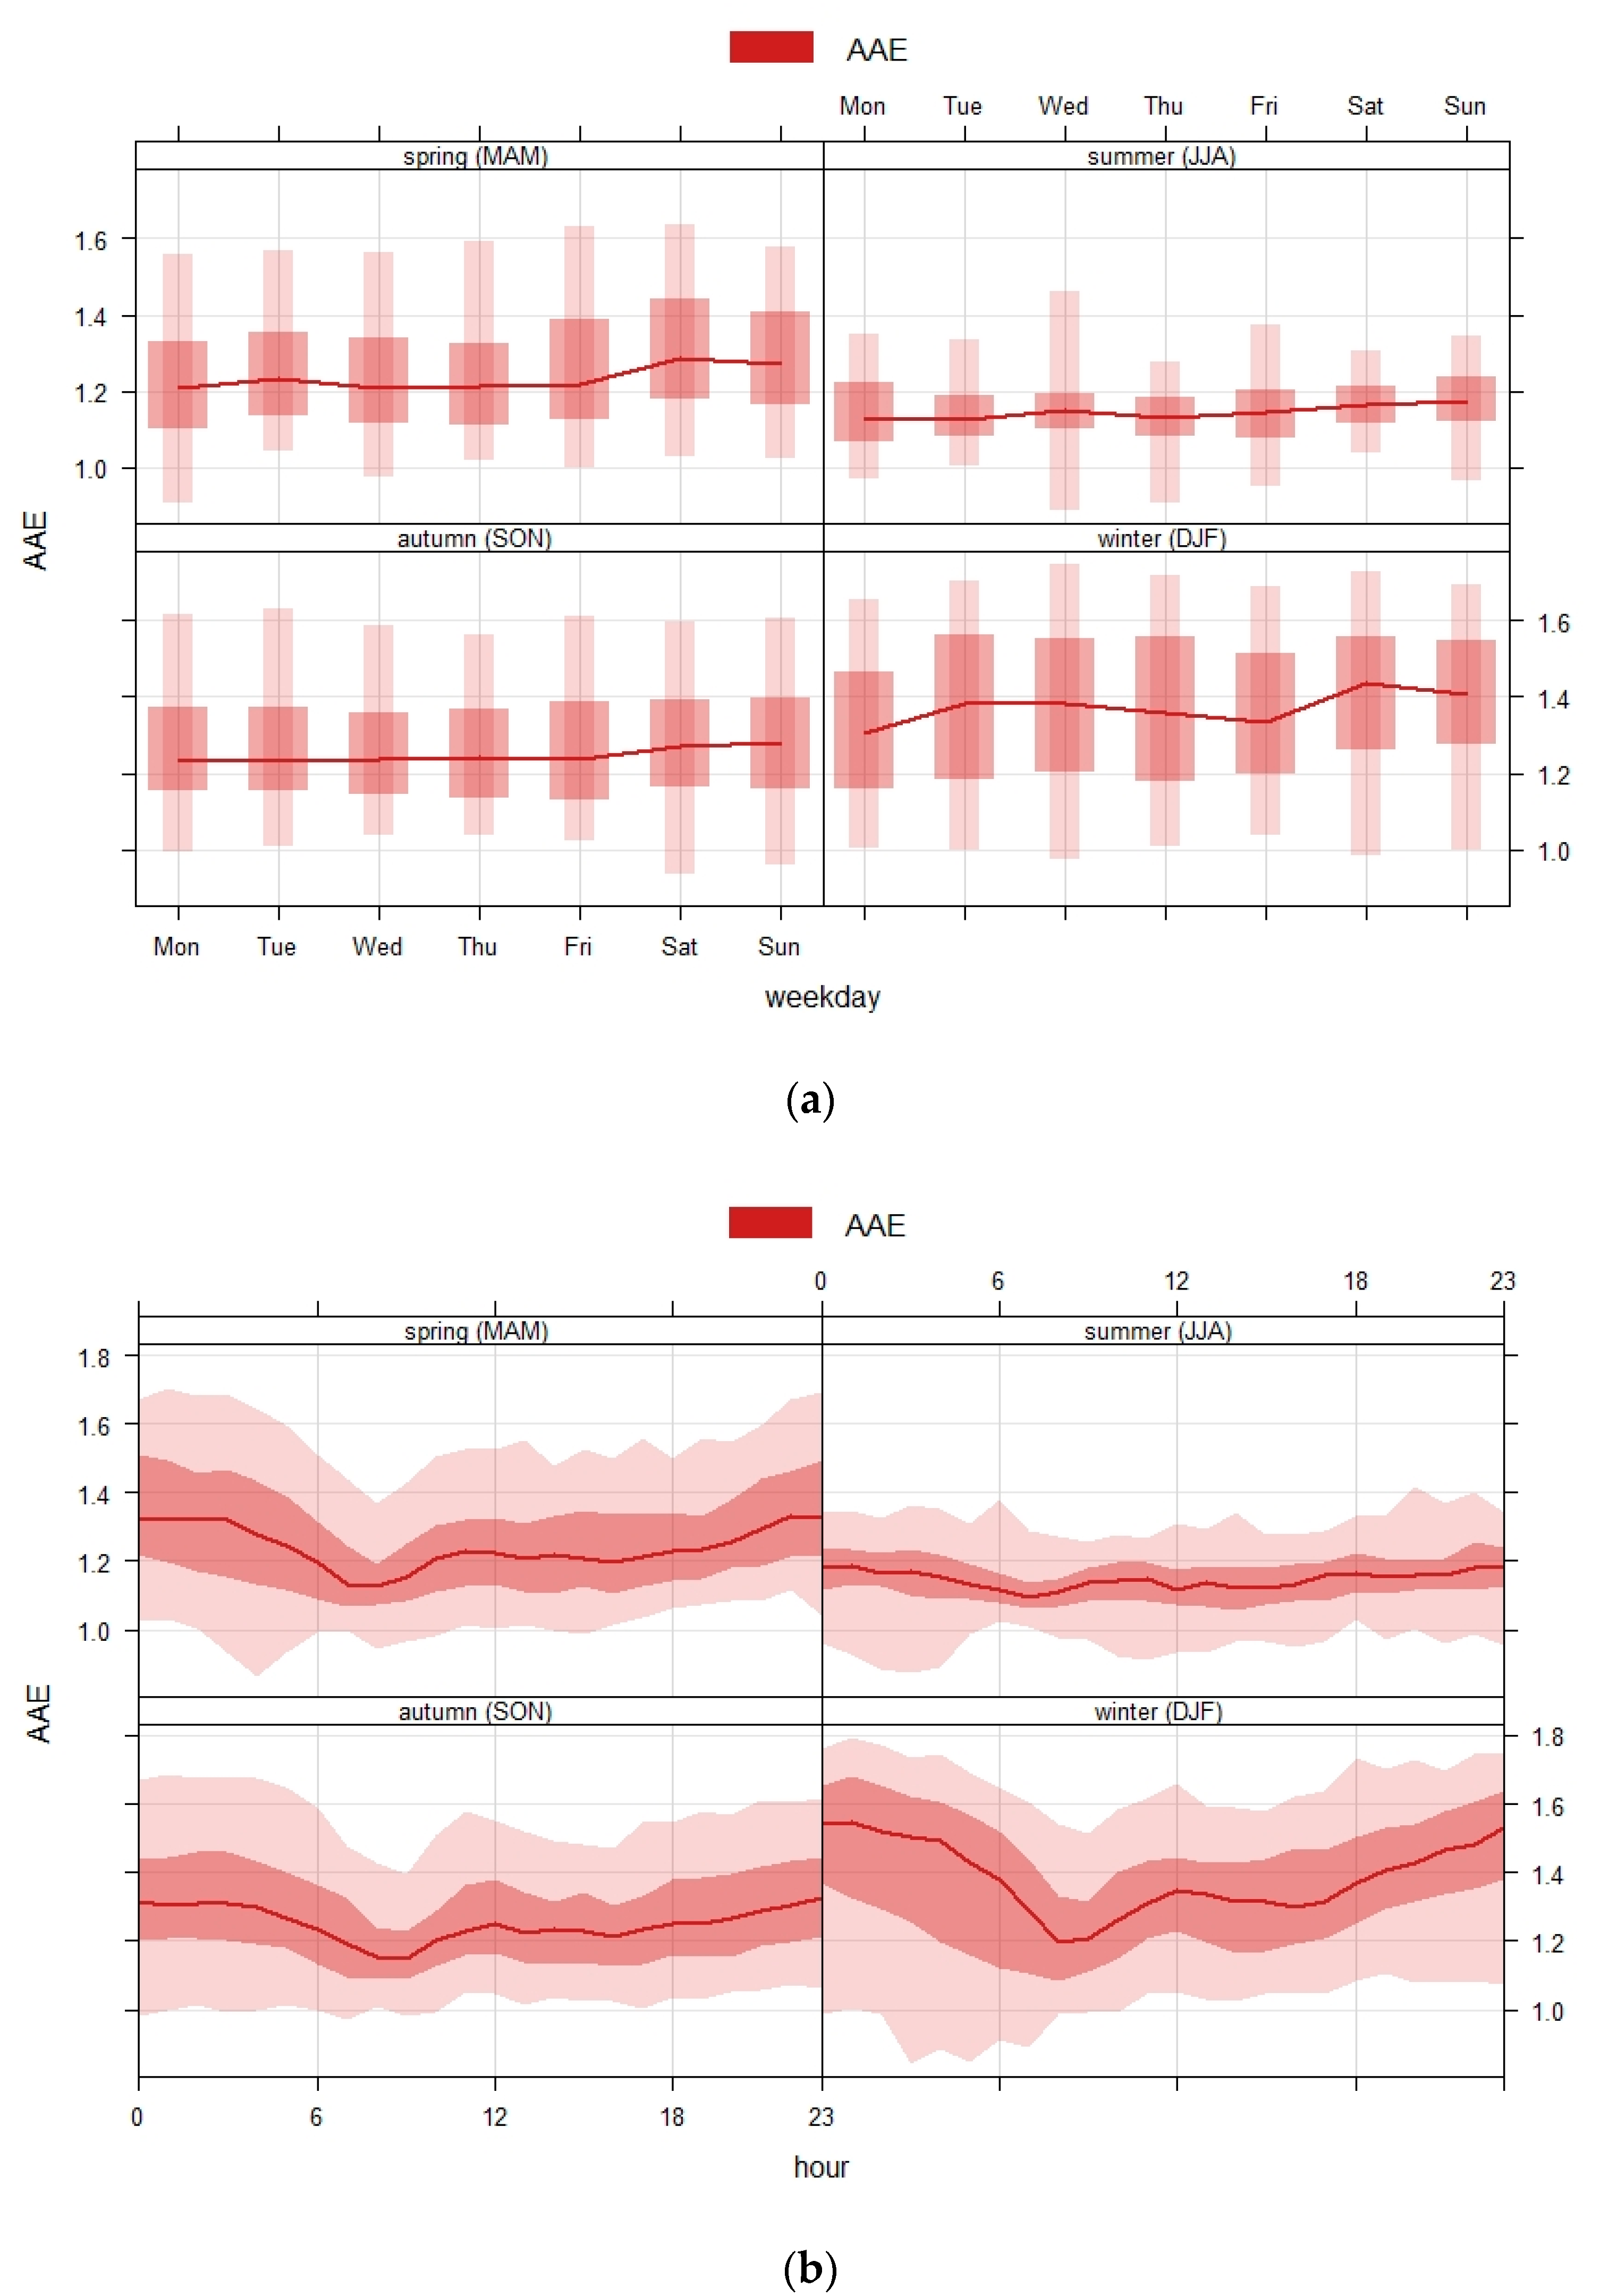
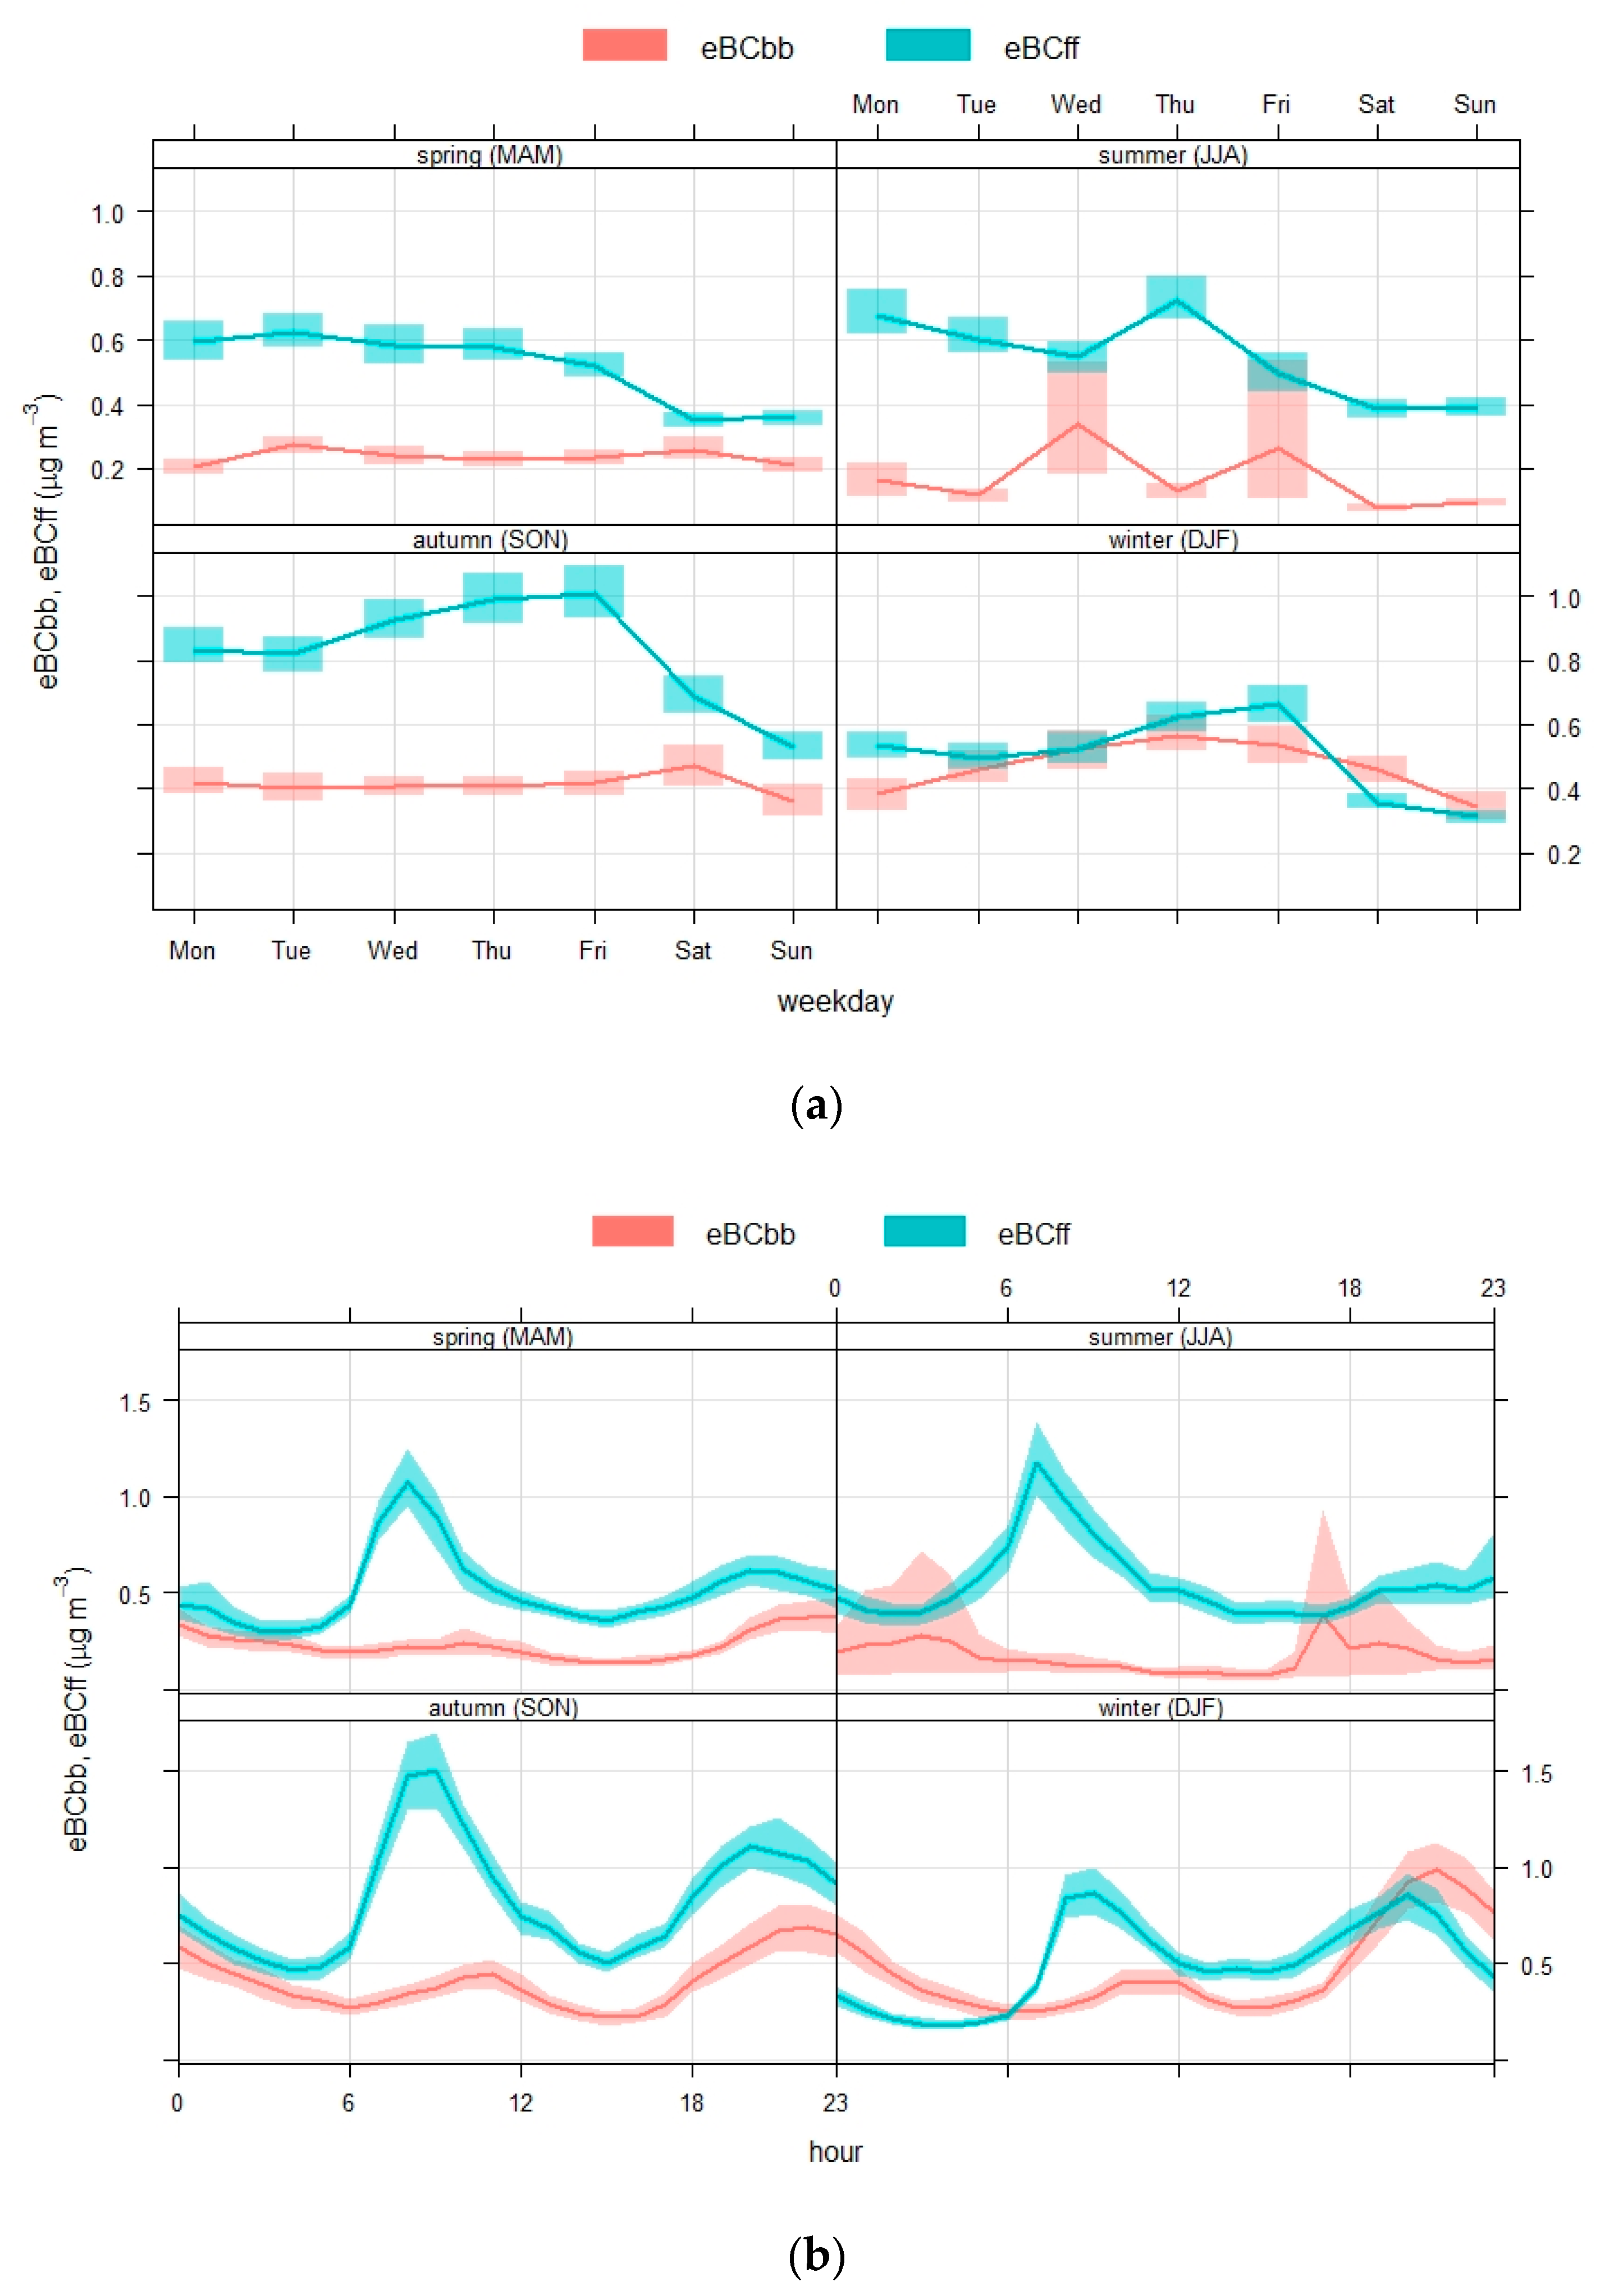
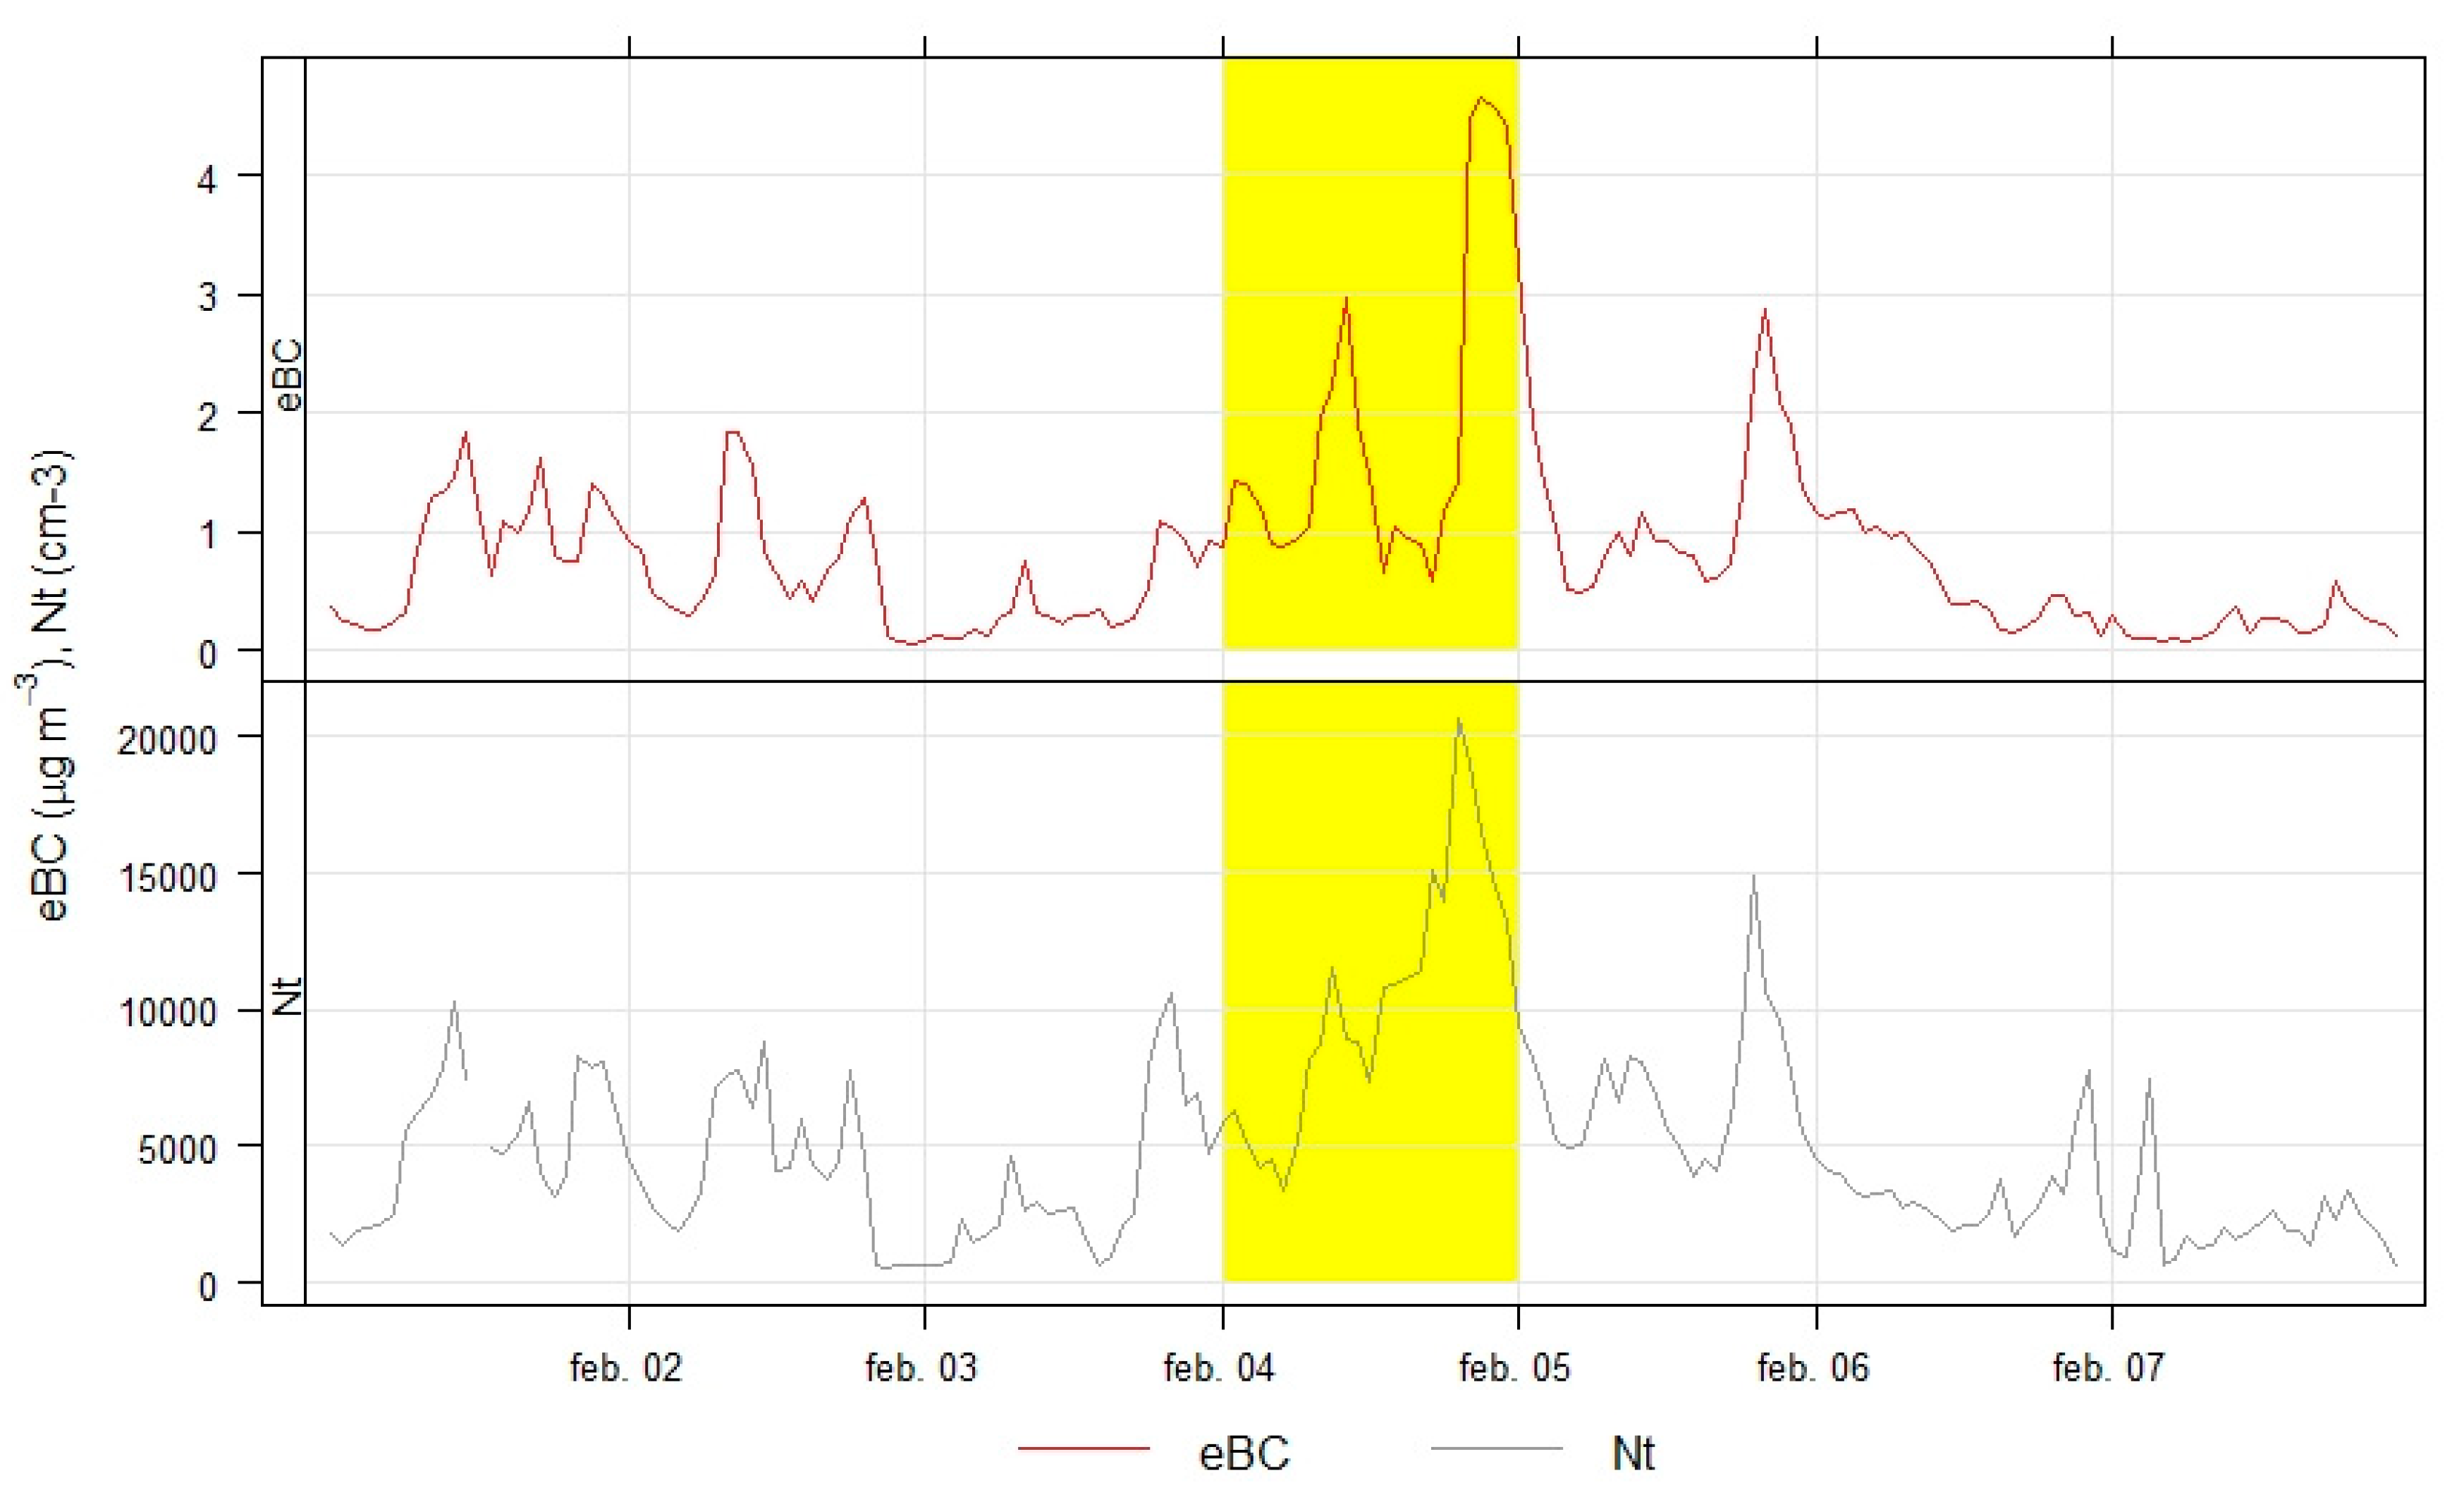
3.1. eBC Mass Concentrations

The mean eBC value ± standard deviation obtained at this site during the period of study was 0.85 ± 0.83 µg m−3. The measured values were lower than those measured in other sites around Europe (Table 1).
In Figure 2a,b a combination of several variations is shown: hourly, weekly and monthly plots of eBC concentrations divided by season. With regard to the hourly variations, two peaks were detected during the day: one in the early hours and another in the evening, with differences in the mean concentrations (values were higher in the evening peak during winter than in the other seasons). These differences are likely to be related to the combination of anthropogenic emissions and boundary layer dynamics. An increase in eBC concentrations during the early hours can be explained by the increase of anthropogenic emissions and due to the formation of a nocturnal boundary layer (NBL), which favors the accumulation of pollutants. A decrease in eBC concentrations during the middle hours of the day is likely to be associated with a reduction of these emissions (from domestic heating and traffic) and due to a gradual increase in boundary layer height and wind speed. This fact enhances the vertical and horizontal diffusion of pollutants. A similar diurnal variation in eBC concentrations were observed in Ostrava [40] and urban sites of Barcelona and Granada [14]. A marked difference between workdays and weekends was also observed, pointing to traffic as the most important emission source of eBC in this area.
In order to study the possible influence of near emission sources, data were represented as a percentile rose plot of eBC concentrations (Figure 3). The percentile intervals are shaded and shown by wind direction. The plot shows the variation by season and whether it is night-time or daylight hours (note that the open-air package estimates sunrise and sunset to give either daylight or night-time. This estimation, valid for dates between 1901 and 2099, is made using the location, date, time and astronomical algorithms to estimate the relative positions of the Sun and the location on the Earth’s surface. For the sampling site here considered, for example, daylight hours in January range from 8 a.m. to 5 p.m. UTC). eBC concentrations are higher on average in the autumn and winter and when the wind comes from the south. The reason is most likely due to the presence of single family homes with heating systems based on wood combustion in this wind direction. eBC concentrations are somewhat higher at night-time in spring compared to daylight hours and higher during daylight hours in summer when the wind comes from the south-east. In this case, the influence of road traffic could be the main source of this pollutant in this wind direction.
The Conditional Probability Function (CPF) is a commonly used approach when identifying atmospheric pollutant sources, since it provides directional information concerning major sources (i.e., it shows which wind direction and wind speed intervals are dominated by high concentrations and give the probability of this occurring) [43,44]. Figure 4 shows a CPF plot for eBC over the entire sampling period. It is clear that the highest concentrations (95th percentile eBC concentration: 2.5 µg m−3) are dominated by south and easterly wind directions. In this case, these directions correspond respectively to (i) a group of single family homes and (ii) one of the most transited roads near to the sampling site. There are very low conditional probabilities of these concentrations being experienced for other wind directions. That is to say, apportions coming from the closest large population city (A Coruña) or coming from the industrial area above-commented are not relevant, as well as the ones coming from the sea (NW winds). Very similar results are observed when representing the CPF plot over the sampling data segmented by the seasons of the year.
With the AE33 aethalometer, ultra-violet light absorption can be assessed. Thus, the independent effect of background wood smoke particles can be identified where wood burning is a major source of personal exposure to carbonaceous particles [45]. Wang et al. [46] commented that organic components of wood smoke particles absorb light at 370 nm more effectively than 880 nm. As commented above, this enhanced absorption (ΔC = BC (370 nm)—BC (880 nm)) can serve as an indicator of residential wood smoke particles. In this paper, the enhanced absorption was calculated for absorption at 470 and 950 nm, respectively. As can be seen in Figure 5a,b, the ΔC median values were substantially higher during cold seasons compared to warmer seasons, as was also reported by Wang et al. [46] (these authors found a difference between winter and summer of ΔC = 0.18 µg m−3 (0.24–0.06 µg m−3)). During summer, a high dispersion of concentrations was found, probably due to episodes of biomass burning. The diurnal pattern showed an evening peak probably due to the use of biomass for domestic heating in the single family homes near to the sampling site.

3.2. UFP

To compare the levels of UFP at this site with those in other cities, the Nt concentrations were computed obtaining the mean ± standard deviation of 3825 ± 4023 particles cm−3 for the entire sampling period. These concentrations were lower than those reported in the studies summarized in Table 2, probably due to (i) the different diameter range measured and, (ii) the different characteristics of the sampling site. It is important to note that in most cases, the sampling period was shorter than the sampling period in this study.
Nt is about, in real number concentration, 4500–5000 particles cm−3 in autumn and winter, and decreases to 2800–4000 particles cm−3 in spring and summer. Nt shows clear diurnal cycles, similar to eBC concentrations (Figure 6a,b) in autumn and winter, which points to traffic as the major source of this pollutant. This variation was also observed in two campaigns across Spain during 2012 and 2016 in the REDMAAS framework, one of the sampling sites being the University Institute of Research in Environmental Studies [1]; and also in the urban background sites in Leicester [15]. It is important to highlight the peak at 12 in spring and summer, as also has been reported in other papers [48], when the high insolation (i.e., high solar radiation) favors new particle formation. The high peak of Nt between the hours from 0 to 6 a.m. in winter (Figure 5b) could be explained as follows: the nocturnal reduction of the mixing layer height, along with the increase in the concentration of some gases and the decrease in temperature, can produce this increase in Nt.
With regard to Nt concentrations, they are higher on average in the autumn and winter and when the wind comes from the south and east (Figure 7). But in summer during daylight hours Nt increases with different wind directions (east, northeast and southwest). Additionally, but in less proportion, Nt increases in spring, both during daylight hours and night hours, when wind comes from the northwest (from A Coruña city and its industrial area).

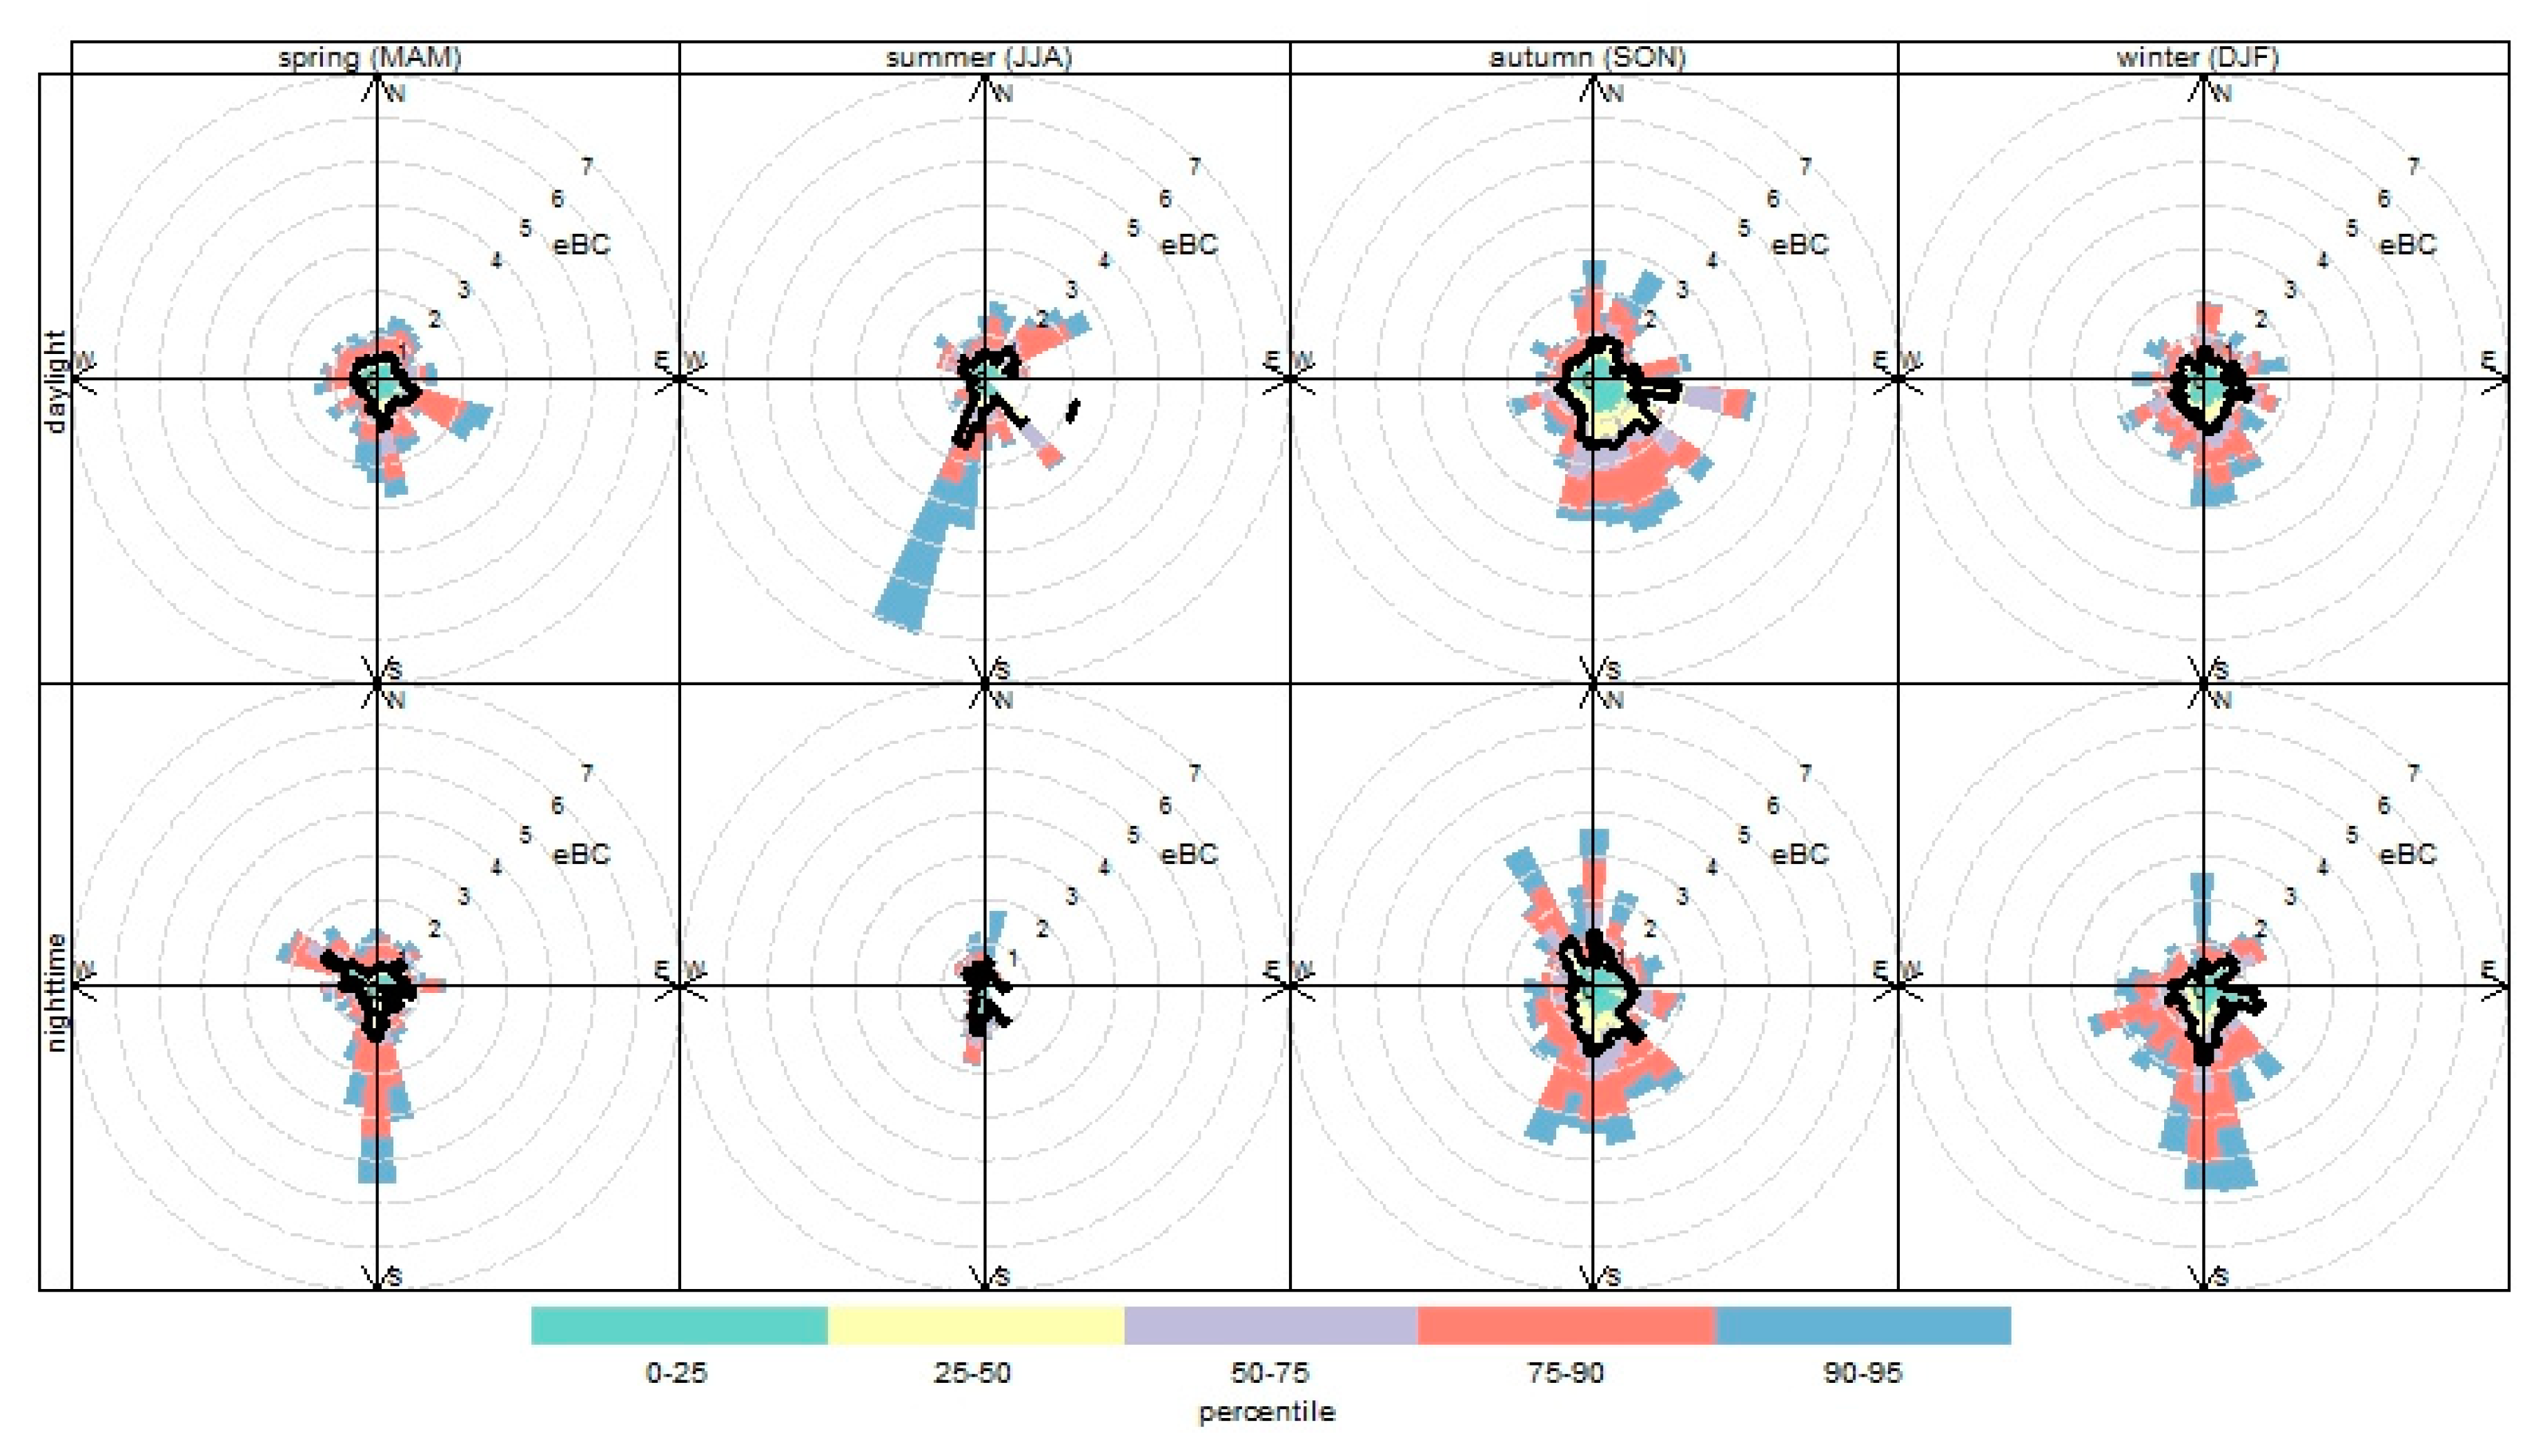
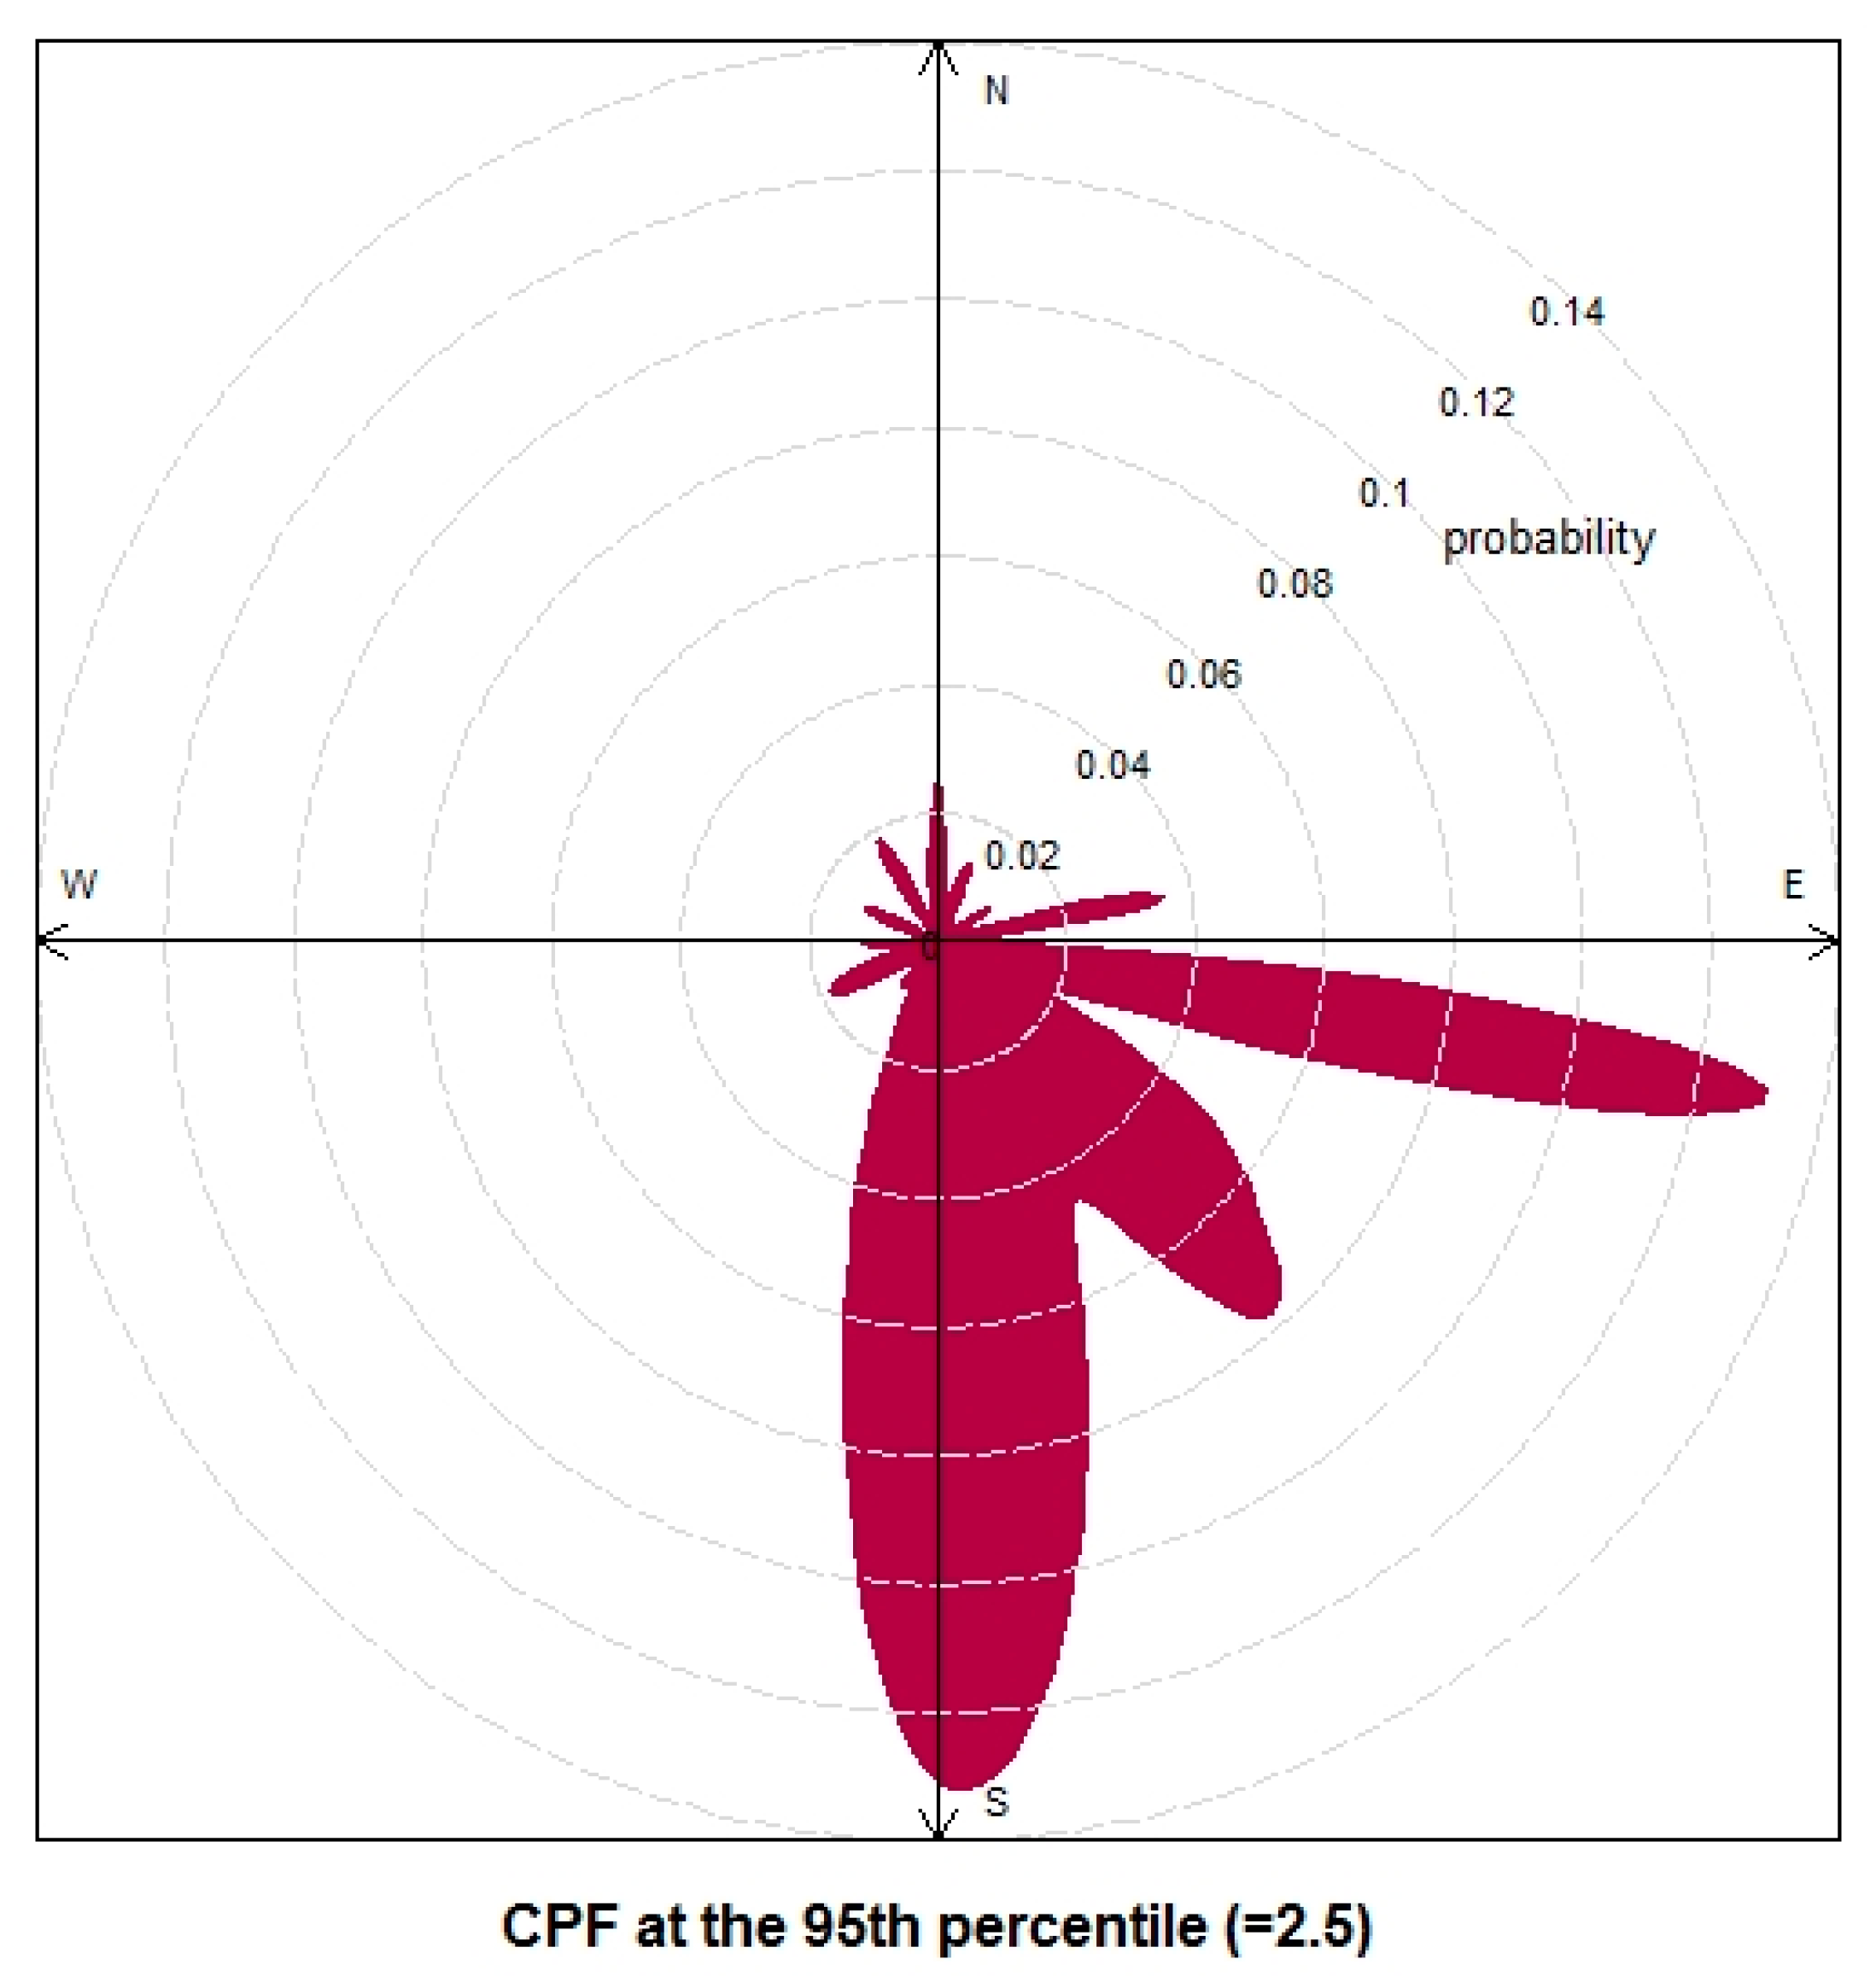
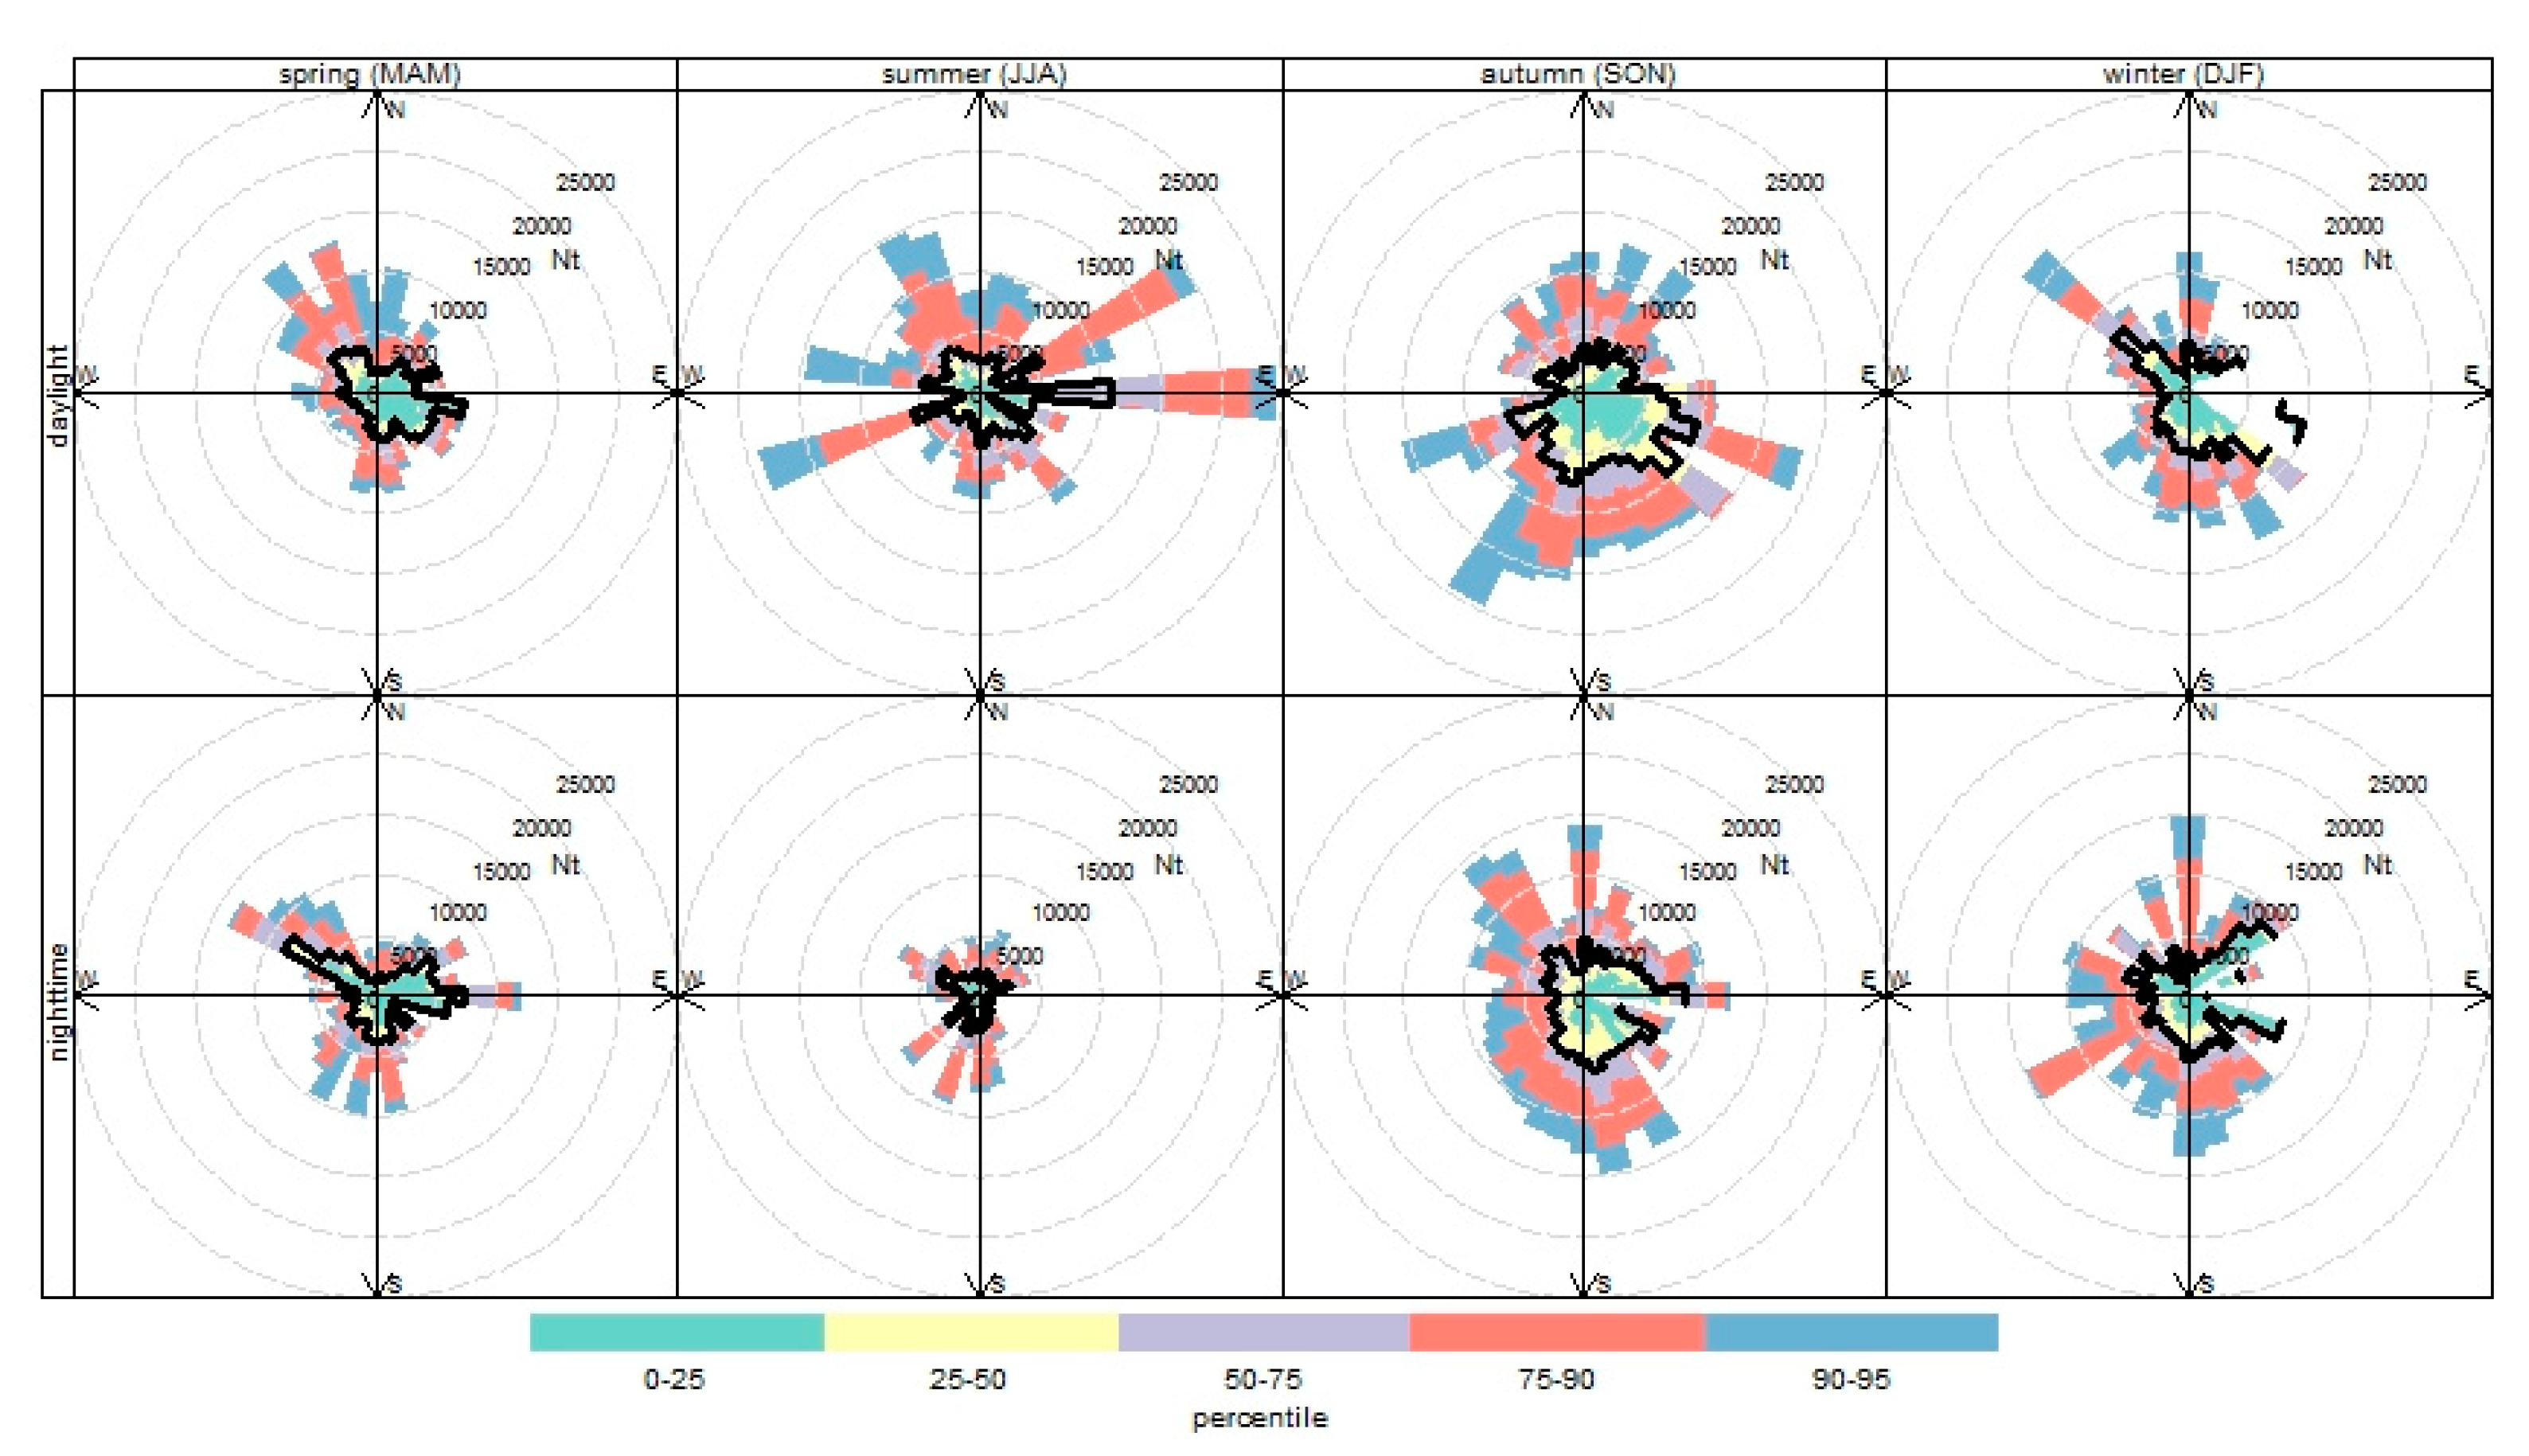
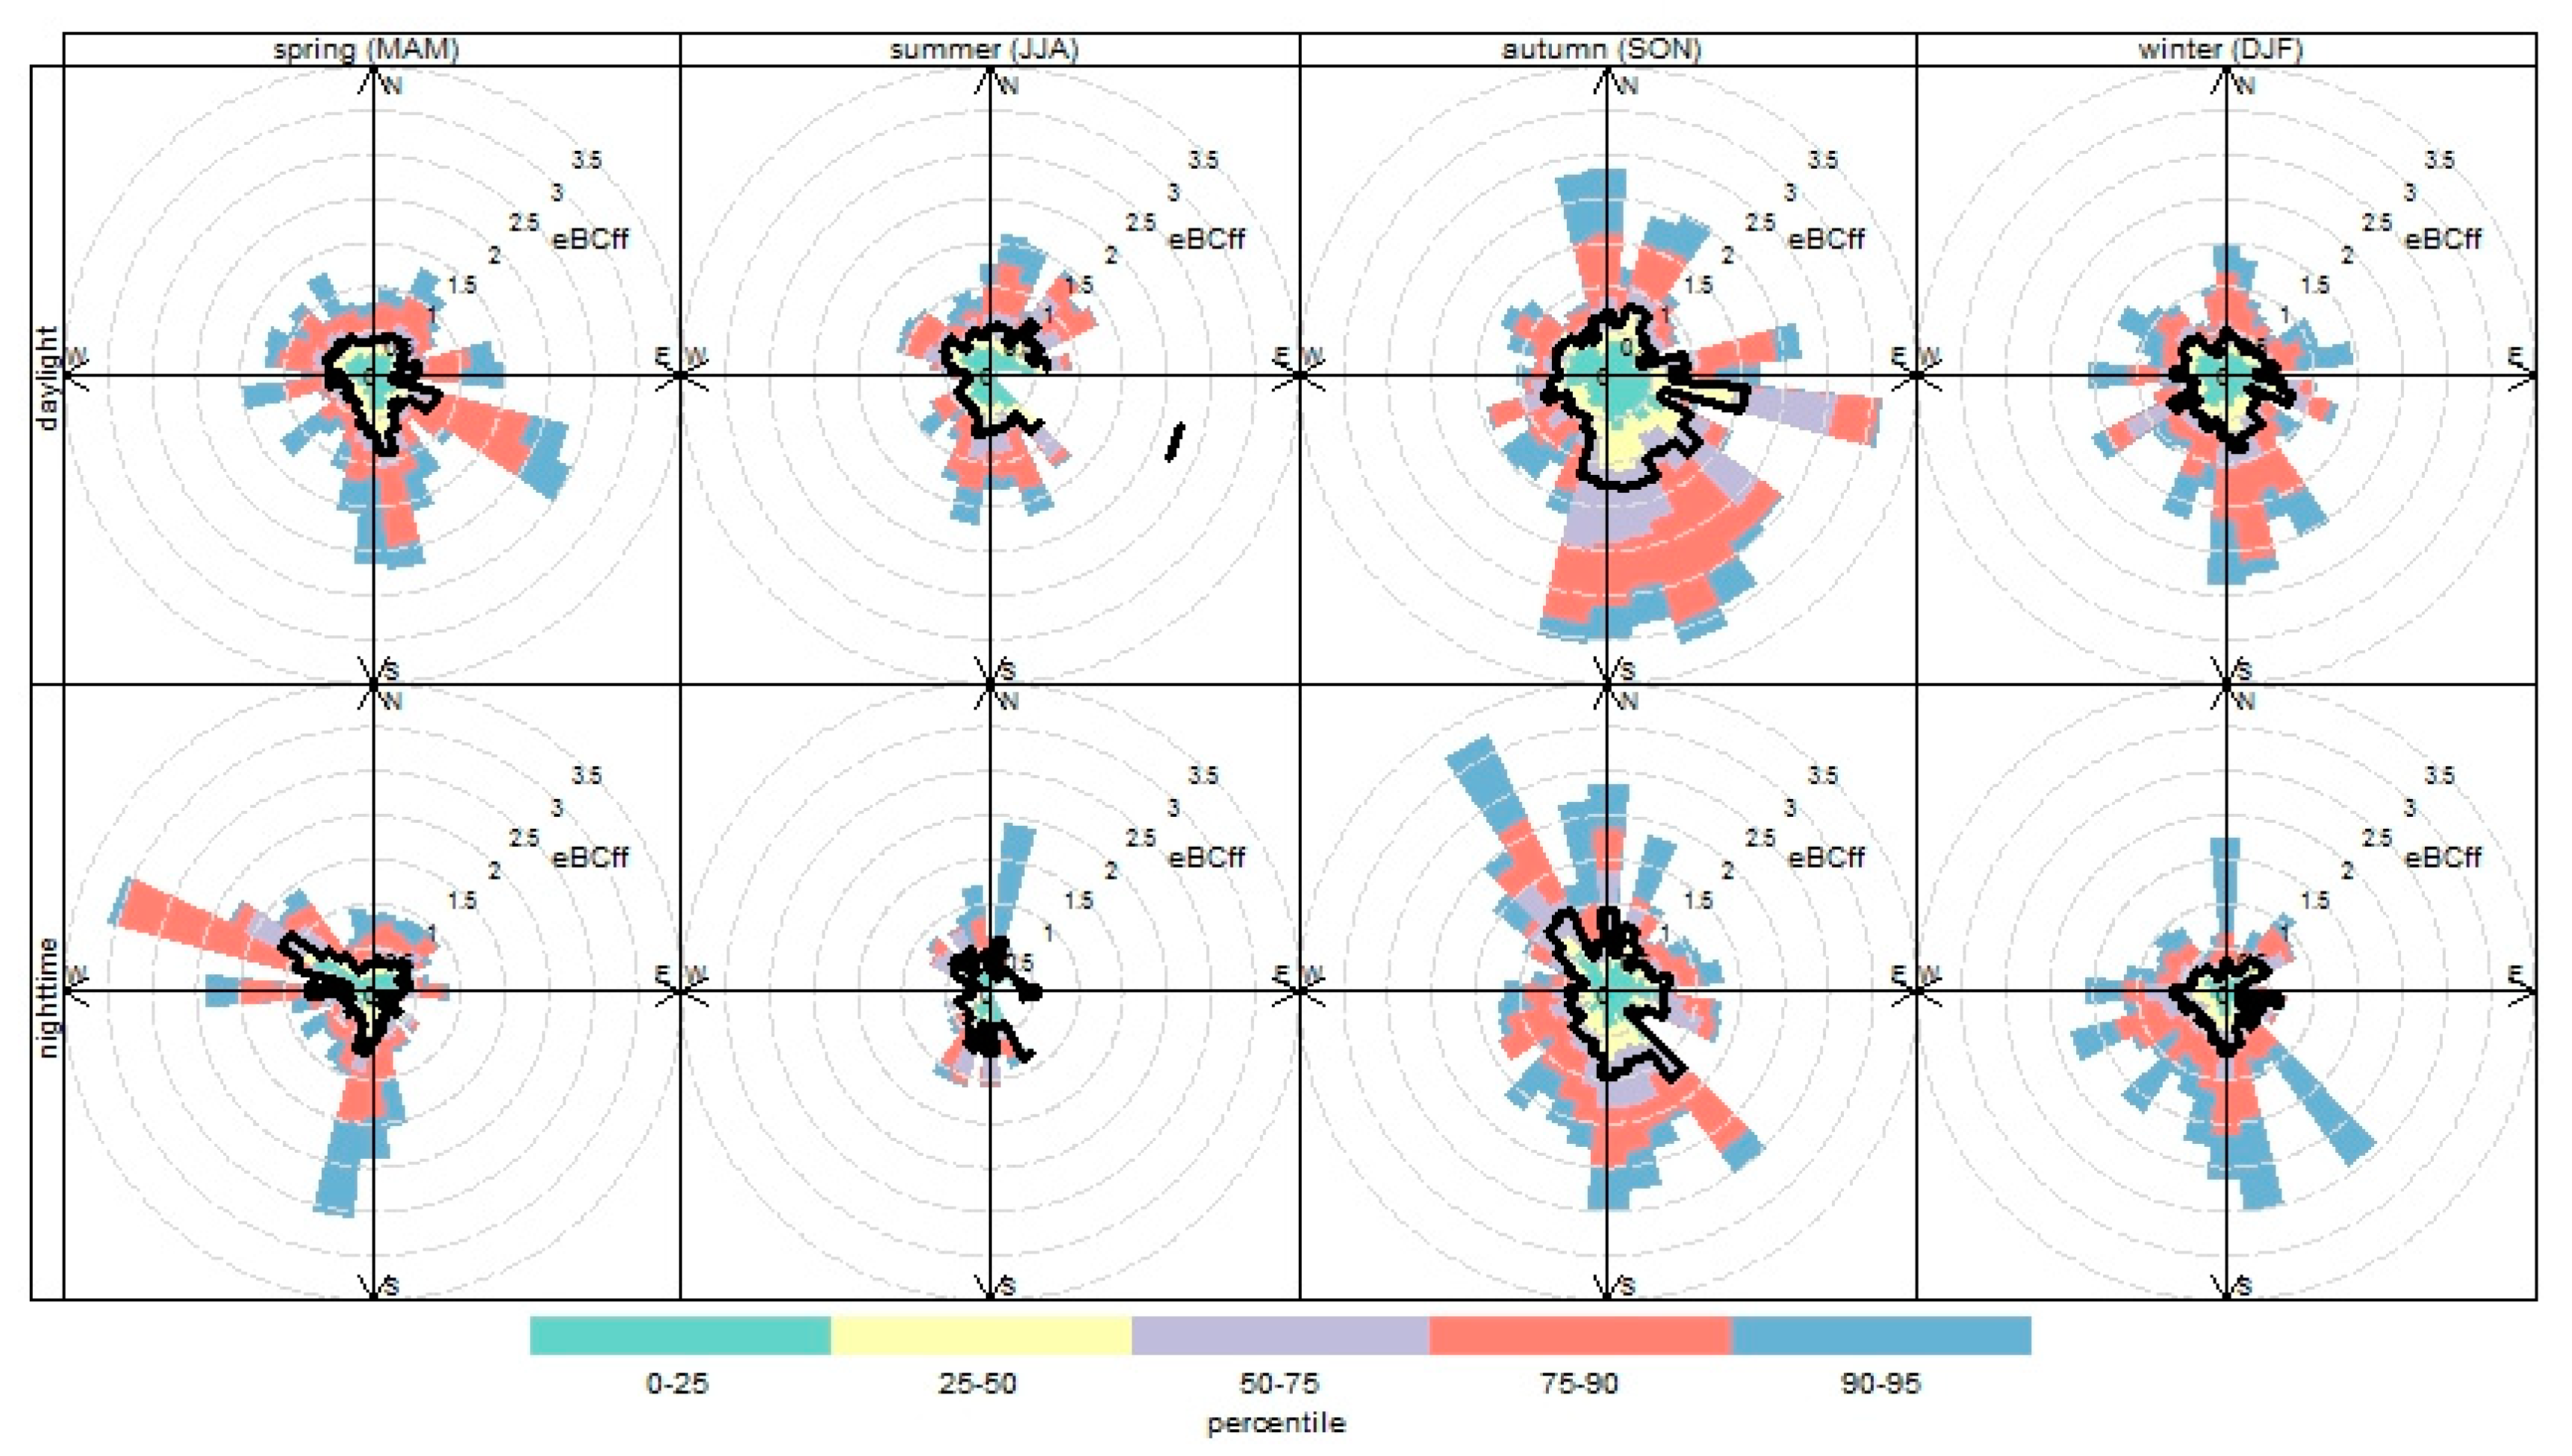
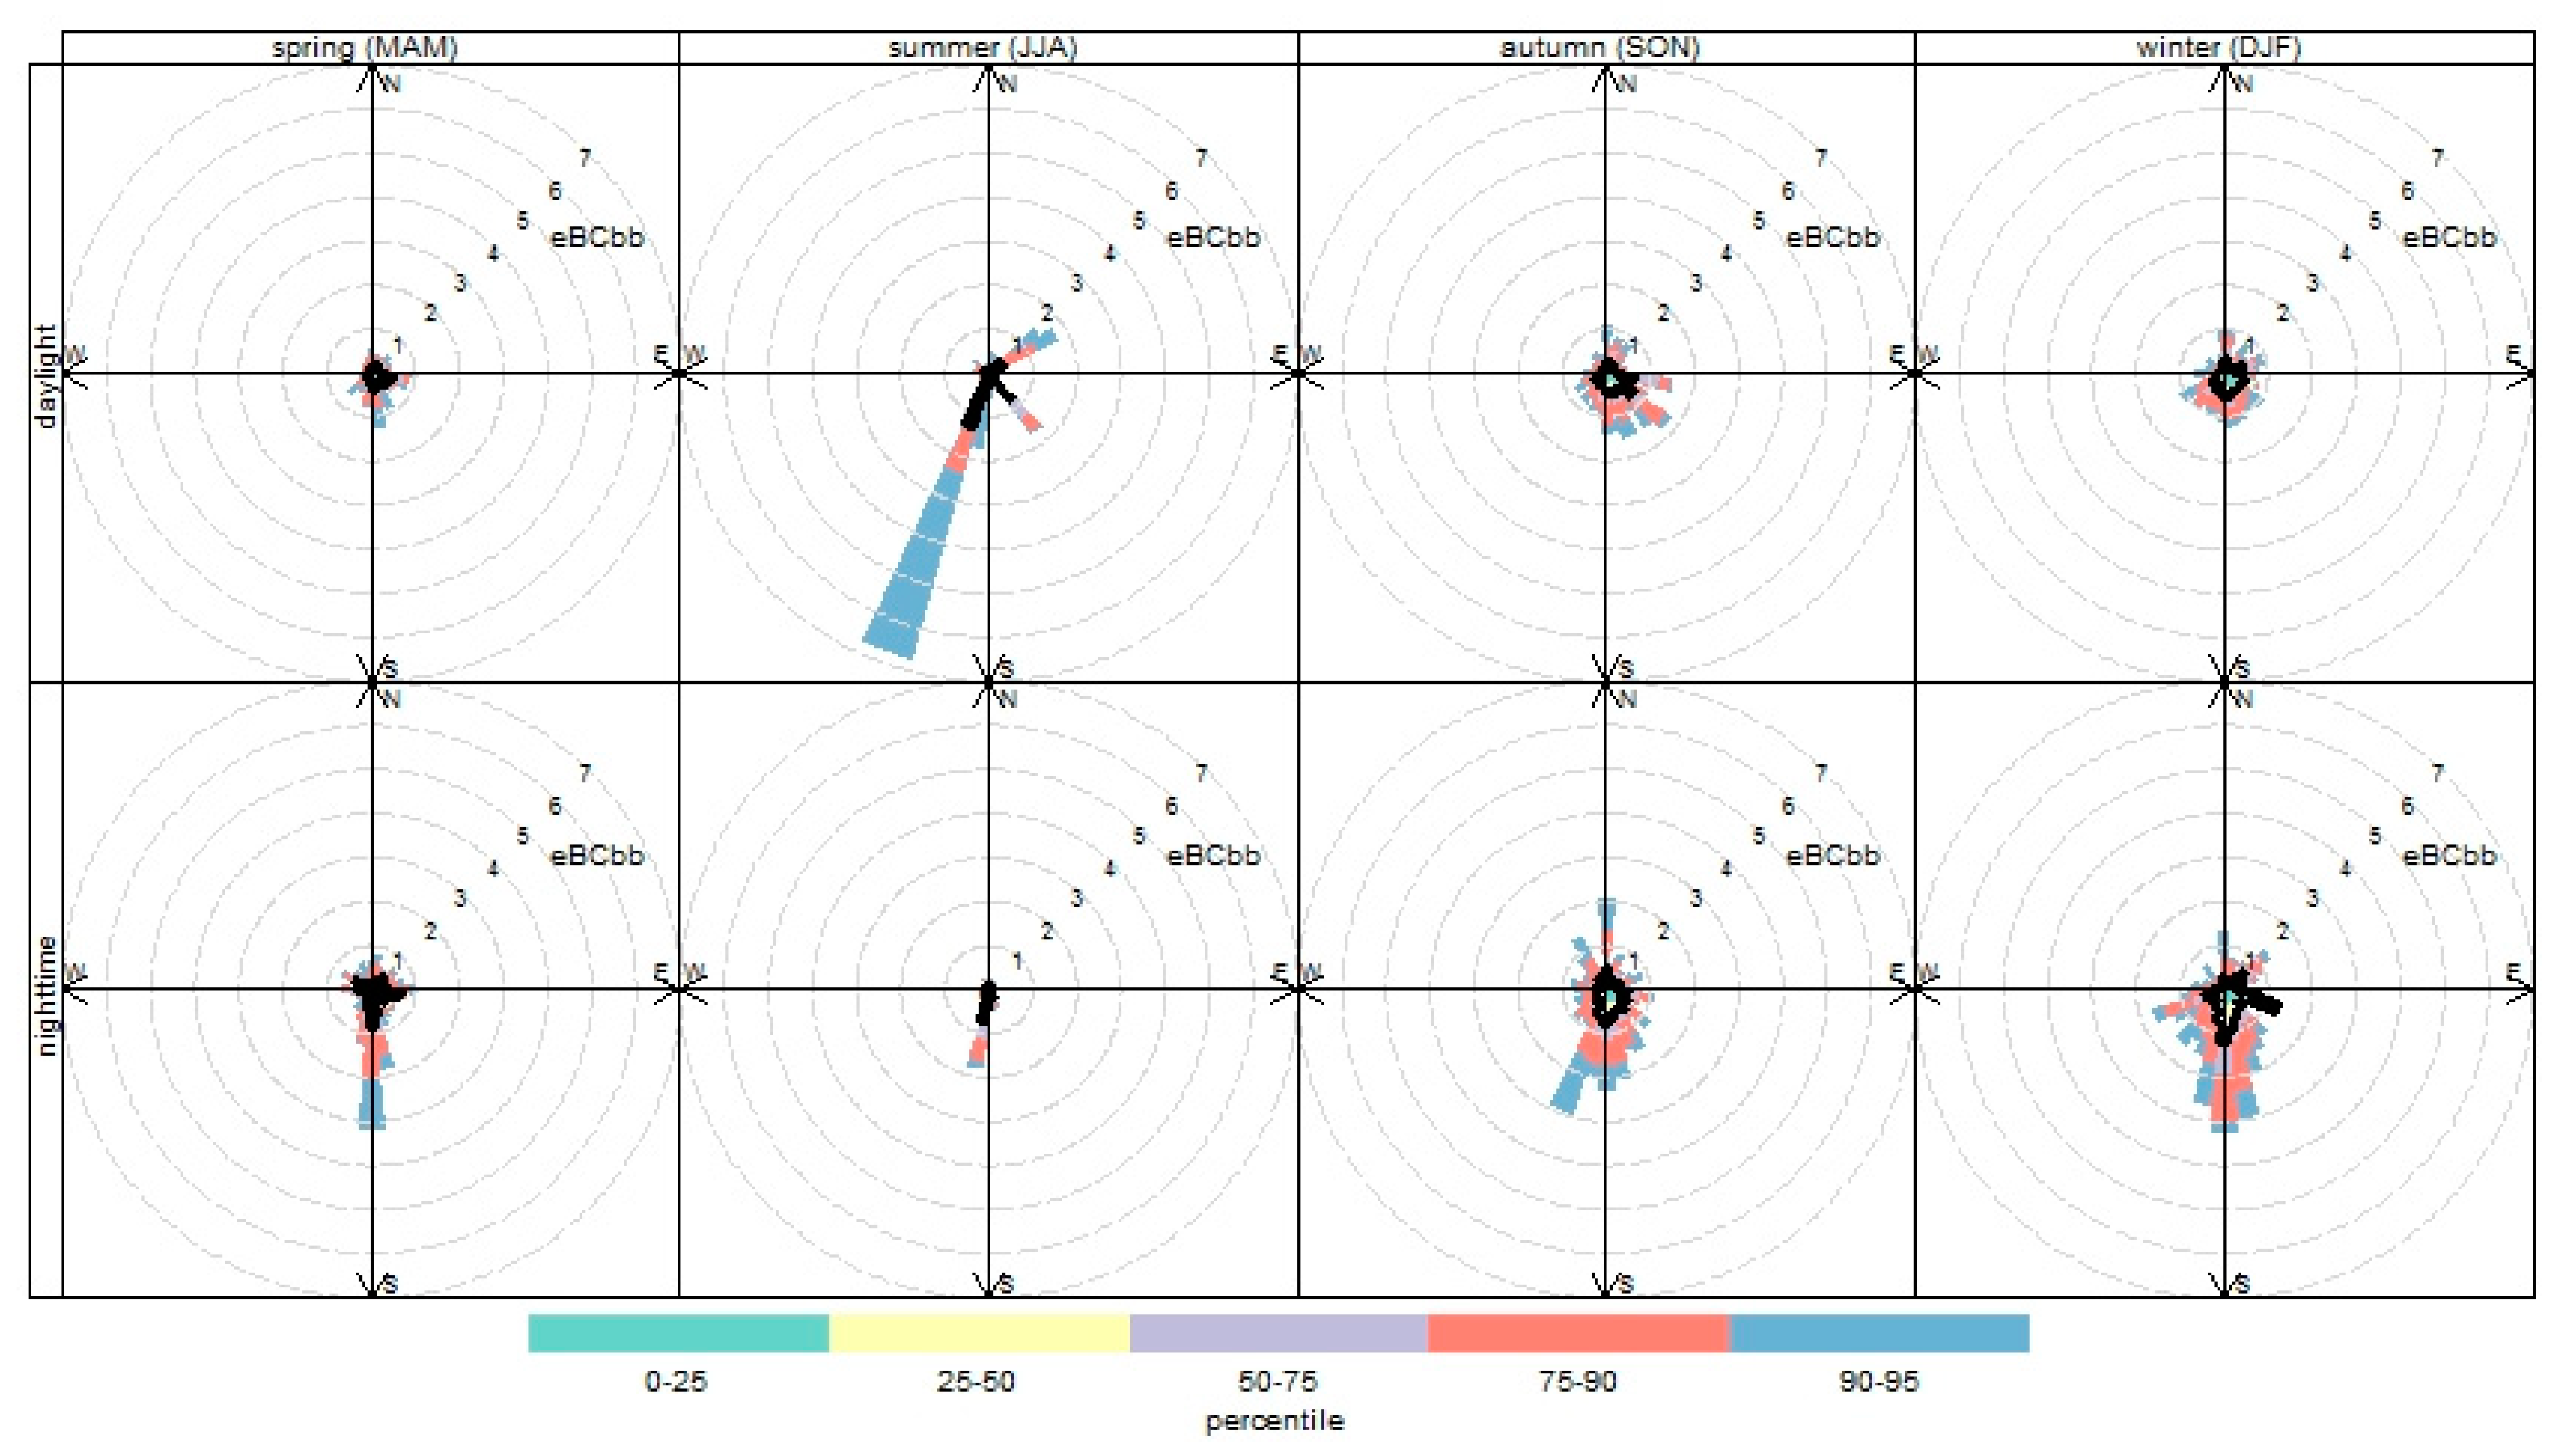
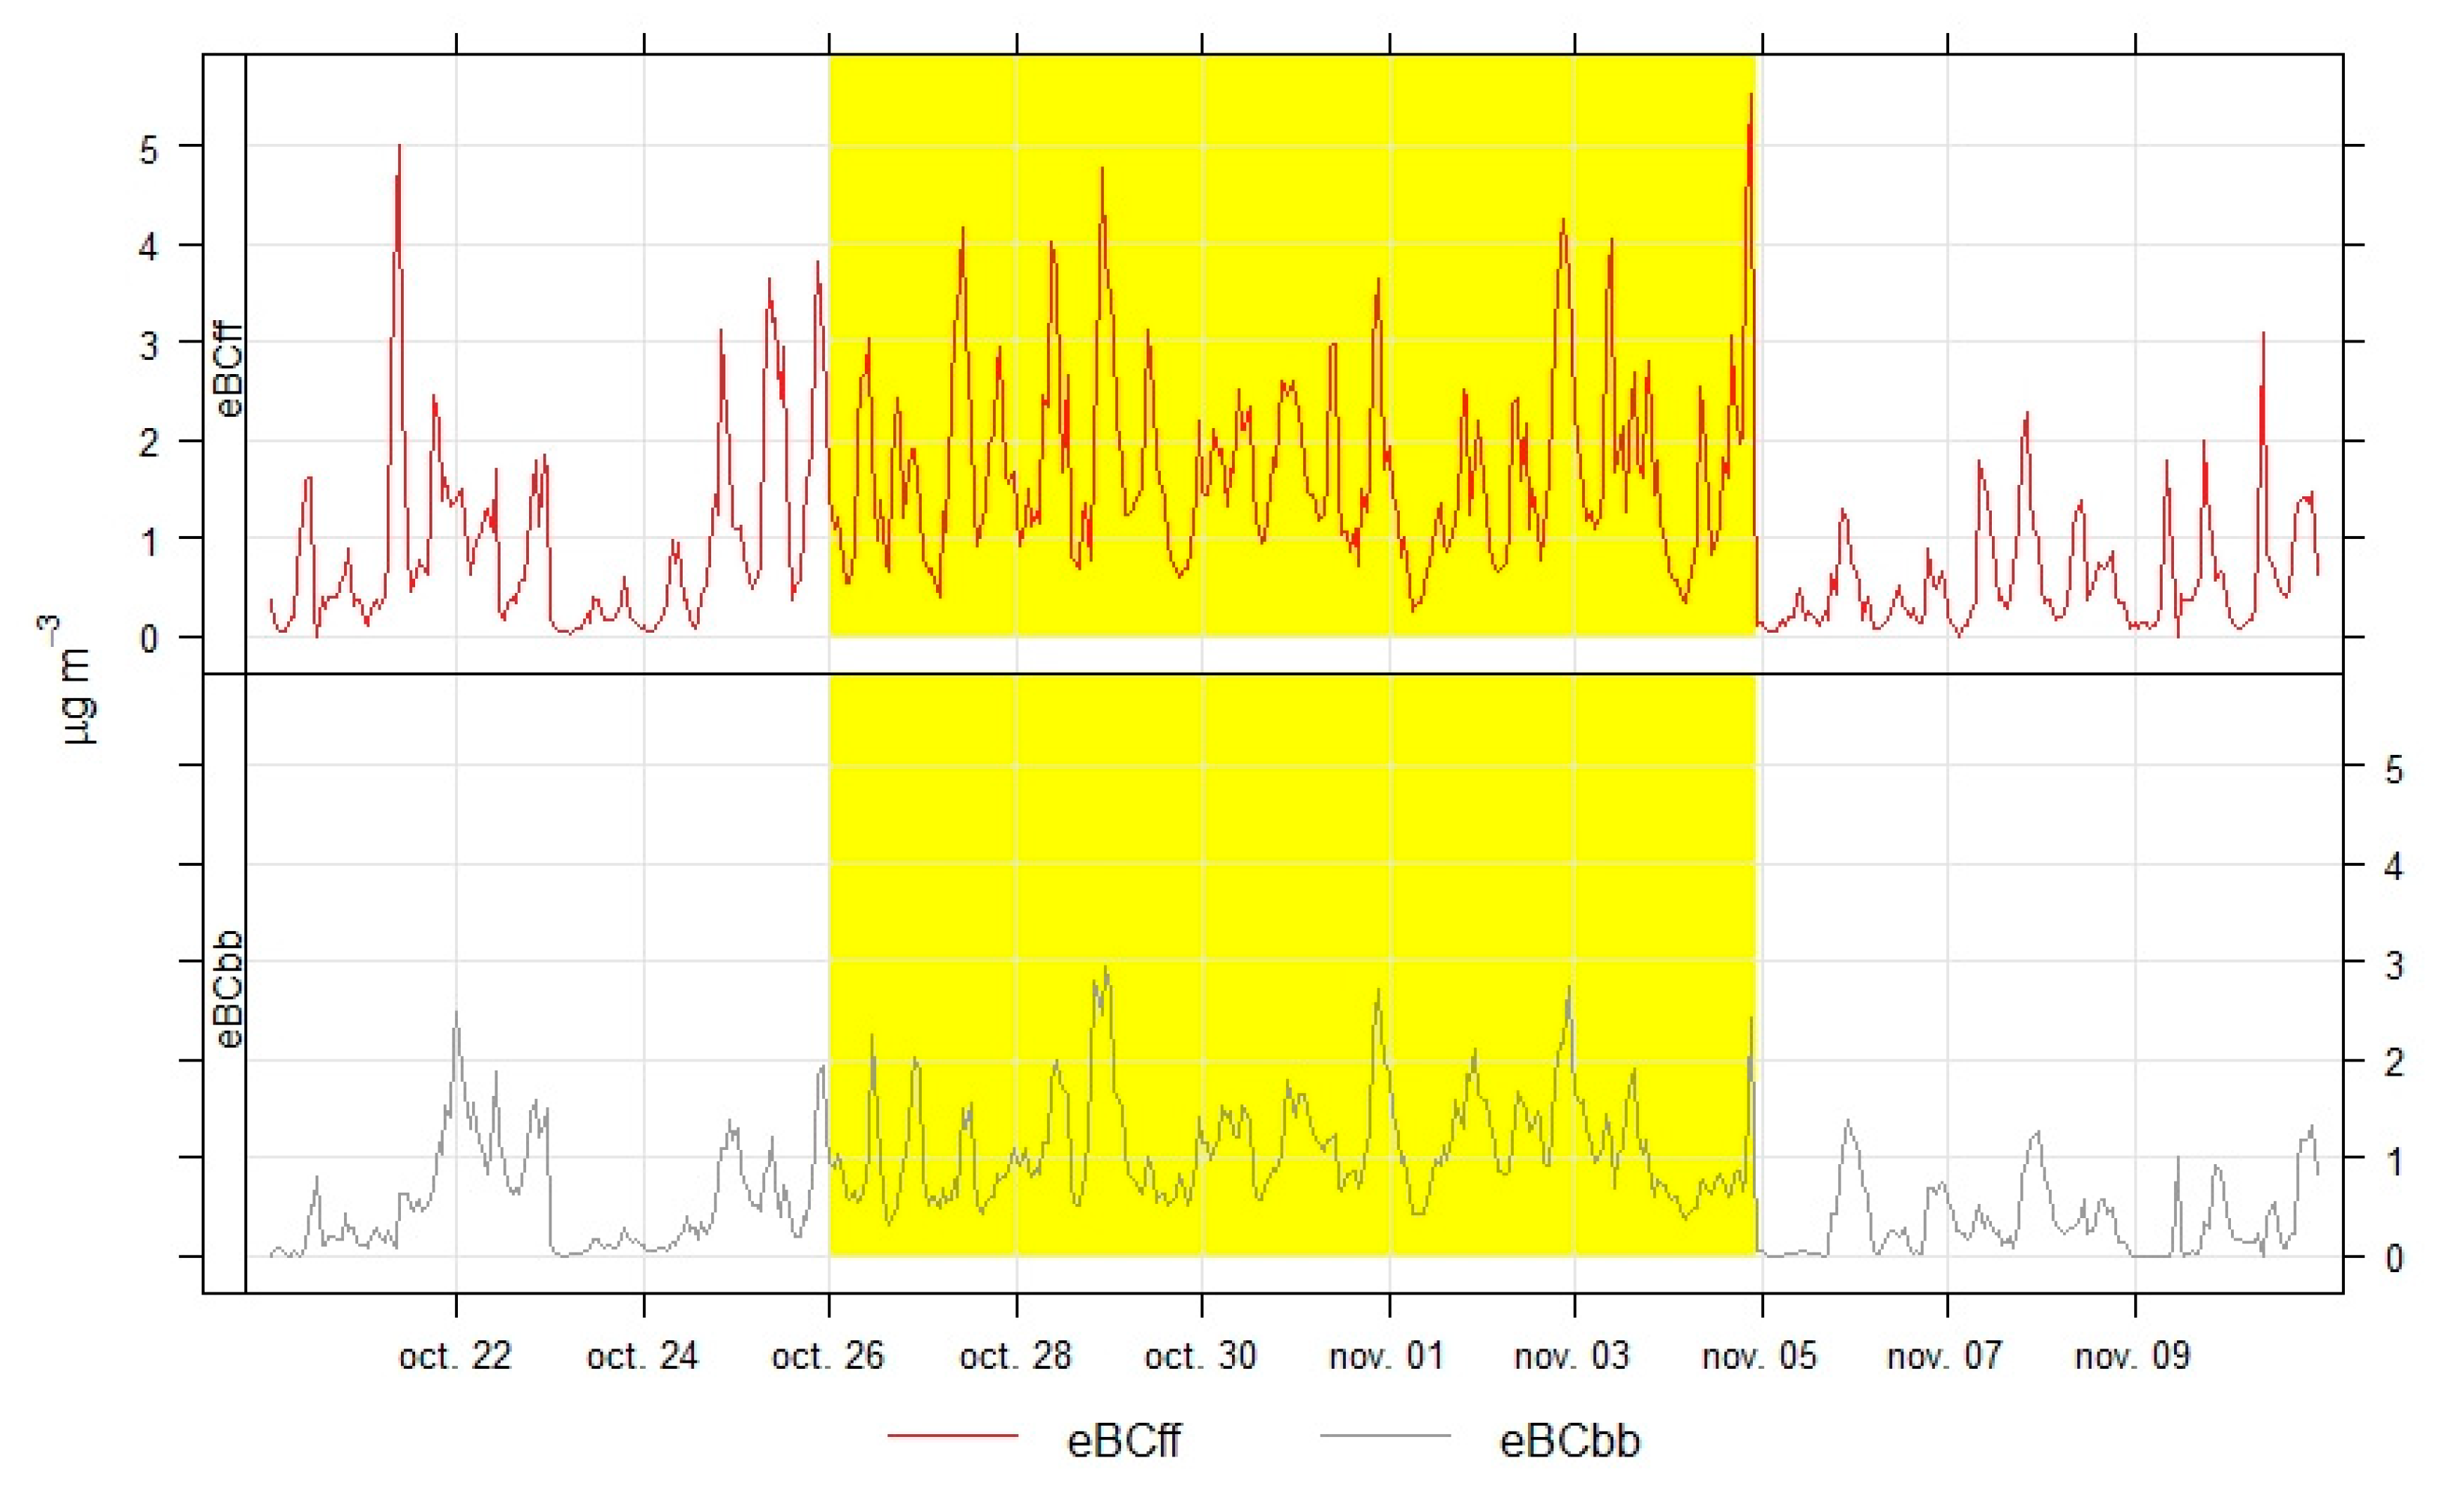
3.3. Source Apportionment of eBC

The measured diurnal and hourly average cycles of the AAE during the period of study are shown in Figure 8a,b. AAE presents a strong diurnal variation during winter and autumn, with values in the evening hours until dawn consistent with an increase of biomass burning activity due to the use of the domestic wood stoves.
AAE shows a clear seasonal cycle, with the largest values during winter and the lowest during summer. Large AAE values during winter are related to an increase in the contribution of UV-absorbing particles, likely BrC from biomass burning emissions [39]. Furthermore, the large variability observed in AAE values indicate changes in the contribution of different absorbing aerosol types. This variability could be due to the impact of different sources of absorbing aerosols (i.e., fossil fuel (ff) and biomass burning (bb)) with a distinct absorption spectral dependence. The AAE average value was 1.26 ± 0.22 which is similar to the one obtained in a suburban area of Helsinki (1.25 ± 0.11) [39] and was slightly lower than the AAE average values found in Rome (1.41 ± 0.21) [19]. Thus, this supports the hypothesis that the highest eBC levels observed during cold seasons are strongly affected by wood combustion sources. The lowest AAE values obtained in summer suggests a low contribution from non-BC absorbing components to the absorption process, as Nicolás et al. commented [49] for a remote site in Spain.
Applying the model used in Sandradewi et al. [8], it was found that fossil fuel combustion was responsible for 69% of the eBC in 2015 and 64% in 2016. These values are slightly higher than the ones obtained in winter in three sites of Granada (52–68%) [50]. When applying this model, it is necessary to take into account, and should thus be considered carefully, that eBCff comprises traffic emissions as well as carbonaceous aerosols originating from fuel oil and natural gas combustion but excludes coal-burning organic aerosols. Another limitation might be the presence of mineral dust particles (notably containing iron oxides) [51,52], which also absorb light at near-UV wavelengths [53].
The average diurnal cycles of eBCff and eBCbb are summarized in Figure 9a,b. The eBCff is practically the same as that of the total measured eBC and higher than eBCbb concentrations. As expected, higher contributions to black carbon from biomass burning were observed in colder periods, which can be explained by the higher intensity of domestic heating. The decrease in eBCbb concentrations during the warmer seasons is likely explained by the decrease in local and/or regional emissions from domestic heating by wood stoves. This evidently affects the eBCbb concentration levels especially at this site, wherein the wood burning emissions are dominated by local appliances during winter. However, a great variation in eBCbb concentrations was found in summer probably due to episodes of biomass burning fires. The eBCff did not show a distinct seasonal dependency. Higher eBCff on weekdays during autumn and winter could be due to trips made by car to second homes when there is good weather (i.e., more trips appear to go to schools, to work, shopping, etc.).
During weekdays, the previous figure shows that the eBCff concentration was characterized by two peaks, one in the morning and another in the late afternoon/early evening, coinciding with peak traffic times. On the weekend, these peaks are less pronounced. A relatively weak morning peak and a strong evening peak characterize the average diurnal cycle of eBCbb. In winter, the contribution of eBCbb is higher during night-time, which can be explained by the typical operating time pattern of domestic heating appliances in the coldest months. Moreover, Figure 9b shows wider shades during the early morning hours and the late evening of summer, probably due to (i) episodes of thermal inversion, which retain pollutants during these hours, and (ii) traditional summer barbecues around the beach and in the single family homes starting at 5 a.m. (UTC). This increase in some summertime sources of biomass burning was previously observed in London by Fuller et al. [54].
In the following Figure 10 and Figure 11, the data are split by day and night-time and the season of the year, and here the trends can be observed. In the case of eBCff, south-east and north-west wind directions contribute most to mean concentrations in autumn and spring, both during the day and at night. This could be explained by the prevailing wind direction in autumn and winter from SW, where there is a road and also an industrial area (see Figure 1). In the same seasons, NW is the dominant wind direction, which could bring pollutants from the city of A Coruña and its industrial area. No land–sea breeze effect was observed.
With regard to eBCbb concentrations, south wind directions, where several single family homes are located, contribute most to overall concentrations in autumn and winter during night-time: wood stoves for domestic heating. Besides, episodes of open-air biomass burning and barbecues probably contribute to the high percentile found in summer during daylight hours. No land–sea breeze effect was observed.
Once the previous analysis had been carried out with the entire sampling data, the daily values of both eBC and Nt were represented (not shown here) and the days in which the highest values of the two pollutants occurred were chosen. Once this selection of days was made, they were compared with the “classification of days with Saharan dust intrusion and with intrusion of particulate matter from biomass combustion provided by the Ministry for Ecological Transition” (https://www.miteco.gob.es/), to see if they coincided with any of those long-distance transport events. Two events were detected, and they are commented next through Figure 12 and Figure 13. The data related to both events were not excluded in the overall analysis since it was confirmed that they do not affect the analysis.
As shown in Figure 12, we found a strong episode with high levels of the two pollutants during 4 February 2016, which coincides with an intense fresh biomass burning episode.
Another episode with high concentrations of eBC and Nt was detected from 26 October to 4 November 2016. In this case, dust and extremely fresh biomass burning episodes during those days were identified. This was confirmed by the high hourly levels found for eBCff and eBCbb (marked in yellow in Figure 13) during this period. With regard to Nt, and as happened with the above-mentioned episode, almost every hourly value are below 20,000 particles cm−3 during this episode.

4. Conclusions

A multi-wavelength aethalometer was used to study mass equivalent black carbon (eBC) characteristics at a suburban site in A Coruna during a two-year period. The eBC mass concentrations presented concentrations typical of other suburban sites, and lower than other urban sites in Europe. They show seasonal variations, significantly higher in winter and autumn than in spring and summer. This behavior is the result of meteorological conditions during the studied period but can be also linked to the seasonal variations in emissions, especially higher in winter due to biomass burning. AAE shows a clear seasonal cycle, with the largest values during winter and the lowest during summer. The use of the aethalometer in areas where biomass burning could be an important source of eBC is very appealing, as these instruments are easy to operate and are often already installed in order to measure black carbon concentrations. Nt shows clear diurnal cycles, similar to eBC concentrations. The interpretation of measurements regarding eBC and Nt in this paper was made through the SCALA© software, an atmospheric aerosol data management software that was successfully extended to carry out this kind of study. The biomass burning source was identified (%eBCbb = 34, two-year data average), but it is not clear whether this source corresponds to open-air biomass burning of agricultural waste or biomass burning from domestic heating or both. Both practices are common in this area. Further studies are needed in order to assess the effects of these pollutants. Additionally, future pollution management strategies should take into account that biomass burning can be an important aerosol source during winter and spring seasons, since its human health effects may be different from those caused by diesel particles.

Author Contributions

Conceptualization, M.P.-I.; methodology, M.P.-I.; software and software development, J.A.-G. and S.S.-G.; formal analysis, M.P.-I. and P.L.-M.; resources, S.M.-L. and D.P.-R.; writing—original draft preparation, M.P.-I. and J.A.-G.; writing—review and editing, S.S.-G. and P.L.-M.; supervision, S.M.-L. and D.P.-R.; funding acquisition, D.P.-R. All authors have read and agreed to the published version of the manuscript.

Funding

This research was funded by the Spanish R&D Plan (PROACLIM project: CGL2014-52877-R and CRISOL project: CGL2017-85344-R) and by the Xunta de Galicia (GRC2013-047 and ED431C 2017/28).

Institutional Review Board Statement

Not applicable.

Informed Consent Statement

Not applicable.

Data Availability Statement

The data presented in this study are available on request from the corresponding author. The data are not publicly available due to privacy.

Acknowledgments

Our thanks go to all the institutions and people that disseminate their models, satellite images and other types of environmental and meteorological information via the Internet, as well as knowledge about software development. Our thanks also go to the anonymous reviewers for their helpful comments/suggestions and constructive attitude. Finally, the authors would like to acknowledge Lucía Chas, for her invaluable technical support in improving the software SCALA© software.

Conflicts of Interest

The authors declare no conflict of interest.

References

  1. Alonso-Blanco, E.; Gómez-Moreno, F.J.; Artíñano, B.; Iglesias-Samitier, S.; Juncal-Bello, V.; Piñeiro-Iglesias, M.; López-Mahía, P.; Pérez, N.; Brines, M.; Alastuey, A.; et al. Temporal and spatial variability of atmospheric particle number size distributions across Spain. Atmos. Environ. 2018, 190, 146–160. [Google Scholar] [CrossRef]
  2. Fermo, P.; Comite, V.; Ciantelli, C.; Sardella, A.; Bonazza, A. A multi-analytical approach to study the chemical composition of total suspended particulate matter (TSP) to assess the impact on urban monumental heritage in Florence. Sci. Total Environ. 2020, 740, 140055. [Google Scholar] [CrossRef] [PubMed]
  3. Fuzzi, S.; Baltensperger, U.; Carslaw, K.; Decesari, S.; Denier Van Der Gon, H.; Facchini, M.C.; Fowler, D.; Koren, I.; Langford, B.; Lohmann, U.; et al. Particulate matter, air quality and climate: Lessons learned and future needs. Atmos. Chem. Phys. 2015, 15, 8217–8299. [Google Scholar] [CrossRef] [Green Version]
  4. Titos, G.; Lyamani, H.; Drinovec, L.; Olmo, F.J.; Močnik, G.; Alados-Arboledas, L. Evaluation of the impact of transportation changes on air quality. Atmos. Environ. 2015, 114, 19–31. [Google Scholar] [CrossRef]
  5. Atzei, D.; Fermo, P.; Vecchi, R.; Fantauzzi, M.; Comite, V.; Valli, G.; Cocco, F.; Rossi, A. Composition and origin of PM2.5 in Mediterranean Countryside. Environ. Pollut. 2019, 246, 294–302. [Google Scholar] [CrossRef] [PubMed]
  6. Yang, Y.; Ruan, Z.; Wang, X.; Yang, Y.; Mason, T.G.; Lin, H.; Tian, L. Short-term and long-term exposures to fine particulate matter constituents and health: A systematic review and meta-analysis. Environ. Pollut. 2019, 247, 874–882. [Google Scholar] [CrossRef]
  7. Sandradewi, J.; Prévôt, A.S.H.; Szidat, S.; Perron, N.; Alfarra, M.R.; Lanz, V.A.; Weingartner, E.; Baltensperger, U. Using aerosol light absorption measurements for the quantitative determination of wood burning and traffic emission contributions to particulate matter. Environ. Sci. Technol. 2008, 42, 3316–3323. [Google Scholar] [CrossRef]
  8. Sandradewi, J.; Prévôt, A.S.H.; Weingartner, E.; Schmidhauser, R.; Gysel, M.; Baltensperger, U. A study of wood burning and traffic aerosols in an Alpine valley using a multi-wavelength Aethalometer. Atmos. Environ. 2008, 42, 101–112. [Google Scholar] [CrossRef]
  9. Drinovec, L.; Močnik, G.; Zotter, P.; Prévôt, A.S.H.; Ruckstuhl, C.; Coz, E.; Rupakheti, M.; Sciare, J.; Müller, T.; Wiedensohler, A.; et al. The “dual-spot” Aethalometer: An improved measurement of aerosol black carbon with real-time loading compensation. Atmos. Meas. Tech. 2015, 8, 1965–1979. [Google Scholar] [CrossRef] [Green Version]
  10. Hansen, A.D.A.; Rosen, H.; Novakov, T. The aethalometer—An instrument for the real-time measurement of optical absorption by aerosol particles. Sci. Total Environ. 1984, 36, 191–196. [Google Scholar] [CrossRef] [Green Version]
  11. Yttri, K.E.; Platt, S.M.; Aas, W.; Solberg, S.; Aurela, M.; Bergmans, B.; Lenartz, F.; Lazzeri, P.; Luoma, K.; Pandolfi, M.; et al. Transboundary particulate matter, photo-oxidants, acidifying and eutrophying components. EMEP Status report 1/2018. In Transboundary Particulate Matter, Photo-Oxidants, Acidifying and Eutrophying Components. EMEP Status Report 1/2018; Fagerli, H., Tsyro, S., Jonson, J.E., Nyíri, Á., Gauss, M., Simpson, D., Wind, P., Benedictow, A., Valdebenito, A., Klein, H., et al., Eds.; EMEP: Oslo, Norway, 2018; pp. 99–106. [Google Scholar]
  12. Lack, D.A.; Moosmüller, H.; Mcmeeking, G.R.; Chakrabarty, R.K.; Baumgardner, D. Characterizing elemental, equivalent black, and refractory black carbon aerosol particles: A review of techniques, their limitations and uncertainties. Anal. Bioanal. Chem. 2014, 406, 99–122. [Google Scholar] [CrossRef] [PubMed] [Green Version]
  13. Petzold, A.; Ogren, J.A.; Fiebig, M.; Laj, P.; Li, S.-M.; Baltensperger, U.; Holzer-Popp, T.; Kinne, S.; Pappalardo, G.; Sugimoto, N.; et al. Recommendations for reporting “black carbon” measurements. Atmos. Chem. Phys. 2013, 13, 8365–8379. [Google Scholar] [CrossRef] [Green Version]
  14. Querol, X.; Alastuey, A.; Viana, M.; Moreno, T.; Reche, C.; Minguillón, M.C.; Ripoll, A.; Pandolfi, M.; Amato, F.; Karanasiou, A.; et al. Variability of carbonaceous aerosols in remote, rural, urban and industrial environments in Spain: Implications for air quality policy. Atmos. Chem. Phys. 2013, 13, 6185–6206. [Google Scholar] [CrossRef] [Green Version]
  15. Hama, S.M.L.; Cordell, R.L.; Kos, G.P.A.; Weijers, E.P.; Monks, P.S. Sub-micron particle number size distribution characteristics at two urban locations in Leicester. Atmos. Res. 2017, 194, 1–16. [Google Scholar] [CrossRef] [Green Version]
  16. Harrison, R.M.; Jones, A.M.; Lawrence, R.G. Major component composition of PM10 and PM2.5 from roadside and urban background sites. Atmos. Environ. 2004, 38, 4531–4538. [Google Scholar] [CrossRef]
  17. Smargiassi, A.; Baldwin, M.; Pilger, C.; Dugandzic, R.; Brauer, M. Small-scale spatial variability of particle concentrations and traffic levels in Montreal: A pilot study. Sci. Total Environ. 2005, 338, 243–251. [Google Scholar] [CrossRef] [PubMed]
  18. Rodríguez, S.; Cuevas, E. The contributions of “minimum primary emissions” and “new particle formation enhancements” to the particle number concentration in urban air. J. Aerosol Sci. 2007, 38, 1207–1219. [Google Scholar] [CrossRef]
  19. Costabile, F.; Alas, H.; Aufderheide, M.; Avino, P.; Amato, F.; Argentini, S.; Barnaba, F.; Berico, M.; Bernardoni, V.; Biondi, R.; et al. First Results of the “Carbonaceous Aerosol in Rome and Environs (CARE)” Experiment: Beyond Current Standards for PM10. Atmosphere 2017, 8, 249. [Google Scholar] [CrossRef] [Green Version]
  20. Sun, J.; Birmili, W.; Hermann, M.; Tuch, T.; Weinhold, K.; Spindler, G.; Schladitz, A.; Bastian, S.; Löschau, G.; Cyrys, J.; et al. Variability of black carbon mass concentrations, sub-micrometer particle number concentrations and size distributions: Results of the German Ultrafine Aerosol Network ranging from city street to High Alpine locations. Atmos. Environ. 2019, 202, 256–268. [Google Scholar] [CrossRef]
  21. Del Águila, A.; Sorribas, M.; Lyamani, H.; Titos, G.; Olmo, F.J.; Arruda-Moreira, G.; Yela, M.; Alados-Arboledas, L. Sources and physicochemical characteristics of submicron aerosols during three intensive campaigns in Granada (Spain). Atmos. Res. 2018, 213, 398–410. [Google Scholar] [CrossRef]
  22. Andreae, M.O.; Gelencsér, A. Black carbon or brown carbon? The nature of light-absorbing carbonaceous aerosols. Atmos. Chem. Phys. 2006, 6, 3131–3148. [Google Scholar] [CrossRef] [Green Version]
  23. Chakrabarty, R.K.; Gyawali, M.; Yatavelli, R.L.N.; Pandey, A.; Watts, A.C.; Knue, J.; Chen, L.-W.A.; Pattison, R.R.; Tsibart, A.; Samburova, V.; et al. Brown carbon aerosols from burning of boreal peatlands: Microphysical properties, emission factors, and implications for direct radiative forcing. Atmos. Chem. Phys. 2016, 16, 3033–3040. [Google Scholar] [CrossRef] [Green Version]
  24. Schnaiter, M.; Horvath, H.; Möhler, O.; Naumann, K.-H.; Saathoff, H.; Schöck, O.W. UV-VIS-NIR spectral optical properties of soot and soot-containing aerosols. J. Aerosol Sci. 2003, 34, 1421–1444. [Google Scholar] [CrossRef]
  25. Moreda-Piñeiro, J.; Alonso-Rodríguez, E.; Moscoso-Pérez, C.; Blanco-Heras, G.; Turnes-Carou, I.; López-Mahía, P.; Muniategui-Lorenzo, S.; Prada-Rodríguez, D. Influence of marine, terrestrial and anthropogenic sources on ionic and metallic composition of rainwater at a suburban site (northwest coast of Spain). Atmos. Environ. 2014, 88, 30–38. [Google Scholar] [CrossRef]
  26. Gómez-Moreno, F.J.; Alonso, E.; Artíñano, B.; Juncal-Bello, V.; Iglesias-Samitier, S.; Piñeiro Iglesias, M.; Mahía, P.L.; Pérez, N.; Pey, J.; Ripoll, A.; et al. Intercomparisons of Mobility Size Spectrometers and Condensation Particle Counters in the Frame of the Spanish Atmospheric Observational Aerosol Network. Aerosol Sci. Technol. 2015, 49, 777–785. [Google Scholar] [CrossRef] [Green Version]
  27. Vintar Mally, K.; Planinšek, A.; Gregorič, A.; Drinovec, L.; Močnik, G.; Koblar, S.; Koželj, T.; Bobovnik, N. Nitrogen Dioxide and Black Carbon Concentrations in Ljubljana; Znanstvena Založba Filozofske Fakultete: Ljubljana, Slovenia, 2017; ISBN 9789612379803. [Google Scholar]
  28. Favez, O.; Cachier, H.; Sciare, J.; Sarda-Estève, R.; Martinon, L. Evidence for a significant contribution of wood burning aerosols to PM2.5 during the winter season in Paris, France. Atmos. Environ. 2009, 43, 3640–3644. [Google Scholar] [CrossRef]
  29. Kirchstetter, T.W.; Novakov, T.; Hobbs, P.V. Evidence that the spectral dependence of light absorption by aerosols is affected by organic carbon. J. Geophys. Res. Atmos. 2004, 109, D21208. [Google Scholar] [CrossRef] [Green Version]
  30. Russell, P.B.; Bergstrom, R.W.; Shinozuka, Y.; Clarke, A.D.; DeCarlo, P.F.; Jimenez, J.L.; Livingston, J.M.; Redemann, J.; Dubovik, O.; Strawa, A. Absorption Angstrom Exponent in AERONET and related data as an indicator of aerosol composition. Atmos. Chem. Phys. 2010, 10, 1155–1169. [Google Scholar] [CrossRef] [Green Version]
  31. Zotter, P.; Herich, H.; Gysel, M.; El-Haddad, I.; Zhang, Y.; Močnik, G.; Hüglin, C.; Baltensperger, U.; Szidat, S.; Prévôt, A.S.H. Evaluation of the absorption Ångström exponents for traffic and wood burning in the Aethalometer-based source apportionment using radiocarbon measurements of ambient aerosol. Atmos. Chem. Phys. 2017, 17, 4229–4249. [Google Scholar] [CrossRef] [Green Version]
  32. Andrade-Garda, J.; Suárez-Garaboa, S.; Álvarez-Rodríguez, A.; Piñeiro-Iglesias, M.; López-Mahía, P.; Gómez-Moreno, F.J.; Artíñano, B. Development of a web software application for nanoparticle data management and analysis. In Proceedings of the 4th Iberian Meeting on Aerosol Science and Technology RICTA’16, Aveiro, Portugal, 29 June–1 July 2016. [Google Scholar]
  33. Andrade-Garda, J.; Suárez-Garaboa, S.; Álvarez-Rodríguez, A.; Piñeiro-Iglesias, M.; López-Mahía, P.; Díaz-Ramiro, E.; Artíñano, B.; Gómez-Moreno, F.J. Web Application for Atmospheric Aerosol Data Management: Software and Case Study in the Spanish Network on Environmental Differential Mobility Analysers. Atmosphere 2019, 10, 279. [Google Scholar] [CrossRef] [Green Version]
  34. Andrade, J.; Ares, J.; García, R.; Presa, J.; Rodríguez, S.; Piñeiro-Iglesias, M.; López-Mahía, P.; Muniategui, S.; Prada, D. Development of a Web-based Support System for Both Homogeneous and Heterogeneous Air Quality Control Networks: Process and Product. Environ. Monit. Assess. 2007, 133, 139–148. [Google Scholar] [CrossRef]
  35. R Core Team. R: A Language and Environment for Statistical Computing, version 3.4.4.; R Foundation for Statistical Computing: Vienna, Austria, 2018. [Google Scholar]
  36. Wiedensohler, A.; Birmili, W.; Nowak, A.; Sonntag, A.; Weinhold, K.; Merkel, M.; Wehner, B.; Tuch, T.; Pfeifer, S.; Fiebig, M.; et al. Mobility particle size spectrometers: Harmonization of technical standards and data structure to facilitate high quality long-term observations of atmospheric particle number size distributions. Atmos. Meas. Tech. 2012, 5, 657–685. [Google Scholar] [CrossRef] [Green Version]
  37. Carslaw, D.C.; Ropkins, K. Openair—An R package for air quality data analysis. Environ. Model. Softw. 2012, 27–28, 52–61. [Google Scholar] [CrossRef]
  38. Becerril-Valle, M.; Coz, E.; Prévôt, A.S.H.; Močnik, G.; Pandis, S.N.; Sánchez de la Campa, A.M.; Alastuey, A.; Díaz, E.; Pérez, R.M.; Artíñano, B. Characterization of atmospheric black carbon and co-pollutants in urban and rural areas of Spain. Atmos. Environ. 2017, 169, 36–53. [Google Scholar] [CrossRef]
  39. Helin, A.; Niemi, J.V.; Virkkula, A.; Pirjola, L.; Teinilä, K.; Backman, J.; Aurela, M.; Saarikoski, S.; Rönkkö, T.; Asmi, E.; et al. Characteristics and source apportionment of black carbon in the Helsinki metropolitan area, Finland. Atmos. Environ. 2018, 190, 87–98. [Google Scholar] [CrossRef]
  40. Kucbel, M.; Corsaro, A.; Švédová, B.; Raclavská, H.; Raclavský, K.; Juchelková, D. Temporal and seasonal variations of black carbon in a highly polluted European city: Apportionment of potential sources and the effect of meteorological conditions. J. Environ. Manag. 2017, 203, 1178–1189. [Google Scholar] [CrossRef]
  41. Singh, V.; Ravindra, K.; Sahu, L.; Sokhi, R. Trends of atmospheric black carbon concentration over the United Kingdom. Atmos. Environ. 2018, 178, 148–157. [Google Scholar] [CrossRef]
  42. Mousavi, A.; Sowlat, M.H.; Lovett, C.; Rauber, M.; Szidat, S.; Boffi, R.; Borgini, A.; De Marco, C.; Ruprecht, A.A.; Sioutas, C. Source apportionment of black carbon (BC) from fossil fuel and biomass burning in metropolitan Milan, Italy. Atmos. Environ. 2019, 203, 252–261. [Google Scholar] [CrossRef]
  43. Uria-Tellaetxe, I.; Carslaw, D.C. Conditional bivariate probability function for source identification. Environ. Model. Softw. 2014, 59, 1–9. [Google Scholar] [CrossRef] [Green Version]
  44. Carslaw, D. The openair manual—Open-source tools for analysing air pollution data. Man. Version 2019, 1–224. [Google Scholar]
  45. Grigg, J. Arrhythmias and particulate matter. Lancet Planet. Health 2017, 1, e50–e51. [Google Scholar] [CrossRef]
  46. Wang, Y.; Hopke, P.K.; Rattigan, O.V.; Xia, X.; Chalupa, D.C.; Utell, M.J. Characterization of residential wood combustion particles using the two-wavelength aethalometer. Environ. Sci. Technol. 2011, 45, 7387–7393. [Google Scholar] [CrossRef] [PubMed]
  47. Németh, Z.; Rosati, B.; Zíková, N.; Salma, I.; Bozó, L.; Dameto de España, C.; Schwarz, J.; Ždímal, V.; Wonaschütz, A. Comparison of atmospheric new particle formation events in three Central European cities. Atmos. Environ. 2018, 178, 191–197. [Google Scholar] [CrossRef]
  48. Carnerero, C.; Pérez, N.; Reche, C.; Ealo, M.; Titos, G.; Lee, H.-K.; Eun, H.-R.; Park, Y.-H.; Dada, L.; Paasonen, P.; et al. Vertical and horizontal distribution of regional new particle formation events in Madrid. Atmos. Chem. Phys. 2018, 18, 16601–16618. [Google Scholar] [CrossRef] [Green Version]
  49. Nicolás, J.F.; Castañer, R.; Crespo, J.; Yubero, E.; Galindo, N.; Pastor, C. Seasonal variability of aerosol absorption parameters at a remote site with high mineral dust loads. Atmos. Res. 2018, 210, 100–109. [Google Scholar] [CrossRef]
  50. Titos, G.; del Águila, A.; Cazorla, A.; Lyamani, H.; Casquero-Vera, J.A.; Colombi, C.; Cuccia, E.; Gianelle, V.; Močnik, G.; Alastuey, A.; et al. Spatial and temporal variability of carbonaceous aerosols: Assessing the impact of biomass burning in the urban environment. Sci. Total Environ. 2017, 578, 613–625. [Google Scholar] [CrossRef] [Green Version]
  51. Fialho, P.; Freitas, M.C.; Barata, F.; Vieira, B.; Hansen, A.D.A.; Honrath, R.E. The Aethalometer calibration and determination of iron concentration in dust aerosols. J. Aerosol Sci. 2006, 37, 1497–1506. [Google Scholar] [CrossRef]
  52. Fialho, P.; Hansen, A.D.A.; Honrath, R.E. Absorption coefficients by aerosols in remote areas: A new approach to decouple dust and black carbon absorption coefficients using seven-wavelength Aethalometer data. J. Aerosol Sci. 2005, 36, 267–282. [Google Scholar] [CrossRef]
  53. Belis, C.A.; Favez, O.; Mircea, M.; Diapouli, E.; Manousakas, M.-I.; Vratolis, S.; Gilardoni, S.; Paglione, M.; Decesari, S.; Mocnik, G.; et al. European Guide on Air Pollution Source Apportionment with Receptor Models: Revised Version 2019; JRC Technical Reports; Publications Office of the European Union: Luxembourg, 2019; ISBN 9789276090014. [Google Scholar]
  54. Fuller, G.W.; Tremper, A.H.; Baker, T.D.; Yttri, K.E.; Butterfield, D. Contribution of wood burning to PM10 in London. Atmos. Environ. 2014, 87, 87–94. [Google Scholar] [CrossRef] [Green Version]
Figure 1. Map of the sampling site showing relevant issues. The prevailing wind direction in Galicia is northeast (NE) in summer and southwest (SW) in winter. The local wind pattern in the sampling site is mainly conditioned by the land–sea breeze because of its proximity to the sea (1 km). Northwest (NW) winds are dominant, although other wind directions are also recorded, and generally carry in relatively clean air from the sea. However, the main industrial sources (including A Coruña city) are located in this direction.
Applsci 11 00516 g001
Figure 2. (a) Day of the week variation of median equivalent black carbon (eBC) concentrations. (b) Hour of day variation of median eBC concentrations. The shading shows the extent to the 25/75th and 5/95th quantiles.
Applsci 11 00516 g002
Figure 3. Percentile rose plot of eBC concentrations (µg m−3).
Applsci 11 00516 g003
Figure 4. A CPF (conditional probability function) plot of eBC concentrations > 95th percentile (2.5 µg m−3) using the entire sampling period.
Applsci 11 00516 g004
Figure 5. (a) Day of the week variation of median enhanced absorption (ΔC) concentrations. (b) Hour of day variation of median ΔC concentrations. The shading shows the extent to the 25/75th and 5/95th quantiles.
Applsci 11 00516 g005
Figure 6. (a) Day of the week variation of eBC (µg m−3) and total number of particles (Nt) (particles cm−3) normalized concentrations (variable (s) are divided by their mean values; this helps to compare the shape of the trends for these two variables with different scales). (b) Hour of day variation of eBC (µg m−3) and Nt (particles cm−3) normalized concentrations. The shaded area represents the range of values in which 95% of sample means lie.
Applsci 11 00516 g006aApplsci 11 00516 g006b
Figure 7. Percentile rose plot of Nt concentrations (particles cm−3).
Applsci 11 00516 g007
Figure 8. (a) Day of the week variation of absorption Ångström exponent (AAE). (b) Hour of day variation of AAE. The shading shows the extent of the 25/75th and 5/95th quantiles.
Applsci 11 00516 g008
Figure 9. (a) Day of the week variation of eBCbb and eBCff (µg m−3) concentrations. (b) Hour of day variation of eBCbb and eBCff (µg m−3) concentrations. Shaded area represents the range of values in which 95% of sample means lie.
Applsci 11 00516 g009
Figure 10. Percentile rose plot of eBCff concentrations (µg m−3).
Applsci 11 00516 g010
Figure 11. Percentile rose plot of eBCbb concentrations (µg m−3).
Applsci 11 00516 g011
Figure 12. eBC and Nt concentrations during an episode of biomass combustion during 4 February 2016.
Applsci 11 00516 g012
Figure 13. eBCff and eBCbb concentrations during a strong episode of Saharan dust intrusion and biomass combustion from 26 October to 4 November 2016.
Applsci 11 00516 g013
Table 1. Comparison of equivalent black carbon (eBC) (µg m−3) in different sites across Europe.
SiteeBC (µg m−3)Reference
Barcelona–CSIC (urban)2.1[14]
Granada University (urban background)2.6[4]
Madrid–Escuelas Aguirre (urban traffic)3.70[38]
Madrid–CIEMAT (urban background)2.33[38]
Jaén-Villanueva (rural)2.61[38]
Urban site–Helsinki metropolitan area1.69[39]
Suburban site–Helsinki metropolitan area0.88[39]
Ostrava (Czech Republic)3.48[40]
Rural, suburban, urban background, urban center and kerbside sites in UK0.45, 1.47, 1.34, 1.83 and 9.72, respectively[41]
Urban site located in metropolitan Milan1.92[42]
Suburban site located in metropolitan Milan (Bareggio)2.76[42]
Urban background in Rome2.6[19]
Table 2. Average total number of particles (Nt) concentrations in different European cities. Period, instrument, diameter ranges and references are reported.
LocationPeriodInstrumentsNt (Diameter Range)Reference
Granada University (urban background)12/04/2012–26/04/2012
22/04/2013–09/05/2013
16/10/2013–14/11/2013
SMPS: electrostatic classifier (TSI 3080) and CPC (TSI 3776)7600 cm−3 (16.5–697.8 nm)
6900 cm−3 (16.5–697.8 nm)
11,900 cm−3 (16.5–697.8 nm), respectively
[21]
Urban background in Rome27/01/2017–28/02/2017TROPOS SMPS: CPC (TSI 3772)12,300 cm−3 (8–800 nm)[19]
Urban background in Vienna01/01/2014–31/01/2015
01/06/2015–01/01/2016
SMPS: Vienna type DMA and CPC (TSI 3775)
SMPS: DMA (TSI 3081) and CPC 3772 or CPC3775, respectively
Median: 5395 cm−3 (10–550 nm)[47]
Urban background in Prague01/01/2014–01/01/2016SMPS TSI 3034Median: 5844 cm−3 (10–550 nm)[47]
AURN urban background (Leicester) (UK)March–June 2014CPC TSI 37836837 cm−3 (10–1093 nm)[15]
BF urban background (Leicester) (UK)March–June 2014CPC TSI 37834737 cm−3 (10–1093 nm)[15]
Publisher’s Note: MDPI stays neutral with regard to jurisdictional claims in published maps and institutional affiliations.

