1. Introduction
The brake system consists of many components, such as a brake operation unit (BOU), a pneumatic operating unit (POU), an electronic control unit (ECU), a friction material, and a mechanical brake actuator, and these components dynamically interact with each other [
1,
2]. Among these components, the BOU is considered the most important unit since the abnormal behavior of the BOU can cause trouble for the reliable and safe running of trains. Hence, it is very important to detect anomalies of the BOU at an early stage. An anomaly case is defined as when the brake is released before departure after stopping, and the BC pressure relief time is delayed by 4 s, as shown in
Figure 1. However, current periodic maintenance and inspection cannot detect early anomalies in time. In addition, constructing a stable and robust anomaly detection system is a very challenging task.
Anomaly detection, also referred to as novelty detection or outlier detection can be defined as detecting data samples that deviate significantly from the majority of data samples. Anomaly detection plays essential roles in broad domains, including AI safety, health and medical risk, financial surveillance, security, risk management, and compliance. In recent years, deep learning has shown appealing prospects in anomaly detection. A deep learning-based model for anomaly detection can be built to classify a test sample as either normal or abnormal using a labeled set that consists of normal and abnormal behavior for training. However, it is very hard to obtain abnormal data. Hence, the anomaly detection model which is trained by the insufficient dataset can yield an inaccurate decision function. On the other hand, it is very easy to obtain normal data. Hence, semi-supervised classification or the one-class classification can be used to detect anomalies for metro vehicles. It works with the assumption that only normal data is used during the training phase, and the data that deviated from the normal behavior are classified as anomalies during the test phase.
In this work, we present a method for detecting anomalies of the BOU on metro vehicles using a one-class long short-term memory (LSTM) autoencoder. First, we extracted BC pressure data from the BOU data since one of the anomaly cases of metro trains is that BC pressure relief time is delayed by 4 s. After that, extracted BC pressure data is split into subsequences which are fed into our proposed one-class LSTM autoencoder that consists of two LSTM blocks (i.e., encoder and decoder). The LSTM autoencoder model is trained using training data which only consists of normal subsequences. To detect anomalies from test data that contains abnormal subsequences, the mean absolute error (MAE) for each subsequence is calculated. We first set the threshold for anomaly detection as the maximum value of MAE in the training (normal) dataset. After that, the subsequence with an MAE greater than the threshold is classified as an anomaly. In our experiment, we demonstrate the performance of our proposed LSTM autoencoder model and four other autoencoder-based models on the BOU dataset from metro trains for anomaly detection. The results show that our proposed one-class LSTM autoencoder can help improving performance significantly. The significance and novelty of this work are that, to the authors’ knowledge, this work is the earliest proposal that uses the one-class LSTM autoencoder for the task of detecting anomalies of the BOU in the braking system of metro trains. Our contribution in this work is summarized as follows:
We designed and implemented a novel model for detecting anomalies of the BOU on metro vehicles using a one-class LSTM Autoencoder.
We proposed a novel method which consists of three steps: (1) extract brake cylinder (BC) pressure data from the BOU data and split it into subsequences, (2) train our novel one-class LSTM autoencoder for our task, and (3) detect anomaly from test data by calculating the mean absolute error (MAE).
We conducted an experiment using the BOU data on the metro in Korea to show the effectiveness of our proposed one-class LSTM autoencoder.
The layout of this study is organized as follows:
Section 2 describes the related work. The proposed method is presented in
Section 3. The experimental settings and results are shown in
Section 4. The conclusion and future work are described in
Section 5.
2. Related Work
Anomaly detection in time series data is one of the most challenging tasks in data science. Anomaly detection problem in time series data has drawn attention in data mining [
3,
4,
5], statistics [
6,
7,
8], and machine learning communities [
9,
10,
11,
12,
13]. In general, supervised, semi-supervised, or unsupervised approaches can be used for detecting anomalies based on the availability of the labeled data. Supervised learning approaches [
14,
15] need labeled dataset for training model and can only detect known anomalies [
16]. However, domain experts are required for the labeling process since most datasets for anomaly detection are not labeled. In addition, manual labeling for the massive datasets is a very expensive and time-consuming process. Hence, in this section, we introduce unsupervised anomaly detection approaches. In recent years, various unsupervised approaches for anomaly detection have been proposed and categorized into traditional machine learning and deep learning approaches.
2.1. Traditional Machine Learning-Based Approaches
Most of the unsupervised approaches use distance-based techniques to detect anomalies [
17]. Jiang et al. [
18] proposed a clustering-based unsupervised intrusion detection (CBUID) technique. They use a novel incremental clustering algorithm to group datasets into clusters with almost the same radius. They labeled these clusters as ‘attack’ or ‘normal’ depending on the ratio of included total points and data points. Also, the labeled clusters are used as a model for new data. Gao et al. [
19] presented a method that combines a clustering technique with the k-nearest neighbor (kNN) to detect anomalies in an unlabeled telemetry dataset. A set of data points near normality is initially selected using the kNN. They consider the data points that lie far away from their nearest neighbors as an anomaly. After that, the model is constructed by the single linkage clustering technique from the selected data points. The distances between clusters and the data points are calculated for new data. After that, the data points which has the minimum distance are selected. The anomaly is then defined as the data points which has a longer distance than the threshold. Breuing et al. [
20] proposed the local outlier factor (LOF) method which assigns to each object the degree of outlierness based on how isolated the object is with respect to its surrounding neighborhoods. It assumes that the distribution of data points is spherical. However, if the distribution of data points is linear, the algorithm cannot estimate the local density correctly [
17]. He et al. [
21] proposed a cluster-based local outlier factor (CBLOF) algorithm which assigns the degree of being an outlier to each object based on the clustering method instead of kNN. Ramaswamy et al. [
22] presented a model for detecting anomaly using the kNN. The anomaly score of data points is calculated by the distance between the data points and their k-th nearest neighbors. The data points are then sorted based on their anomaly score. After that, the anomaly is defined as the first n data points among all sorted points.
Principal component analysis (PCA), which is known for a data transformation method to reduce data dimension [
23], can be used for detecting anomalies. Kwitt et al. [
24] introduced a model for detecting anomalies using a robust PCA. They use the correlation matrix to calculate the principal component scores. Hoffmann et al. [
25] proposed a model for novelty detection using a kernel-PCA that is a non-linear extension of PCA. First, the Gaussian kernel function is used to map the input data into higher-dimensional space. After that, the principal components of the distribution of data points are extracted. Novelties are then measured by calculating the squared distance to the corresponding PCA subspace. Rousseeuw et al. [
26] proposed the PCA-based method for detecting anomalies. An orthogonal distance from the PCA subspace to the data point is calculated. Also, score distance is calculated based on Mahalanobis distance. If the distance is small, the data point is regarded as normal.
The one-class support vector machine (OC-SVM) can be used to detect anomalies in either an unsupervised or semi-supervised manner. Schölkopf et al. [
27] presented a novelty detection method using the unsupervised OC-SVM model which is trained with the whole dataset. However, if there is an anomaly in the training set, the decision boundary of the model will shift toward anomalies. As a result, the learned model does not work well. Amer et al. [
28] proposed an enhanced OC-SVM model that consists of the eta-SVM and the robust OC-SVM to eliminate the previous problem.
The aforementioned techniques can be used for anomaly detection in time-series data. Ma et al. [
29] proposed a time-series novelty detection model using OC-SVM. First, they use the time-delay embedding process to convert time-series data into a set of vectors [
30]. After that, the OC-SVM is applied to these vectors. Hu et al. [
31] presented time-series anomaly detection using the meta-feature-based OC-SVM. For the multivariate time-series dataset, singular value decomposition (SVD) or PCA techniques are used to reduce the dimension of the dataset to one-dimensional sequences. After that, six meta-features from the one-dimensional dataset are extracted. OC-SVM is then applied to six meta-features to detect anomalies. Basu et al. [
32] proposed a kNN-based method that removes noisy data from sensor signals. First, a difference between the data point and the median value of k-th nearest neighbors is calculated. After that, the difference is compared to an appropriate threshold value. However, knowledge about the signal is required to configure an appropriate threshold value.
2.2. Deep Learning-Based Approaches
Recently, deep learning has been successfully applied to the task of anomaly detection. Kieu et al. [
33] proposed two deep learning-based anomaly detection models based on an LSTM autoencoder and a 2-D convolutional autoencoder, respectively. First, the features are enriched by the statistical aspect. After that, the anomaly score is obtained by the difference between the enriched features and reconstructed features from the autoencoder. The feature vectors are ranked according to the anomaly score, and the top 5% of the feature vectors are considered to be outliers. Mohsin et al. [
34] proposed an unsupervised time-series anomaly detection method called DeepAnT, which consists of an anomaly detector and a time-series predictor. In the anomaly detector, the Euclidean distance is used for calculating the anomaly score from the predicted value and actual value. In the time-series predictor, a convolutional neural network (CNN) is used for the time-series regression problem. Zong et al. [
35] presented a model called DAGMM that uses autoencoder and Gaussian Mixture Model (GMM) simultaneously. First, an autoencoder is used to reduce the dimension of input data to obtain latent representations. GMM is then used to estimate the density of the representations. However, the drawback of this model is that it ignores the inherent temporal dependence of time series data. Fraccaro et al. [
36] suggested that the performance of the recurrent neural network (RNN) can be improved by stochastic variables which can capture the probability distributions of time series. Park et al. [
37] proposed a method that combines LSTM and Variational autoencoder (VAE), where the feed-forward layers in a VAE are replaced with LSTM layers. However, the basic assumption for this method is that the time series follows a particular statistical distribution and is linear, making it inapplicable to many practical problems. Malhotra et al. [
38] presented an LSTM-based EncoderDecoder model similar to seq2seq models for anomaly detection in time series. The model aims to reconstruct normal time series data and uses reconstruction errors for detecting anomalies. Hundman et al. [
39] presented a method to detect spacecraft anomalies. They use LSTM for multivariate time series prediction. The anomalies are detected based on prediction errors.
In this work, we tackle the problem of how to automatically detect anomalies from a univariate time series dataset from the BOU data of the metro vehicle. In our anomaly detection framework, we adopt an LSTM autoencoder model similar to [
39]. The difference is that our LSTM autoencoder model uses dropout as a stochastic regularization technique. As a result, our proposed model can deal with statistical noise which often occurs in the BOU data on the metro vehicle in the training data, which results in better performance compared to the model without dropout techniques.
3. Proposed Methods
In this section, the overall architecture of our proposed method is first described. After that, we describe the details of key components in the following subsections.
The architecture of our proposed model for detecting anomalies of the BC data is illustrated in
Figure 2. First, the input BC signal is pre-processed before feeding into the LSTM autoencoder model (
Section 3.1). Second, the pre-processed BC signal from training data (normal) is used as the input of the LSTM autoencoder (
Section 3.2). The LSTM autoencoder model learned from normal BC data is used to detect anomalies from abnormal BC data (
Section 3.3).
3.1. Data Pre-Processing
It is an essential step to standardize data for building machine learning estimators. If a data sample does not follow a standard normal distribution or have a variance that is orders of magnitude greater than others, it may dominate the objective function [
40]. As a result, the estimator cannot learn from other samples correctly. Hence, in our proposed framework, we standardized our data as our data pre-processing step.
3.2. Lstm Autoencoder Model for Anomaly Detection
3.2.1. Long Short Term Memory (LSTM)
LSTM is a type of Recurrent Neural Network (RNN) which allows the network to learn order dependence in a sequence prediction task [
41]. There are different sorts of LSTM models such as LSTM with a peephole connection. However, the LSTM with a peephole connection requires more memory, trainable parameters, and training time. Also, the performance gap between the vanilla LSTM model and the LSTM model with a peephole connection is very little and for certain tasks, the performance of the LSTM model with a peephole connection is even worse than the vanilla LSTM model [
42]. Hence, in this study, we use the vanilla LSTM model which is the default LSTM setting of deep learning frameworks and is widely used for many applications. There are three different control gates for regulating information flow in the vanilla LSTM cell: a forget gate, an input gate, and an output gate. Each gate is composed out of a pointwise multiplication operation and a sigmoid neural network layer. The sigmoid neural network layers output numbers between 0 and 1, indicating a portion of input information that should be let through. Time series data is represented as a sequence of input vectors
which is fed into the LSTM, where
represents an m-dimensional vector at timestamp
t.
Given new information
that entered the network, the forget gate
controls what information in the cell state to forget by outputting a number between 0 and 1 as follows:
where
represents sigmoid activation function,
represents the output of the previous LSTM block (at timestamp
),
and
represent the weight matrix and the bais of the gate, respectively. The input gate
which decides what information is relevant to update in the current LSTM cell state, is defined as follows:
where
represent the weight matrix and the biases of input gate, respectively. After that, a vector of new candidate value
which could be added to the state is create as follows:
where
represents hyperbolic tangent (tanh) activation function,
represent the weight matrix and the biases of memory cell state. Then, the old cell state
is multiplied by
, and added by
that updates the cell state to new values which gives us our new cell state
as follows:
Finally, the output gate
which controls what data to pass as the output hidden state
is defined as follows:
where
and
are the weight matrix and the bias of output gate, respectively.
3.2.2. LSTM Autoencoder
Autoencoder is a sort of unsupervised neural network that aims at learning a representation for a set of data [
43]. A regular autoencoder comprises five components: an input layer, an encoder, a latent space, a decoder, and an output layer. The encoder compresses the input data into a latent space representation, while the decoder decompresses the latent space representation into the output layer. After that, the input data is compared with the encoded-decoded output data and the weights of the network are updated by error backpropagation through the network.
More Specifically, given the input data
, the encoder compresses
x to obtain a latent space representation
. The decoder reconstructs this latent space representation to obtain the output
. The autoencoder model is trained by minimizing the reconstruction loss
L as follows:
The main purpose of the autoencoder is to learn the most important features from the training dataset by constraining the latent space to have a lower dimension than the input, i.e., . There are many types of autoencoders, such as vanilla autoencoder, regularized autoencoder, convolutional autoencoder, and LSTM autoencoder. Among them, LSTM autoencoder is the autoencoder for sequential data such as time series data using an Encoder-Decoder LSTM architecture. LSTM autoencoder is suitable for time-series anomaly detection since it can learn patterns in data over long sequences. In our LSTM autoencoder model, we use dropout for regularization. Dropout is a regularization technique that enables the network to avoid overfitting in the training stage. It reduces the number of active neurons to constrain the learning process of the neural networks.
3.3. Anomaly Detection
We train our LSTM autoencoder model using BC pressure data from the BOU dataset that are labeled as normal. In the testing phase, both normal and abnormal sequences are fed into the network. We used Mean Absolute Error (MAE) as our reconstruction error instead of other metrics such as Mean Squared Error (MSE) and Root Mean Squared Error (RMSE). The reason is that in both MSE and RMSE, the errors are squared before they are averaged. It can lead to higher weights given to larger errors. As a result, the model tends to be more sensitive to noise which might cause false positives. We compute MAE between the input features and the reconstructed features from the LSTM autoencoder. Since the network learns on a normal dataset, The MAE is high for abnormal data and low for normal data. Hence, we used a fixed threshold for reconstruction error and used it as a decision boundary for detecting anomalies. The threshold for anomaly detection was set to the maximum value of MAE in the training (normal) dataset. The sequence with a reconstruction error greater than the threshold is classified as an anomaly, while the sequence with a reconstruction error less than the threshold is classified as a normal data point.
4. Experiments and Results
4.1. Dataset
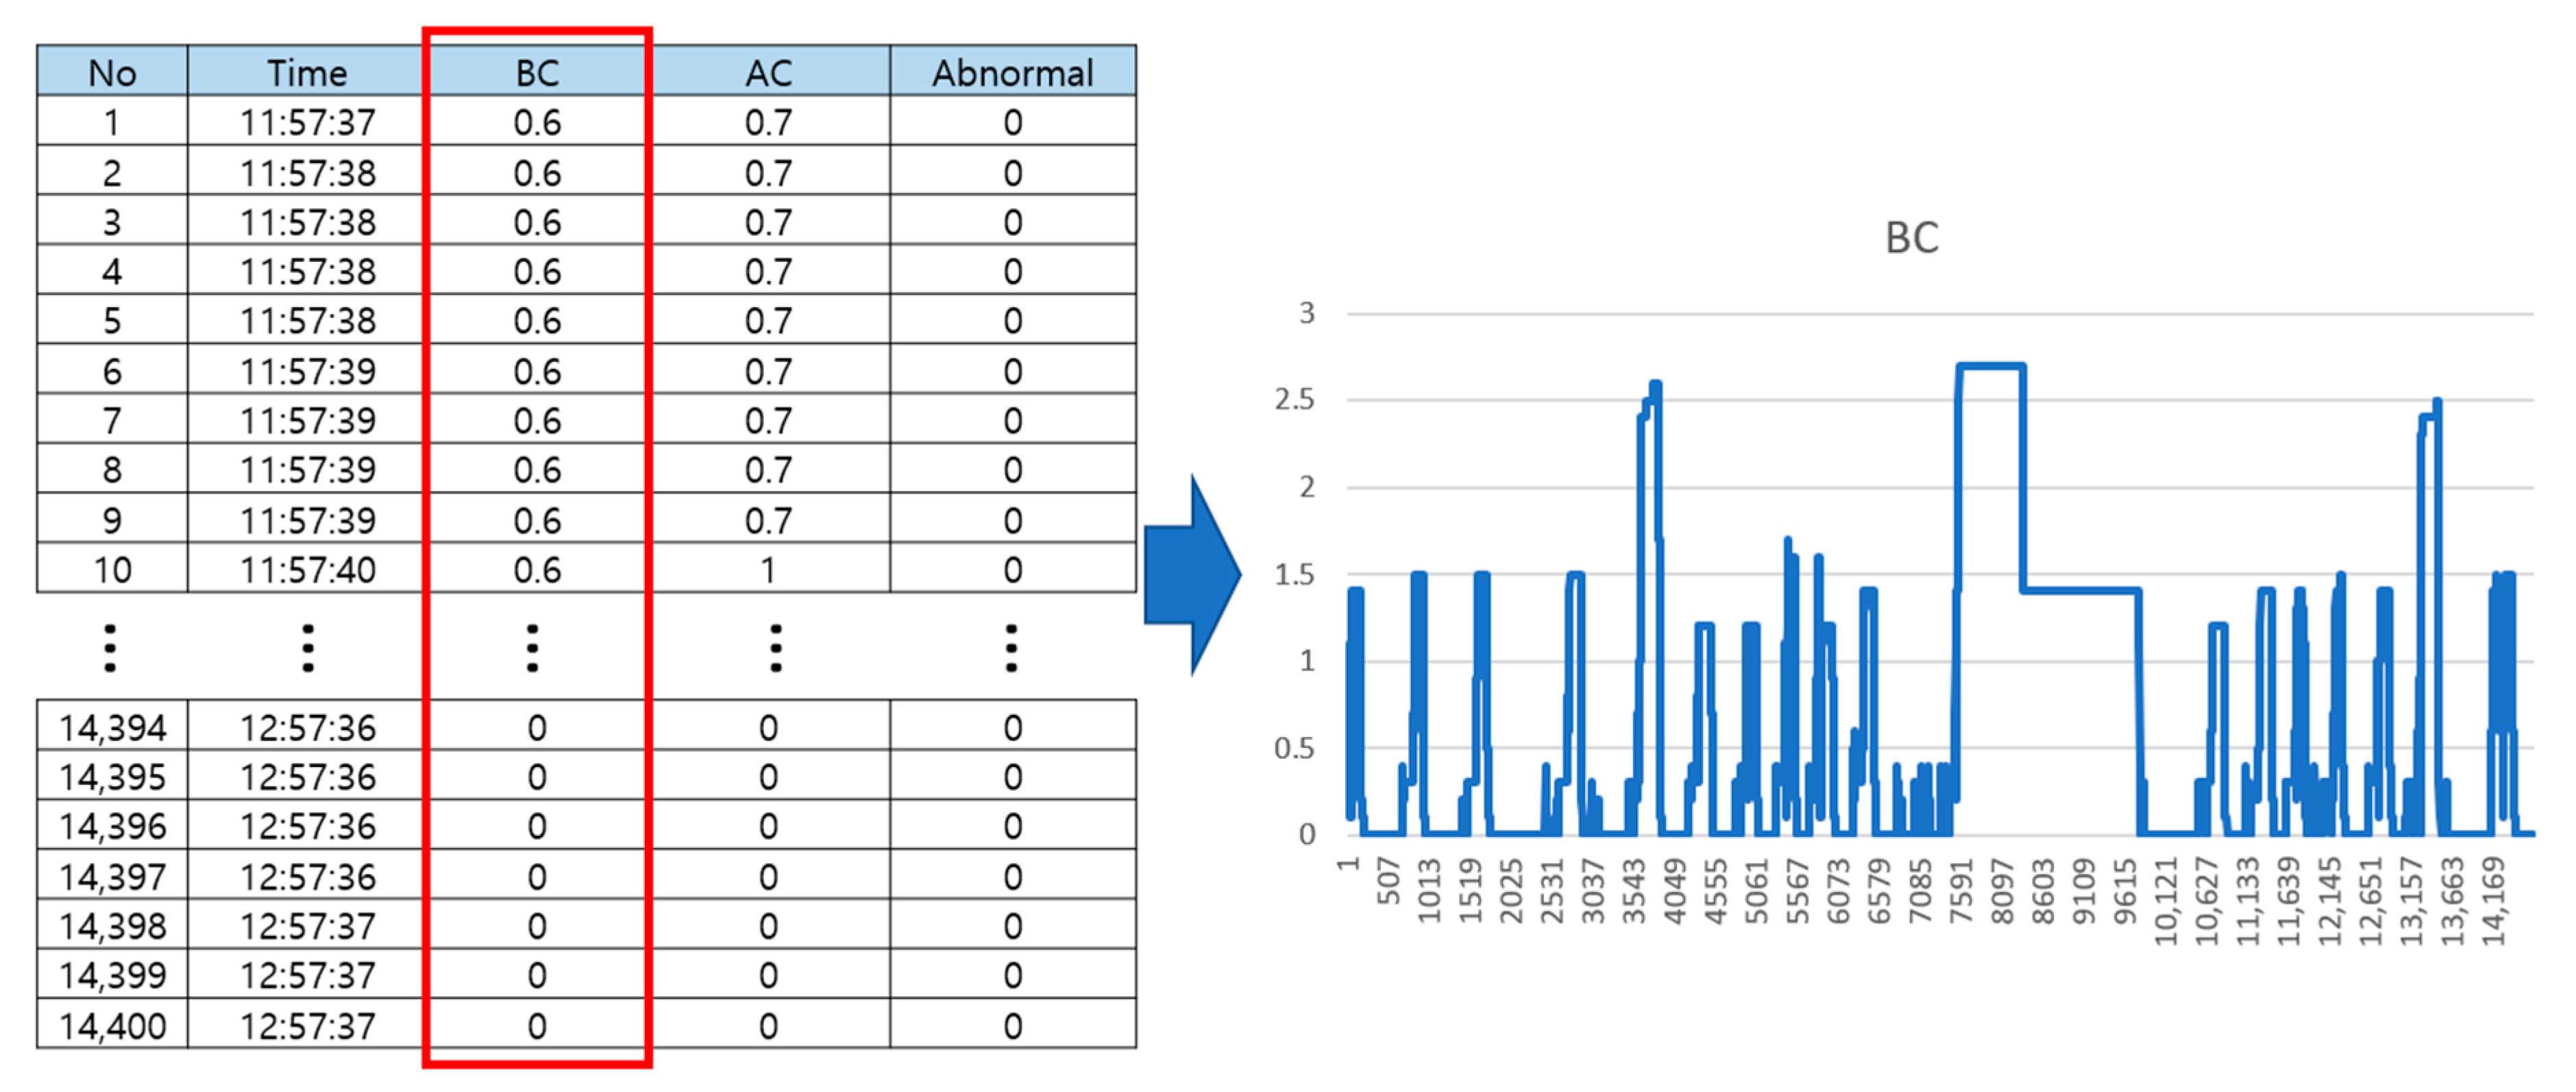
We performed a set of experiments on the BOU dataset taken for the tasks of anomaly detection of BOU on Korea metro vehicles. The train manufacturer is Hyundai Rotem, and the operating organization is KORAIL (Korea Railroad Corporation). Train Control and Management System (TCMS) data of KORAIL’s 40 trains delivered in 2019 among a total of 128 trains were extracted and used. The data used in this study is the TCMS data of the electric control unit (ECU) and BOU devices operated between Seoul and Incheon between January and March 2020. The BOU dataset consists of two different BOU data (normal, abnormal) which were both extracted for an hour every 0.25 s. In abnormal BOU data, the anomaly points are manually labeled by experts. We extracted BC pressure data from the BOU data to build the anomaly detection model as shown in
Figure 3. The normal BOU data is used for the training model to learn the normality of BC pressure data, and the abnormal BOU data is used for the testing model using our trained model to verify the effectiveness of our proposed model in terms of detecting an anomaly.
4.2. Experimental Setting
In our experiment, we design five different autoencoder models for comparison: (1) 1-dimensional Convolutional Neural Network autoencoder (1D-CNN-AE), (2) bi-directional Gated Recurrent Unit autoencoder (biGRU-AE), (3) bi-directional Long Short Term Memory autoencoder (biLSTM-AE), (4) Gated Recurrent Unit autoencoder (GRU-AE), (5) Long Short Term Memory autoencoder (LSTM-AE). We use Adaptive Moment Estimation (Adam) as our optimizer to train the autoencoder models. The initial learning rate is set to 0.0001. We used the scikit-learn library for data pre-processing as described in
Section 3.1. Also, we used the TensorFlow Keras as a deep learning framework to implement five different autoencoder models. All experiments were performed on a PC with an NVIDIA GeForce RTX 3090 GPU.
4.3. Performance Measure
We use precision, recall, F1-score, and detection accuracy as our evaluation metrics for the comparison of different models. The
,
, and
F1-score are defined as follows:
where
(True Positive) is the number of samples correctly classified as an anomaly class,
(False Negative) is the number of samples incorrectly classified as not belonging to an anomaly class, and
(False Positive) is the number of samples incorrectly classified as an anomaly class. Also, detection accuracy can be defined as the proportion of correctly classified regions by a model in total regions as follows:
where
P is the set of peaks from test set and
is the intersection over union (
) for
i-th peak which can be defined as follows:
where
,
, and
are
,
, and
for the region of
i-th peak. In our experiment, threshold for IOU is set to 0.55.
4.4. Results
The predicted anomaly points using our proposed model and the labeled anomaly points are shown in
Figure 4. Also, the precision, recall, F1-score, and detection accuracy of our proposed model and other autoencoder-based models are shown in
Table 1. From these results, three observations were made.
- –
Observation 1. Our proposed model can detect anomaly points around the peak well except the peak with a very long bandwidth.
- –
Analysis.
Figure 4 shows that our proposed model can detect anomaly points around the peak well except the peak with a very long bandwidth. This is because the peaks with very long bandwidth hardly occur in our dataset, which makes our model hard to predict the anomaly points around the peak with very long bandwidth. However, except for the peak with a very long bandwidth, our model can predict anomaly points well since our anomaly detection model is based on LSTM that can capture long-range correlations efficiently.
- –
Observation 2. 1D-CNN autoencoder performs worse than RNN-based autoencoders (biGRU-AE, biLSTM-AE, GRU-AE, LSTM-AE) in terms of precision, recall, F1-score, and detection accuracy.
- –
Analysis.
Table 1 shows that 1D-CNN autoencoder performs worse than RNN-based autoencoders (biGRU-AE, biLSTM-AE, GRU-AE, LSTM-AE) in terms of precision, recall, F1-score, and detection accuracy. This is because CNN in 1D-CNN autoencoder use only time or frequency domain data as input, which results in the insufficient extraction of time-series data features. Also, CNN can extract spatial features but cannot extract temporal features of time-series data since CNN does not retain a memory of previous time-series patterns, which is not suitable for time-series data. However, LSTM or GRU in RNN-based autoencoders is a special RNN structure that can effectively process time-series data and enhance the generalization ability of a model via a gate structure. Therefore, RNN-based autoencoders outperform 1D-CNN autoencoder.
- –
Observation 3. LSTM autoencoder performs best among other models in terms of precision, recall, F1-score, and detection accuracy.
- –
Analysis.
Table 1 shows that the LSTM autoencoder performs best among other models in terms of precision, recall, F1-score, and detection accuracy. Also, LSTM-based models (biLSTM-AE, LSTM-AE) outperform GRU-based models (biGRU-AE, GRU-AE). This is because GRU in GRU-based models doesn’t have a memory unit for controlling information flow, and it just exposes the full hidden content without any control while LSTM in LSTM-based models uses a memory unit to control information flow. Hence, LSTM-based models can remember longer sequences and have greater expressive power than GRU-based models. Also, bi-directional RNN models perform worst than one-directional RNN models. This is because the anomaly points are located after each peak of the BC pressure signal. Hence, the direction information is very important. However, bi-directional RNN models consider both directions, which makes our model confusing to predict the anomaly points. Also, bi-directional RNN models are more complex and need a larger amount of data to train compared to normal RNN models. However, the size of our BOU dataset is not large, which makes us difficult to train the complex bi-directional RNN model without additional techniques such as incremental learning [
44] and few-shot learning [
45]. Hence, normal RNN models can handle our BOU dataset better than bi-directional RNN models.
5. Conclusions and Future Work
In summary, we have presented a method for detecting anomalies of brake operating units on the metro vehicle using an LSTM autoencoder-based one-class classifier. In our proposed framework, we first extracted BC pressure data from the BOU data. After that, the extracted BC pressure data is split into subsequences which are fed into our proposed LSTM autoencoder model which consists of two LSTM blocks (encoder and decoder). The LSTM autoencoder model is trained using training data which only consists of normal subsequences. To detect anomalies from the test data that contains abnormal subsequences, the mean absolute error (MAE) on the test data is calculated. The test sequences with MAE larger than the predefined threshold are regarded as an anomaly. We conducted the experiments with the BOU data of metro trains in Korea. Experimental result demonstrates that our proposed model can detect anomalies of the BOU data well. The result indicated that our proposed method using LSTM autoencoder is suitable for detecting anomalies of BOU on metro vehicles. Although the performance of our proposed method is promising, further research needs to be done to tackle the limitations of our method which are (1) it cannot be used for a real-time system since the inference time is long and (2) the number of abnormal cases in BOU dataset is very small. Therefore, we plan to reduce the size of the model using knowledge distillation approaches in order to reduce the inference time and deploy a real-time anomaly detection system. Also, we plan to use data augmentation techniques to generate more abnormal cases to build a more robust model. In addition, we plan to develop an anomaly detection model for another type of BOU anomaly case defined as when the BC pressure is greater than the AC (air cylinder) pressure in some sections where the braking pressure rises before stopping.
Author Contributions
Conceptualization, J.G.; methodology, J.K. and J.G.; software, J.K. and J.G.; validation, J.K. and J.G.; formal analysis, J.K. and J.G.; investigation, J.K. and J.G.; resources, C.-S.K. and J.G.; data curation, C.-S.K. and J.W.K.; writing—original draft preparation, J.K., C.-S.K., J.W.K. and J.G.; writing—review and editing, J.K. and J.G.; visualization, J.K.; supervision, J.G.; project administration, C.-S.K. and J.W.K.; funding acquisition, C.-S.K. and J.W.K. All authors have read and agreed to the published version of the manuscript.
Funding
This research is supported by the Korea Agency for Infrastructure Technology Advancement (KAIA) grant funded by the Ministry of Land, Infrastructure and Transport (Grant21QPWO-B152223-03).
Institutional Review Board Statement
Not applicable.
Informed Consent Statement
Not applicable.
Data Availability Statement
Not applicable.
Acknowledgments
The authors would like to thank Ho-Chul Ki for his assistance in acquiring the BOU dataset.
Conflicts of Interest
The authors declare no conflict of interest.
References
- Louf, R.; Roth, C.; Barthelemy, M. Scaling in transportation networks. PLoS ONE 2014, 9, e102007. [Google Scholar] [CrossRef] [Green Version]
- Gershenson, C.; Pineda, L.A. Why does public transport not arrive on time? The pervasiveness of equal headway instability. PLoS ONE 2009, 4, e7292. [Google Scholar] [CrossRef] [Green Version]
- Keogh, E.; Lonardi, S.; Chiu, B.Y.C. Finding surprising patterns in a time series database in linear time and space. In Proceedings of the Eighth ACM SIGKDD International Conference on Knowledge Discovery and Data Mining, Edmonton, AB, Canada, 23–26 July 2002; pp. 550–556. [Google Scholar]
- Muthukrishnan, S.; Shah, R.; Vitter, J.S. Mining deviants in time series data streams. In Proceedings of the 16th International Conference on Scientific and Statistical Database Management, Santorini Island, Greece, 23 June 2004; pp. 41–50. [Google Scholar]
- Sun, P.; Chawla, S.; Arunasalam, B. Mining for outliers in sequential databases. In Proceedings of the 2006 SIAM International Conference on Data Mining, Society for Industrial and Applied Mathematics, Bethesda, MD, USA, 1 April 2006; pp. 94–105. [Google Scholar]
- Burman, J.P.; Otto, M.C. Census Bureau Research Project: OUTLIERS in Time Series; SRD Res. Rep. CENSUS/SRD/RR-88114; Bureau of the Census: Suitland, MD, USA, 1988. [Google Scholar]
- Siffer, A.; Fouque, P.A.; Termier, A.; Largouet, C. Anomaly detection in streams with extreme value theory. In Proceedings of the 23rd ACM SIGKDD International Conference on Knowledge Discovery and Data Mining, Halifax, NS, Canada, 13–17 August 2017; pp. 1067–1075. [Google Scholar]
- Vallis, O.; Hochenbaum, J.; Kejariwal, A. A novel technique for long-term anomaly detection in the cloud. In Proceedings of the 6th USENIX Workshop on Hot Topics in Cloud Computing (HotCloud 14), Philadelphia, PA, USA, 17–18 June 2014. [Google Scholar]
- Guha, S.; Mishra, N.; Roy, G.; Schrijvers, O. Robust random cut forest based anomaly detection on streams. In Proceedings of the International Conference on Machine Learning, PMLR, New York, NY, USA, 19–24 June 2016; pp. 2712–2721. [Google Scholar]
- Laptev, N.; Amizadeh, S.; Flint, I. Generic and scalable framework for automated time-series anomaly detection. In Proceedings of the 21th ACM SIGKDD International Conference on Knowledge Discovery and Data Mining, Sydney, Australia, 10–13 August 2015; pp. 1939–1947. [Google Scholar]
- Lavin, A.; Ahmad, S. Evaluating real-time anomaly detection algorithms–the Numenta anomaly benchmark. In Proceedings of the 2015 IEEE 14th International Conference on Machine Learning and Applications (ICMLA), Miami, FL, USA, 9–11 December 2015; pp. 38–44. [Google Scholar]
- Xu, Z.; Kersting, K.; Von Ritter, L. Stochastic Online Anomaly Analysis for Streaming Time Series. In Proceedings of the International Joint Conference on Artificial Intelligence, Melbourne, Australia, 19–25 August 2017; pp. 3189–3195. [Google Scholar]
- Dubey, S.; Boragule, A.; Gwak, J.; Jeon, M. Anomalous Event Recognition in Videos Based on Joint Learning of Motion and Appearance with Multiple Ranking Measures. Appl. Sci. 2021, 11, 1344. [Google Scholar] [CrossRef]
- Park, D.; Kim, H.; Hoshi, Y.; Erickson, Z.; Kapusta, A.; Kemp, C.C. A multimodal execution monitor with anomaly classification for robot-assisted feeding. In Proceedings of the 2017 IEEE/RSJ International Conference on Intelligent Robots and Systems (IROS), Vancouver, BC, Canada, 24–28 September 2017; pp. 5406–5413. [Google Scholar]
- Rodriguez, A.; Bourne, D.; Mason, M.; Rossano, G.F.; Wang, J. Failure detection in assembly: Force signature analysis. In Proceedings of the 2010 IEEE International Conference on Automation Science and Engineering, Toronto, ON, Canada, 21–24 August 2010; pp. 210–215. [Google Scholar]
- Martínez-Heras, J.A.; Donati, A. Enhanced telemetry monitoring with novelty detection. AI Mag. 2014, 35, 37–46. [Google Scholar] [CrossRef] [Green Version]
- Goldstein, M.; Uchida, S. A comparative evaluation of unsupervised anomaly detection algorithms for multivariate data. PLoS ONE 2016, 11, e0152173. [Google Scholar] [CrossRef] [Green Version]
- Jiang, S.; Song, X.; Wang, H.; Han, J.J.; Li, Q.H. A clustering-based method for unsupervised intrusion detections. Pattern Recognit. Lett. 2006, 27, 802–810. [Google Scholar] [CrossRef]
- Gao, Y.; Yang, T.; Xu, M.; Xing, N. An unsupervised anomaly detection approach for spacecraft based on normal behavior clustering. In Proceedings of the Fifth International Conference on Intelligent Computation Technology and Automation, Zhangjiajie, China, 12–14 January 2012. [Google Scholar]
- Breunig, M.M.; Kriegel, H.P.; Ng, R.T.; Sander, J. LOF: Identifying density-based local outliers. In Proceedings of the 2000 ACM SIGMOD International Conference on Management of Data, Dallas, TX, USA, 16–18 May 2000. [Google Scholar]
- He, Z.; Xu, X.; Deng, S. Discovering cluster-based local outliers. Pattern Recognit. Lett. 2003, 24, 1641–1650. [Google Scholar] [CrossRef]
- Ramaswamy, S.; Rastogi, R.; Shim, K. Efficient algorithms for mining outliers from large data sets. In Proceedings of the 2000 ACM SIGMOD International Conference on Management of Data, Dallas, TX, USA, 16–18 May 2000. [Google Scholar]
- Li, M.; Yu, X.; Ryu, K.H.; Lee, S.; Theera-Umpon, N. Face recognition technology development with Gabor, PCA and SVM methodology under illumination normalization condition. Clust. Comput. 2018, 21, 1117–1126. [Google Scholar] [CrossRef]
- Kwitt, R.; Hofmann, U. Robust methods for unsupervised PCA-based anomaly detection. In Proceedings of the IEEE/IST Workshop on Monitoring, Attack Detection and Mitigation, Tuebingen, Germany, 28–29 September 2006. [Google Scholar]
- Hoffmann, H. Kernel PCA for novelty detection. Pattern Recognit. 2018, 40, 863–874. [Google Scholar] [CrossRef]
- Rousseeuw, P.J.; Hubert, M. Anomaly detection by robust statistics. Data Min. Knowl. Discov. 2018, 8, e1236. [Google Scholar] [CrossRef] [Green Version]
- Schölkopf, B.; Williamson, R.; Smola, A.; Shawe-Taylor, J.; Platt, J. Support Vector Method for Novelty Detection. Adv. Neural Inf. Process. Syst. 2000, 12, 582–588. [Google Scholar]
- Amer, M.; Goldstein, M.; Abdennadher, S. Enhancing One-class Support Vector Machines for Unsupervised Anomaly Detection. In Proceedings of the ACM SIGKDD Workshop on Outlier Detection and Description, Chicago, IL, USA, 1 August 2013. [Google Scholar]
- Ma, J.; Perkins, S. Time-series novelty detection using one-class support vector machines. In Proceedings of the International Joint Conference on Neural Networks, Portland, OR, USA, 20–24 July 2003. [Google Scholar]
- Packard, N.H.; Crutchfield, J.P.; Farmer, J.D.; Shaw, R.S. Geometry from a time series. Phys. Rev. Lett. 1980, 45, 712. [Google Scholar] [CrossRef]
- Hu, M.; Ji, Z.; Yan, K.; Guo, Y.; Feng, X.; Gong, J.; Dong, L. Detecting anomalies in time series data via a meta-feature based approach. IEEE Access 2018, 6, 27760–27776. [Google Scholar] [CrossRef]
- Basu, S.; Meckesheimer, M. Automatic outlier detection for time series: An application to sensor data. Knowl. Inf. Syst. 2007, 11, 137–154. [Google Scholar] [CrossRef]
- Kieu, T.; Yang, B.; Jensen, C.S. Outlier detection for multidimensional time series using deep neural networks. In Proceedings of the 19th IEEE International Conference on Mobile Data Management (MDM), Aalborg, Denmark, 26–28 June 2018. [Google Scholar]
- Munir, M.; Siddiqui, S.A.; Dengel, A.; Ahmed, S. Deepant: A deep learning approach for unsupervised anomaly detection in time series. IEEE Access 2018, 7, 1991–2005. [Google Scholar] [CrossRef]
- Zong, B.; Song, Q.; Min, M.R.; Cheng, W.; Lumezanu, C.; Cho, D.; Chen, H. Deep autoencoding gaussian mixture model for unsupervised anomaly detection. In Proceedings of the INTERNATIONAL Conference on Learning Representations, Macau, China, 26–28 February 2018. [Google Scholar]
- Fraccaro, M.; Sønderby, S.K.; Paquet, U.; Winther, O. Sequential neural models with stochastic layers. arXiv 2016, arXiv:1605.07571. [Google Scholar]
- Park, D.; Hoshi, Y.; Kemp, C.C. A multimodal anomaly detector for robot-assisted feeding using an lstm-based variational autoencoder. IEEE Robot. Autom. Lett. 2018, 3, 1544–1551. [Google Scholar] [CrossRef] [Green Version]
- Malhotra, P.; Ramakrishnan, A.; Anand, G.; Vig, L.; Agarwal, P.; Shroff, G. LSTM-based encoder-decoder for multi-sensor anomaly detection. arXiv 2016, arXiv:1607.00148. [Google Scholar]
- Hundman, K.; Constantinou, V.; Laporte, C.; Colwell, I.; Soderstrom, T. Detecting spacecraft anomalies using lstms and nonparametric dynamic thresholding. In Proceedings of the 24th ACM SIGKDD International Conference on Knowledge Discovery and Data Mining, London, UK, 19–23 August 2018; pp. 387–395. [Google Scholar]
- Scikit-Learn Developers. Scikit-Learn User Guide. Release 0.21.dev0. 2018. Available online: https://scikit-learn.org/stable/modules/generated/sklearn.preprocessing.StandardScaler.html (accessed on 20 June 2021).
- Hochreiter, S.; Schmidhuber, J. Long short-term memory. Neural Comput. 1997, 9, 1735–1780. [Google Scholar] [CrossRef]
- Landi, F.; Baraldi, L.; Cornia, M.; Cucchiara, R. Working Memory Connections for LSTM. Neural Netw. 2021, 144, 334–341. [Google Scholar] [CrossRef]
- Kramer, M.A. Nonlinear principal component analysis using autoassociative neural networks. AIChE J. 1991, 37, 233–243. [Google Scholar] [CrossRef]
- Yu, J.; Gwak, J.; Lee, S.; Jeon, M. An incremental learning approach for restricted boltzmann machines. In Proceedings of the 2015 International Conference on Control, Automation and Information Sciences (ICCAIS), Changshu, China, 29–31 October 2015; pp. 113–117. [Google Scholar]
- Wang, Y.; Yao, Q.; Kwok, J.T.; Ni, L.M. Generalizing from a few examples: A survey on few-shot learning. ACM Comput. Surv. (CSUR) 2020, 53, 1–34. [Google Scholar] [CrossRef]
| Publisher’s Note: MDPI stays neutral with regard to jurisdictional claims in published maps and institutional affiliations. |
© 2021 by the authors. Licensee MDPI, Basel, Switzerland. This article is an open access article distributed under the terms and conditions of the Creative Commons Attribution (CC BY) license (https://creativecommons.org/licenses/by/4.0/).


