Featured Application
A theoretical model that allows analyzing the effects of spray pressure on drop size distribution was devised. The model can be used to predict nozzle spray quality parameters under ordinary working conditions.
Abstract
For spray applications, drop size is the most important feature as it affects all aspects of a phytosanitary treatment: biological efficacy, environmental pollution, and operator safety. In turn, drop size distribution depends on nozzle type, liquid properties, and working pressure. In this research, three nozzles were studied under ordinary working conditions and the effect of pressure on drop size distribution was assessed. The nozzles under test, all from Albuz (France), were an orange hollow cone nozzle ATR 80 (European color code), an air induction flat spray nozzle AVI 11003, and an air induction hollow cone nozzle TVI 8002. The ATR 80 and the TVI 8002 nozzles were tested at four pressure values: 0.3, 0.5, 1.0, and 1.5 MPa; the AVI 11003 nozzle was tested at 0.3 and 0.5 MPa. The drop size measurement technique was based on the liquid immersion method by using a custom-made test bench; spray quality parameters were computed by means of suitable functions written in R language. Results showed that an increase in working pressure caused an increase in drop pulverization regardless of the type of nozzle, and drop pulverization was higher for the turbulence nozzle than for the two air induction nozzles. Based on skewness and kurtosis values, the theoretical gamma distribution was the most adapt to fit the experimental data. The scale parameter showed a decreasing trend with the increase in the pressure, a clear index of higher drop pulverization.
1. Introduction
The application of Plant Protection Products (PPPs) is affected by many factors, among which drop size is the most important as it affects biological efficacy [1], environmental pollution [2,3], and operator safety [4,5,6]. In fact, the correct spray spectrum is capable of ensuring the required dose on the target, minimizing drift and ground losses, and reducing dermal and inhalation worker exposure. A research of Ferguson et al. (2016) [7] aimed at assessing spray deposit and canopy penetration of nozzles with different spray qualities in an oat canopy, showed that droplet number densities were inversely related to the droplet size produced by the nozzles, yet coverage was increased more by application volume rate than droplet size. Another study by Zwertvaegher et al. (2014) [8] showed that drop size also affects spray retention, i.e., the overall capture of spray droplets by plants on initial or subsequent impact, so influencing efficacy, economic losses, and environmental contamination. The most known example of the environmental impact of pesticide application related to drop size is spray drift: small droplets are more easily deflected out of the target area by wind action [9]. The adoption of low-drift nozzles [10,11,12], sprayer calibration by means of test benches [13,14,15], and direct or indirect drift measurement [16,17,18,19], are common practices to reduce spray drift.
To know the drop size distribution of nozzles under ordinary working conditions is, therefore, of great interest to guide the most appropriate choice in relation to target structure, liquid properties, and environmental conditions. Drop size measurement is based on several principles, both intrusive and non-intrusive.
Intrusive measurement techniques include the image analysis of the drop stains on water sensitive papers (WSPs) and the liquid immersion method. WSPs are semi-rigid papers, with one side covered with a special yellow film that turns deep blue when hit by a drop of water [20]. The analysis of stains by means of image processing software, under some limitations, allows sizing the drop diameters [21,22,23,24,25]. In the liquid immersion method, droplets are collected on Petri dishes containing lightly viscose liquids, such as Vaseline, light mineral oil, and silicone oil, which cause drops to form spherical shapes. They are immediately photographed or observed with a microscope, allowing drop counting and size measurement [26,27].
Non-intrusive methods include high speed imaging (HSI) [28,29,30], laser diffraction (LD) [31,32,33], and Phase Doppler Particle Analyzers (PDPA) [34,35,36]. HSI and PDPA methods also allow measuring of drop velocity.
Each measurement technique gives results that are significantly different, depending on measuring protocol, settings, and type of measuring equipment [35,37,38], so much so that the international standard ISO 25358:2018 [39] recommends basing nozzle classification on comparison with reference nozzles.
In this study, a low-cost custom-made system that allows measuring of the drop size of agricultural spray nozzles under ordinary working conditions was used. The design of the equipment was mainly based on the ISO 5682-1 standard [40], which exploits the liquid immersion method. Three nozzles were tested, all from Albuz (France): an orange hollow cone nozzle ATR 80 (European color code), an air induction flat spray nozzle AVI 11003, and an air induction hollow cone nozzle TVI 8002. The ATR 80 and the TVI 8002 nozzles were tested at four pressure values: 0.3, 0.5, 1.0, and 1.5 MPa; the AVI 11003 nozzle was tested at 0.3 and 0.5 MPa. For each test condition, the usual spray parameters were computed: the arithmetic mean diameter, the Sauter mean diameter, the volumetric diameters , , and , and the Relative Span Factor (RSF). Finally, the theoretical drop size distribution that best fitted the experimental data was devised and the effects of spray pressure were analyzed.
2. Materials and Methods
2.1. The Test Bench for Drop Size Measurement
The test bench used for spray drop size measurement is fully descripted in [41,42], here summarized for completeness. The design was based on the ISO 5682-1 standard [40], exploiting the liquid immersion method to measure droplet size [26,27]. The hydraulic circuit was designed to reproduce the circuit installed on commercial sprayers. A two-diaphragm pump (AR 30, Annovi Reverberi, Reggio Emilia, Italy), driven at 56 rad/s (540 rpm) by a 2.2 kW AC motor with a gearbox, was used to provide the required pressure at the nozzle under test. The fluid in excess was recirculated into the 70 L main tank by means of a manual pressure regulator. Pressure near the nozzle and liquid flow rate were measured in real time by a pressure transmitter (Series 22 S, Keller Italy Srl, Milano, Italy) and a flow rate meter (SF800-6, Swissflow BV, The Netherlands). The two sensor signals were acquired by two Advantech Ethernet modules (ADAM6024 and ADAM6060). An ASCII UDP based protocol was used for communication with host PC, where a specifically designed user interface was running.
The nozzle under test was anchored to a mobile platform, capable of translating along two 3 m long rails while spraying above the target plane at a distance of 0.5 m. The motion was handled by a motor control unit (MDC1460 model, Roboteq Inc., Scottsdale, AZ, USA), capable of controlling position, speed, and acceleration profiles.
The software user interface, running on a Windows 10 PC, was designed to allow the management of all the aspects of the spray trials, including data save in a text Comma Separated Value (CSV) file. A schematic view of the whole system is reported in Figure 1.
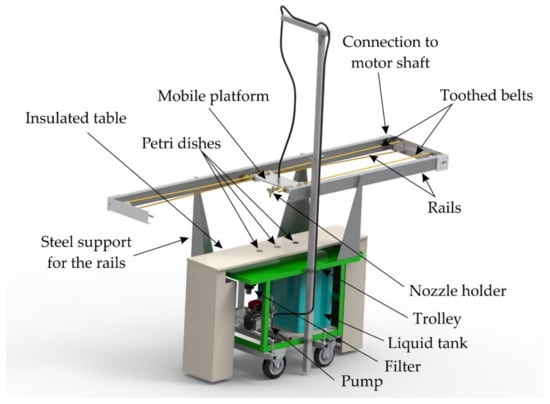
Figure 1.
Scheme of the test bench for drop size measurement.
Sprayed droplets were captured by Petri dishes containing silicone oil as immersion liquid positioned on the target plane and then photographed in situ by a high resolution (4000 × 6000 pixel) Digital Single-Lens Reflex (DSLR) camera (Nikon D5500, Nikon Corporation, Tokyo, Japan), equipped with a macro lens (Nikon Micro Nikkor AF-S 60 mm f/2.8 G ED, Nikon Corporation, Tokyo, Japan) and an electronic flash (Neewer 48 Macro LED Ring Flash, Shenzen, Guangdong, China). Images, saved as high-quality JPEG files, were then analyzed by means of an image processing software, capable of detecting and measuring the size of all the drops.
2.2. The Experimental Trials
Spraying tests were carried out using three Albuz (France) commercial nozzles: an orange hollow cone nozzle ATR 80 (European color code), an air induction flat spray nozzle AVI 11003, and an air induction hollow cone nozzle TVI 8002. The ATR 80 and the TVI 8002 nozzles were tested at four pressure values: 0.3, 0.5, 1.0, and 1.5 MPa; the AVI 11003 nozzle was tested only at 0.3 and 0.5 MPa to respect its working range.
All tests were carried out at the same velocity of the mobile platform: 1.5 m/s. Spray droplets were captured by means of three Petri dishes, with diameter of 55 mm, aligned with the movement direction of the nozzle, spaced 195 mm apart. Each Petri dish contained 5 mL of silicone oil (AR200, Sigma-Aldrich, Milan, Italy) with dynamic viscosity of 200 mPa·s and volumetric mass of 1050 kg/m3. A water solution containing 2 g/L of the coloring agent red Ponceau (Novema Srl, Turin, Italy) was sprayed as test liquid; the red color of the solution facilitated the subsequent image segmentation process to identify the droplets with respect to the background (Figure 2). In these first trials, the surface tension of liquid was not measured.
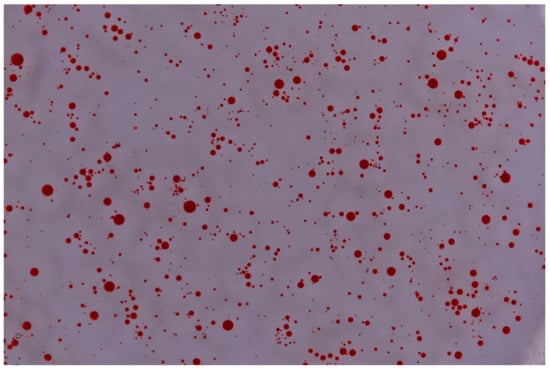
Figure 2.
Example of image with droplets.
Photos were taken without moving the Petri dishes and immediately after each spraying test. To this end, the camera was applied to a metallic frame, which in turn was manually hung to the rails in fixed positions with respect to the Petri dishes (Figure 3). The camera was remotely controlled via the qDslrDashboard Version 3.5.3 application (http://dslrdashboard.info, accessed on 26 April 2018) running on an Android tablet. Three repetitions were carried out for each test condition (nozzle type × spraying pressure), for a total of 90 photos.
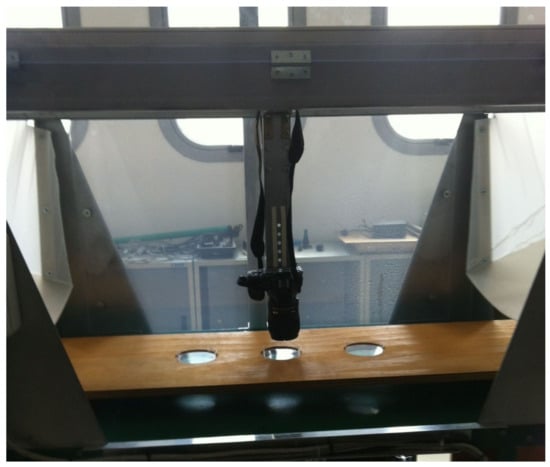
Figure 3.
The camera applied to the rails above a Petri dish.
In addition, some photos of a 10 × 10 mm grid pattern engraved on a glass disc, placed in correspondence with the three Petri dish positions, as far from the camera focal plane as the drops, were used to calibrate the measurement system and to calculate the calibration factor expressed in µm/pixel.
2.3. Spray Parameters Calculation
The images with the droplets were processed with the ImageJ analysis software, ver. 1.52a [43]. They were first converted in 8-bit gray scale images and then segmented to detect the droplets with respect to the background. After segmentation, the watershed binary filter was applied to separate some touching particles. Particles up to 4 contiguous pixels were considered as noise and then ignored.
Among the numerous characteristic parameters provided by the software for the i-th identified particle, only the area (pixel) was considered. Assuming that the droplet was a sphere and that it was not deformed by the silicone oil, its diameter (pixel) was calculated according to Equation (1)
The distance in pixel provided by Equation (1) was then converted in real world distance by applying the measured calibration factor (µm/pixel)
Knowing the diameter of all the N droplets detected in each repetition, the following mean diameters were calculated:
Arithmetic mean diameter
Surface mean diameter
Volume mean diameter
Sauter mean diameter (SMD)
Other diameters, usually adopted to classify agricultural nozzles in terms of spray quality, were computed with reference to the volume of liquid carried by the droplets. Given a droplet with diameter (μm), its volume (μm3) was calculated according to Equation (7)
Sorting the droplets in increasing order by their diameter, the cumulative volume (%) corresponding to the diameter was calculated according to Equation (8)
being the total volume carried by all the N droplets. Knowing the cumulative volume, the following volumetric diameters were computed:
: the diameter such that ;
: the diameter such that , also known as Volumetric Median Diameter (VMD);
: the diameter such that .
In general, the volumetric diameter is the diameter such that the α% of the total volume is carried by droplets with diameter lower than . These diameters, especially the VMD, are used to classify the nozzles in terms of drop pulverization. An index of uniformity of the spray is provided by the Relative Span Factor (RSF, %)
All diameters were calculated for each repetition, considering the three Petri dishes together in such a way to have a significant drop sample (at least 2000 droplets), and mean values were reported. The calculations were carried out by means of custom functions written in R language, ver. 3.6.3 [44].
2.4. Drop Size Distribution Modelling
Drop size can be described by means of a suitable probability density function (PDF) of the number or the volume of the drops in function of the diameter. In a spray consisting of drops, denoting the PDF of the drop number with , the quantity represents the number of drops whose diameter is between D and (D + dD). Several PDFs have been proposed in the spray literature to describe the drop size distribution, among which the normal, the log-normal, the Rosin-Rammler, the Weibull, and the gamma [45,46,47]. In this study, the experimental data were analyzed, and the theoretical distribution, from those mentioned above, that best described them was devised, adjusting its parameters according to the operating conditions. The theoretical study of the atomization process as a function of nozzle characteristics, liquid properties, and test conditions is outside the scope of the research.
Based on skewness and kurtosis values of measured drop diameters, the theoretical distribution most suitable for fitting experimental data was the gamma distribution. The probability density function of the gamma distribution has the general form of Equation (10)
defined for , , and ; α is the shape parameter, β is the scale parameter, and is the gamma function, defined as
Both shape and scale parameters affect the probability density and the cumulative distribution function (CDF) as shown in Figure 4 and Figure 5.
Figure 4.
Effect of the scale and shape parameter on the gamma probability density function.
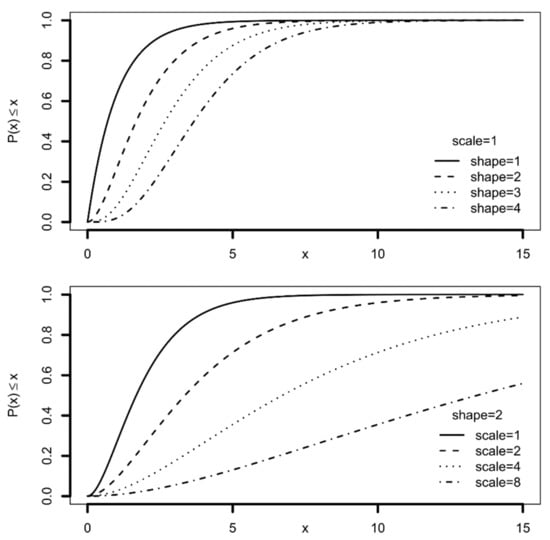
Figure 5.
Effect of the scale and shape parameter on the gamma cumulative distribution function.
In this study, the shape and scale parameters were estimated for each nozzle and working pressure by using the R package fitdistrplus ver 1.1-5 [48] and applying the Maximum Likelihood Estimation (MLE) method. In addition, their confidence interval was computed based on the bootstrap method. Goodness of fit was assessed by means of the Anderson–Darling (AD) test.
3. Results
3.1. General Results
Table 1 summarizes the nozzle flow rate values measured during the tests as affected by spraying pressure.

Table 1.
Nozzle flow rate values in function of spraying pressure.
According to the nozzle manufacturer information, the relative deviations with respect to the nominal flow rates are always lower than the relative tolerance of ±5% admitted by the ISO 10625 reference [49].
The average resolution value of the image analysis system was 188.3 pixel/mm, ranging from 185.7 to 191.2 pixel/mm. The corresponding average calibration factor was 5.31 µm/pixel, ranging from 5.23 to 5.39 µm/pixel. On average, to neglect particles lower than 5 contiguous pixels means neglecting drops with a diameter lower than 12 µm, and this can be considered an acceptable approximation with the used measurement system.
3.2. Drop Size Parameters
Table 2 summarizes the characteristic diameters of the sprays as affected by nozzle type and working pressure.
Table 2.
Average characteristic diameters of the sprays (diameters in µm, RSF in percent).
Results were consistent with expectations: in fact, drop pulverization was higher for the turbulence nozzle than for the two air induction nozzles. As an example, at the pressure of 0.5 MPa, VMD was 147 µm for the ATR 80 orange, 624 µm for the TVI 8002, and 449 µm for the AVI 11003 nozzle. In addition, all diameters were affected by pressure: an increase in the spraying pressure caused an increase in the drop pulverization, regardless of the type of nozzle. When the pressure increased from 0.3 to 1.5 MPa, VMD decreased by 21.8% for the ATR 80 (from 174 to 136 µm) and by 51.8% for the TVI 8002 (from 861 to 415 µm). The reduction in VMD for AVI 11003 was 11.3% (from 506 to 449 µm) when the pressure increased from 0.3 to 0.5 MPa. Relative Span Factor values generally increased when the pressure increased for all nozzles, a sign of a lower uniformity in drop size distribution.
The effects of spray pressure on cumulative volumetric curves are shown in Figure 6 in function of drop diameters and nozzle types. The graph was obtained by considering all the drops of all repetitions. The effect of pressure on the hollow cone ATR 80 nozzle was more evident when the pressure increased from 0.3 to 0.5 MPa (VMD decreased from 174 to 147 µm), whereas above 0.5 MPa the cumulative volumetric curves were almost superimposed (VMD decreasing from 147 to 136 µm only). Instead, the cumulative volumetric curves were clearly distinct for the air induction nozzles, as well as the volumetric diameters.
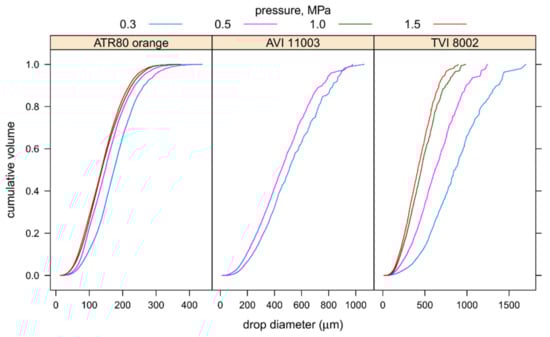
Figure 6.
Cumulative volumetric droplet size distribution as affected by nozzle type and working pressure (data of all repetitions).
3.3. Drop Size Distribution Modelling
Table 3 reports the shape and scale parameters together with the 95% confidence interval for their median values and the results of the Anderson–Darling goodness of fit test in function of spray pressure and for each nozzle type.
Table 3.
Shape and scale parameters of gamma distribution.
For each nozzle type, the shape parameter was almost constant in function of the spray pressure. The 95% confidence interval for the median ranged from 2.310 to 2.572 for the ATR 80 orange nozzle, from 1.134 to 1.570 for the TVI 8002, and from 1.352 to 1.447 for the AVI 11003. On the contrary, the scale parameter was clearly decreasing when the pressure increased: from 34.349 (0.3 MPa) to 22.077 (1.5 MPa) for the ATR 80 orange nozzle, from 166.388 (0.3 MPa) to 86.305 (1.5 MPa) for the TVI 8002, and from 104.895 (0.3 MPa) to 70.363 (0.5 MPa) for the AVI 11003. The decreasing trend of the scale parameter with the increase in the pressure is an index of the higher drop pulverization (more drops of a lower diameter, Figure 4 and Figure 5).
The comparison between the three nozzles in terms of probability density functions and cumulative distribution functions when varying the spray pressure is shown in Figure 7, Figure 8 and Figure 9. According to the results of the AD test (Table 3), the best fitting was obtained for the nozzle TVI 8002 at every pressure, for the ATR 80 up to 0.5 MPa, and for the AVI 11003 at 0.3 MPa. As a general result, the gamma distribution tends to underestimate the number of drops smaller than 100 µm.
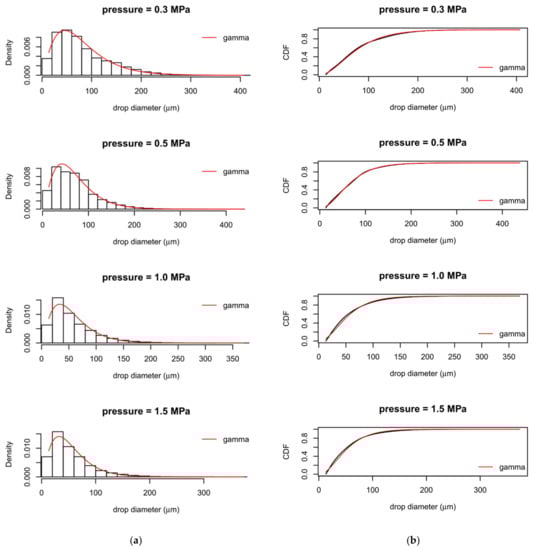
Figure 7.
Comparison between measured and theoretical distribution for the ATR 80 orange nozzle. (a) Histograms and theoretical densities; (b) Empirical and theoretical cumulative distribution functions.
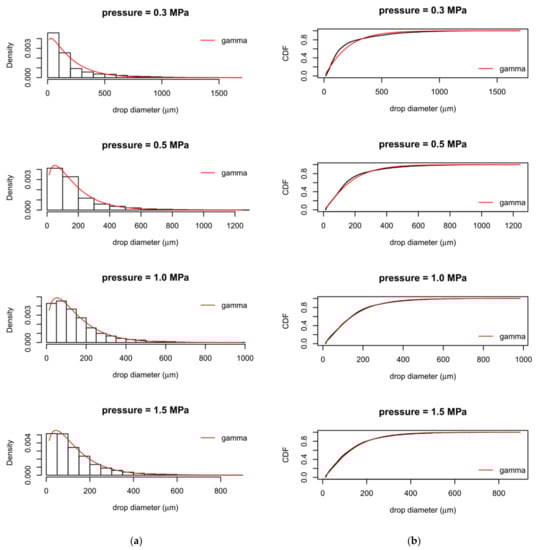
Figure 8.
Comparison between measured and theoretical distribution for the TVI 8002 nozzle. (a) Histograms and theoretical densities; (b) Empirical and theoretical cumulative distribution functions.
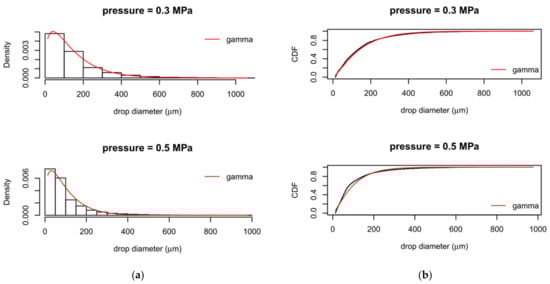
Figure 9.
Comparison between measured and theoretical distribution for the AVI 11003 nozzle. (a) Histograms and theoretical densities; (b) Empirical and theoretical cumulative distribution functions.
4. Discussion
4.1. Drop Diameters
Measuring drop diameters in a spray is a very complex task that has been addressed in different ways and exploiting different techniques and physical principles. Unfortunately, each measurement technique may produce different results. As an example, a study aimed at comparing four different methods for measuring droplet size distributions (image analysis, custom-made stroboscopic imaging, PDPA, and laser diffraction), reported that the larger the droplets, the bigger the differences are between the results [38]. Another study [35] focused on 17 bibliographic references about the results obtained by testing reference nozzles, pre-screened for laboratory purposes, reported a wide range of absolute measurements: when median values of increased from about 140 to about 395 µm, the interquartile range was on average 24% of the median values (from 20 to 33%). Despite this wide range of results, nozzle classification in terms of spray quality was identical in 73% of the cases, and this quite uniform classification confirms the usefulness of the reference nozzles.
The results obtained in this study by applying the liquid immersion method almost always agree with manufacturer information (Albuz catalog 2016) about spray quality based on VMD. In fact, ATR 80 orange nozzles are classified as Very Fine (VMD < 159 µm) at pressures greater or equal than 0.5 MPa (the measured VMD was 147 µm at 0.5 MPa and lower for higher pressures); TVI 8002 nozzles are classified as Ultra Coarse at 0.5–0.7 MPa (VMD > 553 µm, measured VMD = 624 µm at 0.5 MPa), Extremely Coarse at 1.0 MPa (484 µm < VMD < 553 µm, measured VMD = 457 µm) and Very Coarse at 1.5 MPa (386 µm < VMD < 484 µm, measured VMD = 415 µm); finally, AVI 11003 nozzles are classified as Extremely Coarse at 0.3 MPa (measured VMD = 506 µm) and Coarse at 0.5 MPa (326 µm < VMD < 386 µm, measured VMD = 449 µm). These results will be further investigated in future researches by also measuring the drop size distributions produced by the reference nozzles used to define the boundary regions, as recommended by the standard ISO 25358:2018 [39].
No other measurement techniques were used to compare the results. However, Nuyttens et al. (2007) [35], using a PDPA system, reported for the ATR 80 orange nozzle at 0.3 MPa diameter values on average 15% greater than the actual ones (VMD = 191 µm vs. 174 µm), whereas Grella et al. (2017) [17] reported, for the same nozzle at 1.0 MPa, a VMD value of 95 µm measured with a laser diffraction system compared with 138 µm obtained in this research. In both cases, despite the discrepancies in absolute results, the nozzle classification remained unchanged. In the same paper [17], a VMD of 606 µm was reported for the TVI 8002 nozzle at 1.0 MPa (vs. 457 µm obtained in this research), outside of the bounds of classification of the nozzle as Extremely Coarse. These results confirm the need to use the reference nozzles for classification purposes.
4.2. Drop Size Distribution
Modeling drop size distribution has been addressed via both empirical and analytical approaches. According to the first approach, suitable curves are fitted to measured data for a wide range of nozzles and operating conditions. This has led to the proposal of various theoretical distribution functions, such as Weibull, log-normal, Nukiyama–Tanasawa, gamma, able to fit experimental data more or less well and describe, as accurately as possible, the spray drop characteristics in terms of size and velocity [45,47,50].
The empirical approach was also adopted in this study: experimental data on drop diameters were analyzed and the theoretical gamma distribution was devised as the method that best described them. The scale and shape parameters were computed by means of the Maximum Likelihood Estimation method for each operating condition (nozzle type and spraying pressure). According to Villermaux et al. [51], the atomization process involves the fragmentation of ligaments into droplets, and the size distribution that reasonably fits the data is precisely the gamma probability distribution function.
The major drawback of this approach is the difficulty or the impossibility of covering conditions different from those observed. The analytical approach tries to predict the drop size distribution from an atomizer based on statistical/stochastic models such as the maximum entropy method [52,53] or general laws of conservation (mass, energy, momentum) [54,55]. In [54,55] the authors propose a closed-form equation capable of predicting the diameter in function of liquid properties and droplet velocities, especially useful for the study of injectors used in combustion processes. Other formulae for estimating the diameter in combustion studies are discussed in [56], including both empirical and physical principles.
Theoretical atomization models for agricultural spray nozzles used for pesticide applications are rare in the literature. Many studies are aimed at the measurement of drop diameters, at the tracing of the cumulative volumetric curves (Figure 6), and at the calculation of VMD, used for nozzle classification in terms of spray quality. In [57] the authors analyzed the influence of the spray parameters (spray angle, pressure, equivalent orifice diameter of nozzles) on drop size and velocity in the flow field. Suitable models were devised and successfully validated. Another work [58], using dimensional analysis, proposed a model to predict the volume median diameter of flat fan sprays in terms of common end-user parameters, namely nozzle size and operating pressure. However, in all cases, the models contain constants that must be estimated from experimental data.
5. Conclusions and Future Developments
The experimental activity allowed assessing the effect of spray pressure on drop pulverization in three Albuz nozzle types (ATR 80 orange, AVI 11003, TVI 8002). The research, aimed at describing the experimental data and not the theoretical atomization process, as is common practice in the studies of nozzles for pesticide applications, produced results, especially in terms of volume median diameter, consistent with the expectations, with the nozzle manufacturer information, and with similar data found in the literature. Drop pulverization was higher for the turbulence nozzle than for the two air induction nozzles at every pressure, and an increase in the spraying pressure caused an increase in the drop pulverization, regardless of the type of nozzle. Thus, even if further experiments are necessary, the results validated the functionality of the proposed measurement system.
As regards the drop size distribution, the number probability distribution function that best described the experimental data was the gamma, whose scale and shape parameters were adjusted in the function of nozzle type and spray pressure. The shape parameter was almost constant for each nozzle, while the scale parameter showed a clear decreasing trend with the increase in pressure, an index of higher drop pulverization. This aspect will be further investigated in future research considering other nozzle types, including the reference nozzles, and other pressures, in such a way as to extend the present results to a model able to reasonably estimate the drop size distribution and the most significant diameters in function of the operating conditions.
Author Contributions
Conceptualization, E.C. and G.M.; methodology, E.C., G.M., D.L. and R.P.; software, E.C. and D.L.; formal analysis, E.C., G.M., D.L. and R.P.; investigation, E.C., G.M., D.L. and R.P.; resources, E.C., G.M. and D.L.; data curation, E.C., G.M., D.L. and R.P.; writing—original draft preparation, E.C.; writing—review and editing, E.C., G.M., D.L. and R.P; visualization, E.C., G.M., D.L. and R.P.; supervision, E.C. and G.M.; project administration, G.M.; funding acquisition, E.C. and G.M. All authors have read and agreed to the published version of the manuscript.
Funding
This research was funded by the University of Catania with the research project “Contributo della meccanica agraria e delle costruzioni rurali per il miglioramento della sostenibilità delle produzioni agricole, zoo-tecniche e agro-industriali. WP1: Impiego sostenibile di macchine irroratrici in serra e in pieno campo”, Linea di intervento 2-dotazione ordinaria per attività istituzionali dei dipartimenti-2016–18-II annualità.
Institutional Review Board Statement
Not applicable.
Informed Consent Statement
Not applicable.
Data Availability Statement
Data available on request.
Conflicts of Interest
The authors declare no conflict of interest.
Abbreviations
| Symbols | |
| particle area (pixel) | |
| particle diameter (pixel) | |
| particle diameter (µm) | |
| calibration factor (µm/pixel) | |
| arithmetic mean diameter (µm) | |
| surface mean diameter (µm) | |
| volume mean diameter (µm) | |
| Sauter mean diameter (µm) | |
| droplet volume (μm3) | |
| cumulative volume corresponding to the diameter (%) | |
| the diameter such that | |
| the diameter such that | |
| the diameter such that | |
| probability distribution function of the drop number | |
| gamma function | |
| shape parameter | |
| scale parameter | |
| Acronyms | |
| AD | Anderson–Darling test |
| CDF | Cumulative Distribution Function |
| CSV | Comma Separated Value |
| DSLR | Digital Single-Lens Reflex |
| HSI | High Speed Imaging |
| LD | Laser Diffraction |
| MLE | Maximum Likelihood Estimation method |
| Probability Density Function | |
| PDPA | Phase Doppler Particle Analyzer |
| PPP | Plant Protection Product |
| RSF | Relative Span Factor |
| SMD | Sauter Mean Diameter |
| VMD | Volumetric Median Diameter |
| WSP | Water Sensitive Paper |
References
- Matthews, G.A. How was the pesticide applied? Crop Prot. 2004, 23, 651–653. [Google Scholar] [CrossRef]
- De Cock, N.; Massinon, M.; Salah, S.O.T.; Lebeau, F. Investigation on optimal spray properties for ground based agricultural applications using deposition and retention models. Biosyst. Eng. 2017, 162, 99–111. [Google Scholar] [CrossRef]
- Chen, S.; Lan, Y.; Zhou, Z.; Ouyang, F.; Wang, G.; Huang, X.; Deng, X.; Cheng, S. Effect of droplet size parameters on droplet deposition and drift of aerial spraying by using plant protection UAV. Agronomy 2020, 10, 195. [Google Scholar] [CrossRef]
- Nuyttens, D.; Braekman, P.; Windey, S.; Sonck, B. Potential dermal pesticide exposure affected by greenhouse spray application technique. Pest Manag. Sci. 2009, 65, 781–790. [Google Scholar] [CrossRef]
- Cao, L.; Zhang, H.; Li, F.; Zhou, Z.; Wang, W.; Ma, D.; Yang, L.; Zhou, P.; Huang, Q. Potential dermal and inhalation exposure to imidacloprid and risk assessment among applicators during treatment in cotton field in China. Sci. Total Environ. 2018, 624, 1195–1201. [Google Scholar] [CrossRef]
- Cerruto, E.; Manetto, G.; Santoro, F.; Pascuzzi, S. Operator dermal exposure to pesticides in tomato and strawberry greenhouses from hand-held sprayers. Sustainability 2018, 10, 2273. [Google Scholar] [CrossRef]
- Ferguson, J.C.; Chechetto, R.G.; Hewitt, A.J.; Chauhan, B.S.; Adkins, S.W.; Kruger, G.R.; O’Donnell, C.C. Assessing the deposition and canopy penetration of nozzles with different spray qualities in an oat (Avena sativa L.) canopy. Crop Prot. 2016, 81, 14–19. [Google Scholar] [CrossRef]
- Zwertvaegher, I.K.; Verhaeghe, M.; Brusselman, E.; Verboven, P.; Lebeau, F.; Massinon, M.; Nicolaı, B.M.; Nuyttens, D. The impact and retention of spray droplets on a horizontal hydrophobic surface. Biosyst. Eng. 2014, 126, 82–91. [Google Scholar] [CrossRef]
- Al Heidary, M.; Douzals, J.P.; Sinfort, C.; Vallet, A. Influence of spray characteristics on potential spray drift of field crop sprayers: A literature review. Crop Prot. 2014, 63, 120–130. [Google Scholar] [CrossRef]
- Torrent, X.; Garcerá, C.; Moltó, E.; Chueca, P.; Abad, R.; Grafulla, C.; Planas, S. Comparison between standard and drift reducing nozzles for pesticide application in citrus: Part, I. Effects on wind tunnel and field spray drift. Crop Prot. 2017, 96, 130–143. [Google Scholar] [CrossRef]
- Garcerá, C.; Román, C.; Moltó, E.; Abad, R.; Insa, J.A.; Torrent, X.; Chueca, P. Comparison between standard and drift reducing nozzles for pesticide application in citrus: Part II. Effects on canopy spray distribution, control efficacy of Aonidiella aurantii (Maskell), beneficial parasitoids and pesticide residues on fruit. Crop Prot. 2017, 94, 83–96. [Google Scholar] [CrossRef]
- Fornasiero, D.; Mori, N.; Tirello, P.; Pozzebon, A.; Duso, C.; Tescari, E.; Bradascio, R.; Otto, S. Effect of spray drift reduction techniques on pests and predatory mites in orchards and vineyards. Crop Prot. 2017, 98, 283–292. [Google Scholar] [CrossRef]
- Pergher, G. Field evaluation of a calibration method for air-assisted sprayers involving the use of a vertical patternator. Crop Prot. 2004, 23, 437–446. [Google Scholar] [CrossRef]
- Pascuzzi, S.; Cerruto, E.; Manetto, G. Foliar spray deposition in a “tendone” vineyard as affected by airflow rate, volume rate and vegetative development. Crop Prot. 2017, 91, 34–48. [Google Scholar] [CrossRef]
- Pascuzzi, S.; Santoro, F.; Manetto, G.; Cerruto, E. Study of the correlation between foliar and patternator deposits in a “tendone” vineyard. Agric. Eng. Int. CIGR J. 2018, 20, 97–107. [Google Scholar]
- Jiao, L.; Dong, D.; Feng, H.; Zhao, X.; Chen, L. Monitoring spray drift in aerial spray application based on infrared thermal imaging technology. Comput. Electron. Agric. 2016, 121, 135–140. [Google Scholar] [CrossRef]
- Grella, M.; Gallart, M.; Marucco, P.; Balsari, P.; Gil, E. Ground deposition and airborne spray drift assessment in vineyard and orchard: The influence of environmental variables and sprayer settings. Sustainability 2017, 9, 728. [Google Scholar] [CrossRef]
- Balsari, P.; Gil, E.; Marucco, P.; van de Zande, J.C.; Nuyttens, D.; Herbst, A.; Gallart, M. Field-crop-sprayer potential drift measured using test bench: Effects of boom height and nozzle type. Biosyst. Eng. 2017, 154, 3–13. [Google Scholar] [CrossRef]
- Grella, M.; Marucco, P.; Balsari, P. Toward a new method to classify the airblast sprayers according to their potential drift reduction: Comparison of direct and new indirect measurement methods. Pest Manag. Sci. 2019, 75, 2219–2235. [Google Scholar] [CrossRef]
- Syngenta. Water-Sensitive Paper for Monitoring Spray Distribution. Technical Data Sheet. Available online: https://www.agroconsultasonline.com.ar//ticket.html/Water%20Sensitive%20Paper%20Syngenta%20Agro.pdf?op=d&ticket_id=2388&evento_id=4891 (accessed on 8 April 2021).
- Sánchez-Hermosilla, J.; Medina, R. Adaptive threshold for droplet spot analysis using water-sensitive paper. Appl. Eng. Agric. 2011, 20, 547–551. [Google Scholar] [CrossRef]
- Cunha, M.; Carvalho, C.; Marcal, A.R.S. Assessing the ability of image processing software to analyse spray quality on water-sensitive papers used as artificial targets. Biosyst. Eng. 2012, 111, 11–23. [Google Scholar] [CrossRef]
- Salyani, M.; Zhu, H.; Sweeb, R.D.; Pai, N. Assessment of spray distribution with water-sensitive paper. Agric. Eng. Int. CIGR J. 2013, 15, 101–111. [Google Scholar]
- Cerruto, E.; Manetto, G.; Longo, D.; Failla, S.; Papa, R. A model to estimate the spray deposit by simulated water sensitive papers. Crop Prot. 2019, 124, 104861. [Google Scholar] [CrossRef]
- Cerruto, E.; Aglieco, C.; Failla, S.; Manetto, G. Parameters influencing deposit estimation when using water sensitive papers. J. Agric. Eng. 2013, 44, 62–70. [Google Scholar] [CrossRef]
- Kathiravelu, G.; Lucke, T.; Nichols, P. Rain drop measurement techniques: A review. Water 2016, 8, 29. [Google Scholar] [CrossRef]
- Fujimatsu, T.; Kito, M.; Kondo, K. Droplet Size Measurement of Liquid Atomization by the Immersion Liquid Method (Droplet Coalescence and Solution into the Immersion Liquid); WIT Transactions on Engineering Sciences; WIT Press: Southampton, UK, 2014; Volume 82. [Google Scholar]
- Lad, N.; Aroussi, E.A.; Muhamad Said, M.F. Droplet size measurement for liquid spray using digital image analysis technique. J. Appl. Sci. 2011, 11, 1966–1972. [Google Scholar] [CrossRef][Green Version]
- Massinon, M.; Lebeau, F. Experimental method for the assessment of agricultural spray retention based on high-speed imaging of drop impact on a synthetic superhydrophobic surface. Biosyst. Eng. 2012, 112, 56–64. [Google Scholar] [CrossRef]
- De Cock, N.; Massinon, M.; Nuyttens, D.; Dekeyser, D.; Lebeau, F. Measurements of reference ISO nozzles by high-speed imaging. Crop Prot. 2016, 89, 105–115. [Google Scholar] [CrossRef]
- Fritz, B.K.; Hoffmann, W.C. Measuring spray droplet size from agricultural nozzles using laser diffraction. J. Vis. Exp. 2016, 115, e54533. [Google Scholar] [CrossRef]
- Liao, J.; Luo, X.; Wang, P.; Zhou, Z.; O’Donnell, C.C.; Zang, Y.; Hewitt, A.J. Analysis of the influence of different parameters on droplet characteristics and droplet size classification categories for air induction nozzle. Agronomy 2020, 10, 256. [Google Scholar] [CrossRef]
- ISO (International Organization of Standardization). ISO 13320:2020 Particle Size Analysis—Laser Diffraction Methods; ISO: Geneva, Switzerland, 2020; Available online: https://www.iso.org/obp/ui/#iso:std:iso:13320:en (accessed on 15 June 2021).
- Nuyttens, D.; Baetens, K.; De Schampheleire, M.; Sonck, B. PDPA Laser Based Characterisation of Agricultural Sprays. Agric. Eng. Int. CIGR J. 2006, 8. [Google Scholar]
- Nuyttens, D.; Baetens, K.; De Schampheleire, M.; Sonck, B. Effect of nozzle type, size and pressure on spray droplet characteristics. Biosyst. Eng. 2007, 97, 333–345. [Google Scholar] [CrossRef]
- Lodwik, D.; Pietrzyk, J.; Malesa, W. Analysis of volume distribution and evaluation of the spraying spectrum in terms of spraying quality. Appl. Sci. 2020, 10, 2395. [Google Scholar] [CrossRef]
- Schick, R.J. Spray Technology Reference Guide: Understanding drop size. In Spraying Systems Bulletin no. 459C; Spraying Systems Co.: Wheaton, IL, USA, 2008; Available online: https://www.spray.com/literature_pdfs/B459C_Understanding_Drop_Size.pdf (accessed on 4 August 2021).
- Sijs, R.; Kooij, S.; Holterman, H.J.; van de Zande, J.; Bonn, D. Drop size measurement techniques for sprays: Comparison of image analysis, phase Doppler particle analysis, and laser diffraction. AIP Adv. 2021, 11, 015315. [Google Scholar] [CrossRef]
- ISO (International Organization for Standardization). ISO 25358:2018, Crop Protection Equipment—Droplet-Size Spectra from Atomizers—Measurement and Classification; ISO: Geneva, Switzerland, 2018; Available online: https://www.iso.org/standard/66412.html (accessed on 4 August 2021).
- ISO (International Organization for Standardization). ISO 5682-1, Equipment for Crop Protection—Spraying Equipment—Part 1: Test Methods for Sprayer Nozzle; ISO: Geneva, Switzerland, 2017; Available online: https://www.iso.org/standard/60053.html (accessed on 9 July 2021).
- Longo, D.; Manetto, G.; Papa, R.; Cerruto, E. Design and construction of a low-cost test bench for testing agricultural spray nozzles. Appl. Sci. 2020, 10, 5221. [Google Scholar] [CrossRef]
- Cerruto, E.; Manetto, G.; Longo, D.; Failla, S.; Schillaci, G. A laboratory system for nozzle spray analysis. Chem. Eng. Trans. 2017, 58, 751–756. [Google Scholar] [CrossRef]
- Abramoff, M.D.; Magelhaes, P.J.; Ram, S.J. Image processing with Image. J. Biophot. Int. 2004, 11, 36–42. [Google Scholar]
- R Core Team. R: A Language and Environment for Statistical Computing; R Foundation for Statistical Computing: Vienna, Austria, 2019; Available online: https://www.R-project.org (accessed on 1 July 2021).
- Babinsky, E.; Sojka, P.E. Modelling drop size distribution. Prog. Energy Combust. Sci. 2002, 28, 303–329. [Google Scholar] [CrossRef]
- Cerruto, E.; Failla, S.; Longo, D.; Manetto, G. Simulation of water sensitive papers for spray analysis. Agric. Eng. Int. CIGR J. 2016, 18, 22–29. [Google Scholar]
- Panão, M.O.; Moita, A.S.; Moreira, A.L. On the statistical characterization of sprays. Appl. Sci. 2020, 10, 6122. [Google Scholar] [CrossRef]
- Delignette-Muller, M.L.; Dutang, C. Fitdistrplus: An R package for fitting distributions. J. Stat. Softw. 2015, 64, 1–34. [Google Scholar] [CrossRef]
- ISO (International Organization for Standardization). ISO 10625, Equipment for Crop Protection—Sprayer Nozzles—Colour Coding for Identification; ISO: Geneva, Switzerland, 2018; Available online: https://www.iso.org/standard/70624.html (accessed on 1 July 2021).
- Lefebvre, A.H.; McDonell, V.G. Drop size distributions of sprays. In Atomization and Sprays, 2nd ed.; CRC Press: Boca Raton, FL, USA, 2017; pp. 55–70. [Google Scholar]
- Villermaux, E.; Marmottant, P.; Duplat, J. Ligament-mediated spray formation. Phys. Rev. Lett. 2004, 92, 074501. [Google Scholar] [CrossRef] [PubMed]
- Sellens, R.W.; Brzustowski, T.A. A prediction of the drop size distribution in a spray from first principles. At. Spray Technol. 1985, 1, 89–102. [Google Scholar]
- Li, X.; Tankin, R.S. Droplet size distribution: A derivation of a Nukiyama-Tanasawa type distribution function. Combust. Sci. Technol. 1987, 56, 65–76. [Google Scholar]
- Lee, T.-W.; An, K. Quadratic formula for determining the drop size in pressure-atomized sprays with and without swirl. Phys. Fluids 2016, 28, 063302. [Google Scholar] [CrossRef]
- Lee, T.-W.; Park, J.E. Determination of the drop size during air-blast atomization. J. Fluids Eng. 2019, 141, 1–6. [Google Scholar] [CrossRef]
- Urbán, A.; Zaremba, M.; Malý, M.; Józsa, V.; Jedelský, J. Droplet dynamics and size characterization of high-velocity airblast atomization. Int. J. Multiph. Flow 2017, 95, 1–11. [Google Scholar] [CrossRef]
- Li, S.; Chen, C.; Wang, Y.; Kang, F.; Li, W. Study on the atomization characteristics of flat fan nozzles for pesticide application at low pressures. Agriculture 2021, 11, 309. [Google Scholar] [CrossRef]
- Post, S.L.; Hewitt, A.J. Flat fan spray atomization model. Trans. ASABE 2018, 61, 1249–1256. [Google Scholar] [CrossRef]
Publisher’s Note: MDPI stays neutral with regard to jurisdictional claims in published maps and institutional affiliations. |
© 2021 by the authors. Licensee MDPI, Basel, Switzerland. This article is an open access article distributed under the terms and conditions of the Creative Commons Attribution (CC BY) license (https://creativecommons.org/licenses/by/4.0/).