
Leaders’ Perspectives on IoT Security Risk Management Strategies in Surveyed Organizations Relative to IoTSRM2


Abstract
:1. Introduction
- RQ1: What is the overall tendency of the IoT security risk management strategies of the surveyed organizations to meet or deviate from the IoTSRM2 controls?
- RQ2: What is the IoTSRM2 compliance score of each of the surveyed organizations?
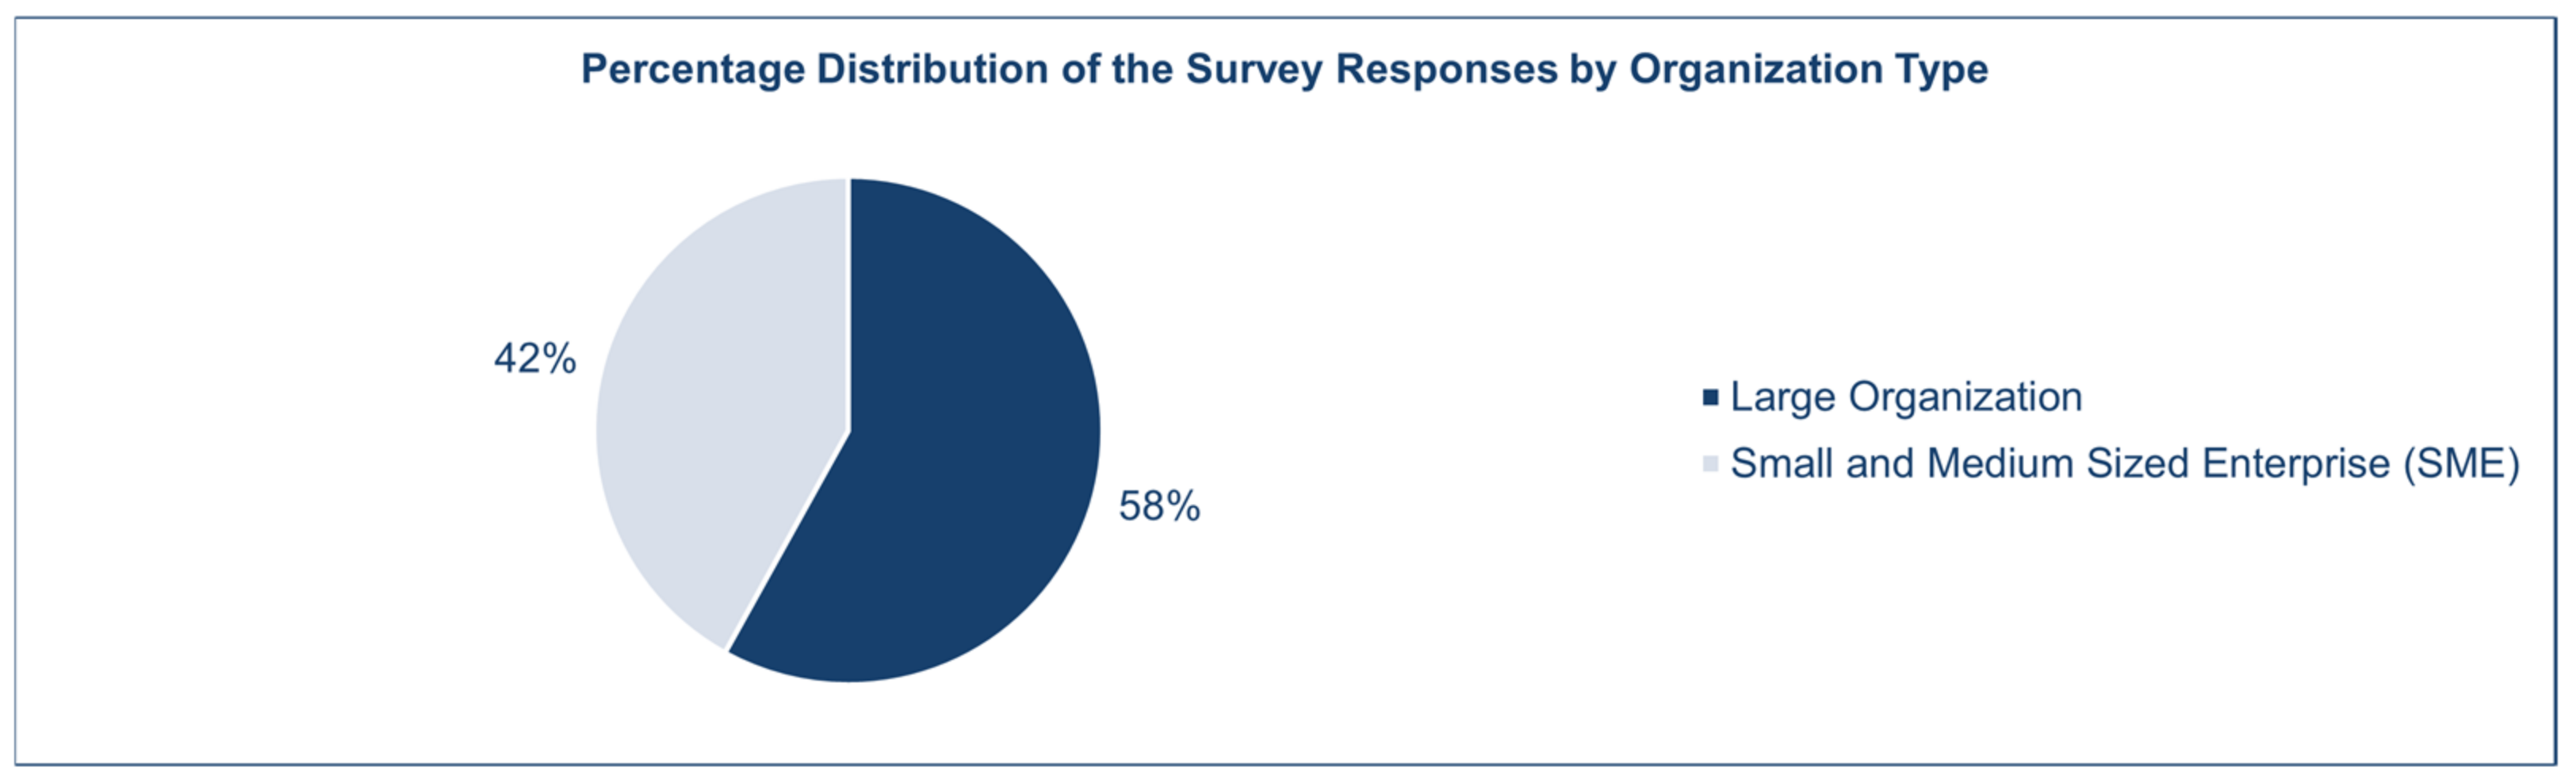
- RQ3: Which is the top organization type for the surveyed organizations by survey respondents?
- RQ4.a: Which is the top industry sector for the surveyed organizations by survey respondents?
- RQ4.b: Which is the top industry sector for the surveyed organizations of the top organization type by survey respondents?
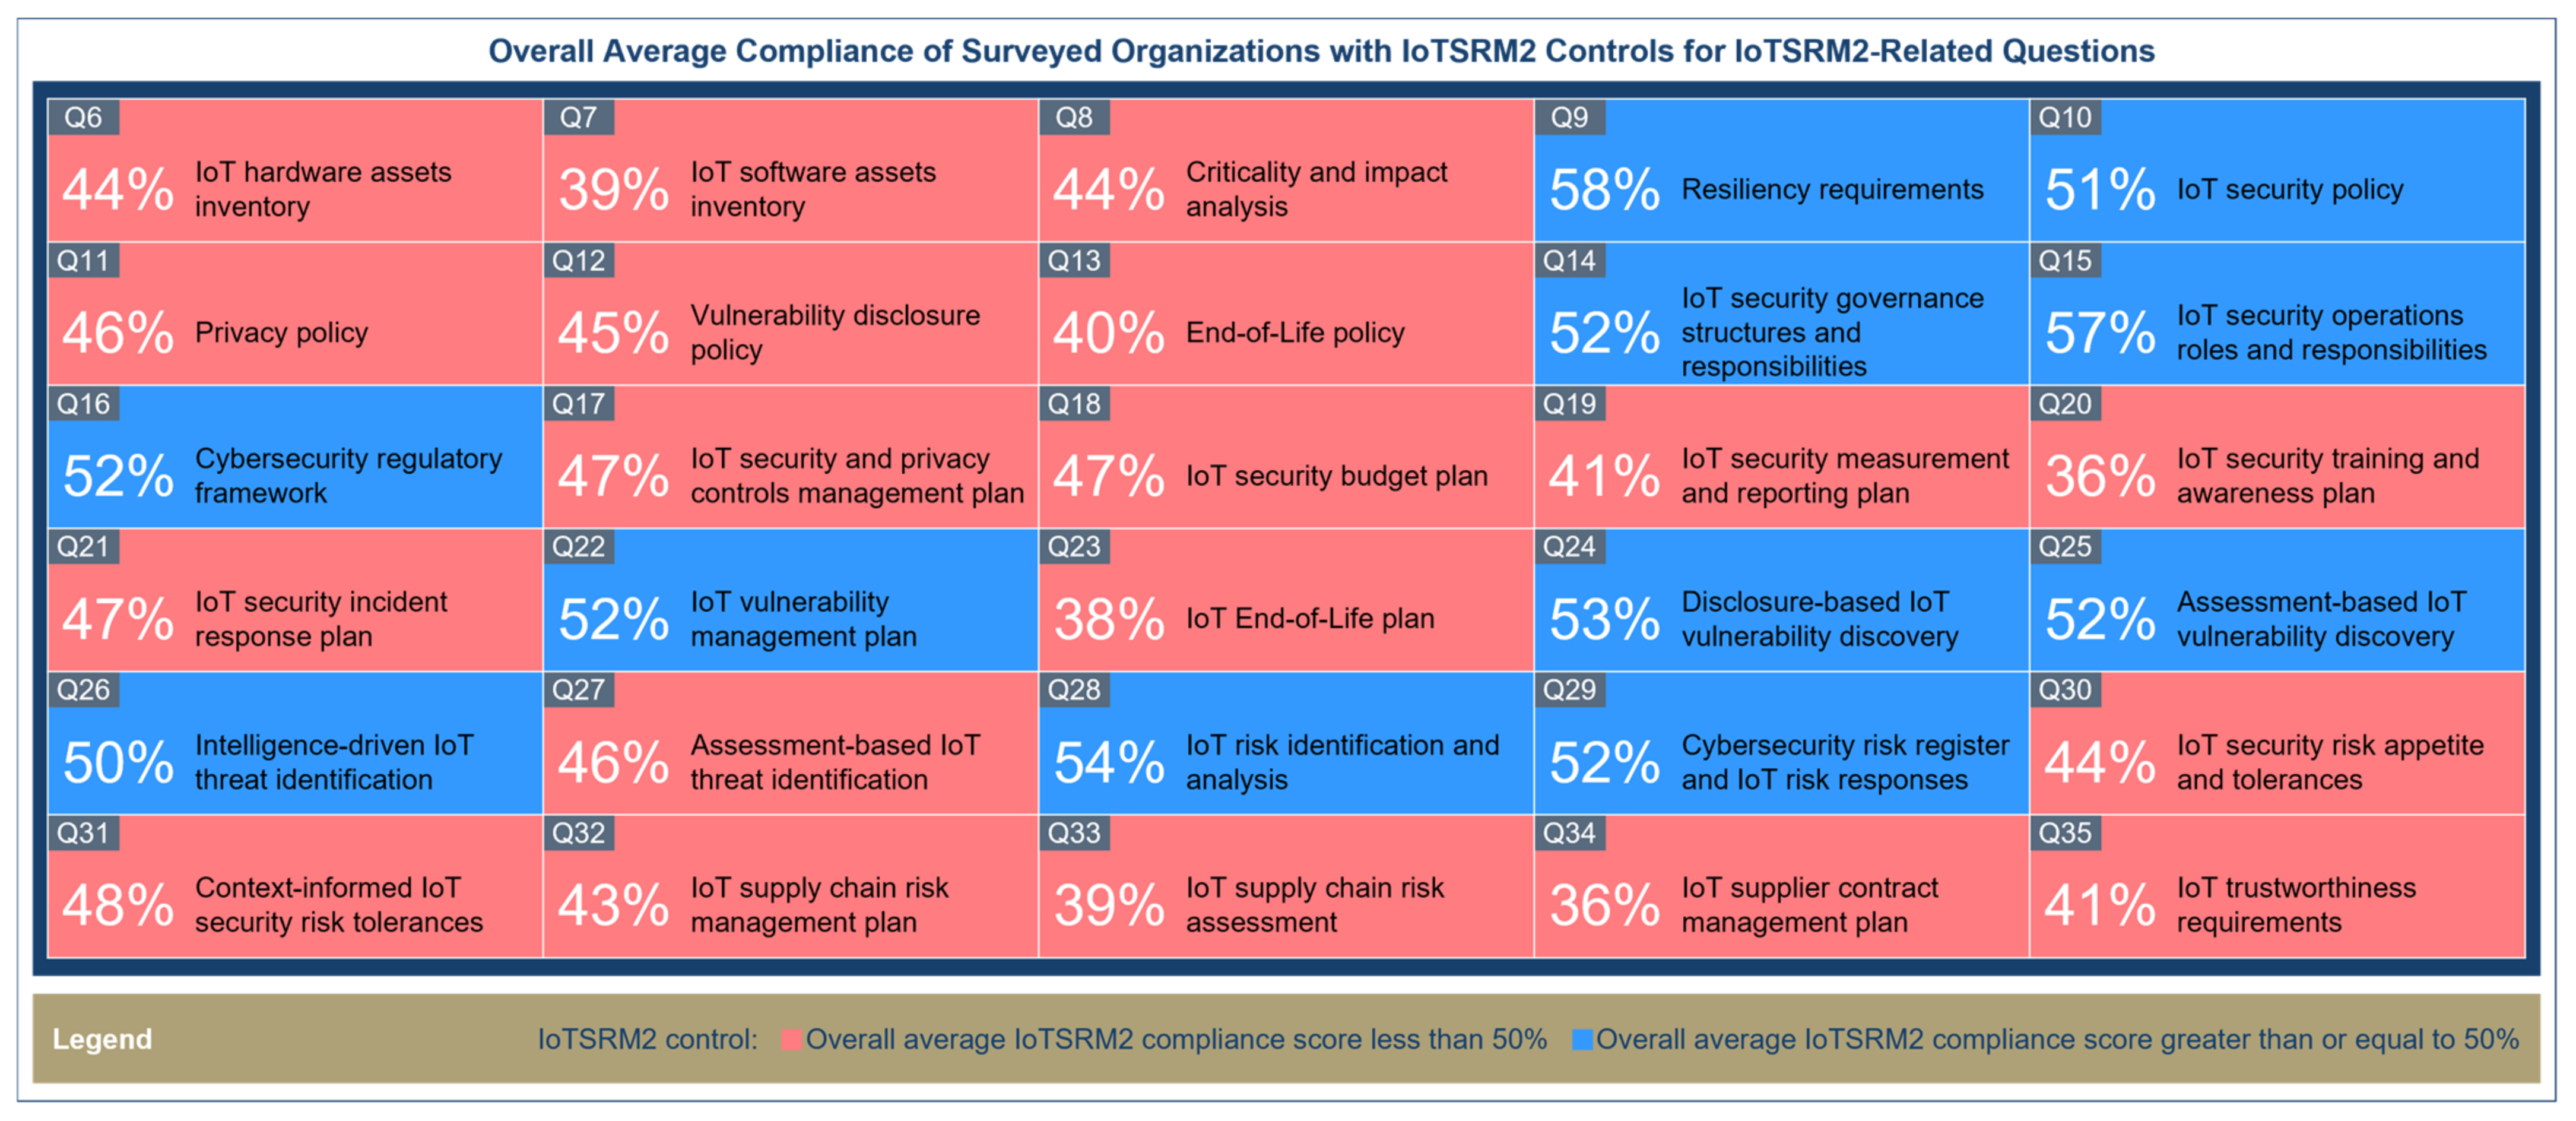
- RQ5.a: What is the overall average IoTSRM2 compliance score of the surveyed organizations for each IoTSRM2 control?
- RQ5.b: What is the overall average IoTSRM2 compliance score of the surveyed organizations of the top organization type for each IoTSRM2 control?
- RQ5.c: What is the overall average IoTSRM2 compliance score of the surveyed organizations from the top industry sector of the top organization type for each IoTSRM2 control?
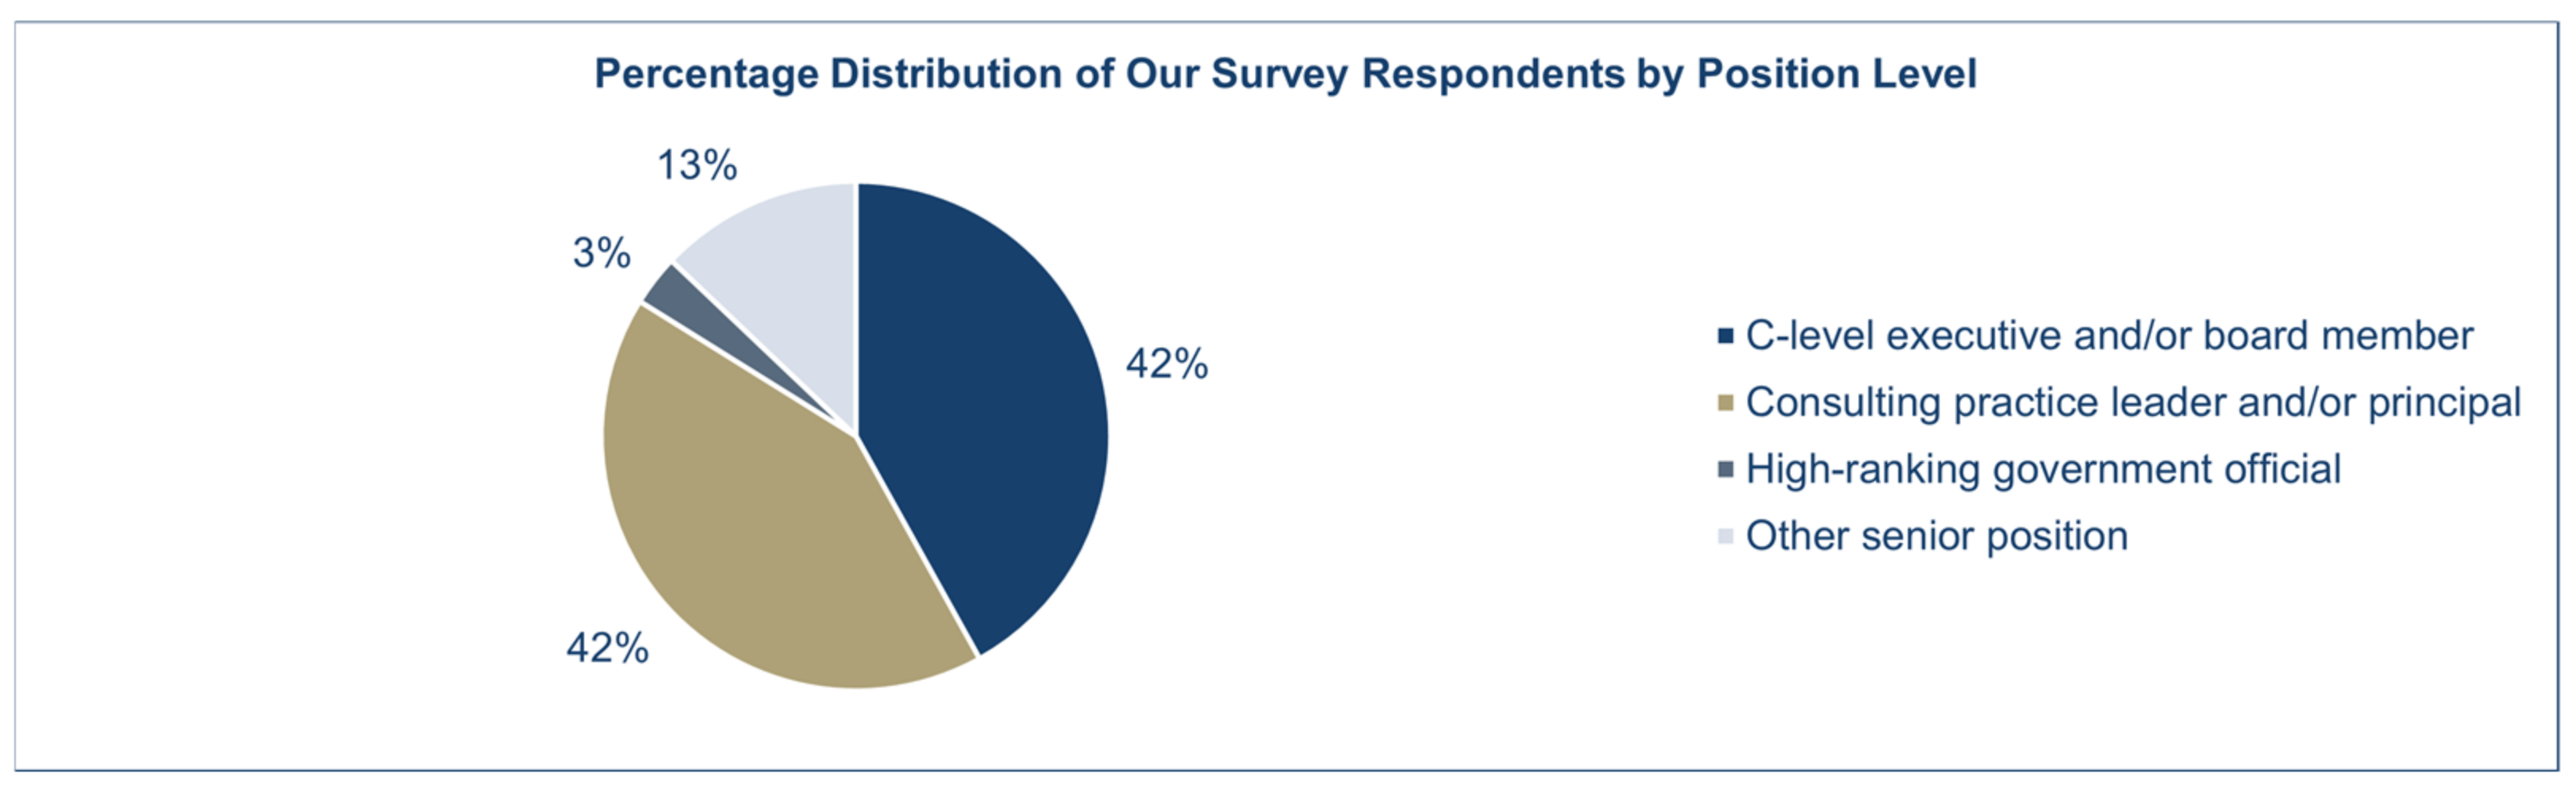
- RQ6.a: Which is the top position level of the survey respondents for the surveyed organizations by survey respondents?
- RQ6.b: Which is the top position level of the survey respondents for the surveyed organizations of the top organization type by survey respondents?
- RQ6.c: Which is the top position level of the survey respondents for the surveyed organizations from the top industry sector of the top organization type by survey respondents?
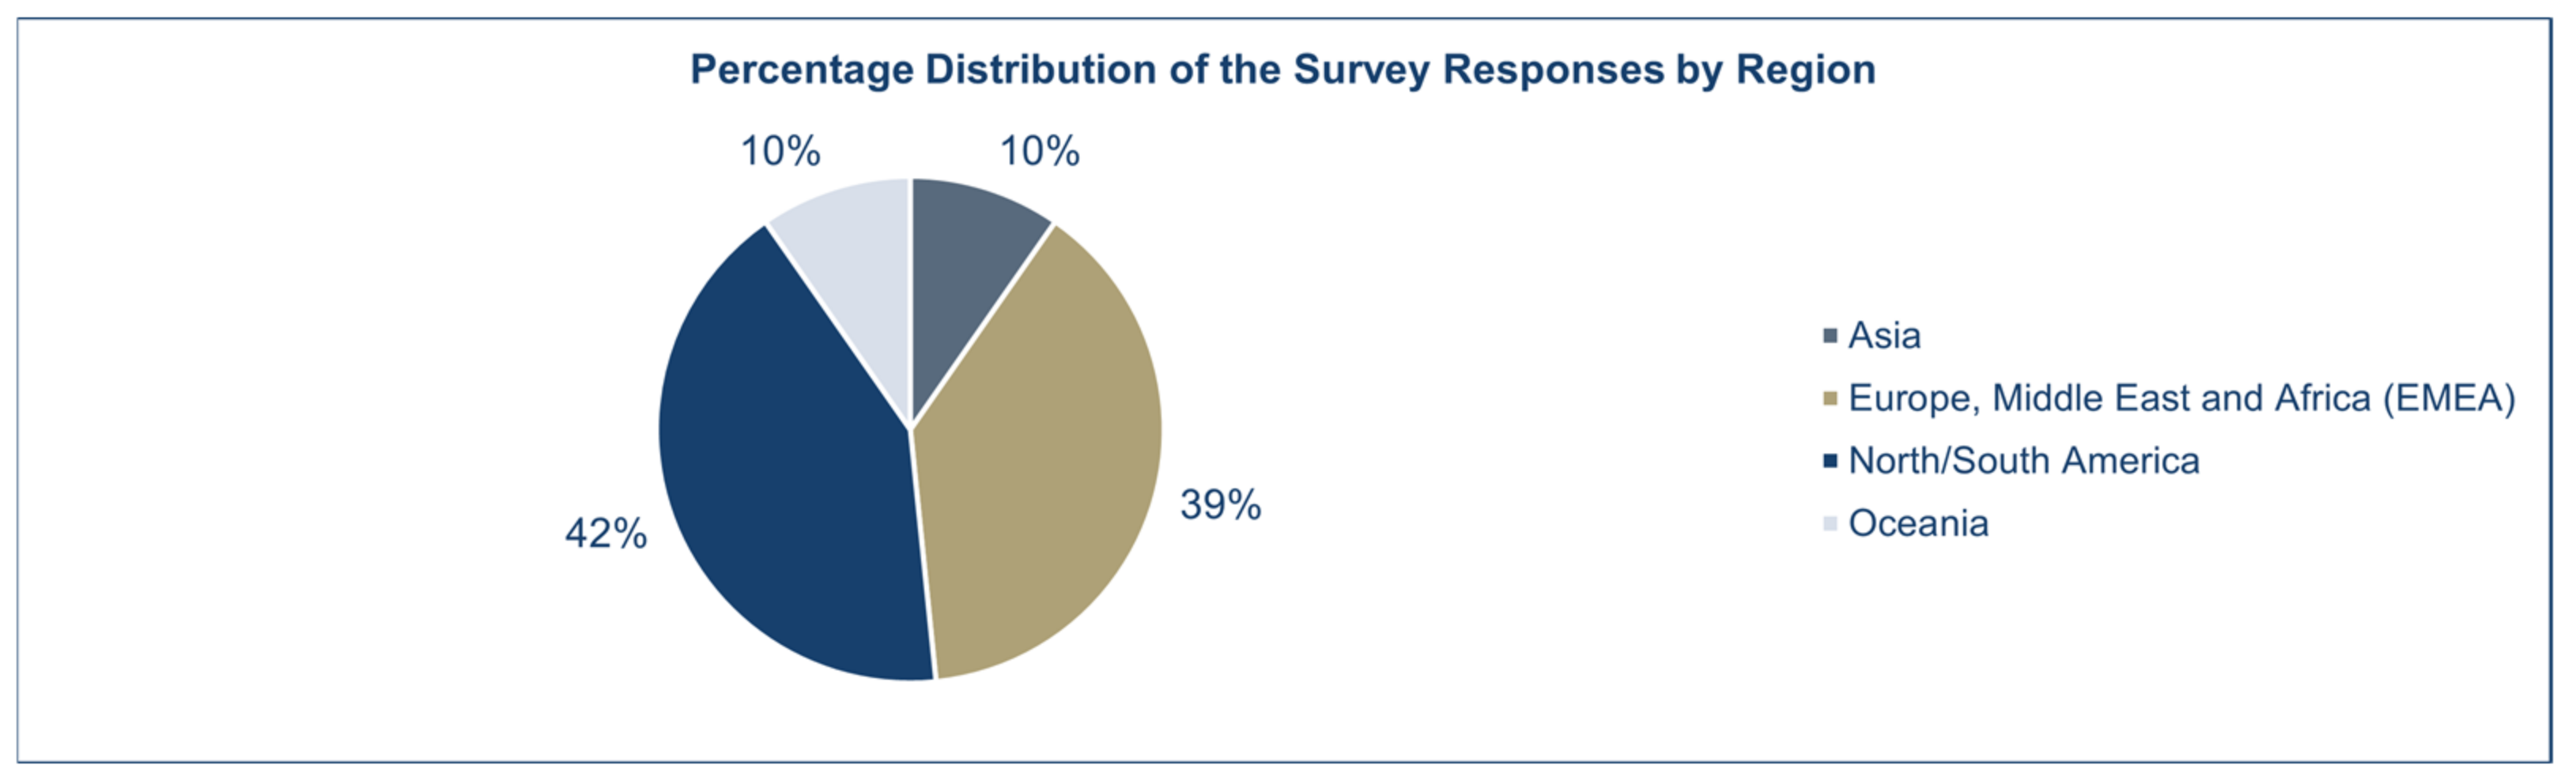
- RQ7.a: Which is the top region for the surveyed organizations by survey respondents?
- RQ7.b: Which is the top region for the surveyed organizations of the top organization type by survey respondents?
- RQ7.c: Which is the top region for the surveyed organizations from the top industry sector of the top organization type by survey respondents?
- The design of a methodology for determining the current state of IoT security risk management strategies in the surveyed organizations relative to the IoTSRM2;
- The determination of the current state of IoT security risk management strategies in the surveyed organizations relative to the IoTSRM2 by analyzing the survey responses and reporting our IoTSRM2-based survey results;
- A comparative analysis of the related work for this IoTSRM2-based survey study based on a set of evaluation criteria.
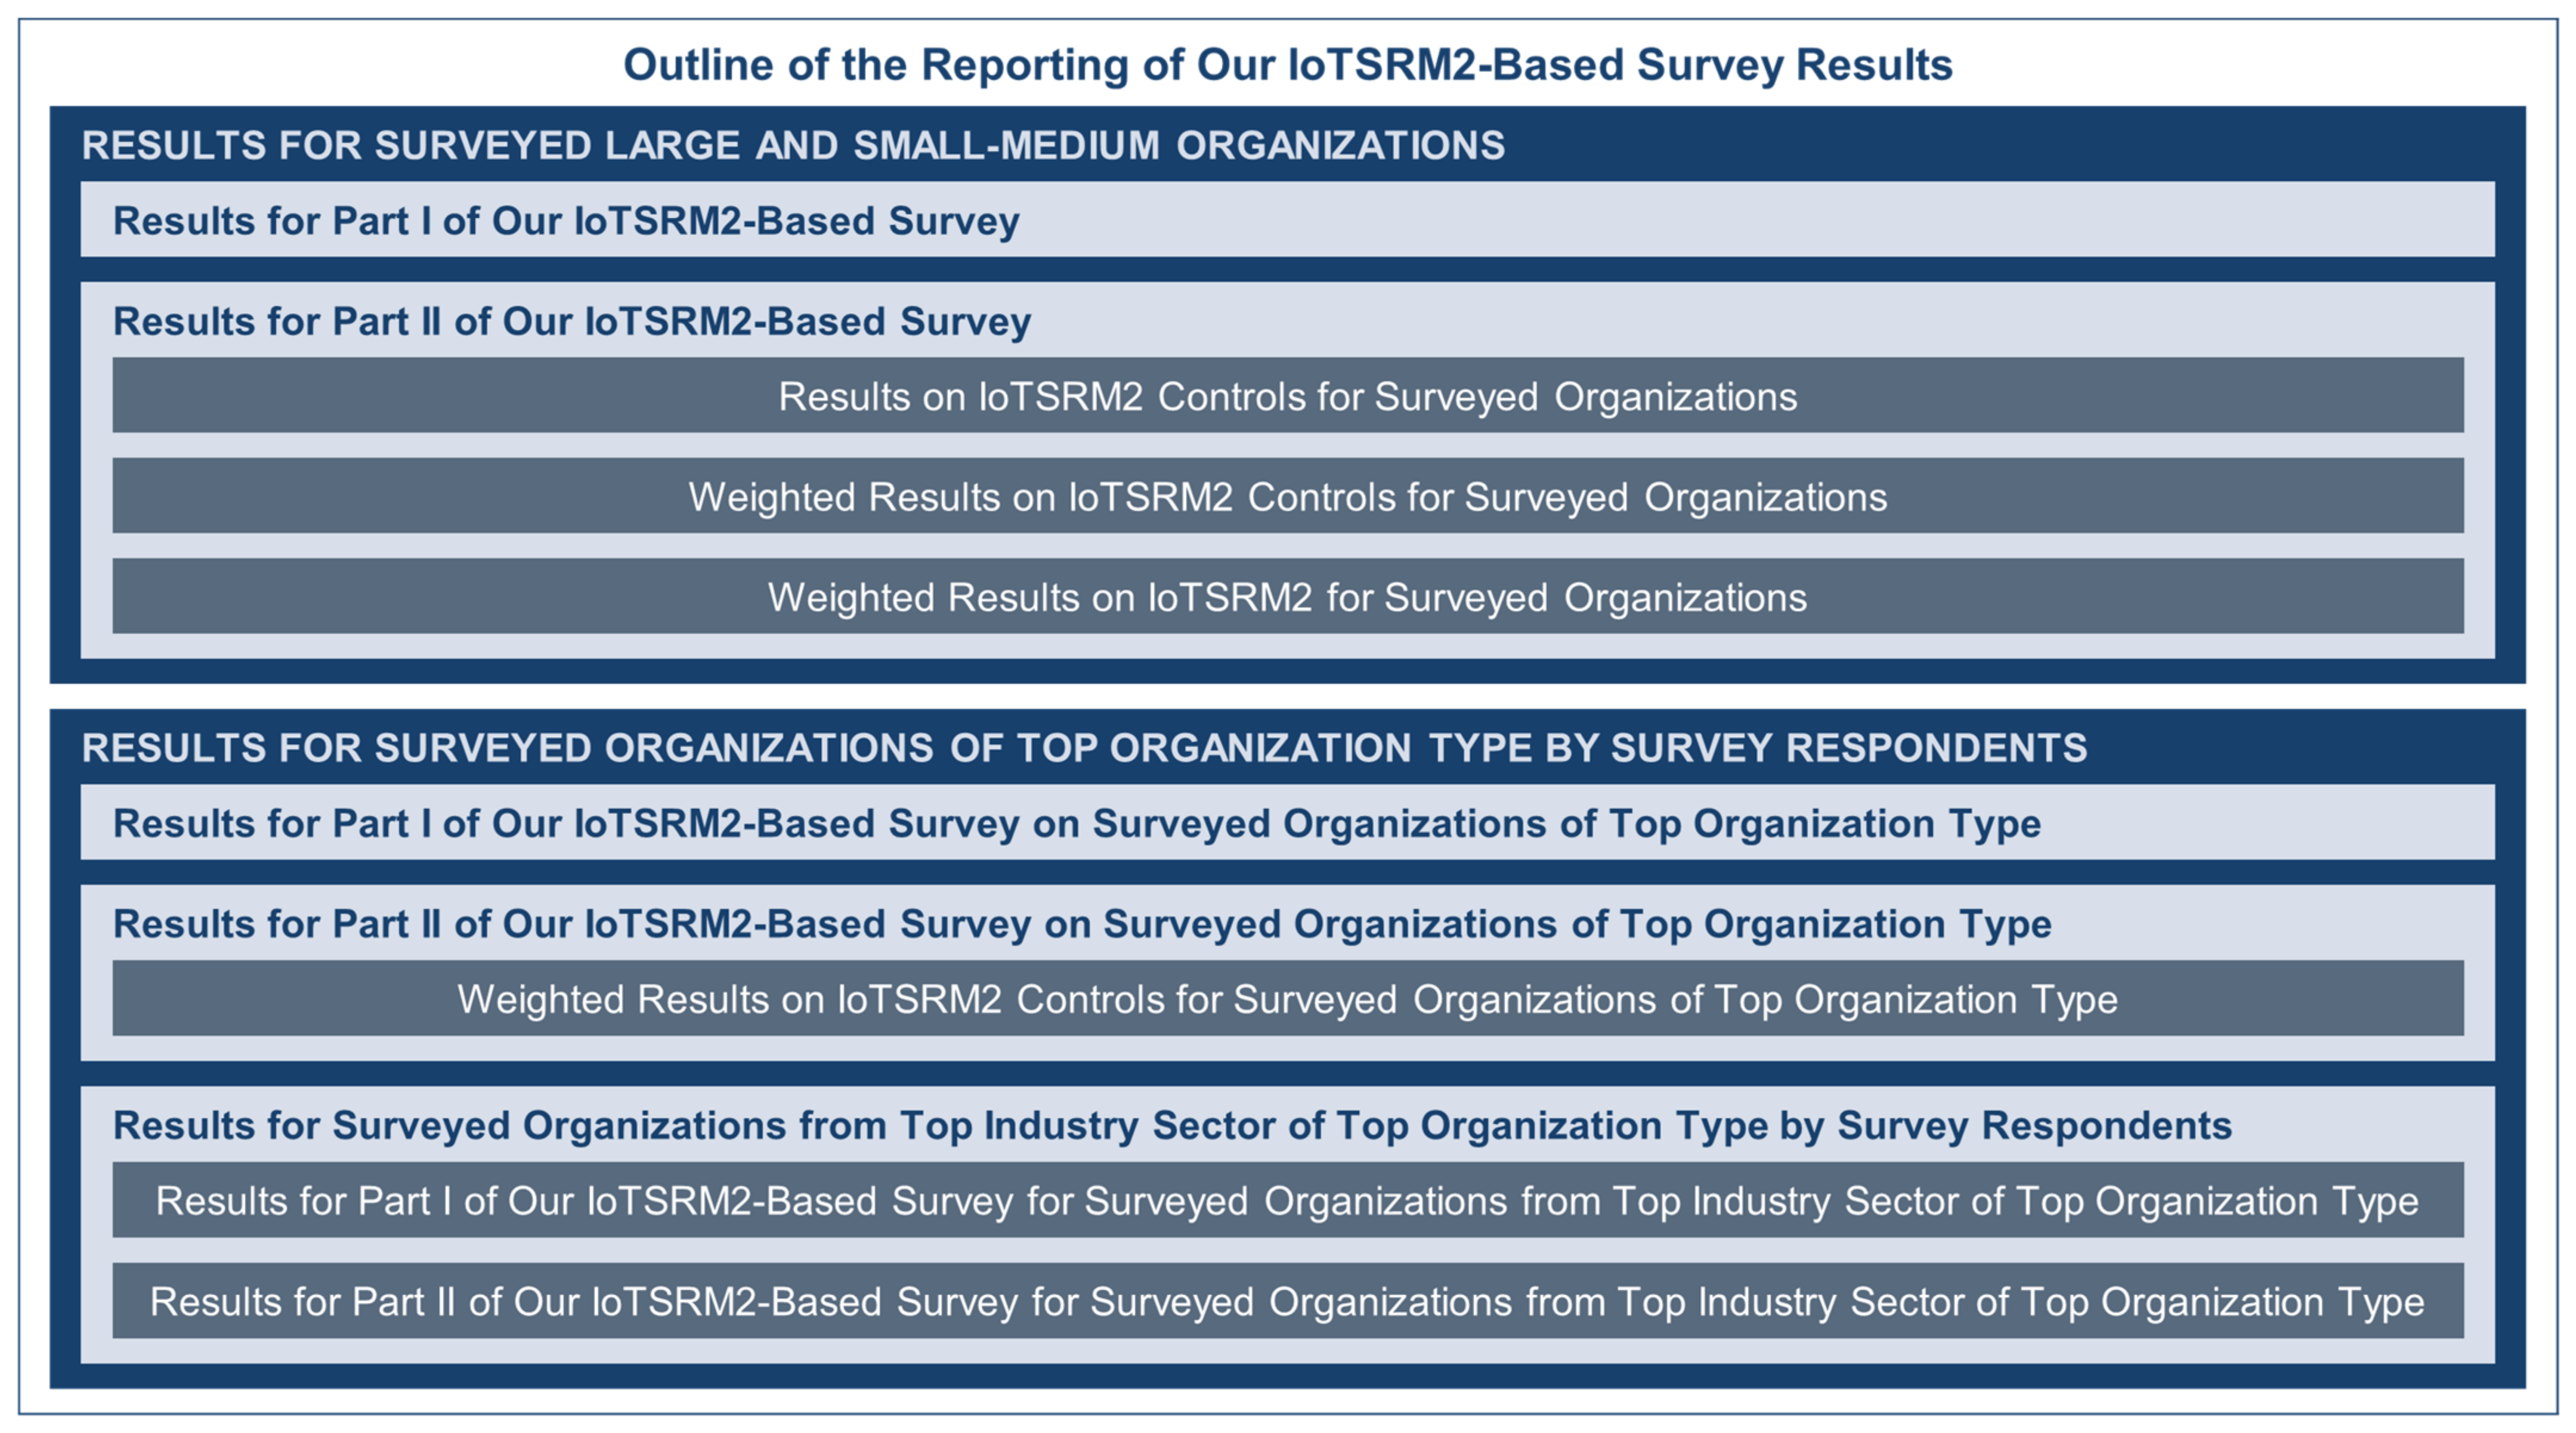
- “Mapping 1” and “Mapping 2” correspond to the results sections related to the surveyed large and small-medium organizations;
- “Mapping 3”, “Mapping 4”, and “Mapping 5” correspond to the results sections related to the surveyed large organizations, where “Mapping 5” corresponds to the surveyed large organizations that operate in the “Technology, Media, & Telecom (TMT)” industry sector in particular.
2. Materials and Methods
2.1. Overview of Our IoTSRM2
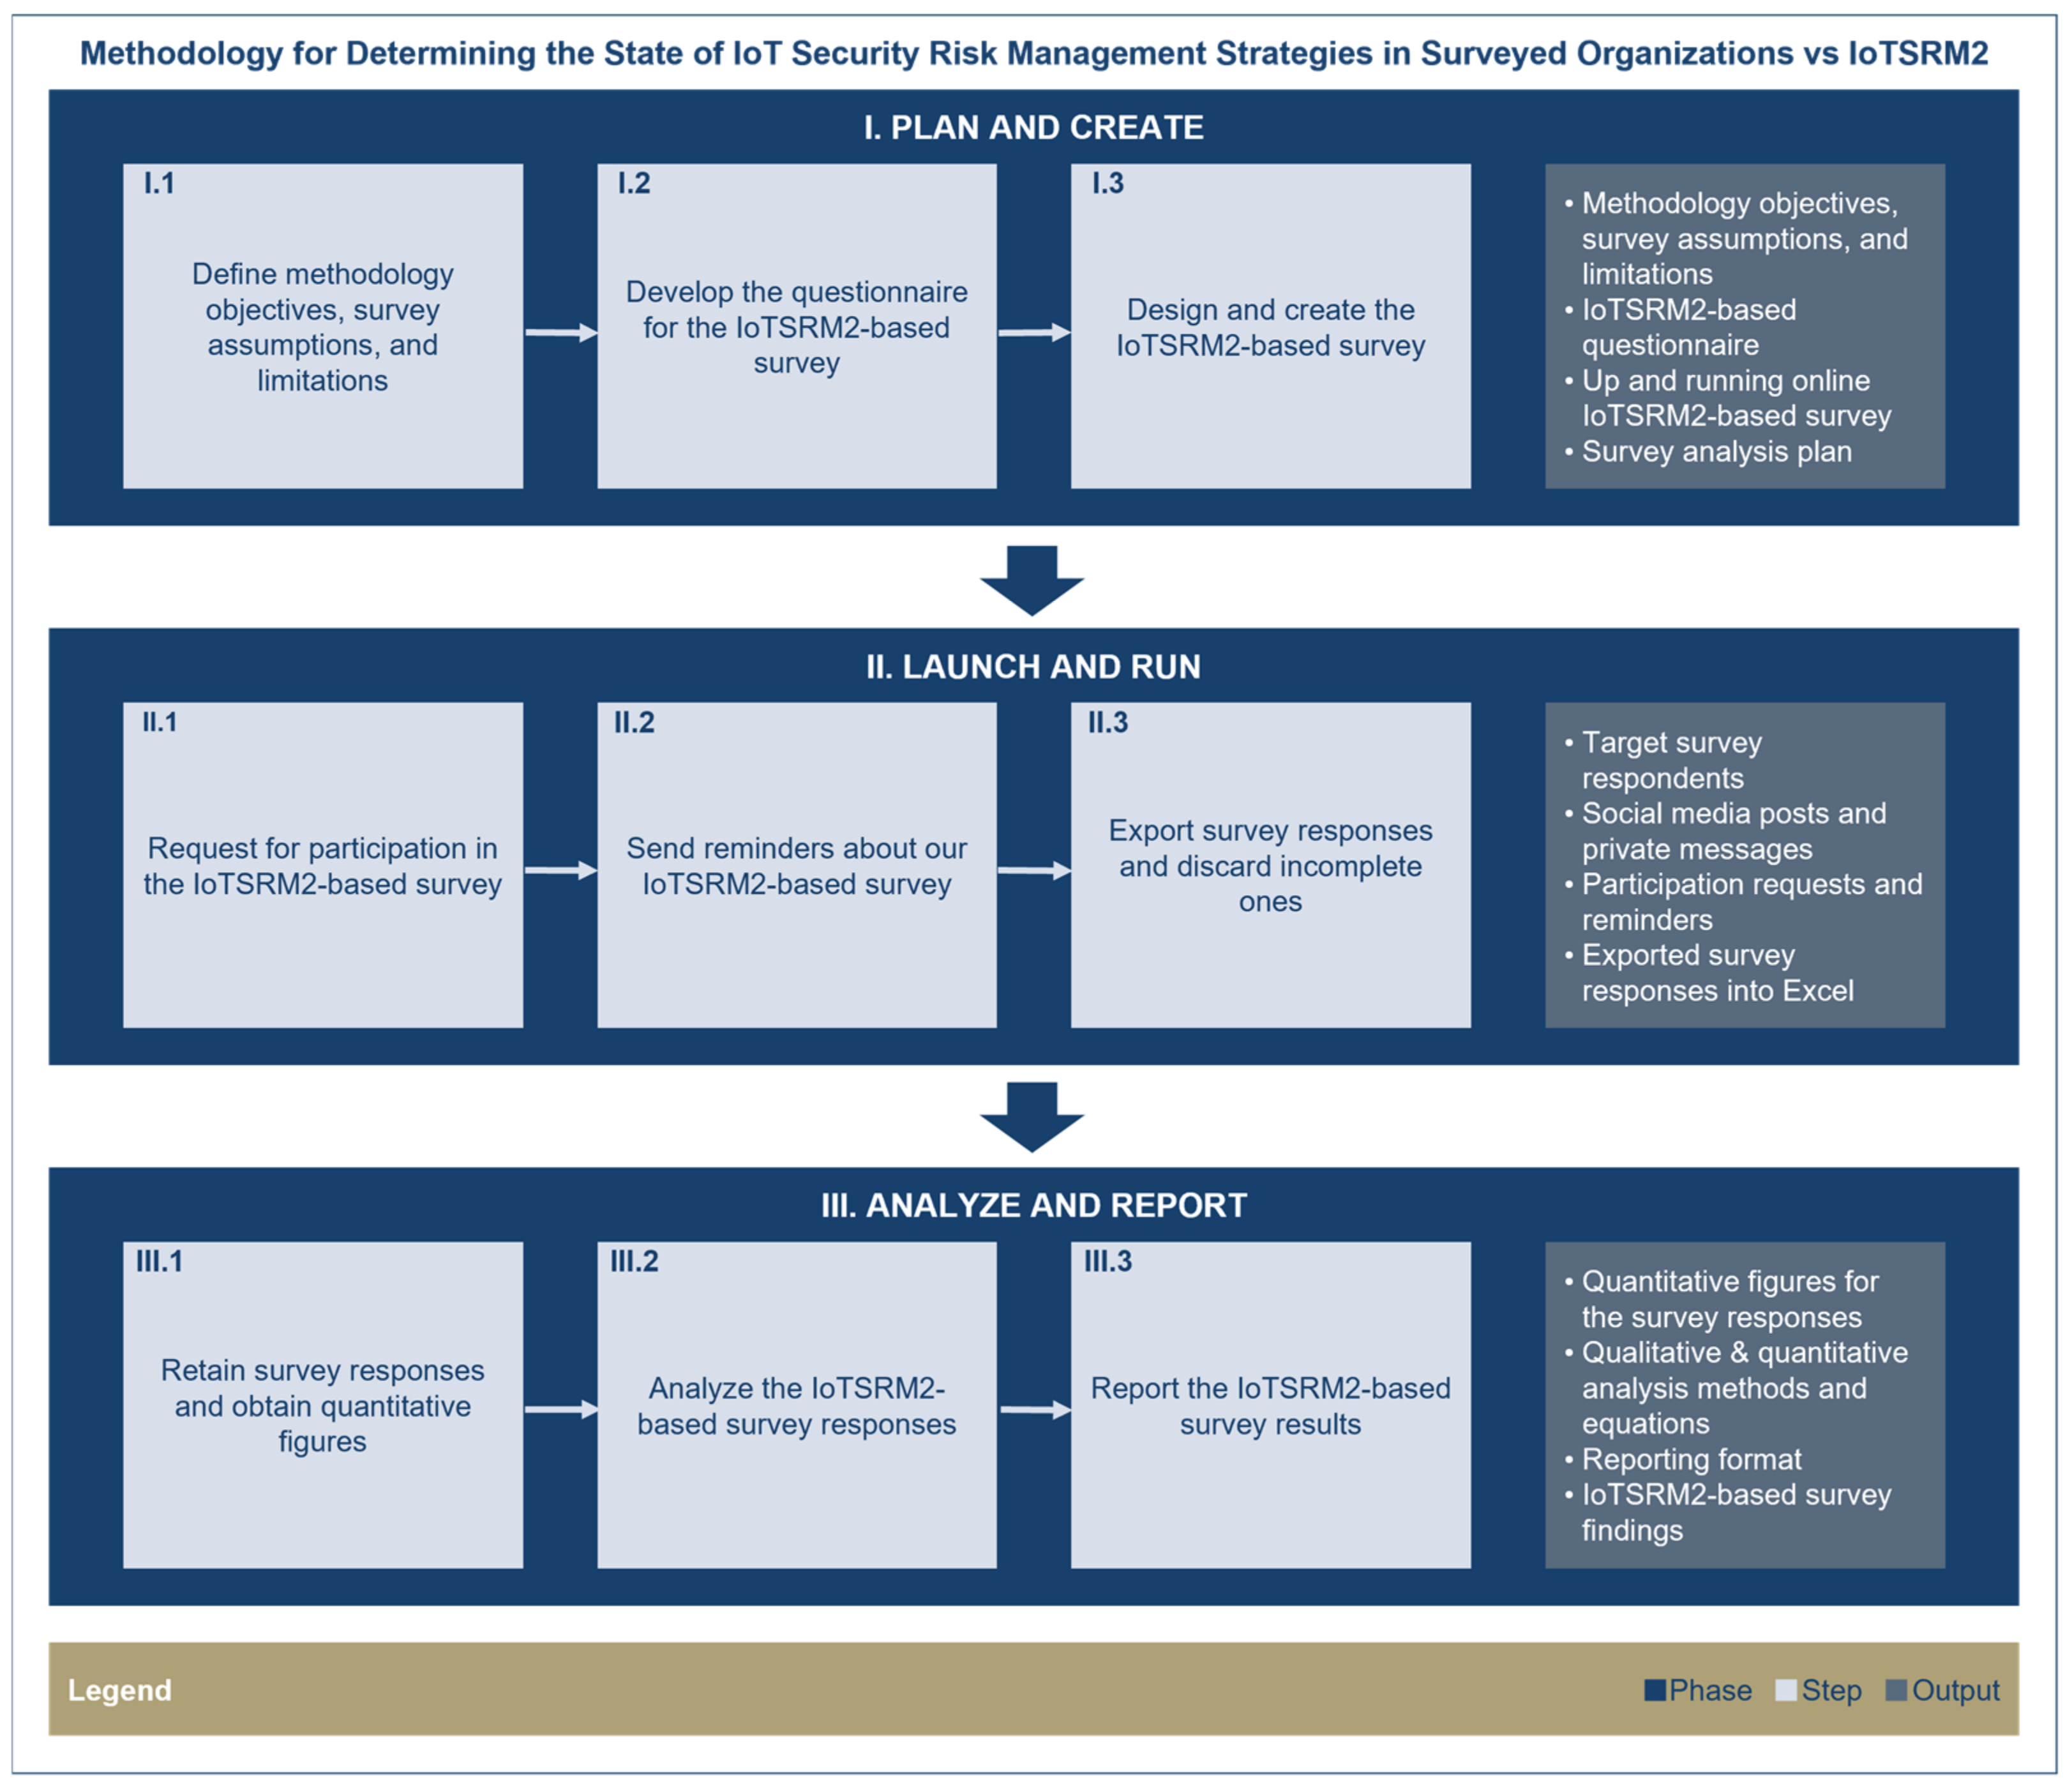
2.2. Our Survey Methodology
2.2.1. Phase I: Plan and Create
- Objective 1: Run an online anonymous survey for four weeks based on the web survey design principles [20] and IoT Security Risk Management Strategy Reference Model (IoTSRM2) (see Section 2.1) targeting leaders with stake in IoT security risk management strategies from industries and governments from around the world to determine the current state of IoT security risk management strategies in the surveyed organizations relative to the IoTSRM2.
- Objective 2: Identify target groups of survey respondents to get the views of leaders from industries and governments on the IoT security risk management strategies of their organizations or client organizations relative to the IoTSRM2;
- Objective 3: Organize the questionnaire of our IoTSRM2-based survey in two parts, including screening and background questions for part I of and IoTSRM2-related questions for part II of our IoTSRM2-based survey;
- Objective 4: For part I of our IoTSRM2-based survey, formulate the screening and background questions with associated answer choices for each question to allow filtering and anonymous profiling of survey respondents and surveyed organizations;
- Objective 5: For part II of our IoTSRM2-based survey, formulate one IoTSRM2-related question with associated answer choices for each of the 30 IoTSRM2 controls (see Section 2.1) from our previous paper [14] to allow the determination of the current state of IoT security risk management strategies in the surveyed organizations based on IoTSRM2;
- Objective 6: Identify the principles for designing web questionnaires [20] that are applicable to our IoTSRM2-based survey to allow its corresponding design based on web survey design principles;
- Objective 7: Define the criteria for selecting an online survey tool that is fit for running our IoTSRM2-based survey;
- Objective 8: Develop the survey analysis plan for our IoTSRM2-based survey to focus the analysis of the survey responses on our research questions;
- Objective 9: Set up our IoTSRM2-based survey using the selected online survey tool to meet the applicable survey design principles and to include our questionnaire;
- Objective 10: Identify the target survey respondents that belong to the target groups of survey respondents and create social media posts and private messages that are aimed at increasing the survey response rate to request participation in our IoTSRM2-based survey;
- Objective 11: Send requests and reminders for survey participation through different distribution channels, including e-mail and social media (i.e., LinkedIn and Twitter);
- Objective 12: Analyze the collected survey responses based on our survey analysis plan and report our survey results for part I and II of our IoTSRM2-based survey for all surveyed organizations, the surveyed organizations of the top organization type by survey respondents, and the surveyed organizations from the top industry sector of the top organization type by survey respondents.
- “IoT adopters are assumed to outsource IoT software development and not engage in in-house IoT software development activities” [14];
- “IoT adopters are assumed to have contracted IoT suppliers and conducted third-party IoT security due diligence reviews covering premarket IoT security related activities ahead of contracting IoT suppliers” [14].
- Our survey respondents are assumed to provide genuine responses about the surveyed organizations;
- The underlying assumptions of the IoTSRM2 are assumed applicable for the surveyed organizations.
- The proposed survey methodology is derived, based on, and limited to our professional judgement, IoT Security Risk Management Strategy Reference Model (IoTSRM2), and the selected survey design best practice;
- Our IoTSRM2-based survey is derived based on, and limited to, our survey methodology;
- Our IoTSRM2-based survey is limited to our survey methodology assumptions and the underlying assumptions of the IoTSRM2;
- Our IoTSRM2-based survey results are limited to the surveyed organizations and to the responses provided by our survey respondents. It is worth noting that any attempt to draw statistical inferences from our survey data about the current state of the IoT security risk management strategies in other organizations than the ones surveyed should be carefully navigated, is subject to survey biases (e.g., non-response bias, self-reporting bias), and is beyond the scope of this article.
2.2.2. Phase II: Launch and Run
- Personalization: the private messages are personalized for engaging with each of our target survey respondents by starting the message with an informal greeting (e.g., “Hello John”);
- Exchange theory: the private messages ask our target survey respondents to complete our survey and/or share it to the right individuals from their teams for getting access to our survey results once these get published (i.e., “Once our next article is published, you will be able to benchmark your organization or client organization against peers”);
- Self-perception theory: the self-perception theory is applied as part of our social media posts by asking prestigious IoT-engaged leaders to complete our survey and/or share it to the right individuals from their teams, which labels them as being IoT engaged (i.e., “we are please asking prestigious IoT-engaged leaders to share their views and or share our survey with the right people”);
- Commitment/involvement: our social media posts and private messages clearly articulate the importance of our IoTSRM2-based survey topic (e.g., “IoTSRM2 relies on 25 IoT security best practices and is the result of an extensive research work”) and of participating in our IoTSRM2-based survey by getting the chance to have their opinions heard (i.e., “Our survey seeks views from leaders from industries and governments on the IoT security risk management strategies of their organizations or client organizations”).
2.2.3. Phase III: Analyze and Report
- The organization category identifier, which shows the type of the organization in question, specifically “LG” for large organizations or “SM” for small-medium organizations;
- The industry classification identifier, which shows the industry sector of the organization in question, specifically “EDU” for “Education”, “E&U” for “Energy & Utilities”, “FSO” for “Financial & Insurance Services”, “GOV” for “Government”, “HSO” for “Healthcare”, “PSO” for “Professional Services”, “TMT” for “Technology, Media, & Telecom”, or “OTH” for “Other”;
- The sequence number of the organization within the group of surveyed organizations of the same organization category and industry sector.
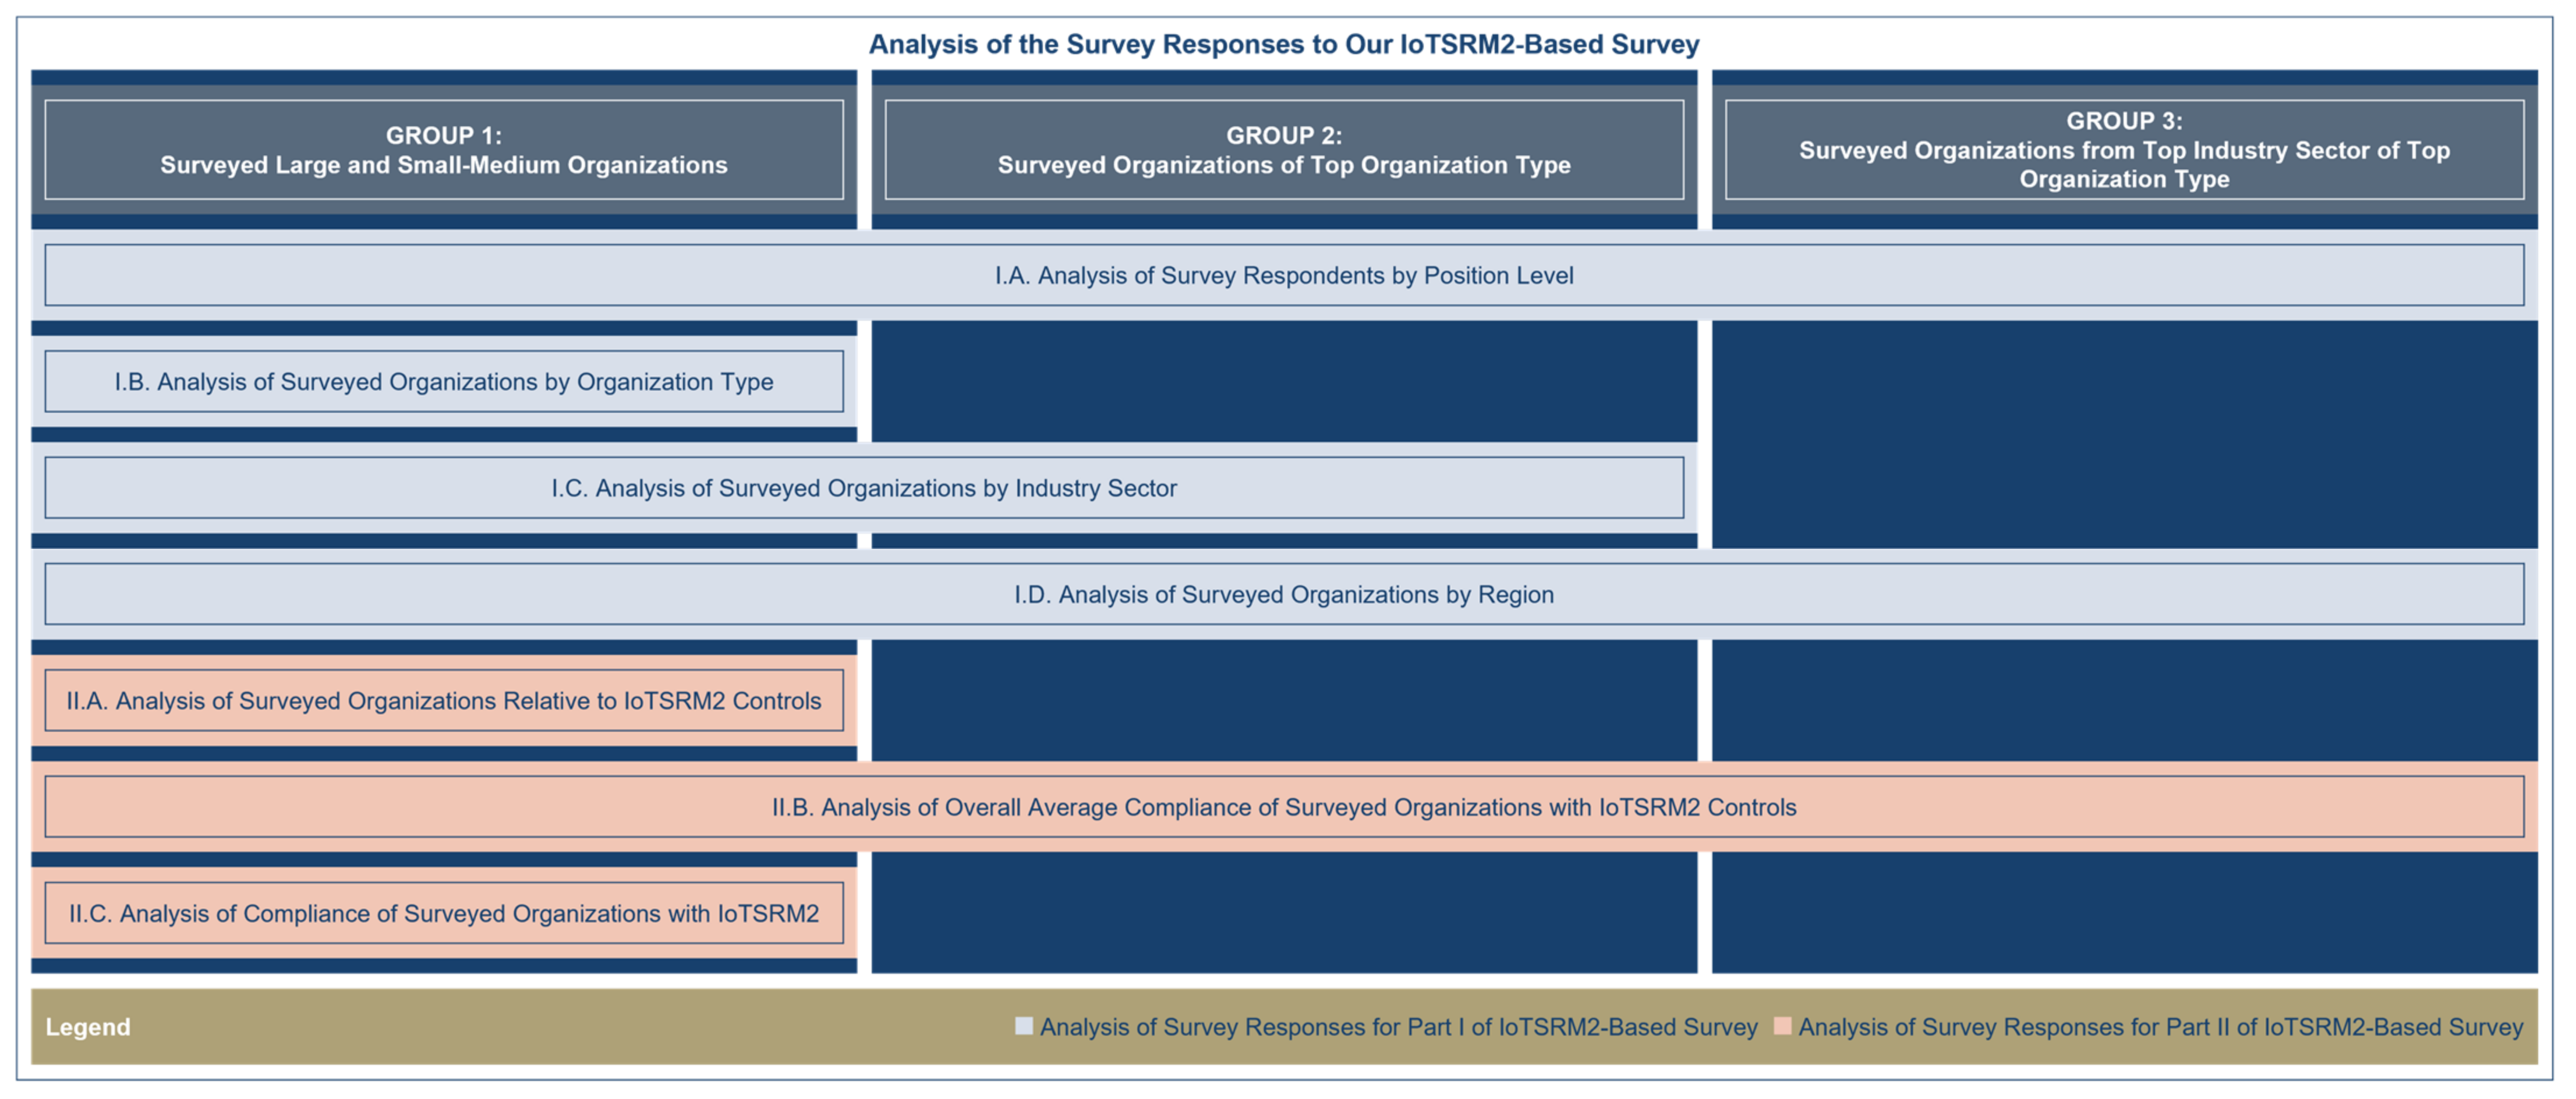
- Group 1: the surveyed large and small-medium organizations;
- Group 2: the surveyed organizations of the top organization type;
- Group 3: the surveyed organizations from the top industry sector of the top organization type.
- Providing the survey results derived from the analysis (i.e., I.A, I.B, I.C, I.D) of the survey responses for part I of the IoTSRM2-based survey (see Step III.2);
- Providing the survey results derived from the analysis (i.e., II.A, II.B, II.C) of the survey responses for part II of the IoTSRM2-based survey (see Step III.2).
- Providing the survey results derived from the analysis (i.e., I.A, I.C, I.D) of the survey responses for part I of the IoTSRM2-based survey (see Step III.2);
- Providing the survey results derived from the analysis (i.e., II.B) of the survey responses for part II of the IoTSRM2-based survey (see Step III.2).
- Providing the survey results derived from the analysis (i.e., I.A, I.D) of the survey responses for part I of the IoTSRM2-based survey (see Step III.2);
- Providing the survey results derived from the analysis (i.e., II.B) of the survey responses for part II of the IoTSRM2-based survey (see Step III.2).
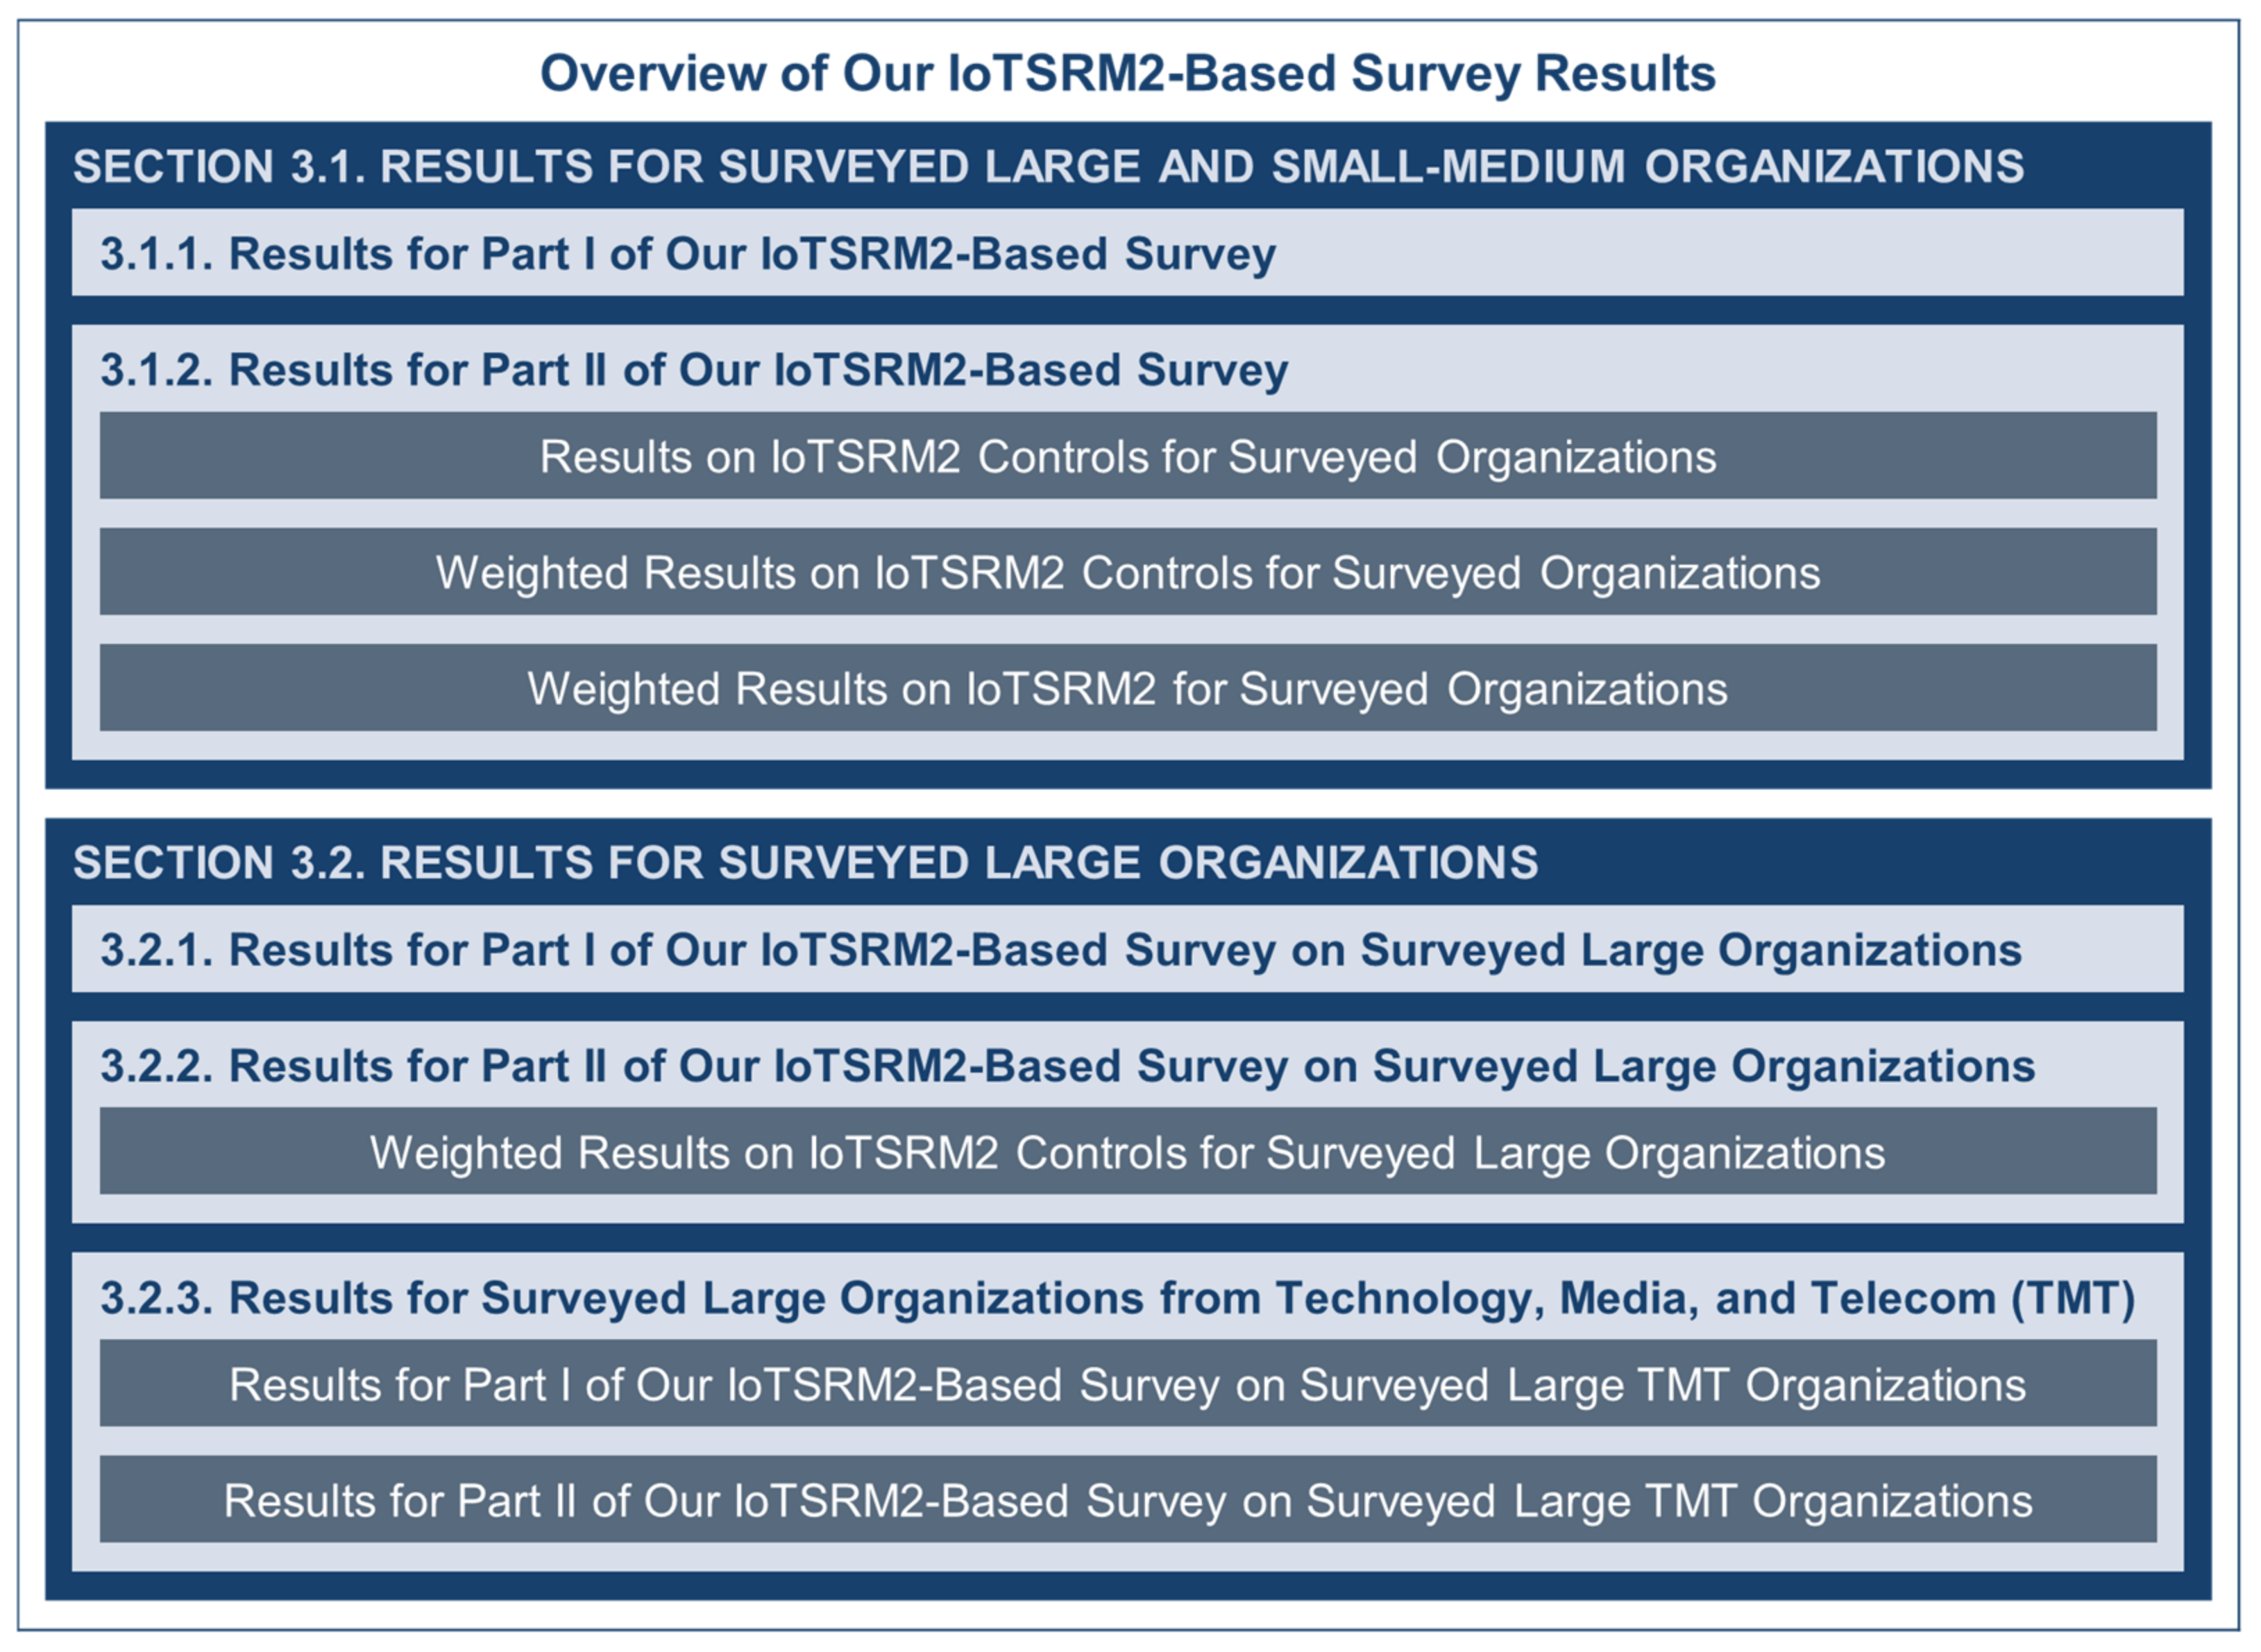
3. Results
3.1. Results for Surveyed Large and Small-Medium Organizations
3.1.1. Results for Part I of Our IoTSRM2-Based Survey
3.1.2. Results for Part II of Our IoTSRM2 Survey
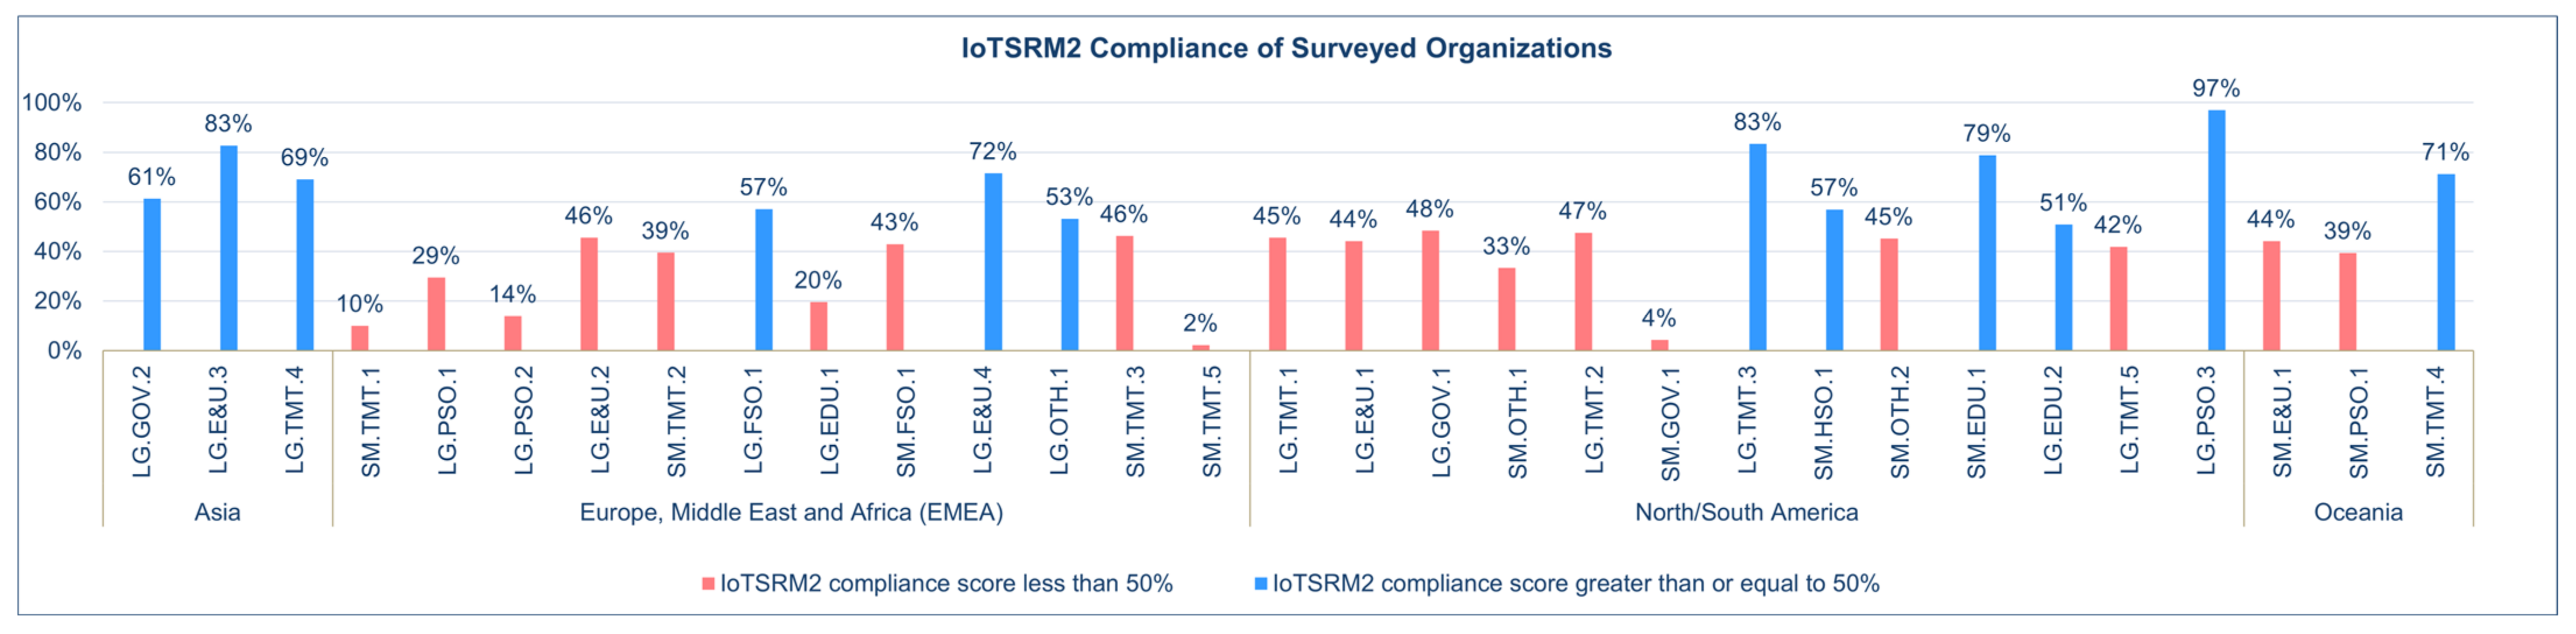
- Half of the surveyed organizations for the “Energy & Utilities” industry sector (i.e., LG.E&U.3 and LG.E&U.4) scored greater than or equal to 50%;
- Half of the surveyed organizations for the “Education” industry sector (i.e., LG.EDU.2) scored greater than or equal to 50%;
- All surveyed organizations for the “Financial & Insurance Services” industry sector (i.e., LG.FSO.1) scored greater than or equal to 50%;
- Half of the surveyed organizations for the “Government” industry sector (i.e., LG.GOV.2) scored greater than or equal to 50%;
- All surveyed organizations for the “Other” industry sector (i.e., LG.OTH.1) scored greater than or equal to 50%, most surveyed organizations for the “Professional Services” industry sector (i.e., LG.PSO.1 and LG.PSO.2) scored less than 50%;
- Most surveyed organizations for the “Technology, Media, & Telecom” industry sector (i.e., LG.TMT.2, LG.TMT.1, and LG.TMT.5) scored less than 50%.
- All surveyed organizations for the “Energy & Utilities” industry sector (i.e., SM.E&U.1) scored less than 50%;
- All surveyed organizations for the “Education” industry sector (i.e., SM.EDU.1) scored greater than or equal to 50%;
- All surveyed organizations for the “Financial & Insurance Services” industry sector (i.e., SM.FSO.1) scored less than 50%;
- All surveyed organizations for the “Government” industry sector (i.e., SM.GOV.1) scored less than 50%;
- All surveyed organizations for the “Healthcare” industry sector (i.e., SM.HSO.1) scored greater than or equal to 50%;
- All surveyed organizations for the “Other” industry sector (i.e., SM.OTH.2 and SM.OTH.1) scored less than 50%;
- All surveyed organizations for the “Professional Services” industry sector (i.e., SM.PSO.1) scored less than 50%;
- Most surveyed organizations for the “Technology, Media, & Telecom” industry sector (i.e., SM.TMT.3, SM.TMT.2, SM.TMT.1, and SM.TMT.5) scored less than 50%.
- All surveyed organizations for the “Asia” region (i.e., LG.E&U.3, LG.TMT.4, and LG.GOV.2) scored greater than or equal to 50%;
- Most surveyed organizations for the “Europe, Middle East and Africa (EMEA)” region (i.e., LG.E&U.2, LG.PSO.1, LG.EDU.1, and LG.PSO.2) scored less than 50%;
- Most surveyed organizations for the “North/South America” region (i.e., LG.GOV.1, LG.TMT.2, LG.TMT.1, LG.E&U.1, and LG.TMT.5) scored less than 50%.
- All surveyed organizations for the “Europe, Middle East and Africa (EMEA)” region (i.e., SM.TMT.3, SM.FSO.1, SM.TMT.2, SM.TMT.1, and SM.TMT.5) scored less than 50%;
- Most surveyed organizations for the “North/South America” region (i.e., SM.OTH.2, SM.OTH.1, and SM.GOV.1) scored less than 50%;
- Most surveyed organizations for the “Oceania” region (i.e., SM.E&U.1 and SM.PSO.1) scored less than 50%.
3.2. Results for Surveyed Large Organizations
3.2.1. Results for Part I of Our IoTSRM2-Based Survey on Surveyed Large Organizations
3.2.2. Results for Part II of Our IoTSRM2 Survey on Surveyed Large Organizations
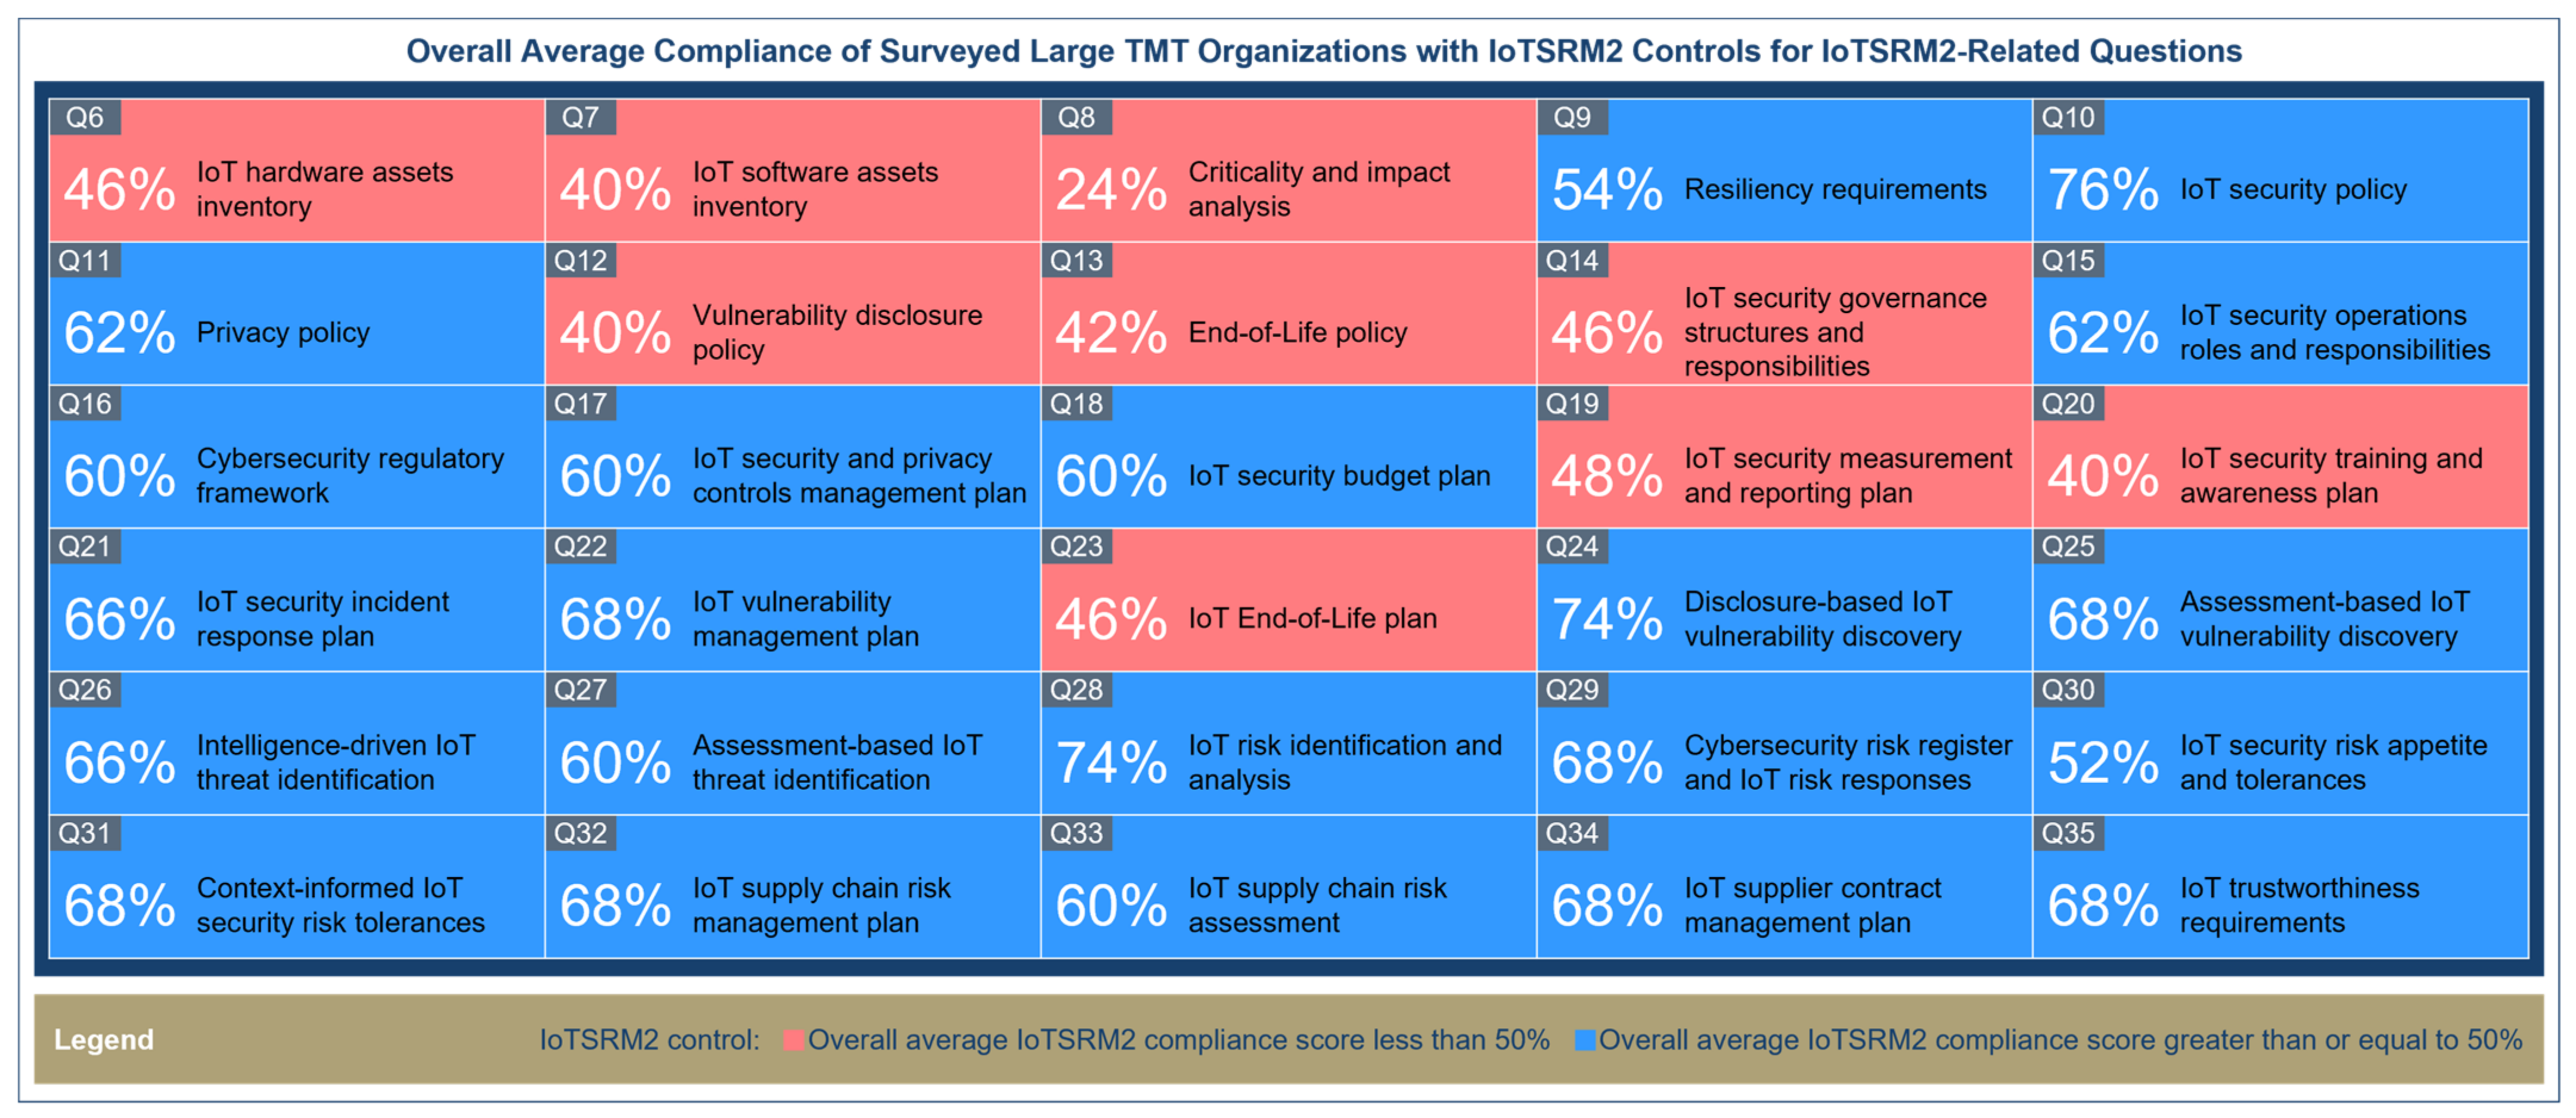
3.2.3. Results for Surveyed Large Organizations from Technology, Media, & Telecom (TMT)
4. Related Work
- Selection criterion 1: The related work is available in English;
- Selection criterion 2: The related work is focused on determining the current state of IoT security risk management strategy in organizations at least to a certain extent;
- Selection criterion 3: The related work employs an interview-, survey-, or experiment-based research method;
- Condition 1: The related works are research studies from both academia and industry.
5. Conclusions and Future Work
Author Contributions
Funding
Institutional Review Board Statement
Informed Consent Statement
Data Availability Statement
Acknowledgments
Conflicts of Interest
Appendix A

| No. | Possible Item of Interest | Our Mapping | |||
|---|---|---|---|---|---|
| Section | Presentation Mode 1 | Main Justification | Indicative Links | ||
| 1. | Research gap | 1. Introduction | Text only | For advancement of research | Section 2, Section 3, Section 4 and Section 5 |
| 2. | Research purpose | 1. Introduction | Text only | To state the significance of our research | Section 2, Section 3, Section 4 and Section 5 |
| 3. | Research questions | 1. Introduction | Bullet points | To provide our research directions | Section 1: Figure 2 |
| Section 2.2.1: Table 7 | |||||
| Section 2.2.3: Step III.2 | |||||
| Section 3, Section 4 and Section 5 | |||||
| 4. | Main contributions | 1. Introduction | Bullet points | To show the significance of our research | Section 2, Section 3 and Section 4 |
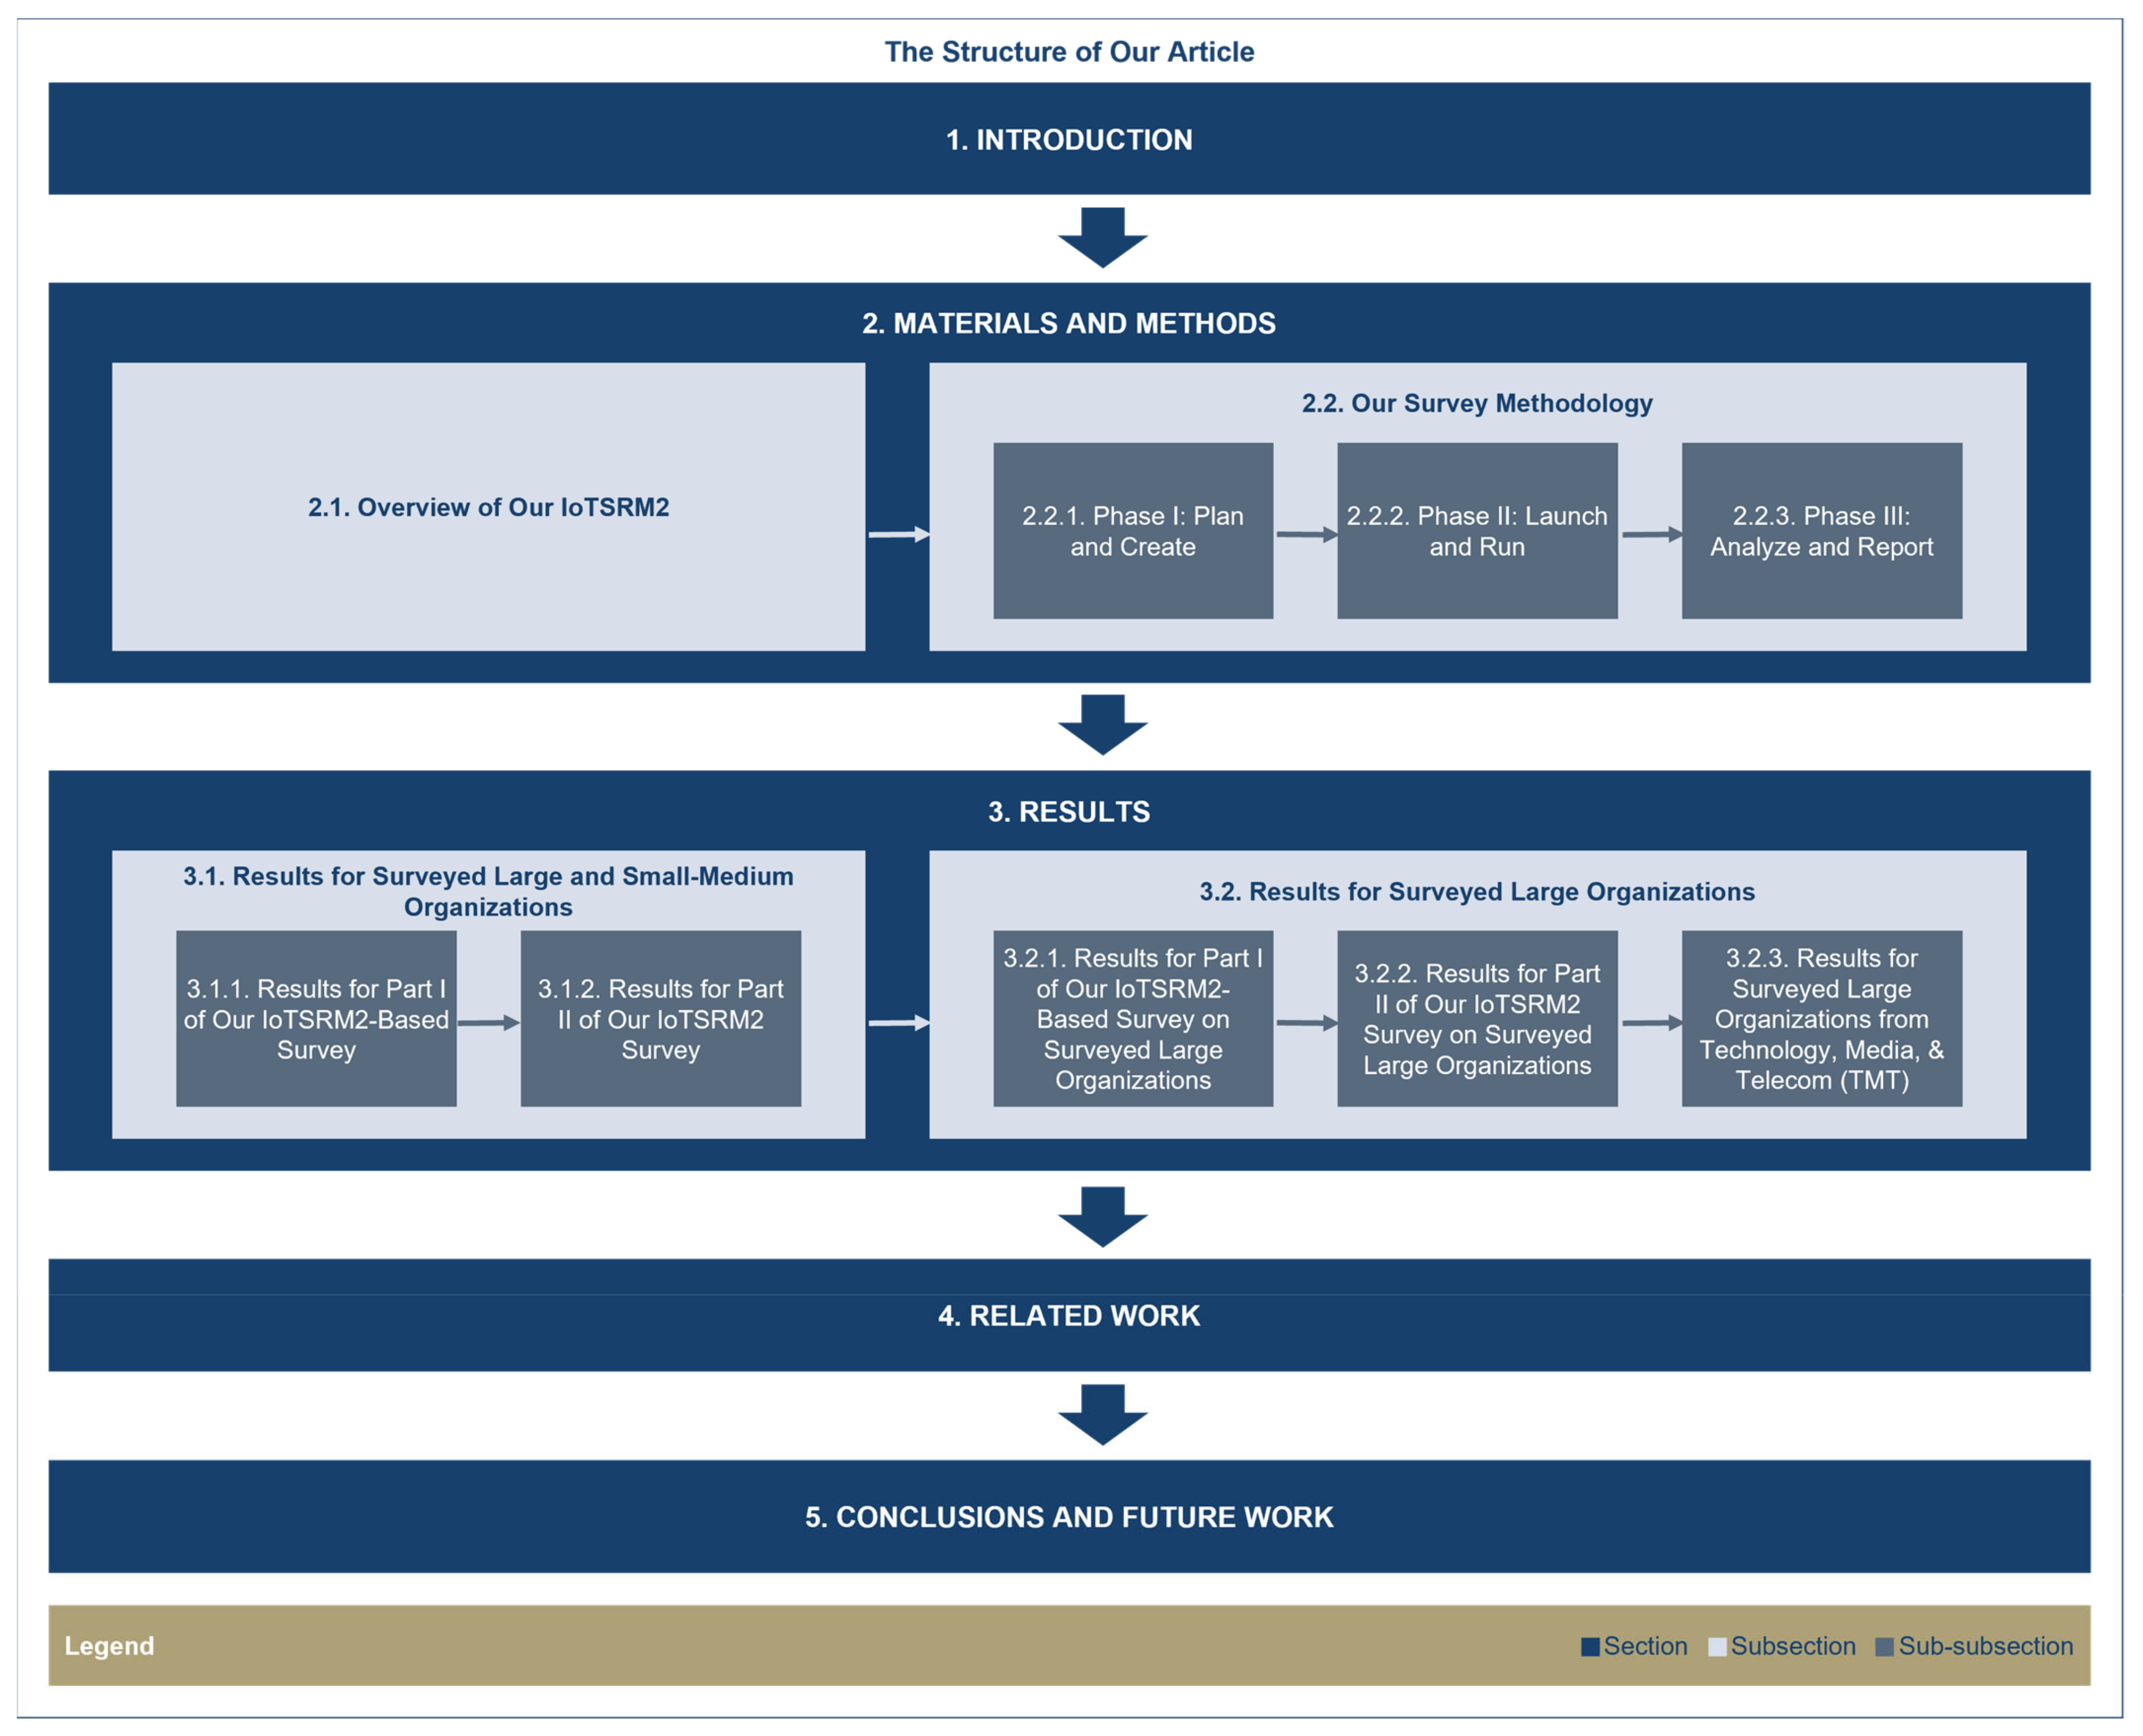
| 5. | Article structure | 1. Introduction | Figure 1 | To enhance the readability of our article | Section 1, Section 2, Section 3, Section 4 and Section 5 |
| 6. | A reading map for research questions | 1. Introduction | Figure 2 | To enhance the readability of our article | Section 1, Section 2, Section 3, Section 4 and Section 5 |
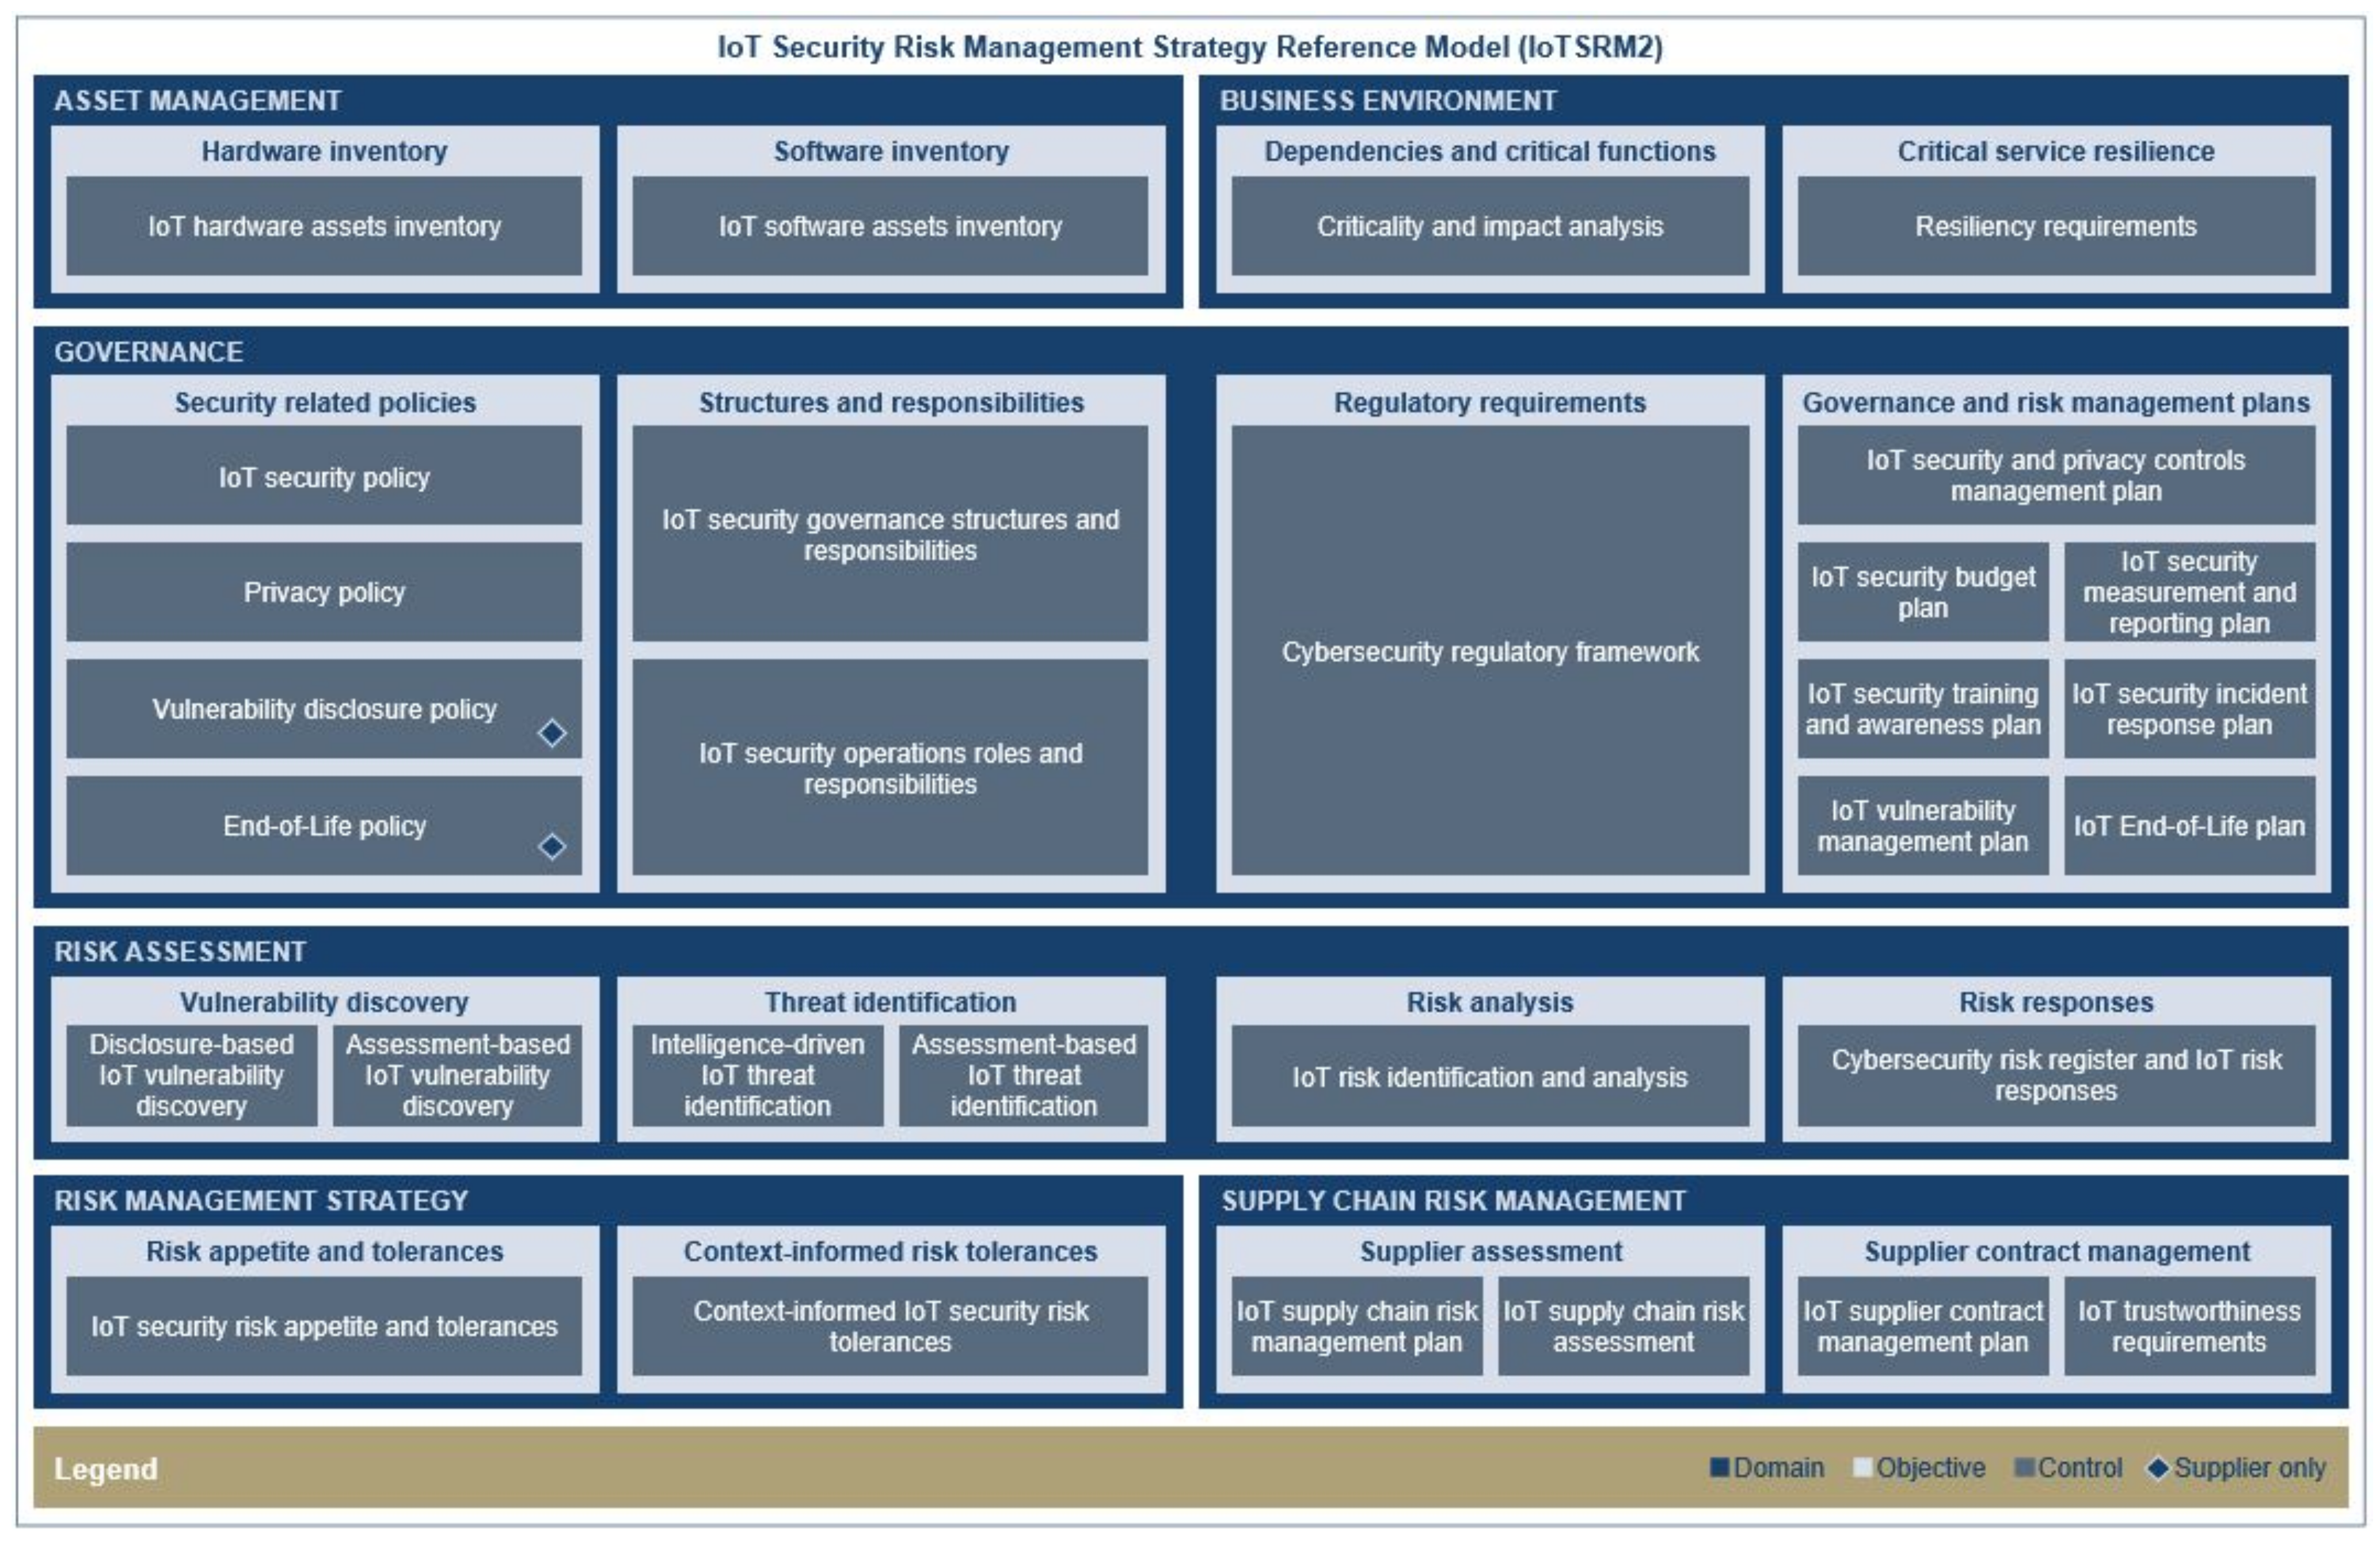
| 7. | Illustrative view of IoTSRM2 | 2.1. Overview of Our IoTSRM2 | Figure 3 | To inform about our IoTSRM2 | Section 3.1.2: Figure 12 and Figure 13 |
| Section 3.2.2: Figure 18 | |||||
| Section 3.2.3: Figure 21 | |||||
| 8. | IoTSRM2 controls with adjusted weights | 2.1. Overview of Our IoTSRM2 | Table 1 | To inform about our IoTSRM2 | Section 2.2.1: Table 3 |
| Section 3.1.2: Figure 12 and Figure 13 | |||||
| Section 3.2.2: Figure 18 | |||||
| Section 3.2.3: Figure 21 | |||||
| 9. | Survey methodology | 2.2. Our Survey Methodology | Figure 4 | To explain our research approach | Section 1, Section 2.1, Section 3, Section 4 and Section 5 |
| 10. | Methodology objectives | 2.2.1. Phase I: Plan and Create | Bullet points | To provide structure and directions for our research | Section 1, Section 2.2, Section 3 and Section 4 |
| 11. | Assumptions and limitations | 2.2.1. Phase I: Plan and Create | Bullet points | To inform about assumptions and limitations | Section 2.2 and Section 3 |
| 12. | Part I of the questionnaire | 2.2.1. Phase I: Plan and Create | Table 2 | To address Objectives 3, 4, and 9 | Section 2.2.1: Table 7 |
| Section 2.2.3: Figure 5 and Figure 6 | |||||
| Section 3: Figure 7 | |||||
| Section 3.1.1: Figure 10 and Figure 11 | |||||
| Section 3.2.1: Figure 15, Figure 16 and Figure 17 | |||||
| Section 3.2.3: Figure 19 and Figure 20 | |||||
| 13. | Part II of the questionnaire | 2.2.1. Phase I: Plan and Create | Table 3 and Table 4 | To address Objectives 3, 5, and 9 | Section 2.1: Table 1 |
| Section 2.2.1: Table 7 | |||||
| Section 2.2.3: Figure 5 and Figure 6, Equation (1) | |||||
| Section 3: Figure 7 | |||||
| Section 3.1.2: Figure 12, Figure 13 and Figure 14 | |||||
| Section 3.2.2: Figure 18 | |||||
| Section 3.2.3: Figure 21 | |||||
| 14. | Survey design | 2.2.1. Phase I: Plan and Create | Table 5, Table 6 and Table 7 | To address Objectives 1, 6, 7, and 9 | Section 2.2 and Section 3 |
| 15. | Survey analysis plan | 2.2.1. Phase I: Plan and Create | Table 7 | To address Objective 8 | Section 1 |
| Section 2.2.1: Table 2, Table 3 and Table 4 | |||||
| Section 2.2.3: Figure 5 and Figure 6, Equations (1)–(4) | |||||
| Section 3 | |||||
| 16. | Target survey respondents | 2.2.2. Phase II: Launch and Run | Text only | To address Objectives 1, 2, 4, 10, and 11 | Section 2.2.1: Table 2 and Table 7 |
| Section 2.2.3: Figure 4, Step III.3 | |||||
| Section 3.1: Table 8 | |||||
| Section 3.1.1: Figure 8 | |||||
| Section 3.2.1: Figure 15 | |||||
| Section 3.2.3: Figure 19 | |||||
| 17. | Analysis of survey responses | 2.2.3. Phase III: Analyze and Report | Figure 5, Equations (1)–(4) | To address Objective 12 | Section 1 |
| Section 2.2.1: Table 2, Table 3 and Table 4 and Table 8 | |||||
| Section 2.2.3: Step III.3 | |||||
| Section 3 | |||||
| 18. | Naming convention for identifying surveyed organizations | 2.2.3. Phase III: Analyze and Report | Bullet points | To enhance the readability of Figure 14 | Section 3.1.2: Figure 14 |
| 19. | Reporting of survey results | 2.2.3. Phase III: Analyze and Report | Figure 6 | To address Objective 12 | Section 2.2.1: Table 2, Table 3 and Table 4 and Table 8 |
| Section 2.2.3: Step III.2 | |||||
| Section 3 | |||||
| 20. | Survey results | 3. Results | Figure 7 | To address Objectives 1 and 12 | Section 1, Section 2, and Section 5 |
| 21. | Results for all surveyed organizations | 3.1. Results for Surveyed Large and Small-Medium Organizations | Table 8, Figure 8, Figure 9, Figure 10, Figure 11, Figure 12, Figure 13 and Figure 14 | To address Objectives 1 and 12 | Section 1, Section 2, Section 3.2, Section 4 and Section 5 |
| 22. | Results for surveyed large organizations | 3.2. Results for Surveyed Large Organizations | Figure 15, Figure 16, Figure 17 and Figure 18 | To address Objectives 1 and 12 | Section 1, Section 2, Section 3.1, Section 4 and Section 5 |
| 23. | Results for surveyed large TMT organizations | 3.2.3. Results for Surveyed Large Organizations from Technology, Media, & Telecom (TMT) | Figure 19, Figure 20 and Figure 21 | To address Objectives 1 and 12 | Section 1, Section 2, Section 3.1, Section 3.2.1, Section 3.2.2, Section 4 and Section 5 |
| 24. | Related works | 4. Related Work | Table 9 and Table 10 | To compare our research with related works | Section 1, Section 2.2, Section 3 and Section 5 |
| 25. | Conclusions and future work | 5. Conclusions and Future Work | Text only | To summarize our work and point out future work | Section 1, Section 2, Section 3 and Section 4 |
Appendix B
Appendix C
| IoTSRM2 Question ID | IoTSRM2 Control | No. of “No, to a Great Extent” | No. of “No, to a Certain Extent” | No. of “Yes, to a Certain Extent” | No. of “Yes, to a Great Extent” |
|---|---|---|---|---|---|
| 6 | IoT hardware assets inventory | 6 | 12 | 10 | 3 |
| 7 | IoT software assets inventory | 8 | 11 | 11 | 1 |
| 8 | Criticality and impact analysis | 5 | 12 | 13 | 1 |
| 9 | Resiliency requirements | 5 | 5 | 15 | 6 |
| 10 | IoT security policy | 5 | 9 | 13 | 4 |
| 11 | Privacy policy | 7 | 7 | 16 | 1 |
| 12 | Vulnerability disclosure policy | 7 | 9 | 12 | 3 |
| 13 | End-of-Life policy | 7 | 12 | 11 | 1 |
| 14 | IoT security governance structures and responsibilities | 5 | 9 | 12 | 5 |
| 15 | IoT security operations roles and responsibilities | 5 | 6 | 14 | 6 |
| 16 | Cybersecurity regulatory framework | 6 | 7 | 13 | 5 |
| 17 | IoT security and privacy controls management plan | 5 | 11 | 12 | 3 |
| 18 | IoT security budget plan | 6 | 10 | 11 | 4 |
| 19 | IoT security measurement and reporting plan | 8 | 10 | 11 | 2 |
| 20 | IoT security training and awareness plan | 8 | 13 | 9 | 1 |
| 21 | IoT security incident response plan | 7 | 9 | 10 | 5 |
| 22 | IoT vulnerability management plan | 5 | 8 | 14 | 4 |
| 23 | IoT End-of-Life plan | 7 | 14 | 8 | 2 |
| 24 | Disclosure-based IoT vulnerability discovery | 6 | 7 | 12 | 6 |
| 25 | Assessment-based IoT vulnerability discovery | 5 | 8 | 14 | 4 |
| 26 | Intelligence-driven IoT threat identification | 6 | 9 | 11 | 5 |
| 27 | Assessment-based IoT threat identification | 7 | 9 | 11 | 4 |
| 28 | IoT risk identification and analysis | 5 | 7 | 15 | 4 |
| 29 | Cybersecurity risk register and IoT risk responses | 5 | 8 | 14 | 4 |
| 30 | IoT security risk appetite and tolerances | 5 | 15 | 6 | 5 |
| 31 | Context-informed IoT security risk tolerances | 4 | 14 | 8 | 5 |
| 32 | IoT supply chain risk management plan | 6 | 13 | 9 | 3 |
| 33 | IoT supply chain risk assessment | 7 | 13 | 9 | 2 |
| 34 | IoT supplier contract management plan | 10 | 10 | 9 | 2 |
| 35 | IoT trustworthiness requirements | 10 | 7 | 11 | 3 |
References
- Giuca, O.; Popescu, T.M.; Popescu, A.M.; Prostean, G.; Popescu, D.E. A Survey of Cybersecurity Risk Management Frameworks. In Soft Computing Applications. SOFA 2018. Advances in Intelligent Systems and Computing; Balas, V., Jain, L., Balas, M., Shahbazova, S., Eds.; Springer: Cham, Switzerland, 2021; Volume 1221, pp. 240–272. ISBN 978-3-030-51991-9. [Google Scholar]
- World Economic Forum. The Global Risks Report 2021, 16th ed.; Insight Report; World Economic Forum: Geneva, Switzerland, 2021; Available online: http://www3.weforum.org/docs/WEF_The_Global_Risks_Report_2021.pdf (accessed on 9 June 2021).
- World Economic Forum. Future Series: Cybersecurity, Emerging Technology and Systemic Risk; Insight Report; World Economic Forum: Geneva, Switzerland, 2021; Available online: http://www3.weforum.org/docs/WEF_Future_Series_Cybersecurity_emerging_technology_and_systemic_risk_2020.pdf (accessed on 9 June 2021).
- Singh, R.P.; Javaid, M.; Haleem, A.; Suman, R. Internet of things (IoT) applications to fight against COVID-19 pandemic. Diabetes Metab. Syndr. Clin. Res. Rev. 2020, 14, 521–524. [Google Scholar] [CrossRef] [PubMed]
- Kashani, M.H.; Madanipour, M.; Nikravan, M.; Asghari, P.; Mahdipour, E. A systematic review of IoT in healthcare: Applications, techniques, and trends. J. Netw. Comput. Appl. 2021, 192, 103164. [Google Scholar] [CrossRef]
- Khanna, A.; Kaur, S. Internet of Things (IoT), applications and challenges: A comprehensive review. Wirel. Pers. Commun. 2020, 114, 1687–1762. [Google Scholar] [CrossRef]
- Hassan, R.; Qamar, F.; Hasan, M.K.; Aman, A.H.M.; Ahmed, A.S. Internet of Things and Its Applications: A Comprehensive Survey. Symmetry 2020, 12, 1674. [Google Scholar] [CrossRef]
- Gayialis, S.P.; Konstantakopoulos, G.D.; Kechagias, E.P.; Papadopoulos, G.A.; Ponis, S.T. Developing an advanced cloud-based vehicle routing and scheduling system for urban freight transportation. In Advances in Production Management Systems. Smart Manufacturing for Industry 4.0; Moon, I., Lee, G., Park, J., Kiritsis, D., Von Cieminski, G., Eds.; Springer: Cham, Switzerland, 2018; Volume 536, pp. 190–197. [Google Scholar]
- Gayialis, S.P.; Konstantakopoulos, G.D.; Kechagias, E.P.; Papadopoulos, G.A. An Advanced Transportation System Based on Internet of Things. In Proceedings of the 10th Annual International Conference on Industrial Engineering and Operations Management (IEOM 2020), Dubai, United Arab Emirates, 10–12 March 2020; pp. 3007–3012, ISSN: 2169-8767. ISBN 978-1-5323-5952-1. [Google Scholar]
- Kechagias, E.P.; Gayialis, S.P.; Konstantakopoulos, G.D.; Papadopoulos, G.A. An Application of an Urban Freight Transportation System for Reduced Environmental Emissions. Systems 2020, 8, 49. [Google Scholar] [CrossRef]
- World Economic Forum. State of the Connected World, 2020 ed.; Insight Report; World Economic Forum: Geneva, Switzerland, 2020; Available online: http://www3.weforum.org/docs/WEF_The_State_of_the_Connected_World_2020.pdf (accessed on 9 June 2021).
- Popescu, T.M.; Popescu, A.M.; Prostean, G.; Popescu, D.E. Cybersecurity Threat Rating Method Based on Potential Cyber Harm. In Proceedings of the 34th International Business Information Management Association Conference (IBIMA). Vision 2025: Education Excellence and Management of Innovations through Sustainable Economic Competitive Advantage, Madrid, Spain, 13–14 November 2019; Soliman, K.S., Ed.; pp. 5909–5920, ISBN 978-0-9998551-3-3. [Google Scholar]
- Lallie, H.S.; Shepherd, L.A.; Nurse, J.R.C.; Erola, A.; Epiphaniou, G.; Maple, C.; Bellekens, X. Cyber security in the age of COVID-19: A timeline and analysis of cyber-crime and cyber-attacks during the pandemic. Comput. Secur. 2021, 105, 102248. [Google Scholar] [CrossRef]
- Popescu, T.M.; Popescu, A.M.; Prostean, G. IoT Security Risk Management Strategy Reference Model (IoTSRM2). Future Internet 2021, 13, 148. [Google Scholar] [CrossRef]
- Palo Alto Networks. 2020 Unit 42 IoT Threat Report. Available online: https://start.paloaltonetworks.com/unit-42-iot-threat-report (accessed on 7 June 2021).
- Popescu, T.M.; Popescu, A.M.; Prostean, G.; Popescu, D.E. Evaluation of legislations from the perspective of organizational understanding to managing cybersecurity risk. In Proceedings of the 33rd International Business Information Management Association Conference, IBIMA 2019: Education Excellence and Innovation Management through Vision 2020, Granada, Spain, 10–11 April 2019; Soliman, K.S., Ed.; pp. 4677–4689, ISBN 978-0-9998551-2-6. [Google Scholar]
- US Congress. H.R.1668—Internet of Things Cybersecurity Improvement Act of 2020. Available online: https://www.congress.gov/bill/116th-congress/house-bill/1668/text (accessed on 8 June 2021).
- DCMS. New Cyber Security Laws to Protect Smart Devices amid Pandemic Sales Surge. Available online: https://www.gov.uk/government/news/new-cyber-security-laws-to-protect-smart-devices-amid-pandemic-sales-surge (accessed on 8 June 2021).
- Ponemon Institute. A New Roadmap for Third Party IoT Risk Management the Critical Need to Elevate Accountability, Authority and Engagement. Available online: https://sharedassessments.org/blog/a-new-roadmap-for-third-party-iot-risk-management/ (accessed on 9 June 2021).
- Dillman, D.A.; Tortora, R.; Bowker, D. Principles for Constructing Web Surveys; Washington State University, Social and Economic Sciences Research Center: Pullman, WA, USA, 1999. [Google Scholar]
- NIST. Framework for Improving Critical Infrastructure Cybersecurity Version 1.1. Available online: https://nvlpubs.nist.gov/nistpubs/CSWP/NIST.CSWP.04162018.pdf (accessed on 6 June 2021).
- European Commission. SME Definition. Available online: https://ec.europa.eu/growth/smes/sme-definition_en (accessed on 12 June 2021).
- Reyna, J.; Hanham, J.; Vlachopoulos, P.; Meier, P. Using factor analysis to validate a questionnaire to explore self-regulation in learner-generated digital media (LGDM) assignments in science education. Australas. J. Educ. Technol. 2019, 35, 128–152. [Google Scholar] [CrossRef]
- Momentive. How to Create a Survey. Available online: https://help.surveymonkey.com/articles/en_US/kb/How-to-create-a-survey (accessed on 9 June 2021).
- Irwin, C.W.; Stafford, E.T. Survey Methods for Educators: Collaborative Survey Development; Part 1 of 3; REL 2016–163; US Department of Education, Institute of Education Sciences, National Center for Education Evaluation and Regional Assistance, Regional Educational Laboratory Northeast & Islands: Washington, DC, USA, 2016.
- Frippiat, D.; Marquis, N. Web Surveys in the Social Sciences: An Overview. Population 2010, 65, 285–311. [Google Scholar] [CrossRef]
- Keusch, F. Why do people participate in Web surveys? Applying survey participation theory to Internet survey data collection. Manag. Rev. Q. 2015, 65, 183–216. [Google Scholar] [CrossRef]
- Poon, P.S.; Albaum, G.; Evangelista, F.U. Why People Respond to Surveys. J. Int. Consum. Mark. 2004, 16, 75–90. [Google Scholar] [CrossRef]
- Sánchez-Fernández, J.; Muñoz-Leiva, F.; Montoro-Ríos, F.J. Improving retention rate and response quality in Web-based surveys. Comput. Hum. Behav. 2012, 28, 507–514. [Google Scholar] [CrossRef]
- Combs, J.P.; Onwuegbuzie, A.J. Describing and illustrating data analysis in mixed research. Int. J. Educ. 2010, 2, 1–23. [Google Scholar] [CrossRef] [Green Version]
- Almutairi, O.; Almarhabi, K. Investigation of Smart Home Security and Privacy: Consumer Perception in Saudi Arabia. Int. J. Adv. Comput. Sci. Appl. 2021, 12, 614–622. [Google Scholar] [CrossRef]
- Arm Limited. Bridging the Gap PSA Certified Security Report 2021. How Collaboration will Secure the Future of IoT. Available online: https://report.psacertified.org/ (accessed on 7 June 2021).
- Asplund, M.; Nadjm-Tehrani, S. Attitudes and Perceptions of IoT Security in Critical Societal Services. IEEE Access 2016, 4, 2130–2138. [Google Scholar] [CrossRef]
- Cabinet Office. Consumer Attitudes Towards IoT Security. Available online: https://assets.publishing.service.gov.uk/government/uploads/system/uploads/attachment_data/file/978685/Consumer_Attitudes_Towards_IoT_Security_-_Research_Report.pdf (accessed on 7 June 2021).
- Forescout Technologies. The Enterprise of Things Security Report The State of IoT Security. Available online: https://www.forescout.com/the-enterprise-of-things-security-report-state-of-iot-security-in-2020/ (accessed on 7 June 2021).
- Gemalto. The State of IoT Security. Available online: https://www.infopoint-security.de/media/gemalto-state-of-iot-security-report.pdf (accessed on 7 June 2021).
- IBM. Electronics Industrial IoT Cybersecurity. Available online: https://www.ibm.com/thought-leadership/institute-business-value/report/electronicsiiot (accessed on 7 June 2021).
- Juniper Networks. Securing IoT at Scale Requires a Holistic Approach Survey Insights Revealed by IoT Adopters. Available online: https://www.juniper.net/assets/kr/kr/local/pdf/ebooks/7400082-en.pdf (accessed on 7 June 2021).
- SANS Institute. The 2018 SANS Industrial IoT Security Survey: Shaping IIoT Security Concerns. Available online: https://www.forescout.com/2018-sans-industrial-iot-security-survey/ (accessed on 7 June 2021).
- UL. Security Concerns Escalate as IoT Expands Market Insights on the State of IoT Security. Available online: https://www.ul.com/sites/g/files/qbfpbp251/files/2019-04/security-concerns-escalate-as-iot-expands.pdf (accessed on 7 June 2021).


| Control ID | IoTSRM2 Control | Adjusted Control Weight |
|---|---|---|
| AM.A.1 | IoT hardware assets inventory | 6.25% |
| AM.B.1 | IoT software assets inventory | 6.25% |
| BE.A.1 | Criticality and impact analysis | 6.25% |
| BE.B.1 | Resiliency requirements | 6.25% |
| GV.A.1 | IoT security policy | 2.20% |
| GV.A.2 | Privacy policy | 1.67% |
| GV.A.3 | Vulnerability disclosure policy | 1.23% |
| GV.A.4 | End-of-Life policy | 1.15% |
| GV.B.1 | IoT security governance structures and responsibilities | 3.29% |
| GV.B.2 | IoT security operations roles and responsibilities | 2.96% |
| GV.C.1 | Cybersecurity regulatory framework | 6.25% |
| GV.D.1 | IoT security and privacy controls management plan | 2.14% |
| GV.D.2 | IoT security budget plan | 0.67% |
| GV.D.3 | IoT security measurement and reporting plan | 0.35% |
| GV.D.4 | IoT security training and awareness plan | 0.96% |
| GV.D.5 | IoT security incident response plan | 0.62% |
| GV.D.6 | IoT vulnerability management plan | 0.89% |
| GV.D.7 | IoT End-of-Life plan | 0.63% |
| RA.A.1 | Disclosure-based IoT vulnerability discovery | 1.69% |
| RA.A.2 | Assessment-based IoT vulnerability discovery | 4.56% |
| RA.B.1 | Intelligence-driven IoT threat identification | 1.63% |
| RA.B.2 | Assessment-based IoT threat identification | 4.62% |
| RA.C.1 | IoT risk identification and analysis | 6.25% |
| RA.D.1 | Cybersecurity risk register and IoT risk responses | 6.25% |
| RM.A.1 | IoT security risk appetite and tolerances | 6.25% |
| RM.B.1 | Context-informed IoT security risk tolerances | 6.25% |
| SC.A.1 | IoT supply chain risk management plan | 3.90% |
| SC.A.2 | IoT supply chain risk assessment | 2.35% |
| SC.B.1 | IoT supplier contract management plan | 2.05% |
| SC.B.2 | IoT trustworthiness requirements | 4.20% |
| Question ID | Question | Possible Answers | Justification of Question Inclusion |
|---|---|---|---|
| Q1 | To which organization are you referring when doing this survey? | My organization | The sole purpose of this background question is to enhance our collection of survey responses by targeting two types of survey respondents, namely either those from organizations that adopt IoT technologies or those from organizations that help their client organizations embrace IoT technologies. |
| My client organization | |||
| Q2 | Which of the following best describes your position? | C-level executive and/or board member | This screening question aims to ensure the survey participation only of the organizational leaders that belong to the four target groups of survey respondents provided as possible answers for this question. It is worth noting that “Other senior position” refers to any other senior position of decision-making individuals. |
| Consulting practice leader and/or principal | |||
| High-ranking government official | |||
| Other senior position | |||
| Q3 | What is the category of the organization? | Large Organization | For the purposes of this survey study, the organization type or the organization category is based on the size of the organization, and it can be either a small-medium organization or large organization. Hence, this background question aims to allow a clear delineation between the survey responses related to large organizations and those related to small-medium organizations. It is worth noting that SME denotes an organization having, inter alia, a staff headcount of less than 250 [22]. |
| Small and Medium Sized Enterprise (SME) | |||
| Q4 | In which industry sector does the organization operate? | Education | This background question aims to allow a clear delineation between the survey responses related to the organizations that operate in different industry sectors. |
| Energy & Utilities | |||
| Financial & Insurance Services | |||
| Government | |||
| Healthcare | |||
| Professional Services | |||
| Technology, Media, & Telecom | |||
| Other | |||
| Q5 | In what region is the organization headquartered? | Asia | This background question aims to allow a clear delineation between the survey responses related to the organizations that are headquartered in different regions. |
| Europe, Middle East and Africa (EMEA) | |||
| North/South America | |||
| Oceania |
| Question ID | Question | IoTSRM2 Control ID |
|---|---|---|
| Q6 | Does the organization have a comprehensive situational awareness on all its IoT hardware assets that leverages cybersecurity bills of materials (CBOMs) for all acquired IoT products and integration with its IT asset management processes? | AM.A.1 |
| Q7 | Does the organization have a comprehensive situational awareness on all its IoT software assets that leverages cybersecurity bills of materials (CBOMs) for all acquired IoT products and integration with its IT asset management processes? | AM.B.1 |
| Q8 | Does the organization prioritize all its IoT enabled services (e.g., customer services) and enablers (e.g., IoT components, IoT supply chain) based on their criticality to the organization, using cybersecurity bills of materials (CBOMs) for all acquired IoT products, and leveraging integration with cybersecurity risk management program? | BE.A.1 |
| Q9 | Does the organization keep, as part of its cybersecurity-related plans, up-to-date documented resiliency requirements (i.e., cybersecurity, reliability, continuity, and recovery) for all its mission critical IoT enabled services, and have high confidence in the cyber resilience of its IoT suppliers? | BE.B.1 |
| Q10 | Does the organization keep an up-to-date documented IoT security policy that is aligned with wider cybersecurity policy and formally approved, and contract only IoT suppliers that document and maintain robust cybersecurity policies incorporating IoT security considerations? | GV.A.1 |
| Q11 | Does the organization keep up-to-date documented IoT privacy requirements as part of its privacy policy that is aligned with wider data protection policy and formally approved, and receive privacy supplements from its IoT suppliers for all acquired IoT products and/or services? | GV.A.2 |
| Q12 | Do the organization’s IoT suppliers keep up-to-date vulnerability disclosure policies that are clearly documented, publicly available, aligned with their vulnerability disclosure programs, and well communicated to all stakeholders? | GV.A.3 |
| Q13 | Do the organization’s IoT suppliers keep up-to-date End-of-Life policies that are clearly documented, publicly available, aligned with their product and/or service lifecycle management strategies, and well communicated to all stakeholders? | GV.A.4 |
| Q14 | Does the organization keep up-to-date documented IoT security governance structures and responsibilities across and within the three lines of defense as part of its cybersecurity risk management program, and define shared governance structures and responsibilities for cybersecurity risk management with its IoT suppliers? | GV.B.1 |
| Q15 | Does the organization keep up-to-date documented IoT security operations roles and responsibilities as part of its cybersecurity risk management program, have dialogues on shared responsibility for IoT security with its IoT supplies, and maintain up-to-date points of contact for IoT security incident response and vulnerability disclosure from its IoT suppliers? | GV.B.2 |
| Q16 | Does the organization keep up-to-date documented IoT security and privacy requirements as part of its cybersecurity regulatory framework that is aligned with wider legal and regulatory framework, and work only with IoT suppliers that are aware of IoT security regulatory requirements and are transparent about their compliance with applicable legal and regulatory obligations? | GV.C.1 |
| Q17 | Does the organization keep an up-to-date documented IoT security and privacy controls management plan that is aligned with its cybersecurity risk management program and approved by board committees and/or C-suite executives, and contract only IoT suppliers that maintain robust cybersecurity-related controls frameworks incorporating IoT security requirements? | GV.D.1 |
| Q18 | Does the organization keep an up-to-date documented IoT security budget plan that is aligned with its cybersecurity budget plan and approved by board committees and/or C-suite executives, and contract only IoT suppliers that maintain up-to-date cybersecurity budget plans for secure IoT system development lifecycle? | GV.D.2 |
| Q19 | Does the organization keep an up-to-date documented IoT security measurement and reporting plan that is aligned with its cybersecurity program measurement and reporting and formally approved, and have only IoT suppliers that maintain up-to-date IoT security measurement and reporting plans? | GV.D.3 |
| Q20 | Does the organization keep an up-to-date documented IoT security training and awareness plan that is aligned with its cybersecurity training and awareness program and formally approved, and have only IoT suppliers that maintain up-to-date IoT security training plans and share up-to-date user guides or manuals for all IoT products and/or services they provide? | GV.D.4 |
| Q21 | Does the organization keep an up-to-date documented IoT security incident response plan that is aligned with its cybersecurity incident response plan and formally approved, keep dialogues on shared responsibility for incident response with its IoT suppliers, and contract only IoT suppliers that maintain up-to-date cybersecurity incident response plans which incorporate IoT security considerations? | GV.D.5 |
| Q22 | Does the organization keep an up-to-date documented IoT vulnerability management plan that is aligned with its vulnerability management program and formally approved, and have only IoT suppliers that maintain robust vulnerability management and disclosure plans? | GV.D.6 |
| Q23 | Does the organization keep an up-to-date documented IoT End-of-Life plan that is aligned with its decommissioning strategy and formally approved, and contract only IoT suppliers that maintain robust End-of-Life policies and are transparent about their sunsetting plans? | GV.D.7 |
| Q24 | Does the organization continuously identify and document IoT vulnerabilities from multiple external sources as part of its cybersecurity risk assessment process, and have only IoT suppliers that incentivize third-party vulnerability reporting and release timely security advisories for the IoT products and/or services they provide? | RA.A.1 |
| Q25 | Does the organization continuously or periodically identify and document IoT vulnerabilities using a blend of various assessment processes as part of its cybersecurity risk assessment process, and work only with IoT suppliers that engage in continuous or periodic cybersecurity assessments to achieve ongoing vulnerability monitoring and cybersecurity improvement? | RA.A.2 |
| Q26 | Does the organization continuously identify and document IoT threats from multiple external threat sharing sources as part of its cybersecurity risk assessment process, and work only with IoT suppliers that engage in cyber threat information sharing and leverage effective vulnerability disclosure programs to identify cyber threats to the IoT products and/or services they provide? | RA.B.1 |
| Q27 | Does the organization continuously or periodically identify and document IoT threats using a blend of conventional and cyber kill chain based assessments as part of its cybersecurity risk assessment process, and work only with IoT suppliers that engage in cybersecurity assessments to maintain a robust situational awareness on the cyber threats relevant for the IoT products and/or services they provide? | RA.B.2 |
| Q28 | Does the organization regularly identify and analyze IoT security and privacy risks as part of its cybersecurity risk assessment process, and work only with IoT suppliers that continuously monitor and assess the risks of confidentiality, integrity, availability, and safety of the IoT products and/or services they provide being compromised? | RA.C.1 |
| Q29 | Does the organization have a comprehensive situational awareness on its IoT security and privacy risks that leverages an up-to-date documented cybersecurity risk register which is aligned with the enterprise cybersecurity risk register, and have high confidence in the cybersecurity risk management capabilities of its IoT suppliers? | RA.D.1 |
| Q30 | Does the organization clearly articulate and document IoT security risk appetite and tolerances in line with its appetites and tolerances for cybersecurity and privacy risks, and contract only IoT suppliers that are transparent about their appetites and associated tolerances for cybersecurity, privacy, and IoT security risks? | RM.A.1 |
| Q31 | Does the organization have a comprehensive situational awareness around its role in critical infrastructure and sector risk profile that informs its IoT security risk tolerance statement, and have high confidence that the IoT risk tolerances of its IoT suppliers are context-informed? | RM.B.1 |
| Q32 | Does the organization keep an up-to-date documented IoT supply chain risk management plan that is aligned with its broader cyber supply chain risk management program and formally approved, and contract only IoT suppliers that maintain robust cyber supply chain risk management plans covering their whole IoT supply chains? | SC.A.1 |
| Q33 | Does the organization regularly assess and record IoT supply chain risks across its supply chain tiers based on its IoT supply chain risk management plan, and work only with IoT suppliers that continuously or regularly assess their cybersecurity and privacy supply chain risks and are transparent about their findings? | SC.A.2 |
| Q34 | Does the organization keep an up-to-date documented IoT supplier contract management plan that is aligned with its broader cyber supply chain risk management program and formally approved, and work only with IoT suppliers that maintain robust supplier contract management plans and are transparent about relevant supply chain changes? | SC.B.1 |
| Q35 | Does the organization keep, as part of its IoT supplier contract management plan, up-to-date documented IoT trustworthiness requirements (i.e., cybersecurity, privacy, safety, reliability, and resiliency) for its IoT supplier contracts, and contract only IoT suppliers that deliver up-to-date cybersecurity bills of materials (CBOMs) for the IoT products they provide and have IoT supplier contracts that enable IoT supply chain of trust? | SC.B.2 |
| Possible Answer | Description | Percentage Score |
|---|---|---|
| No, to a great extent | The organization’s current control deviates from the expected IoTSRM2 control with major discrepancies. | 0% |
| No, to a certain extent | The organization’s current control nearly deviates from the expected IoTSRM2 control with some similarities. This current control state varies across surveyed organizations having a tendency towards deviating from the “as-is” IoTSRM2 control, which may average around 25% and considers an additional tolerance of 5% to avoid downgrading the associated percentage score too much. | 30% |
| Yes, to a certain extent | The organization’s current control fairly meets the expected IoTSRM2 control with minor discrepancies. This current control state varies across surveyed organizations having a tendency towards meeting the “as-is” IoTSRM2 control, which may average around 75% and considers a negative tolerance of 5% to avoid favoring the associated percentage score too much. | 70% |
| Yes, to a great extent | The organization’s current control fully meets the expected IoTSRM2 control with no apparent discrepancies. | 100% |
| No. | Principle | Applicability | Justification of Applicability |
|---|---|---|---|
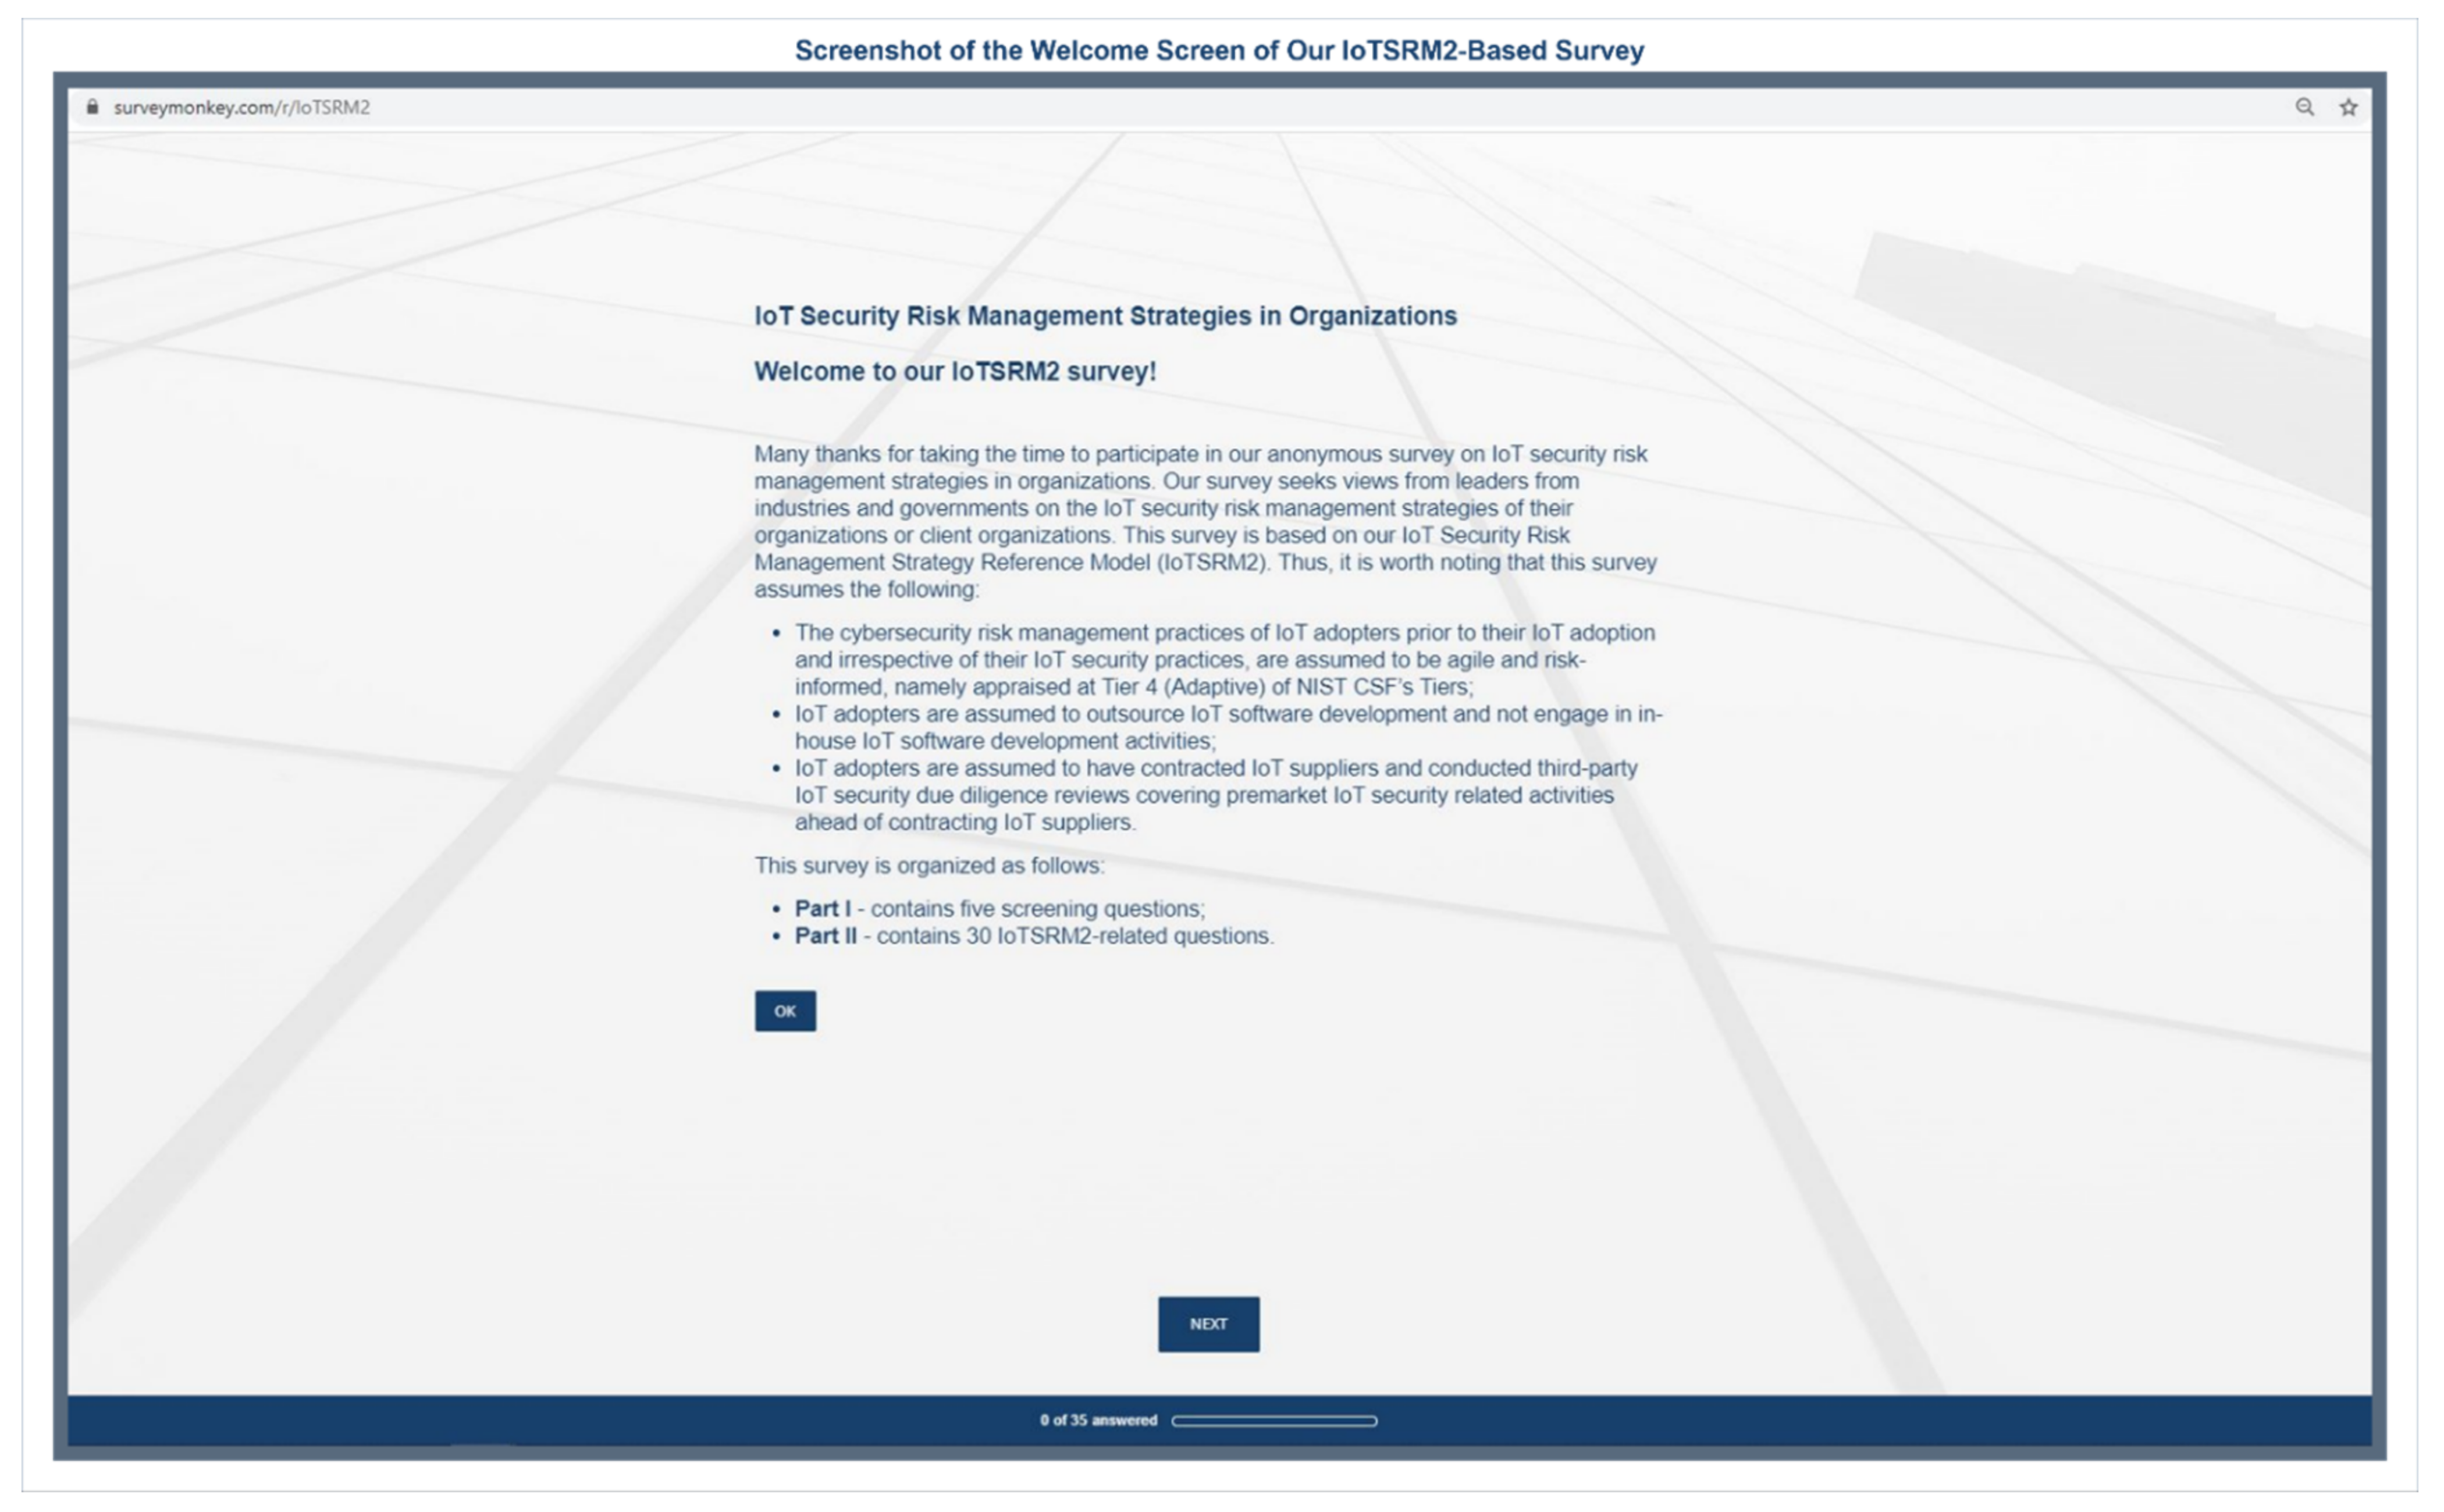
| 1. | “Introduce the web questionnaire with a welcome screen that is motivational, emphasizes the ease of responding, and instructs respondents on the action needed for proceeding to the next page.” [20] | Applicable | Our IoTSRM2-based survey is designed to have a welcome screen. This welcome screen shows the name of our survey, a thank you message to all our survey participants for taking the time to participate in our survey, the purpose of our survey, the assumptions on which the IoTSRM2 is based, along with the structure of our survey. A screenshot of the welcome screen of our IoTSRM2-based survey is provided in Appendix B as part of Figure A1. |
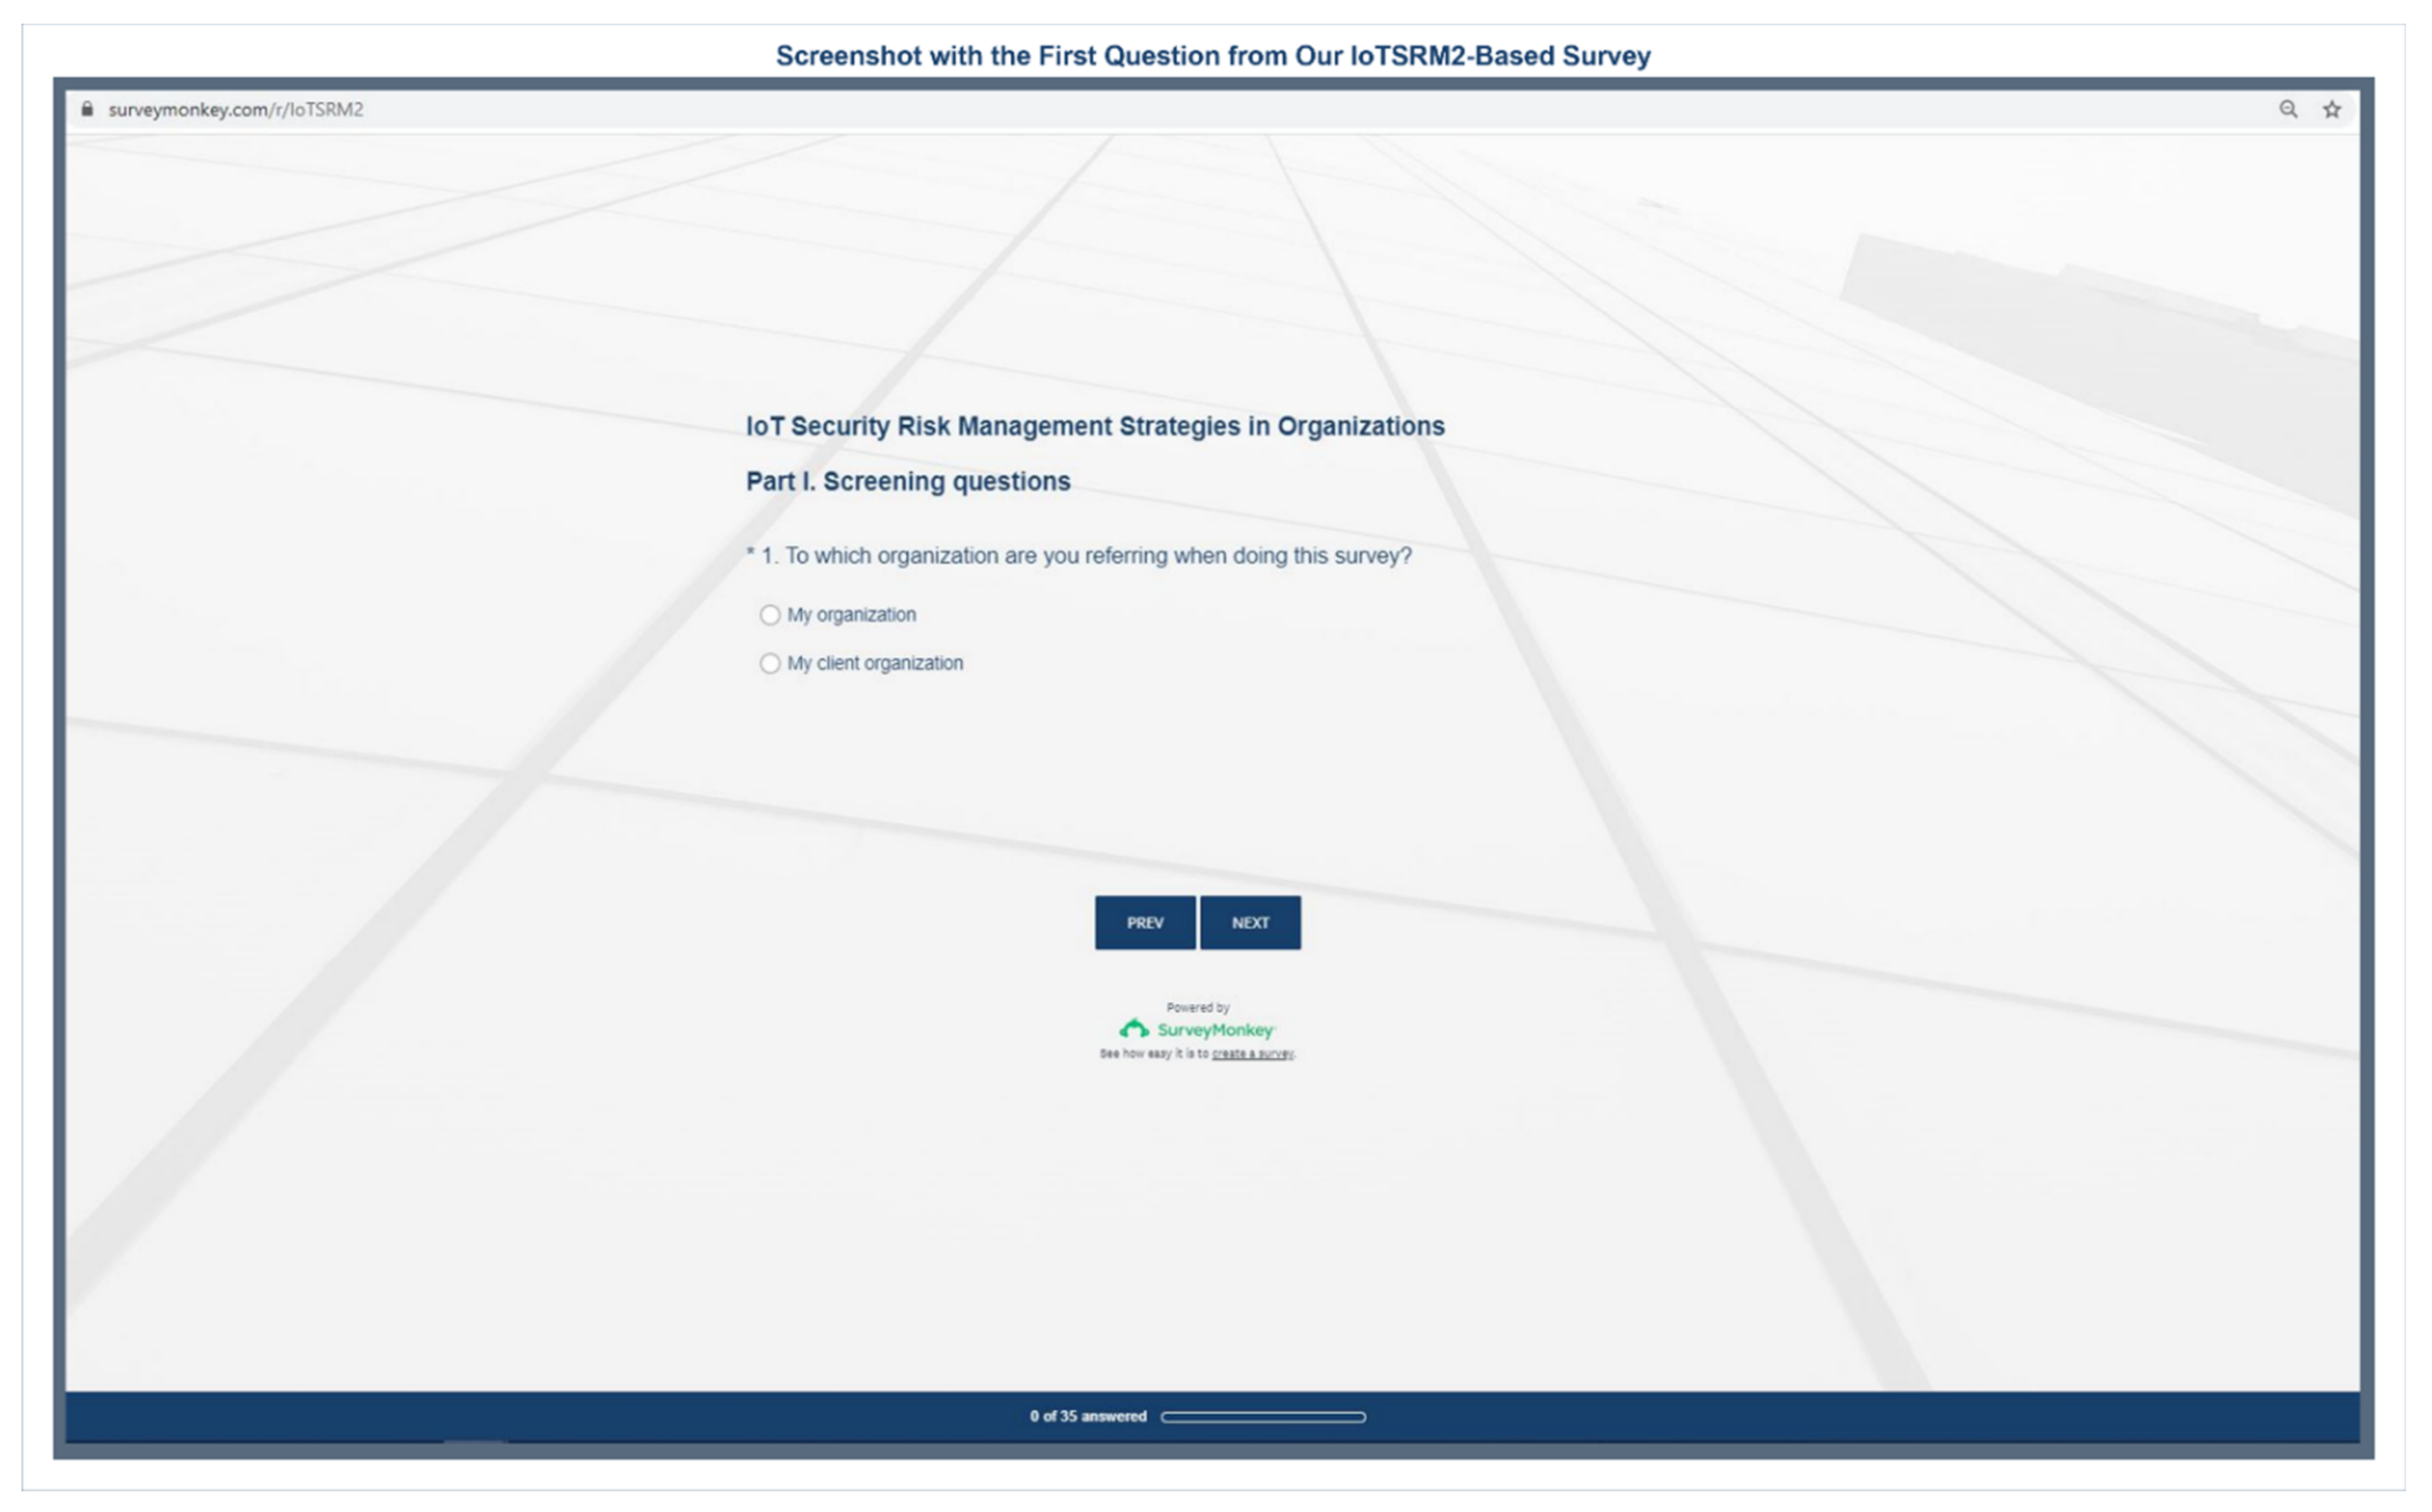
| 2. | “Begin the web questionnaire with a question that is fully visible on the first screen of the questionnaire, and will be easily comprehended and answered by all respondents.” [20] | Applicable | Following the welcome screen, our IoTSRM2-based survey is designed to begin with a single question that asks our survey respondents to select the organization to which they are referring to when undertaking our survey. A screenshot with our first question from our IoTSRM2-based survey is provided in Appendix B as part of Figure A2. |
| 3. | “Present each question in a conventional format similar to that normally used on paper questionnaires.” [20] | Applicable | Our IoTSRM2-based survey is designed to have each question associated with a unique identifier and to have all possible answers for any given question listed vertically underneath that question. |
| 4. | “Limit line length to decrease the likelihood of a long line of prose being allowed to extend across the screen of the respondent’s browser.” [20] | Applicable | Our IoTSRM2-based survey is structured in two parts: the screening and background questions and the IoTSRM2-related questions (see Step I.2). While the screening and background questions are short, the IoTSRM2-related questions are formulated to cover the entire content of the IoTSRM2 controls, which may increase their length. Notwithstanding, our IoTSRM2-based survey aims to leverage a survey platform that allows this principle being met. |
| 5. | “Provide specific instructions on how to take each necessary computer action for responding to the questionnaire.” [20] | Applicable | The welcome screen of our IoTSRM2-based survey is designed to provide sufficient details around the assumptions on which the IoTSRM2 is based and around the structure of our survey. This allows our survey respondents to have visibility on the underlying assumptions of our IoTSRM2 and over the two categories of questions being asked throughout our survey (i.e., the screening and background questions and the IoTSRM2-related questions). In addition, following the first question of the screening and background part, our IoTSRM2-based survey is designed to include a note at the beginning of each page of the questionnaire which is aimed to remind our survey respondents throughout our questionnaire what the word “organization” denotes (i.e., their organization or client organization depending on their answer to the first question of our IoTSRM2-based survey). |
| 6. | “Provide computer operation instructions as part of each question where the action is to be taken, not in a separate section prior to the beginning of the questionnaire.” [20] | Applicable | Our IoTSRM2-based survey is designed to notify our survey respondents, through an error message, about any unanswered questions from any given page before being allowed to move to the next page. In addition, our questionnaire targets only computer literate respondents and is designed to include only closed-ended questions. Thus, there is no other need for computer operation instructions or specific response instructions. |
| 7. | “Do not require respondents to provide an answer to each question before being allowed to answer any subsequent ones.” [20] | Applicable | Our IoTSRM2-based survey is designed to allow our survey respondents to respond to questions in any order within any page of our survey. |
| 8. | “Construct web questionnaires so that they scroll from question to question unless order effects are a major concern, large numbers of questions must be skipped, and/or a mixed-mode survey is being done for which telephone interview and web results will be combined.” [20] | Applicable | Our multipage IoTSRM2-based survey is designed to allow our survey respondents to scroll from question to question within any page of our survey, and the navigation from one page to another is conditioned by the completion of all actions from that page. Moreover, following the first question of the screening and background part, our IoTSRM2-based survey is designed to include a note at the beginning of each page of the questionnaire which reminds our survey respondents what the word “organization” denotes (i.e., their organization or client organization) and encourages them to review their response to question 1 if necessary. |
| 9. | “When the number of answer choices exceeds the number that can be displayed on one screen, consider double-banking with appropriate navigational instructions being added.” [20] | Not applicable | Our IoTSRM2-based survey is designed to display all answer choices on the screen in a visible manner for all questions. |
| 10. | “Use graphical symbols or words that convey a sense of where the respondent is in the completion progress, but avoid ones that require advanced programming.” [20] | Applicable | Our IoTSRM2-based survey is designed to have a progress bar that allow respondents to have visibility on their completion progress. The progress bar can be observed in the screenshot provided in Appendix B as part of Figure A1. |
| 11. | “Be cautious about using question structures that have known measurement problems on paper questionnaires, e.g., check-all-that-apply and open-ended questions.” [20] | Applicable | Our IoTSRM2-based survey is designed to include only closed-ended questions that are measurable (see Step I.2). |
| No. | Selection Criterion | Justification of Inclusion |
|---|---|---|
| 1. | The online survey tool provides features that allow the creation of our online IoTSRM2-based survey following the principles for designing web questionnaires developed by Dillman et al. [20]. | The online survey tool of choice should allow the creation of our online IoTSRM2-based survey based on the web survey design principles developed by Dillman et al. [20], which will make way for a better survey experience for our respondents and a higher response rate. |
| 2. | The online survey tool allows for anonymous responses. | The online survey tool should keep the data of our respondents anonymous to encourage our survey respondents to share their views without being worried of breaching confidentiality and non-disclosure agreements. This may boost the response rate and improve the quality of survey responses. |
| 3. | The online survey tool allows the inclusion of the 35 questions of our questionnaire. | The online survey tool should accommodate the inclusion of our 35-items questionnaire to allow the collection of survey responses to the screening and background questions and to the 30 IoTSRM2-related questions. |
| 4. | The online survey tool provides the feature that allows the creation of mobile friendly surveys. | The online survey tool should have the mobile friendly feature given that our IoTSRM2-based survey is targeting leaders and seniors who are frequently using mobile devices, and our intention is that our IoTSRM2-based survey to be available for both desktop and mobile devices. |
| 5. | The online survey tool provides the feature that allows the export of the survey responses in the Excel file format. | The online survey tool should provide the ability of exporting the survey responses in the Excel file format. This is because the analysis of the survey responses will use the Excel software. |
| 6. | The online survey tool is a well renowned online survey tool. | Running our IoTSRM2-based survey using a widely used online survey tool may increase the likelihood that the target survey respondents respond to our survey. |
| Research Question ID | Research Question | IoTSRM2-Based Survey Question IDs | Potential Analysis Method | Potential Presentation of Results |
|---|---|---|---|---|
| RQ1 | What is the overall tendency of the IoT security risk management strategies of the surveyed organizations to meet or deviate from the IoTSRM2 controls? | Q6–Q35 | For each IoTSRM2 control and related question: % of survey responses of (“Yes, to a certain extent” and “Yes, to a great extent”) compared with % of survey responses of (“No, to a great extent” and “No, to a certain extent”) | Figure showing, for each IoTSRM2 control and related question, the overall tendency of the survey responses towards either deviating from or meeting that IoTSRM2 control. |
| RQ2 | What is the IoTSRM2 compliance score of each of the surveyed organizations? | Q6–Q35 | For each surveyed organization: IoTSRM2 compliance score | Column chart showing, for each surveyed organization, the IoTSRM2 compliance score, corresponding region, and whether this score is less than 50% or greater or equal to 50%. |
| RQ3 | Which is the top organization type for the surveyed organizations by survey respondents? | Q3 | % distribution of the survey responses by organization type | Pie chart showing the % distribution of the responses to our IoTSRM2-based survey by organization type for the surveyed organizations. |
| RQ4.a | Which is the top industry sector for the surveyed organizations by survey respondents? | Q4 | % distribution of the survey responses by industry sector for the surveyed organizations | Pie chart showing the % distribution of the responses by industry sector for the surveyed organizations. |
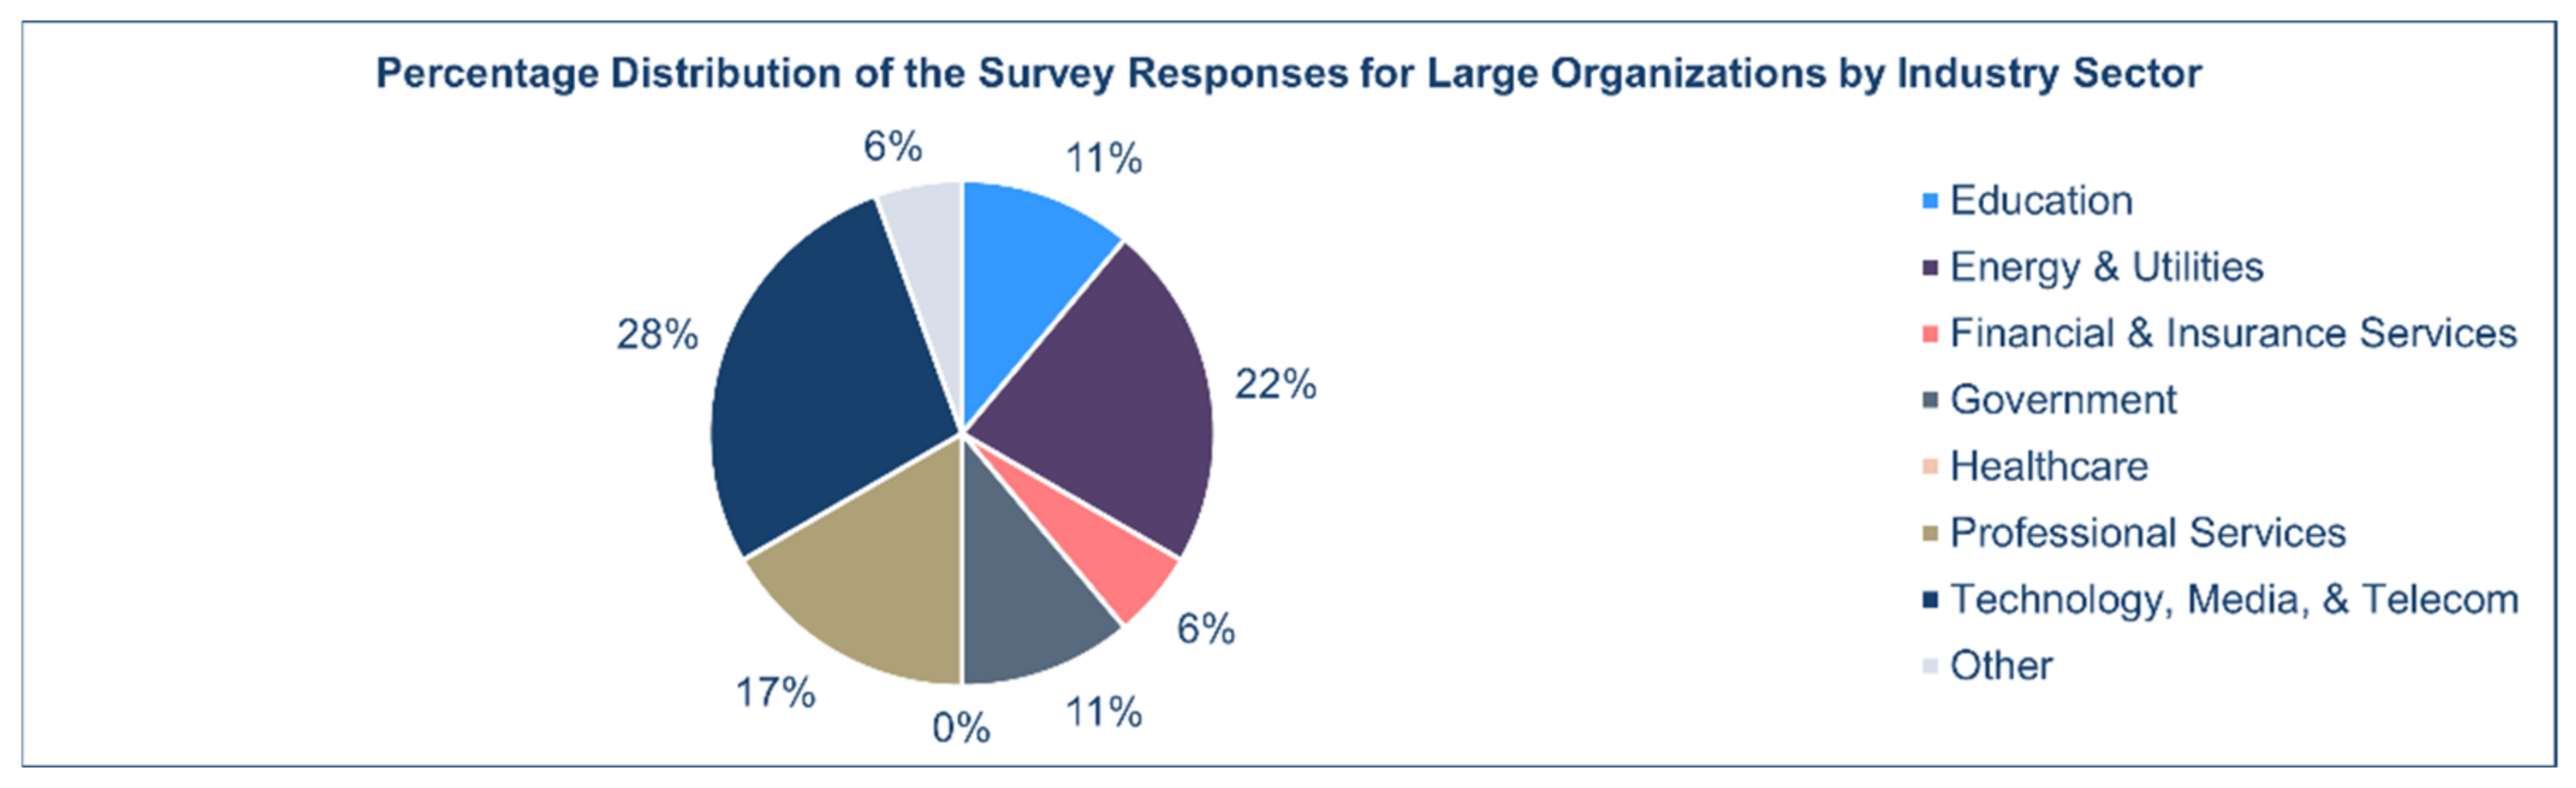
| RQ4.b | Which is the top industry sector for the surveyed organizations of the top organization type by survey respondents? | Q3–Q4 | % distribution of the survey responses by industry sector for the surveyed organizations of the top organization type | Pie chart showing the % distribution of the responses by industry sector for the surveyed organizations of the top organization type. |
| RQ5.a | What is the overall average IoTSRM2 compliance score of the surveyed organizations for each IoTSRM2 control? | Q6–Q35 | For each IoTSRM2 control and related question: overall average compliance score of surveyed organizations with IoTSRM2 controls | Figure showing, for each IoTSRM2 control and related question, the overall average IoTSRM2 compliance score of the surveyed organizations and whether this score is less than 50% or greater or equal to 50%. |
| RQ5.b | What is the overall average IoTSRM2 compliance score of the surveyed organizations of the top organization type for each IoTSRM2 control? | Q6–Q35 | For each IoTSRM2 control and related question: overall average compliance score of surveyed organizations of the top organization type with IoTSRM2 controls | Figure showing, for each IoTSRM2 control and related question, the overall average IoTSRM2 compliance score of the surveyed organizations of the top organization type and whether this score is less than 50% or greater or equal to 50%. |
| RQ5.c | What is the overall average IoTSRM2 compliance score of the surveyed organizations from the top industry sector of the top organization type for each IoTSRM2 control? | Q6–Q35 | For each IoTSRM2 control and related question: Overall average compliance score of surveyed organizations from the top industry sector of the top organization type with IoTSRM2 controls | Figure showing, for each IoTSRM2 control and related question, the overall average IoTSRM2 compliance score of the surveyed organizations from the top industry sector of the top organization type and whether this score is less than 50% or greater or equal to 50%. |
| RQ6.a | Which is the top position level of the survey respondents for the surveyed organizations by survey respondents? | Q2 | % distribution of the survey respondents by position level for the surveyed organizations | Pie chart showing the % distribution of the survey respondents by position level for the surveyed organizations. |
| RQ6.b | Which is the top position level of the survey respondents for the surveyed organizations of the top organization type by survey respondents? | Q2–Q3 | % distribution of the survey respondents by position level for the surveyed organizations of the top organization type | Pie chart showing the % distribution of the survey respondents by position level for the surveyed organizations of the top organization type. |
| RQ6.c | Which is the top position level of the survey respondents for the surveyed organizations from the top industry sector of the top organization type by survey respondents? | Q2–Q4 | % distribution of the survey respondents by position level for the surveyed organizations from the top industry sector of the top organization type | Pie chart showing the % distribution of the survey respondents by position level for the surveyed organizations from the top industry sector of the top organization type. |
| RQ7.a | Which is the top region for the surveyed organizations by survey respondents? | Q5 | % distribution of the survey responses by region for the surveyed organizations | Pie chart showing the % distribution of the survey responses by region for the surveyed organizations. |
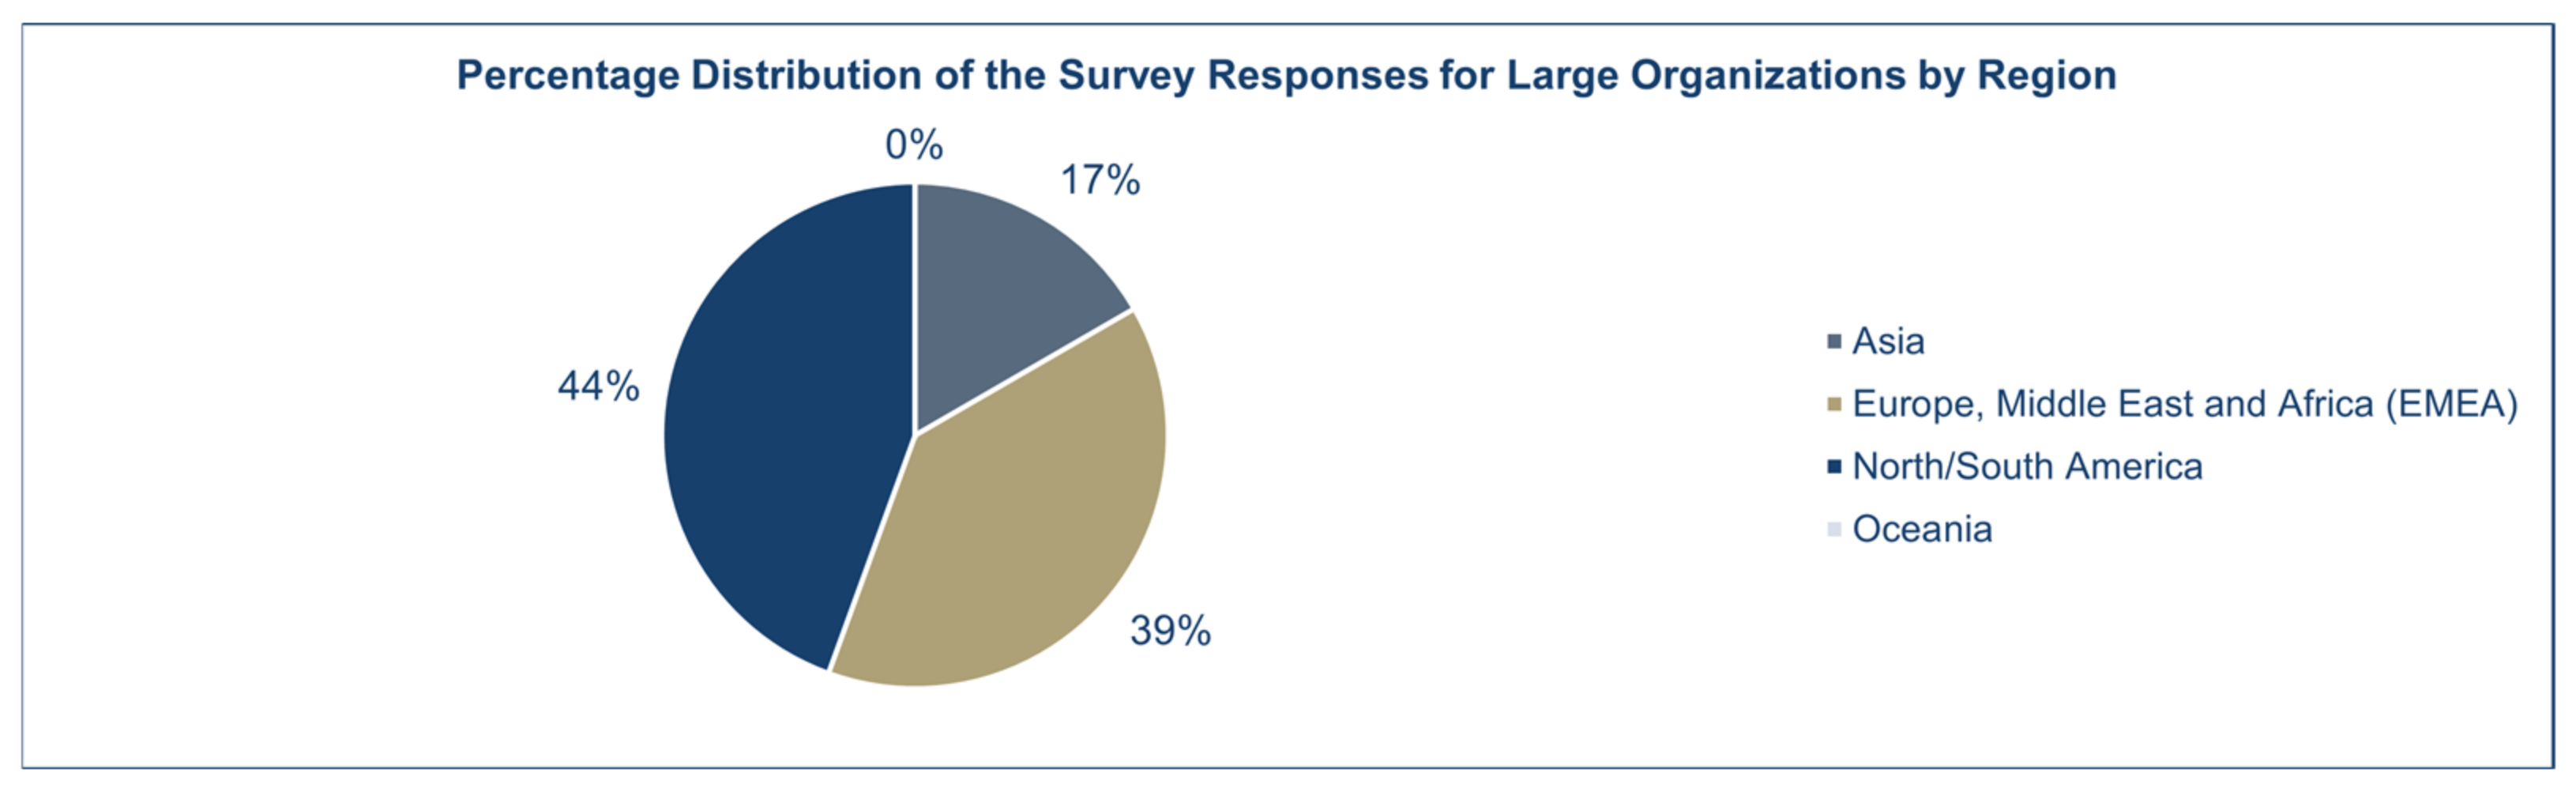
| RQ7.b | Which is the top region for the surveyed organizations of the top organization type by survey respondents? | Q3, Q5 | % distribution of the survey responses by region for the surveyed organizations of the top organization type | Pie chart showing the % distribution of the survey responses by region for the surveyed organizations of the top organization type. |
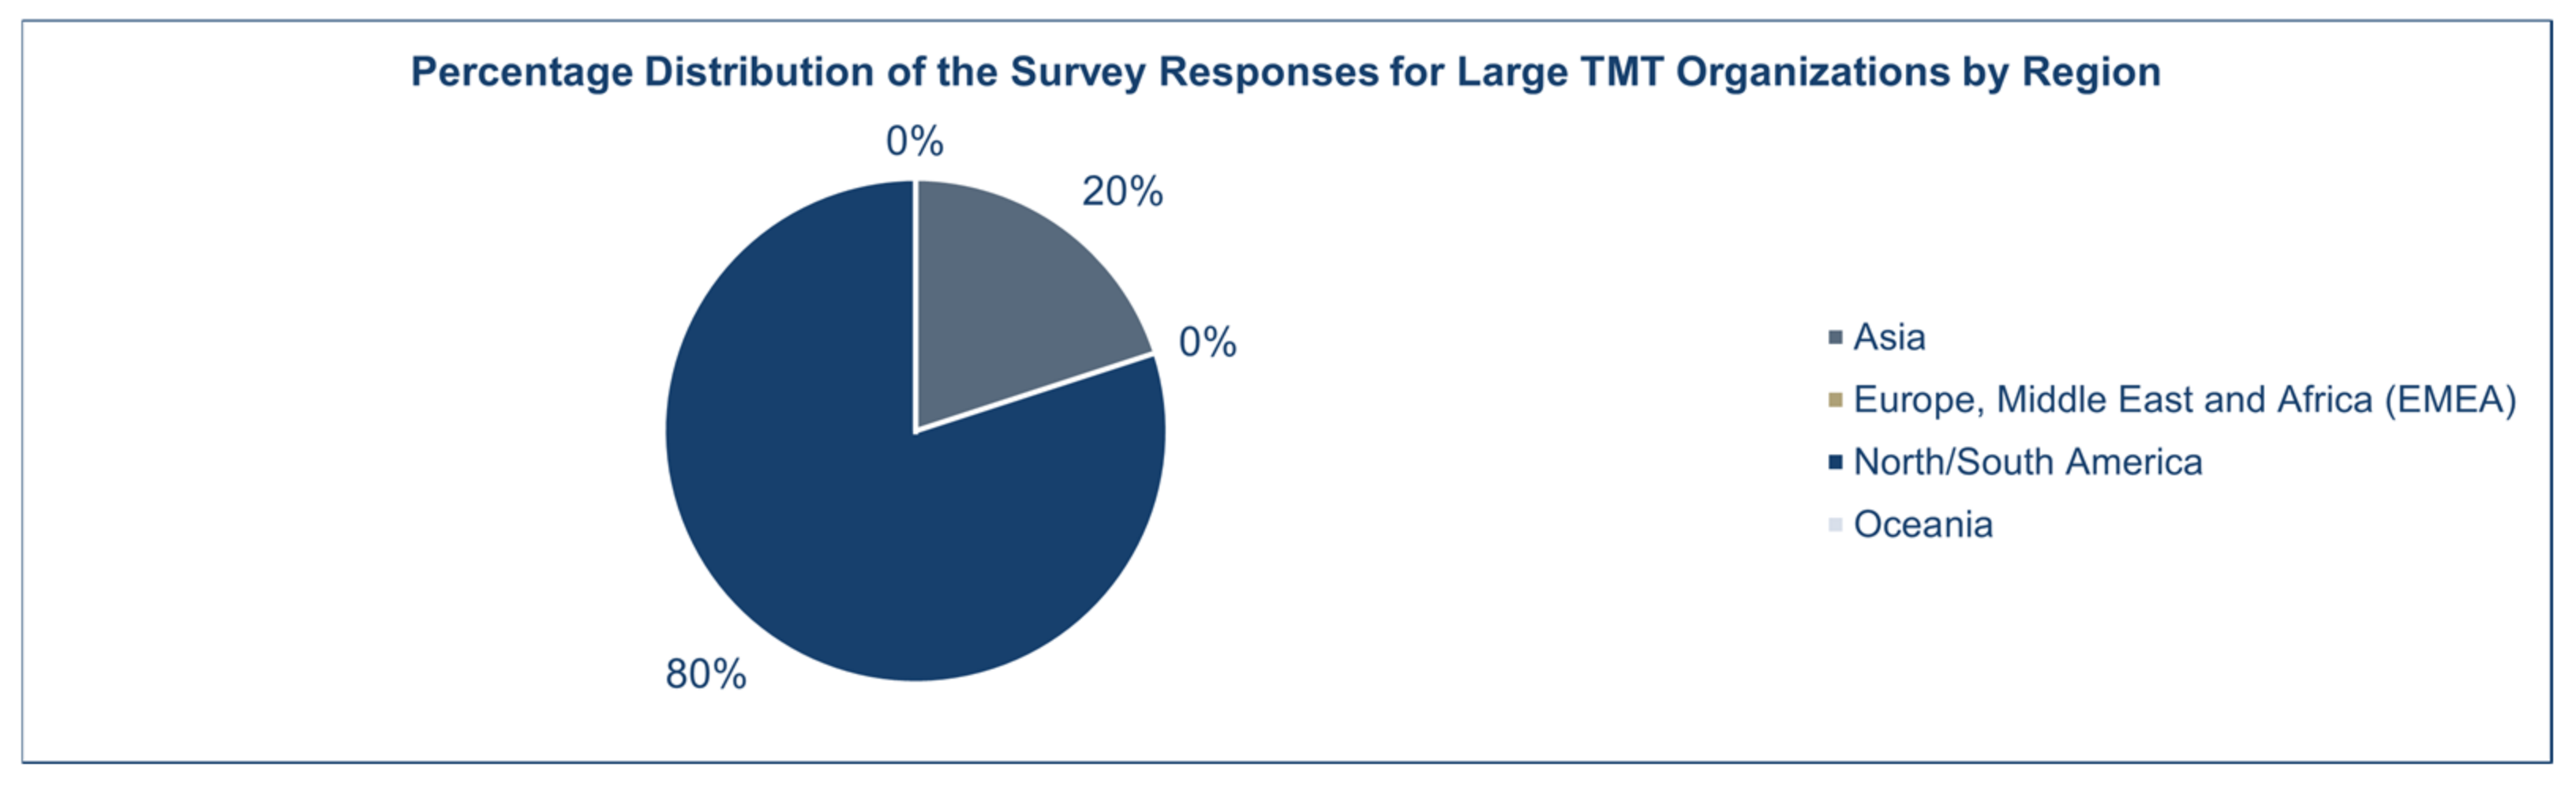
| RQ7.c | Which is the top region for the surveyed organizations from the top industry sector of the top organization type by survey respondents? | Q3–Q5 | % distribution of the survey responses by region for the surveyed organizations from the top industry sector of the top organization type | Pie chart showing the % distribution of the survey responses by region for the surveyed organizations from the top industry sector of the top organization type. |
| Sampling Frame | Survey Returns | Discarded Surveys | Final Sample | Survey Response Rate |
|---|---|---|---|---|
| 1502 1 | 63 | 32 | 31 | 2.1% |
| No. | Author/Publisher | Title | Reference |
|---|---|---|---|
| 1. | Palo Alto Networks | 2020 Unit 42 IoT Threat Report | [15] |
| 2. | The Ponemon Institute | A New Roadmap for Third Party IoT Risk Management the Critical Need to Elevate Accountability, Authority and Engagement | [19] |
| 3. | Almutairi and Almarhabi | Investigation of Smart Home Security and Privacy: Consumer Perception in Saudi Arabia | [31] |
| 4. | Arm Limited | Bridging the Gap PSA Certified Security Report 2021 How collaboration will secure the future of IoT | [32] |
| 5. | Asplund and Nadjm-Tehrani | Attitudes and Perceptions of IoT Security in Critical Societal Services | [33] |
| 6. | The Cabinet Office | Consumer Attitudes Towards IoT Security | [34] |
| 7. | Forescout Technologies | The Enterprise of Things Security Report the State of IoT Security | [35] |
| 8. | Gemalto | The State of IoT Security | [36] |
| 9. | IBM | Electronics Industrial IoT cybersecurity | [37] |
| 10. | Juniper Networks | Securing IoT at Scale Requires a Holistic Approach Survey Insights Revealed by IoT Adopters | [38] |
| 11. | The SANS Institute | The 2018 SANS Industrial IoT Security Survey: Shaping IIoT Security Concerns | [39] |
| 12. | UL | Security concerns escalate as IoT expands Market insights on the state of IoT security | [40] |
| Evaluation Criterion | Extent of Applicability | ||
|---|---|---|---|
| The Evaluation Criterion Fully Applies | The Evaluation Criterion Applies to a Certain Extent | The “as-Is” Evaluation Criterion Does Not Apply | |
| E1: The research study is focused on determining the current state of IoT security risk management strategies in organizations | Our IoTSRM2-based survey study | [15,19,31,32,33,34,35,36,37,38,39,40] | None of these related works |
| E2: The methodology for achieving the intended purpose of the research study is clearly described | [35], Our IoTSRM2-based survey study | [15,31,32,33,34] | [19,36,37,38,39,40] |
| E3: The underlying design best practice of the research method of the methodology is clearly documented | Our IoTSRM2-based survey study | [33] | [15,19,31,32,34,35,36,37,38,39,40] |
| E4: Provides results for organizations of a specific organization size | [32,36,39], Our IoTSRM2-based survey study | None of these related works | [15,19,31,33,34,35,37,38,40] |
| E5: Provides results for organizations from a specific industry sector | [15,35,37,40], Our IoTSRM2-based survey study | None of these related works | [19,31,32,33,34,36,38,39] |
| E6: The results reveal the level of compliance of each subject with a reference model | Our IoTSRM2-based survey study | [39] | [15,19,31,32,33,34,35,36,37,38,40] |
| E7: The findings resemble the results of our IoTSRM2-based survey | Our IoTSRM2-based survey study | [15,19,32,36,37,38,39,40] | [31,33,34,35] |
Publisher’s Note: MDPI stays neutral with regard to jurisdictional claims in published maps and institutional affiliations. |
© 2021 by the authors. Licensee MDPI, Basel, Switzerland. This article is an open access article distributed under the terms and conditions of the Creative Commons Attribution (CC BY) license (https://creativecommons.org/licenses/by/4.0/).
Share and Cite
Popescu, T.M.; Popescu, A.M.; Prostean, G. Leaders’ Perspectives on IoT Security Risk Management Strategies in Surveyed Organizations Relative to IoTSRM2. Appl. Sci. 2021, 11, 9206. https://doi.org/10.3390/app11199206
Popescu TM, Popescu AM, Prostean G. Leaders’ Perspectives on IoT Security Risk Management Strategies in Surveyed Organizations Relative to IoTSRM2. Applied Sciences. 2021; 11(19):9206. https://doi.org/10.3390/app11199206
Chicago/Turabian StylePopescu, Traian Mihai, Alina Madalina Popescu, and Gabriela Prostean. 2021. "Leaders’ Perspectives on IoT Security Risk Management Strategies in Surveyed Organizations Relative to IoTSRM2" Applied Sciences 11, no. 19: 9206. https://doi.org/10.3390/app11199206
APA StylePopescu, T. M., Popescu, A. M., & Prostean, G. (2021). Leaders’ Perspectives on IoT Security Risk Management Strategies in Surveyed Organizations Relative to IoTSRM2. Applied Sciences, 11(19), 9206. https://doi.org/10.3390/app11199206