Article

Photocatalytic Phenol Degradation by Silica-Modified Titanium Dioxide

by
Diana Rakhmawaty Eddy
1,*,
Soraya Nur Ishmah
1,
Muhamad Diki Permana
1,
M. Lutfi Firdaus
2,*,
Iman Rahayu
1,
Yaser A. El-Badry
3,
Enas E. Hussein
4 and
Zeinhom M. El-Bahy
5
1
Department of Chemistry, Faculty of Mathematics and Sciences, Universitas Padjadjaran, Jl. Raya Bandung-Sumedang km. 21 Jatinangor, Sumedang 45363, Indonesia
2
Graduate School of Science Education, Bengkulu University, Jl. W.R. Supratman Kandang Limun, Bengkulu 38371, Indonesia
3
Chemistry Department, Faculty of Science, Taif University, Khurma, P.O. Box 11099, Taif 21944, Saudi Arabia
4
National Water Research Center, Cairo 13411, Egypt
5
Department of Chemistry, Faculty of Science, Al-Azhar University, Cairo 11884, Egypt
*
Authors to whom correspondence should be addressed.
Appl. Sci. 2021, 11(19), 9033; https://doi.org/10.3390/app11199033
Submission received: 17 August 2021 / Revised: 9 September 2021 / Accepted: 15 September 2021 / Published: 28 September 2021
(This article belongs to the Special Issue Anatase Chemistry, Nanostructures and Functionalities‎)

Abstract

:
Titanium dioxide (TiO2) has been widely applied as a photocatalyst for wastewater treatment due to its high photocatalytic activity and it can remove various harmful organic pollutants effectively. Under heated system, however, TiO2 is prone to agglomeration that decrease its abilities as a photocatalyst. In order to overcome the agglomeration and increase its thermal resistance, addition of silica (SiO2) as supporting material is proposed in this research. Silica or silicon dioxide can be extracted from natural resources such as beach sand. Here, we report the application of a composite photocatalyst of TiO2/SiO2 to remove phenolic compounds in wastewater. The photocatalyst was synthesized by adding SiO2 from beach sand onto TiO2 through impregnation methods. The results of the X-ray diffraction (XRD) showed that TiO2 was present in the anatase phase. The highest crystallinity was obtained by TiO2/SiO2 ratios of 7:1. SEM results showed that the shape of the particles was spherical. Further characterizations were conducted using Fourier-transform infrared spectroscopy (FTIR), Brunauer–Emmett–Teller (BET) analysis, and a particle size analyzer (PSA). By using the optimized condition, 96.05% phenol was degraded by the synthesized photocatalyst of TiO2/SiO2, under UV irradiation for 120 min. The efficiency of the TiO2/SiO2 is 3.5 times better than commercial TiO2 P25 for the Langmuir–Hinshelwood first-order kinetic model.

1. Introduction

Phenolic compounds and their derivatives have been used as raw materials in various manufacturing and petrochemical industries [1]. Phenols contained in industrial waste products are considered to be the main source of pollution to the environment and are known to have low visibility and high stability. Like the majority of other organic substances used in industries, phenol is a carcinogenic compound that poses a high risk to human health and also damages aquatic ecosystems, even at low concentrations [2]. Furthermore, as a non-biodegradable pollutant, it tends to accumulate in an organism [3] and also forms different aromatic intermediates that are toxic, and thus makes it a serious threat [4].
Numerous techniques, including adsorption, precipitation, cross-flow microfiltration, electrodialysis, and reverse osmosis, have been used to actively investigate the removal of phenol from the environment. However, these methods are quite expensive and often inefficient at low concentrations. Therefore, a photocatalytic method was developed to serve as an alternative, using semiconductor materials with the potential for pollutant reduction. Photocatalysis is a process of accelerating reactions that is assisted by energy from light irradiation and a solid catalyst that is generally a semiconductor [5]. Semiconductor materials that have been used in photocatalysts for the degradation of organic pollutants in water include SnOx [6], ZnO [7], and TiO2 [4].
Titanium dioxide (TiO2) is a semiconductor often used as a photocatalyst during wastewater purification. This compound is readily available and possesses various desirable properties, including high photocatalytic activity, oxidizing power, and chemical stability in acidic or alkaline conditions [8]. However, the single photoactivity of TiO2 has the disadvantage of a low specific surface area and the occurrence of hole (h+)/electron (e) recombination, thus limiting the catalytic efficiency [9,10]. Therefore, in previous studies, TiO2 has been composited with various materials, such as carbon [11], WO3 [12], Bi2O3 [13], and SiO2 [14]. SiO2 was chosen as a composite for TiO2 because it can increase the photocatalytic activity, thermal stability, mechanical strength, and active surface area [8]. In addition, SiO2 can also stabilize the irreversible metastable progression from anatase to the rutile phase at 600–1100 °C and facilitate the transfer of TiO2 to the adsorbed molecule by increasing the electron oxidation capability [15,16].
In addition, it may be synthesized using a variety of methods, which includes solvothermal [17,18], sol-gel [15,17], impregnation [19,20], and microwave radiation [21]. In our previous study [22], the synthesis of this composite photocatalysts was carried out using the solvothermal method, which was applied to reduce the concentration of inorganic waste, specifically a solution of Cr(VI) and Pb(II) metal ions. The results showed a fairly good percentage reduction of 93.77% and 93.55% for Cr(VI) and Pb(II), respectively. Furthermore, the silica successfully extracted from Bengkulu beach sand, Indonesia, using a potassium hydroxide (KOH) solvent, reached 90%, with a purity of 99.5% [23], while using a sodium hydroxide (NaOH) solvent, the purity was 97.3% [24]; the purity of silica obtained from Palangkaraya beach sand, Indonesia, was 91.19% [19].
In this study, we synthesized TiO2 and composited it with natural silica. The crystal of TiO2 (P25 Degussa) is a standard material for photocatalytic reactions and was used as a precursor of TiO2. In addition, the SiO2 source used was natural silica extracted from the Bengkulu beach [24]. TiO2 and SiO2 were composited using the impregnation method, different from the previous literature [22], and which used the solvothermal method. The physical properties of the TiO2/SiO2 composites were investigated by XRD, FTIR, SEM, BET analysis, PSA, and UV-vis spectroscopy. We also determined the effect of the amount of ratio of TiO2 that was composited with SiO2 on the physical properties of the TiO2/SiO2 composites. Apart from that, its photocatalytic activity on phenol decomposition was also investigated.

2. Materials and Methods

2.1. Materials

The materials used in this study includes ethanol p.a. (C2H5OH, 99.5%, Merck, Kenilworth, NJ, USA), phenol p.a. (C6H5OH, ACS, Reag. Ph Eur, Merck, Kenilworth, NJ, USA), silicon dioxide (SiO2, extracted from beach sand [16] with a purity of 97.3%), and titanium dioxide (TiO2, P25 Degussa, Merck, Kenilworth, NJ, USA).

2.2. Synthesis of TiO2/SiO2 Composite Photocatalyst

This synthesis was performed in three separate TiO2:SiO2 mole ratios (1:1, 3:1, and 7:1) through the impregnation method [19,22]. To prepare a composite with a mole ratio of 1:1, 1.3258 g of TiO2 P25 Degussa was mixed with 80 mL of ethanol and subjected to sonication for 30 min. Subsequently, 1 g of SiO2 was added, and the mixture was sonicated for another 30 min. The resulting mixture was stirred while heated on a hot plate until a paste was formed. This was followed by oven drying at 100 °C for 2 h, and subsequent calcination at 500 °C for 5 h.
This procedure was also repeated for mole ratios of 3:1 and 7:1, using 1.9940 g of TiO2 P25 Degussa was dispersed in 80 mL ethanol plus 0.5 g of SiO2, and 2.3263 g TiO2 P25 Degussa, dispersed in 80 mL ethanol plus 0.25 g of SiO2, respectively [17,19].

2.3. Characterization of the Catalyst

In order to find out the phase composition and the unit cell parameters, the catalysts were characterized through X-ray diffraction (XRD) analysis. XRD patterns were obtained on a Rigaku/MiniFlex 600, and the XRD measurements were carried out at room temperature with Cu Kα radiation (λ = 1.5418 Å). The scan ranged from 20 to 80 (2θ). The powders crystal structure was refined using the Rietveld method and the refinements were carried out using HighScore Plus software (PANalytical 3.0.5) [25]. Scale-factors, zero-shift, and 6 coefficients of the shifted polynomial function were adopted to fit the background. Crystallite size was determined using the Debye–Scherrer equation [20]:
B = Kλ/Dcos θ,
where D is the crystal size, K is the Scherrer constant (0.89), λ is the wavelength of the X-ray radiation, B is the value of the peak full width at half maximum (FWHM), and θ is the diffraction angle. Then the crystallinity was calculated by comparing the crystalline peak (Ic) with the total peak (crystalline peak (Ic) and amorphous peak (Ia)).
Crystallinity (%) = Ic/(Ic + Ia) × 100%.
The synthesized TiO2/SiO2 composite photocatalyst was further characterized using Fourier-transform infrared spectroscopy (FTIR), PerkinElmer Spectrum100 Massachusetts, United States, to find out the possible occurrence of OH groups and Ti-O-Si bonds. FTIR was used with scanning range from 400–4000 cm−1. The morphology and size of particles were carried out with scanning electron microscopy (SEM), Hitachi SU3500 Tokyo, Japan and particle size analyzer (PSA), Horiba SZ-100 Kyoto, Japan. The bandgap of the sample was determined using UV-vis spectrophotometer, Jasco V- 550, Tokyo, Japan, with a scan range of 200–800 nm. The nitrogen adsorption–desorption isotherm was carried out to determine the surface area (Quantachrome NOVA 2200e) at 77.3 K. The specific surface area of the sample was calculated by the Brunauer–Emmett–Teller (BET) method.

2.4. Photocatalytic Activity Test

Photocatalytic activity test of the TiO2 P25 Degussa and TiO2/SiO2 composites was carried out on phenol and evaluated using reverse-phase high-performance liquid chromatography (HPLC, Jasco Co-2065Plus, Tokyo, Japan), with a UV detector (Jasco UV-2075Plus, Tokyo, Japan) and a C-18 column or octadecyl silica (ODS) as the stationary phase and a mixture of distilled water, methanol, and acetonitrile as the mobile phase. For the photocatalytic test of the TiO2/SiO2 composites, phenol solutions were made with a concentration of 20 mg.L−1 and a solution pH of 7.35. A total of 75 mg of this composite with a variation of TiO2/SiO2 1:1 was added to 50 mL of 20 mg.L−1 phenol solution in the photoreactor. Furthermore, the phenol solution was stirred without irradiation for 60 min to achieve equilibrium. Subsequently, the solution was irradiated using a 300 W Xe lamp, UV ray with a wavelength <390 nm (PE300BUV, Waltham, MA, United States) at a distance of 150 mm above the surface of the solution, with an irradiated area of 26 cm2 (approximately 20 mW/cm2) for 120 min, while being stirred over a magnetic stirrer. A total of 0.5 mL was taken at 30-min intervals using a membrane syringe and the concentration was measured using the HPLC device. The same treatment was carried out for TiO2/SiO2 3:1 variation; TiO2/SiO2 7:1, and TiO2 P25 Degussa [26].

3. Results

3.1. Characterization of Catalyst TiO2/SiO2 Composite Structure

The structure and phase of the TiO2 and TiO2/SiO2 composites was observed from the diffraction patterns shown in Figure 1. These patterns showed the diffraction patterns of TiO2 P25 Degussa and composites of TiO2/SiO2. The standard atomic parameters of anatase TiO2 (tetragonal, space group I41/amd) were taken from the Inorganic Crystal Structure Database (ICSD) 98-004-4882 [27] and ICSD 98-008-2085 for rutile structures (tetragonal, space group P42/mnm) [28]. The crystal of the TiO
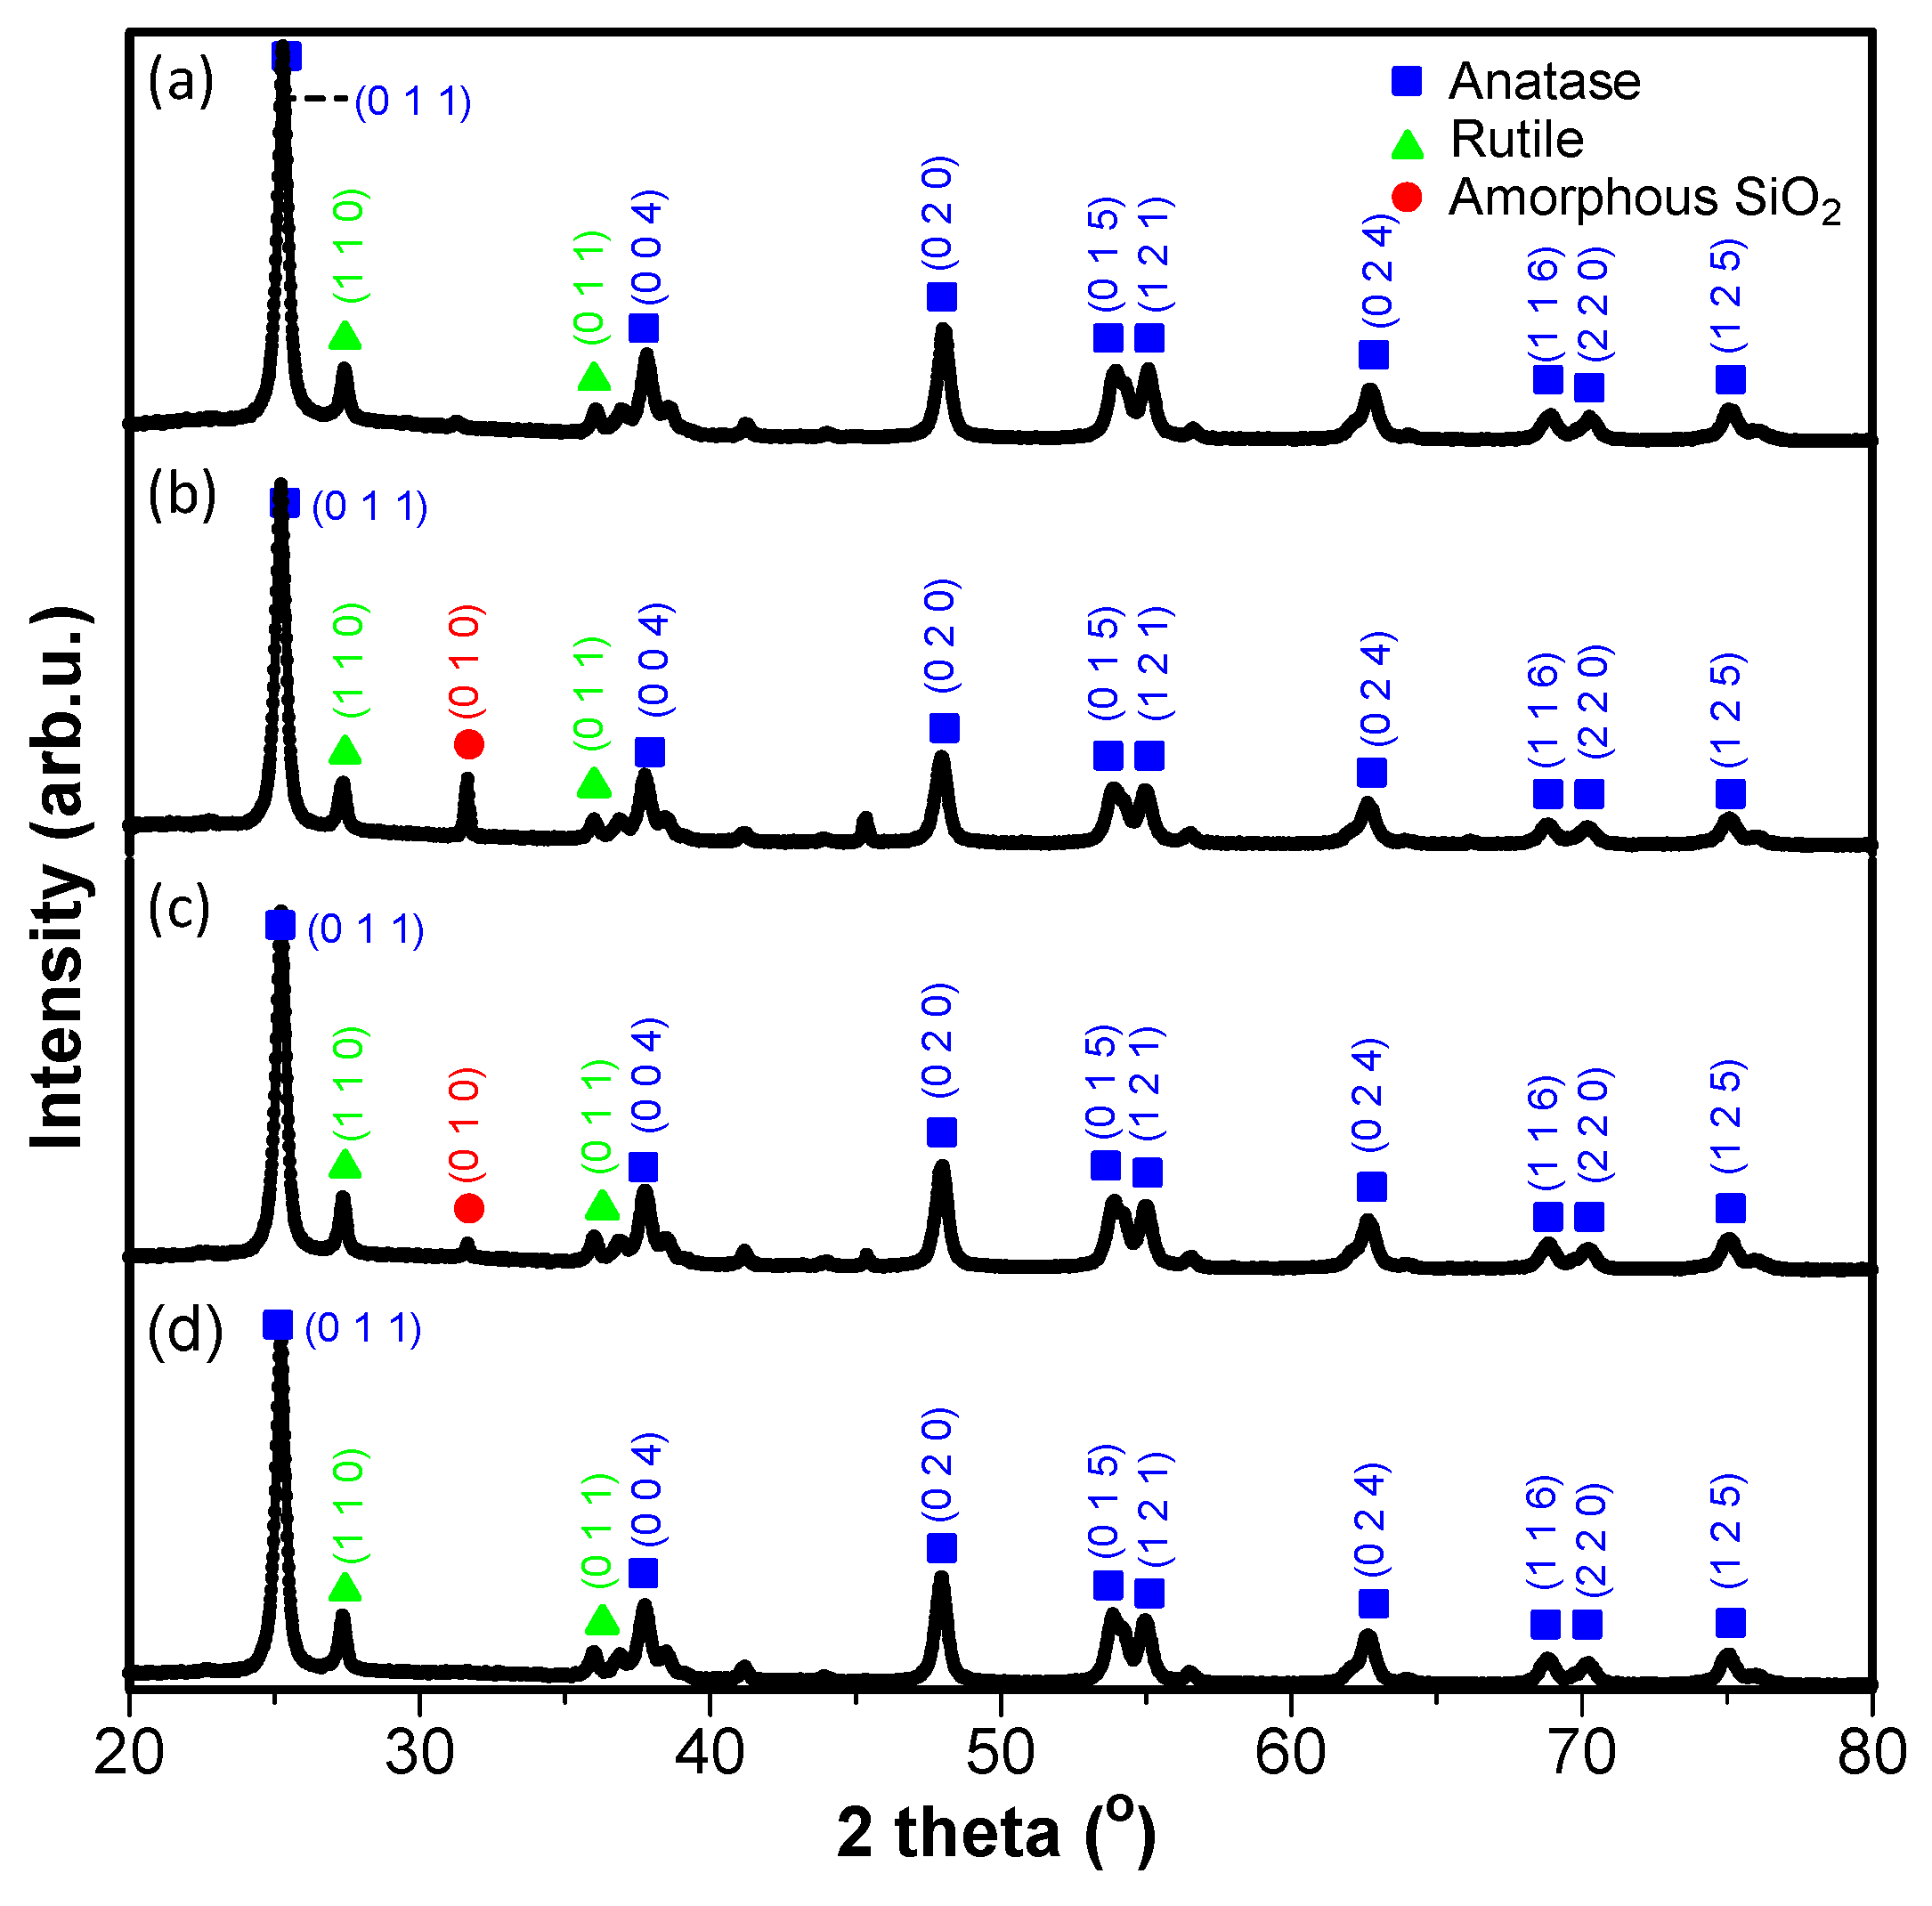
2 P25 Degussa showed the highest peak pattern at 2θ = 25.25° and several other distinctive peaks, specifically at 2θ = 37.80° and 47.89° and twin peaks at 53.90° and 55.91°, which are regions of anatase type TiO2 crystal characteristics. All TiO2/SiO2 composite diffractograms showed very similar peaks, the difference being the intensity and widening at certain peaks. Figure 1 shows that the composite composition affected the peak intensity and the sharpness of the resulting peak and that a large amount of SiO2 caused a decrease in peak intensity and a band widening leading to reduced crystallinity (Table 1). These results are confirmed from a previous study reported by Pinho and Mosquera [29]. Another reason for the reduced peak intensity is that possibly the inter lattice between Ti, O, and Si was formed during the synthesis process [30]. This result can be seen with the appearance of a new peak at 2θ = 31.68°. The FTIR technique was used to confirm the presence of these Ti–O–Si bonds, which will be discussed later.
Phase percentages showed in Table 1 were obtained using Rietveld refinement (Figures S1–S4) of the XRD patterns in the composite showing the percentages of anatase and rutile phase. From the data in Table 1, it is observed that TiO2/SiO2 1:1 has the highest anatase phase followed by TiO2/SiO2 3:1 and TiO2/SiO2 7:1. The composite of TiO2/SiO2 1:1 has the smallest rutile percentage; this indicates that the presence of SiO2 will inhibit the formation of the rutile phase from anatase [14,31].
Furthermore, materials with an amorphous phase showed a wide band when analyzed using XRD due to the irregular arrangement; that is, this material was rigid and does not have a certain geometric shape. SiO2 with its surface amorphous phase had more defects that interacted with the contaminants; meanwhile in the crystalline SiO2, the structure was regular and the bond was more stable, which made it less capable of adsorption and easier desorption [25]. In addition, the amorphous SiO2 structure affected the TiO2 structure in the composite, which resulted in a decrease in intensity and a widening at the peak, indicating that the crystallinity of TiO2 decreased. The TiO2/SiO2 1:1 composite showed the lowest crystallinity value due to the effect of the most addition of SiO2, while TiO2/SiO2 7:1 had the higher crystallinity (Table 2). High crystallinity promoted a charge transfer from the center to the surface of the photocatalyst, which increased the photocatalytic activity [32].
The crystallite size is calculated based on the Scherrer equation. The calculated crystallite size is the average of each phase peak in the XRD pattern and is calculated with the standard deviation. Table 2 shows that the presence of SiO2 can reduce the crystallite size. The largest crystallite size was found in the TiO2/SiO2 7:1 composite with anatase 16.28 ± 2.30 and rutile 26.06 ± 2.52. The size of this crystallite decreases with the amount of SiO2. It can be understood that the more SiO2 is added, the more defects and the amorphous phase will increase [29,31,33]. As a result, the crystallinity is getting smaller, which causes the peak of the XRD pattern to widen. With the widening of the XRD peak, the full width at half maximum (FWHM) value will be larger and the calculated crystal size will be smaller.
The sample unit cell parameters and Rietveld refinement parameters are reported in Table 3. The Rietveld refinement plot is depicted in Figures S1–S4. From the table, it is known that the presence of SiO2 caused a slight change in the anatase and rutile unit cells. From this value, it can be seen that SiO2 will enlarge the unit cell of anatase and rutile. This trend is clearly seen by the presence of the largest unit cell, namely, in the TiO2/SiO2 1:1 composite with an anatase volume of 136.4306 Å3 and rutile volume of 62.4995 Å3. This volume decreases as the amount of SiO2 decreases, and the smallest is found in TiO2 P25 without SiO2 added.
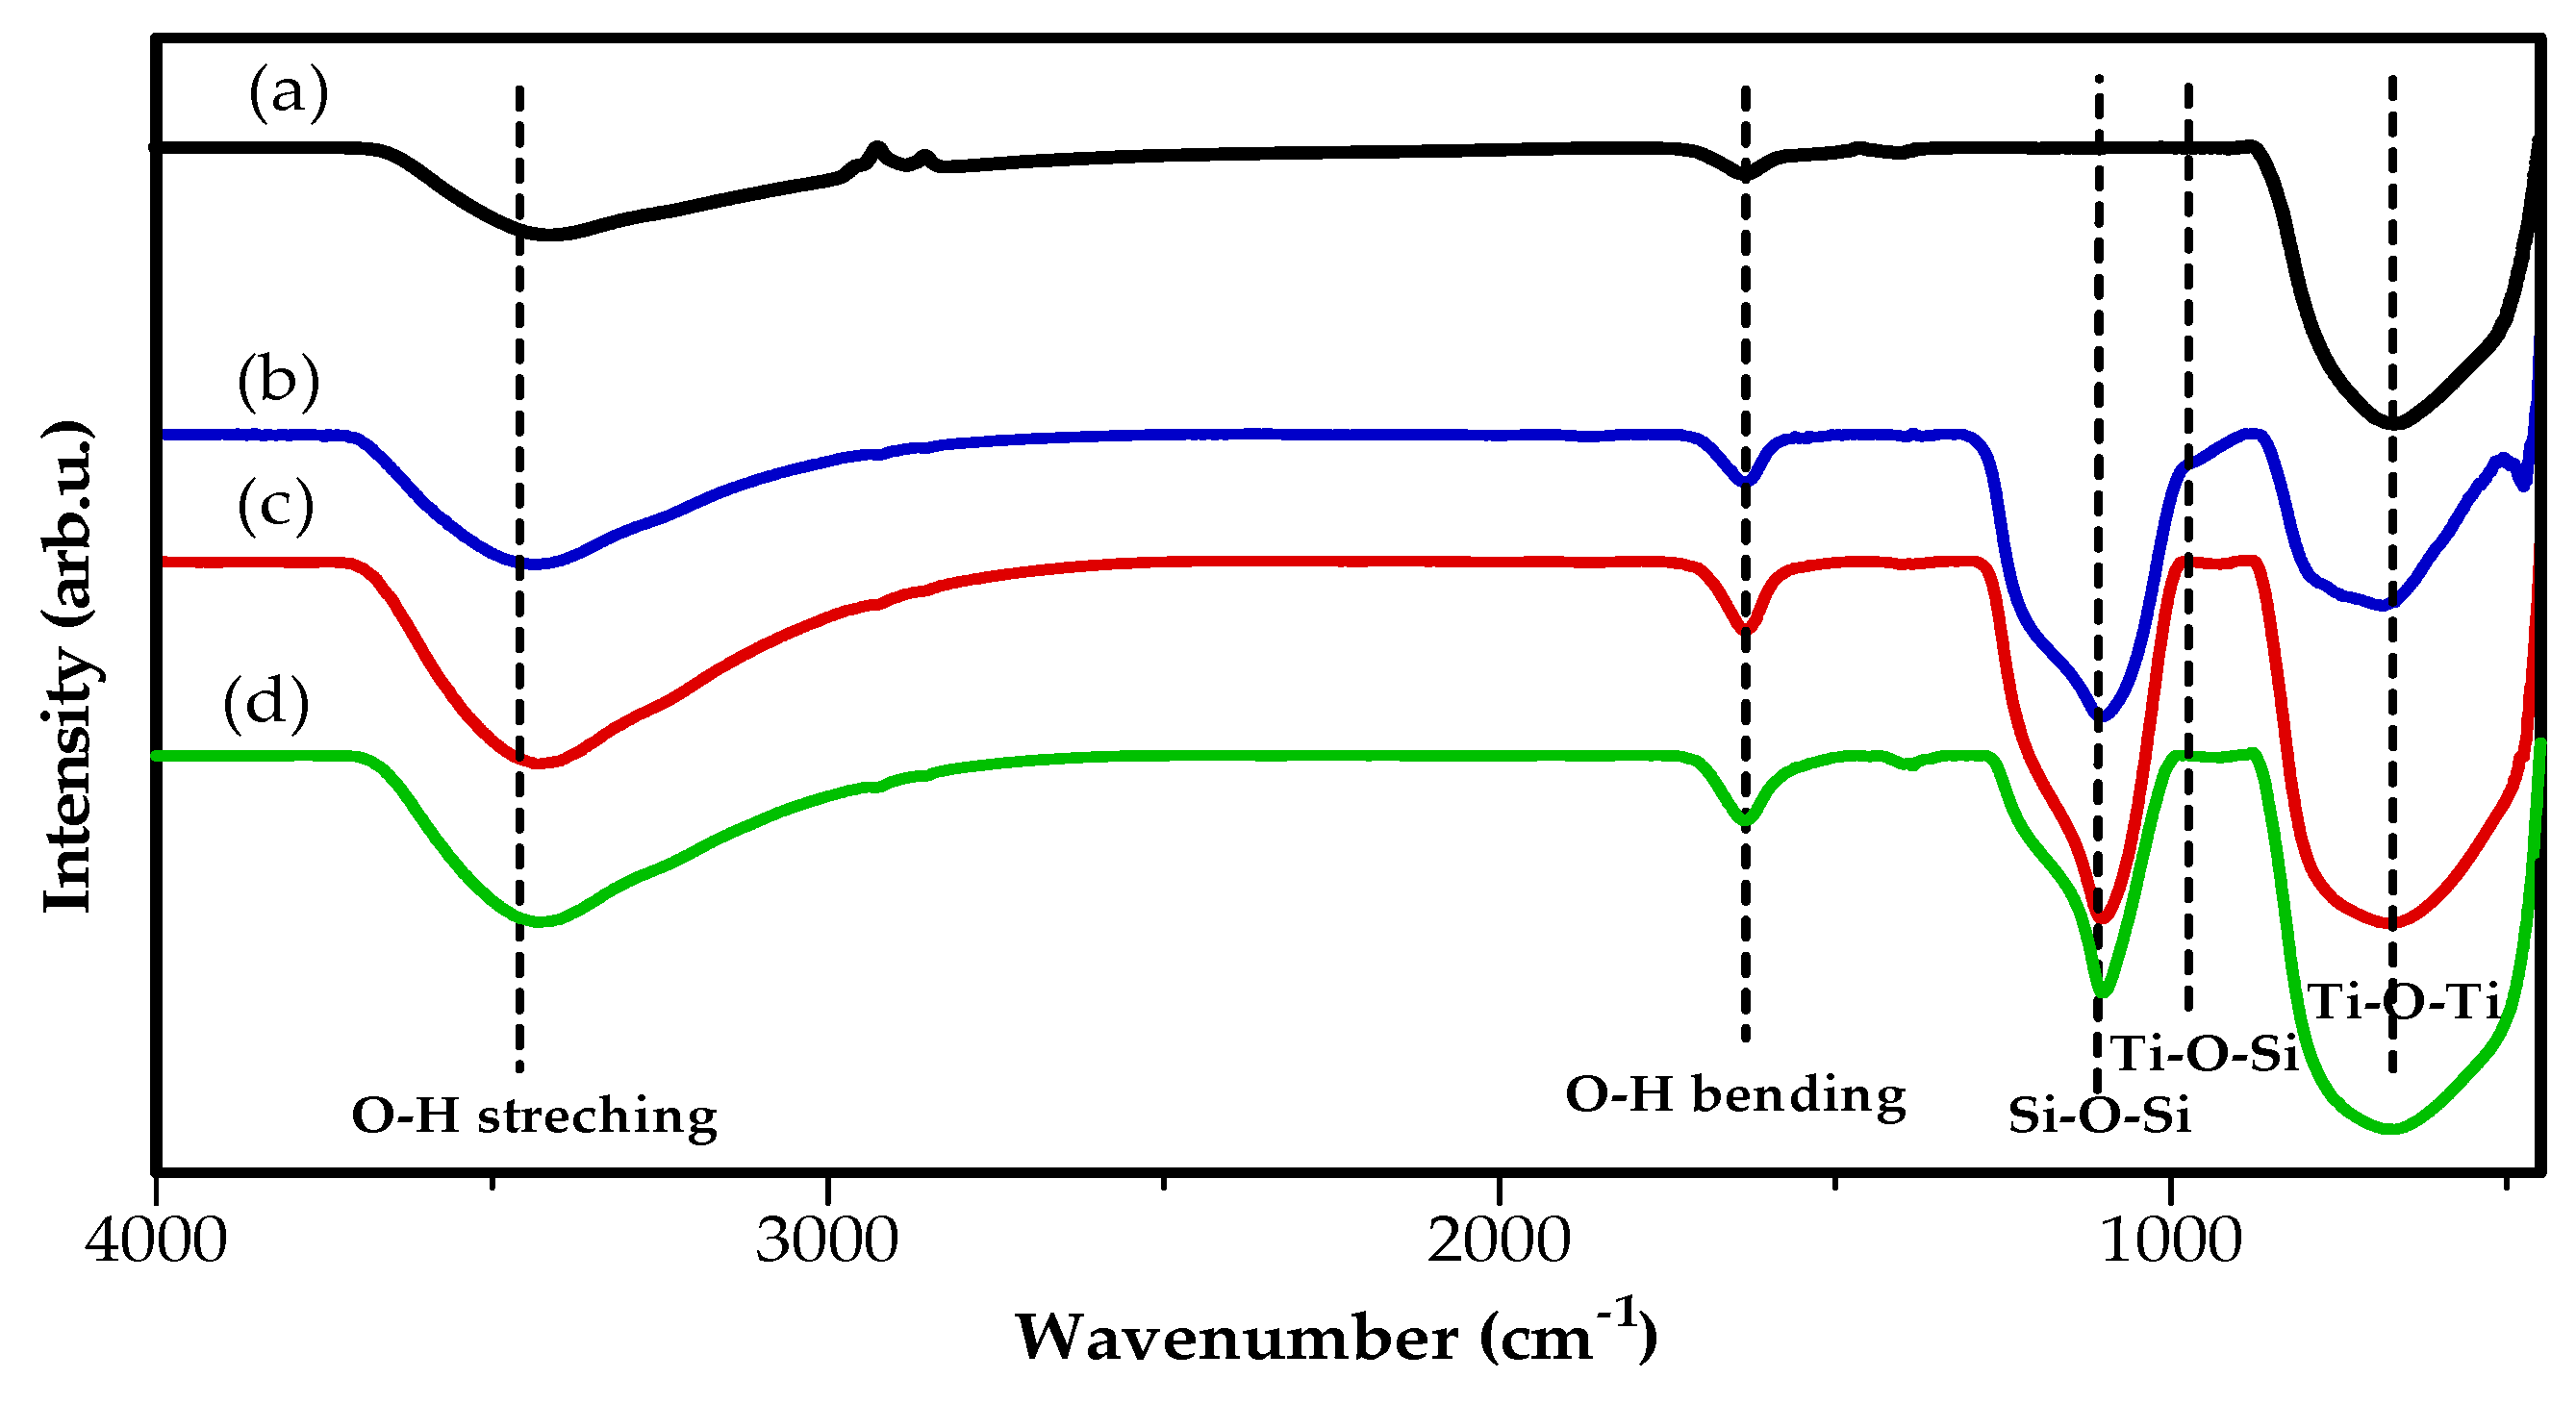
The next characterization was Fourier-transform infrared spectroscopy (FTIR), used to identify the functional groups in the TiO2/SiO2 composites at wave number 450–4000 cm−1. The resulting spectrum in Figure 2 shows that the characteristics of the IR absorption band at wave number 3410–3435 cm−1 was a stretching vibration of –OH, while at 1633–1636 cm−1, it was a typical absorption for the bending vibration of –OH [25]. The strong and dominant absorption peak discovered at wave number 1101–1103 cm−1 was the asymmetric stretching vibration of the Si–O–Si (siloxane) bond [25]. Furthermore, the absorption peak appearing at the wave number 475.0 cm−1 was caused by the vibration of the O–Si–O (siloxy) bond stretching. Meanwhile, the peaks discovered at 667–686 cm−1 showed the vibration of the Ti–O–Ti bond stretching [34]. The presence of a Ti–O–Si vibration peak in the wavenumber region of 920–960 cm−1 [35] at a TiO2/SiO2 1:1 ratio indicates that the interaction between TiO2 and SiO2 is a chemical reaction process (a chemical bond occurs) rather than a simple physical mixing process. Although this peak was not detected at TiO2/SiO2 3:1 and 7:1. The wavenumber data of the IR spectrum in Figure 2 is presented in Table 4. The O–H stretching and bending vibrations observed in the spectra of all the composites are characteristic of SiO2 and TiO2 P25, and indicate successful synthesis. These peaks increase in intensity, with a rise in SiO2 content due to the high surface water adsorption [35], while the difference in O–H intensity between the two compounds shows SiO2 possesses an active O–H side for surface reaction.

3.2. Morphological Characterization of TiO2/SiO2 Composites

The next characterization was scanning electron microscopy (SEM), which was carried out on TiO2 P25 Degussa and TiO2/SiO2 composites to determine the morphology and shape of the particles, shown in Figure 3. The addition of SiO2 to TiO2/SiO2 composites had no significant effect on the morphology of the samples. Meanwhile, at the same magnification of 20,000×, both of them showed the shape of spherical particles.

3.3. Brunauer–Emmett–Teller (BET) Analysis of TiO2/SiO2 Composites

To characterize the specific surface area of the prepared samples, an N2 adsorption-desorption analysis was carried out. The adsorption and desorption isotherms of the TiO2 P25 and TiO2/SiO2 composites were approximately the same. The specific surface area of the composite TiO2/SiO2 (7:1) is 46.019 m2/g, which is larger than TiO2 P25. The results of the specific surface area analysis are shown in Table 5. The data in Table 5 show that the high TiO2/SiO2 surface area is associated with the SiO2 surface area itself. The increase in the surface area of TiO2-SiO2 definitely facilitates achieving a higher photocatalytic activity [36].

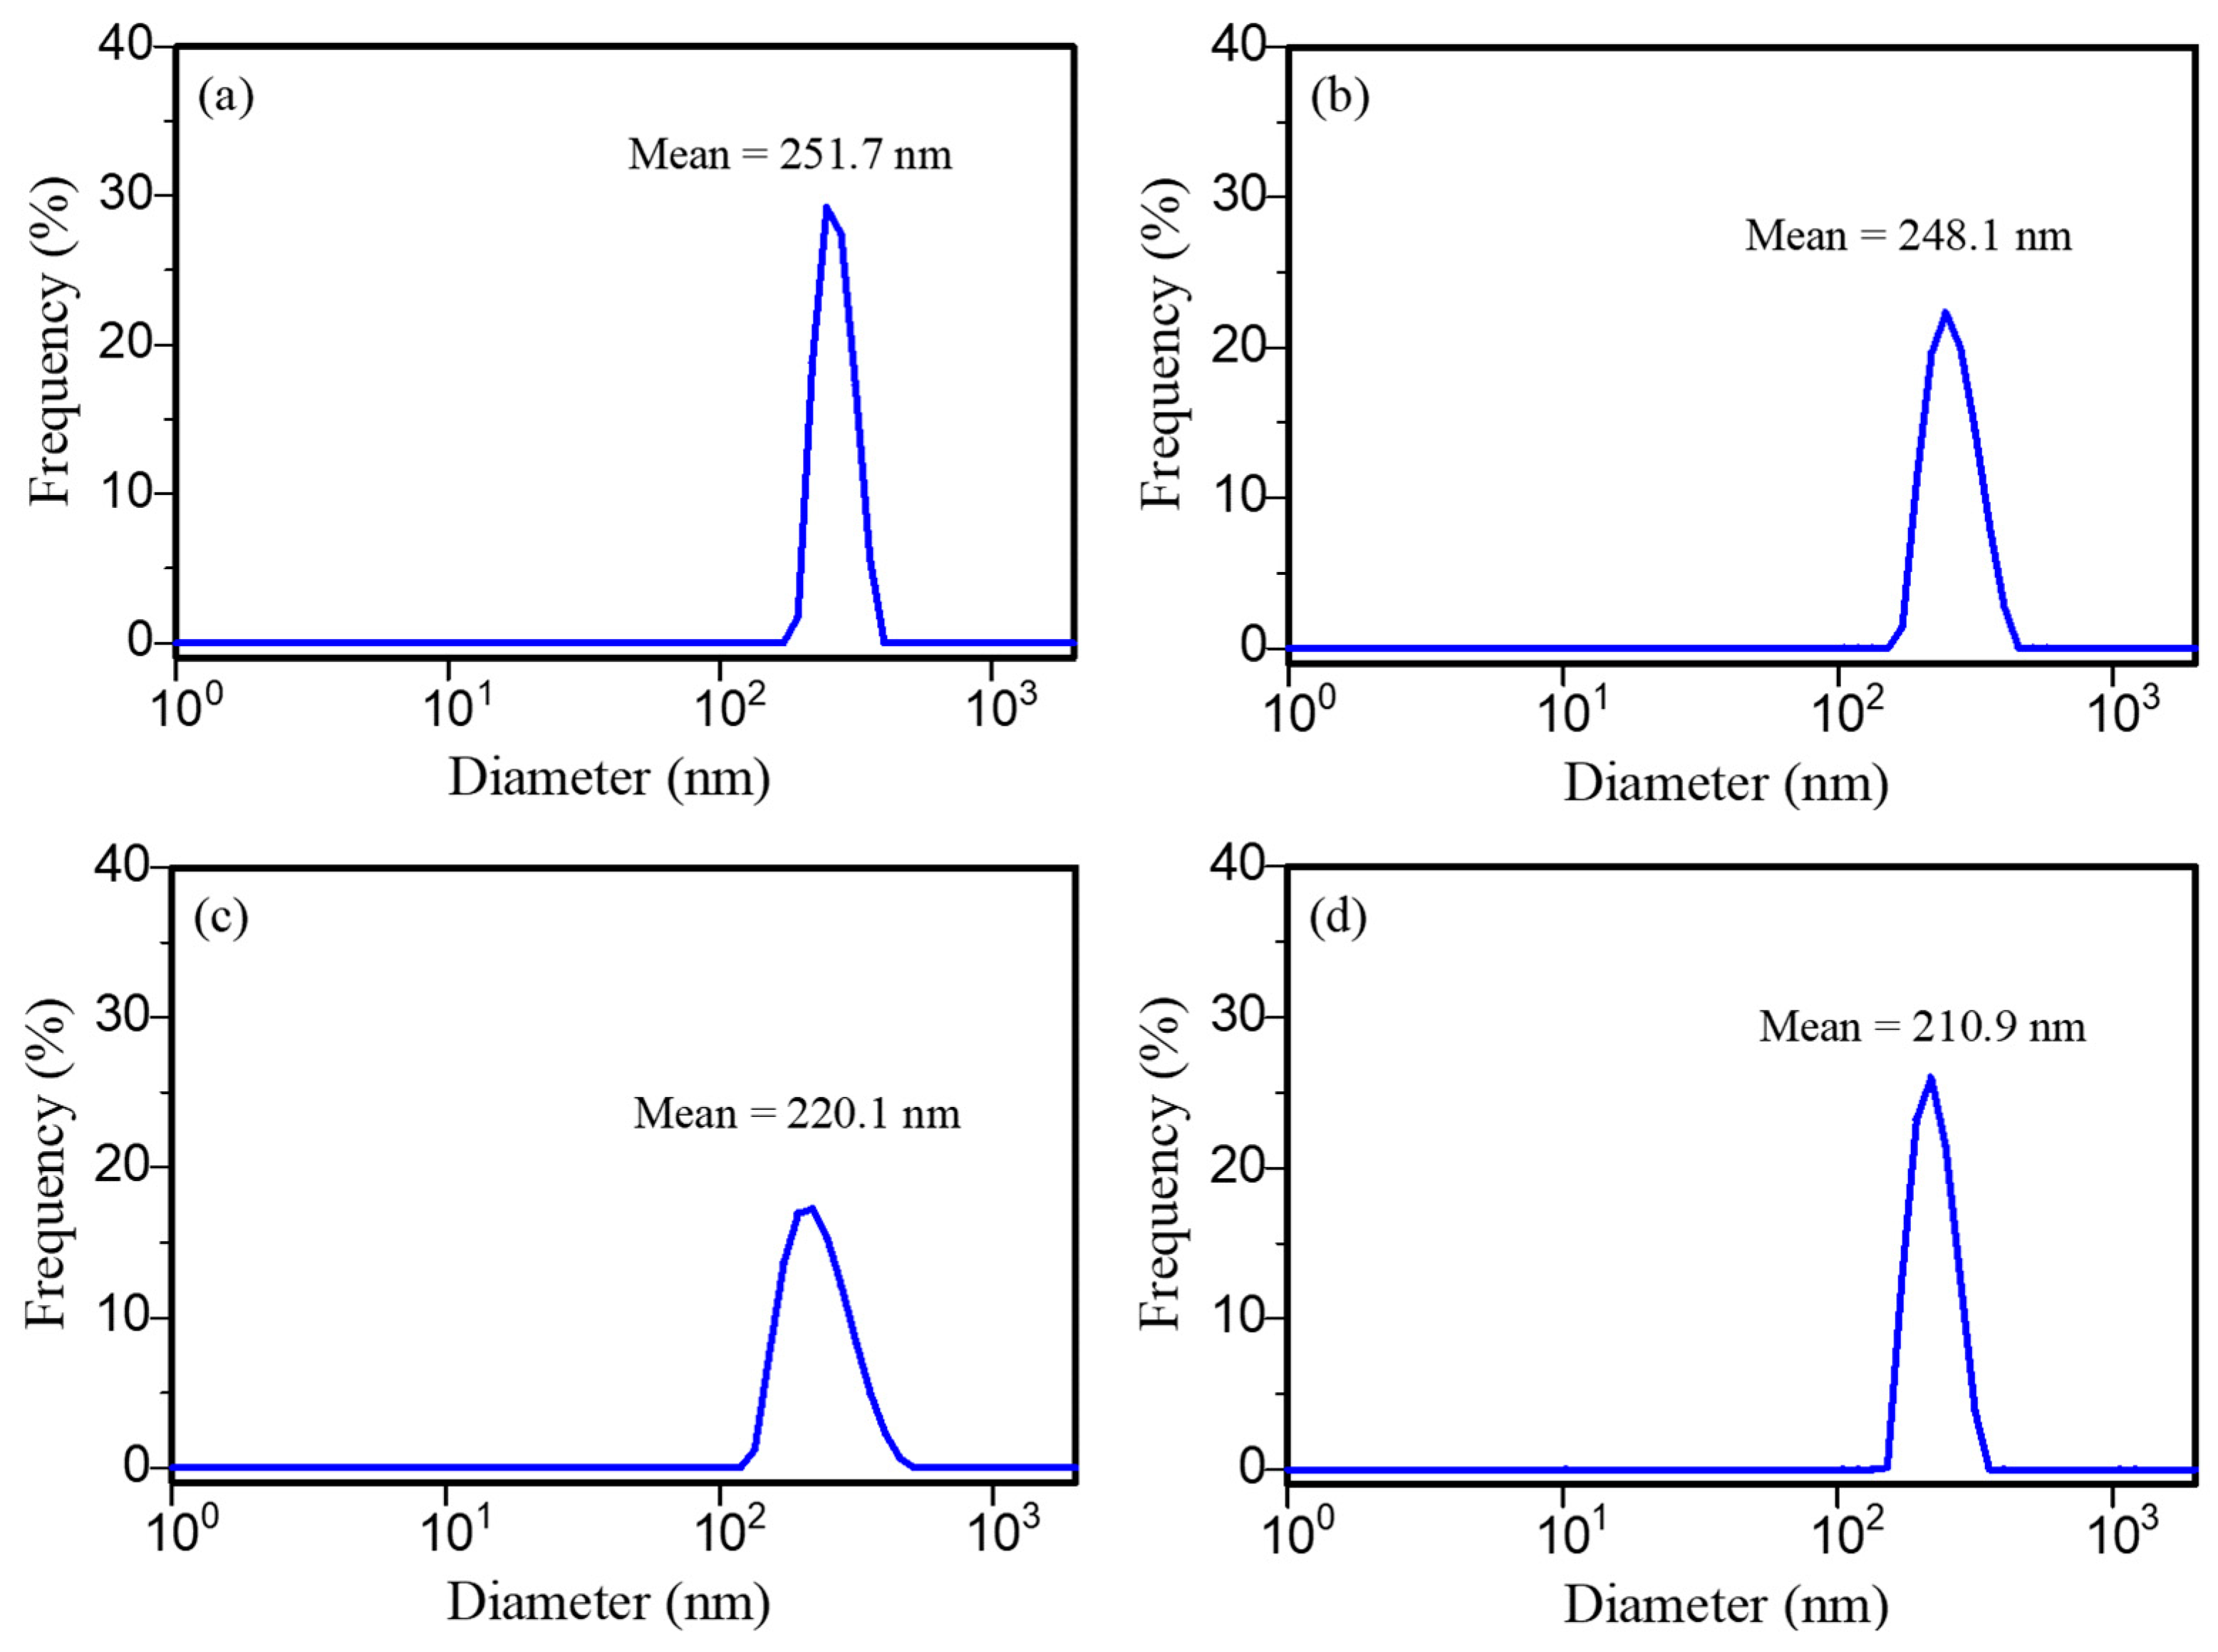
3.4. Characterization of Particle Size Distribution of TiO2/SiO2 Composites

The particle size distribution of TiO2 P25 and TiO2/SiO2 composites were analyzed using a particle size analyzer (PSA). The data presented in Figure 4 show that the particles were homogeneous, which is indicated by only one peak on the histogram of each sample. Data regarding the mode values, mean, median, z-average, and polydispersity index (PI) are shown in Table 6.
From the data in Table 6, it was observed that the addition of SiO2 to a composite in the right composition caused the z-average or the average size of the particles to become smaller. In addition, the most occurring particle size was observed from the mode value. The mode value of each composite variations 1:1, 3:1, and 7:1 is 232.6, 204.5, and 204.8 nm, respectively. Meanwhile, the mode value of TiO2 P25 was 236.6 nm and the mean particle size value for the TiO2 and TiO2/SiO2 composite variations 1:1, 3:1, and 7:1 is 288.2, 322.8, 320.2, and 223.4 nm, respectively.
The polydispersity index (PI) value is a measurement of the molecular mass distribution in the sample. It is expressed as the weight average molecular weight divided by the number average molecular weight. Results from the study carried out by Danhier et al. [37] (in Yeni et al. [38]) states that if the PI value is less than 0.3, it indicates that the sample has a narrower distribution of nanoparticles and the size of the nanoparticle diameter is uniform or homogeneous. However, it was very difficult to make particles of a uniform size (monodispersion), and although monodispersion of particle size was obtained, it was actually a polydispersion particle with a very narrow particle size distribution. From Table 6, it was observed that the PI value for the TiO2/SiO2 composites variations 1:1, 3:1, and 7:1 is 0.434, 0.387, and 0.353, respectively. Furthermore, the PI values of these samples fell into the mean range of the polydispersity index 0.3–0.7, where the distribution operated best. From the average particle size data and PI in Table 6, it was observed that the TiO2/SiO2 7:1 variation had the smallest average particle size and the highest homogeneity. It can be understood that the amount of SiO2 affects the sample size, in that a small amount of SiO2 added can cause a decrease in the particle size. However, a large amount of SiO2 will cause an increase in the agglomeration and therefore increase the particle size.
Therefore, compositing TiO2 and SiO2 led to a relatively small particle size and even distribution in TiO2 [39] in TiO2/SiO2 7:1. The reduction in size lessened the formation time and increased the redox rate for electrons and holes during the surface photocatalytic process. This also lowered the photoelectron and hole recombination; hence, the catalyst’s performance was improved [15].

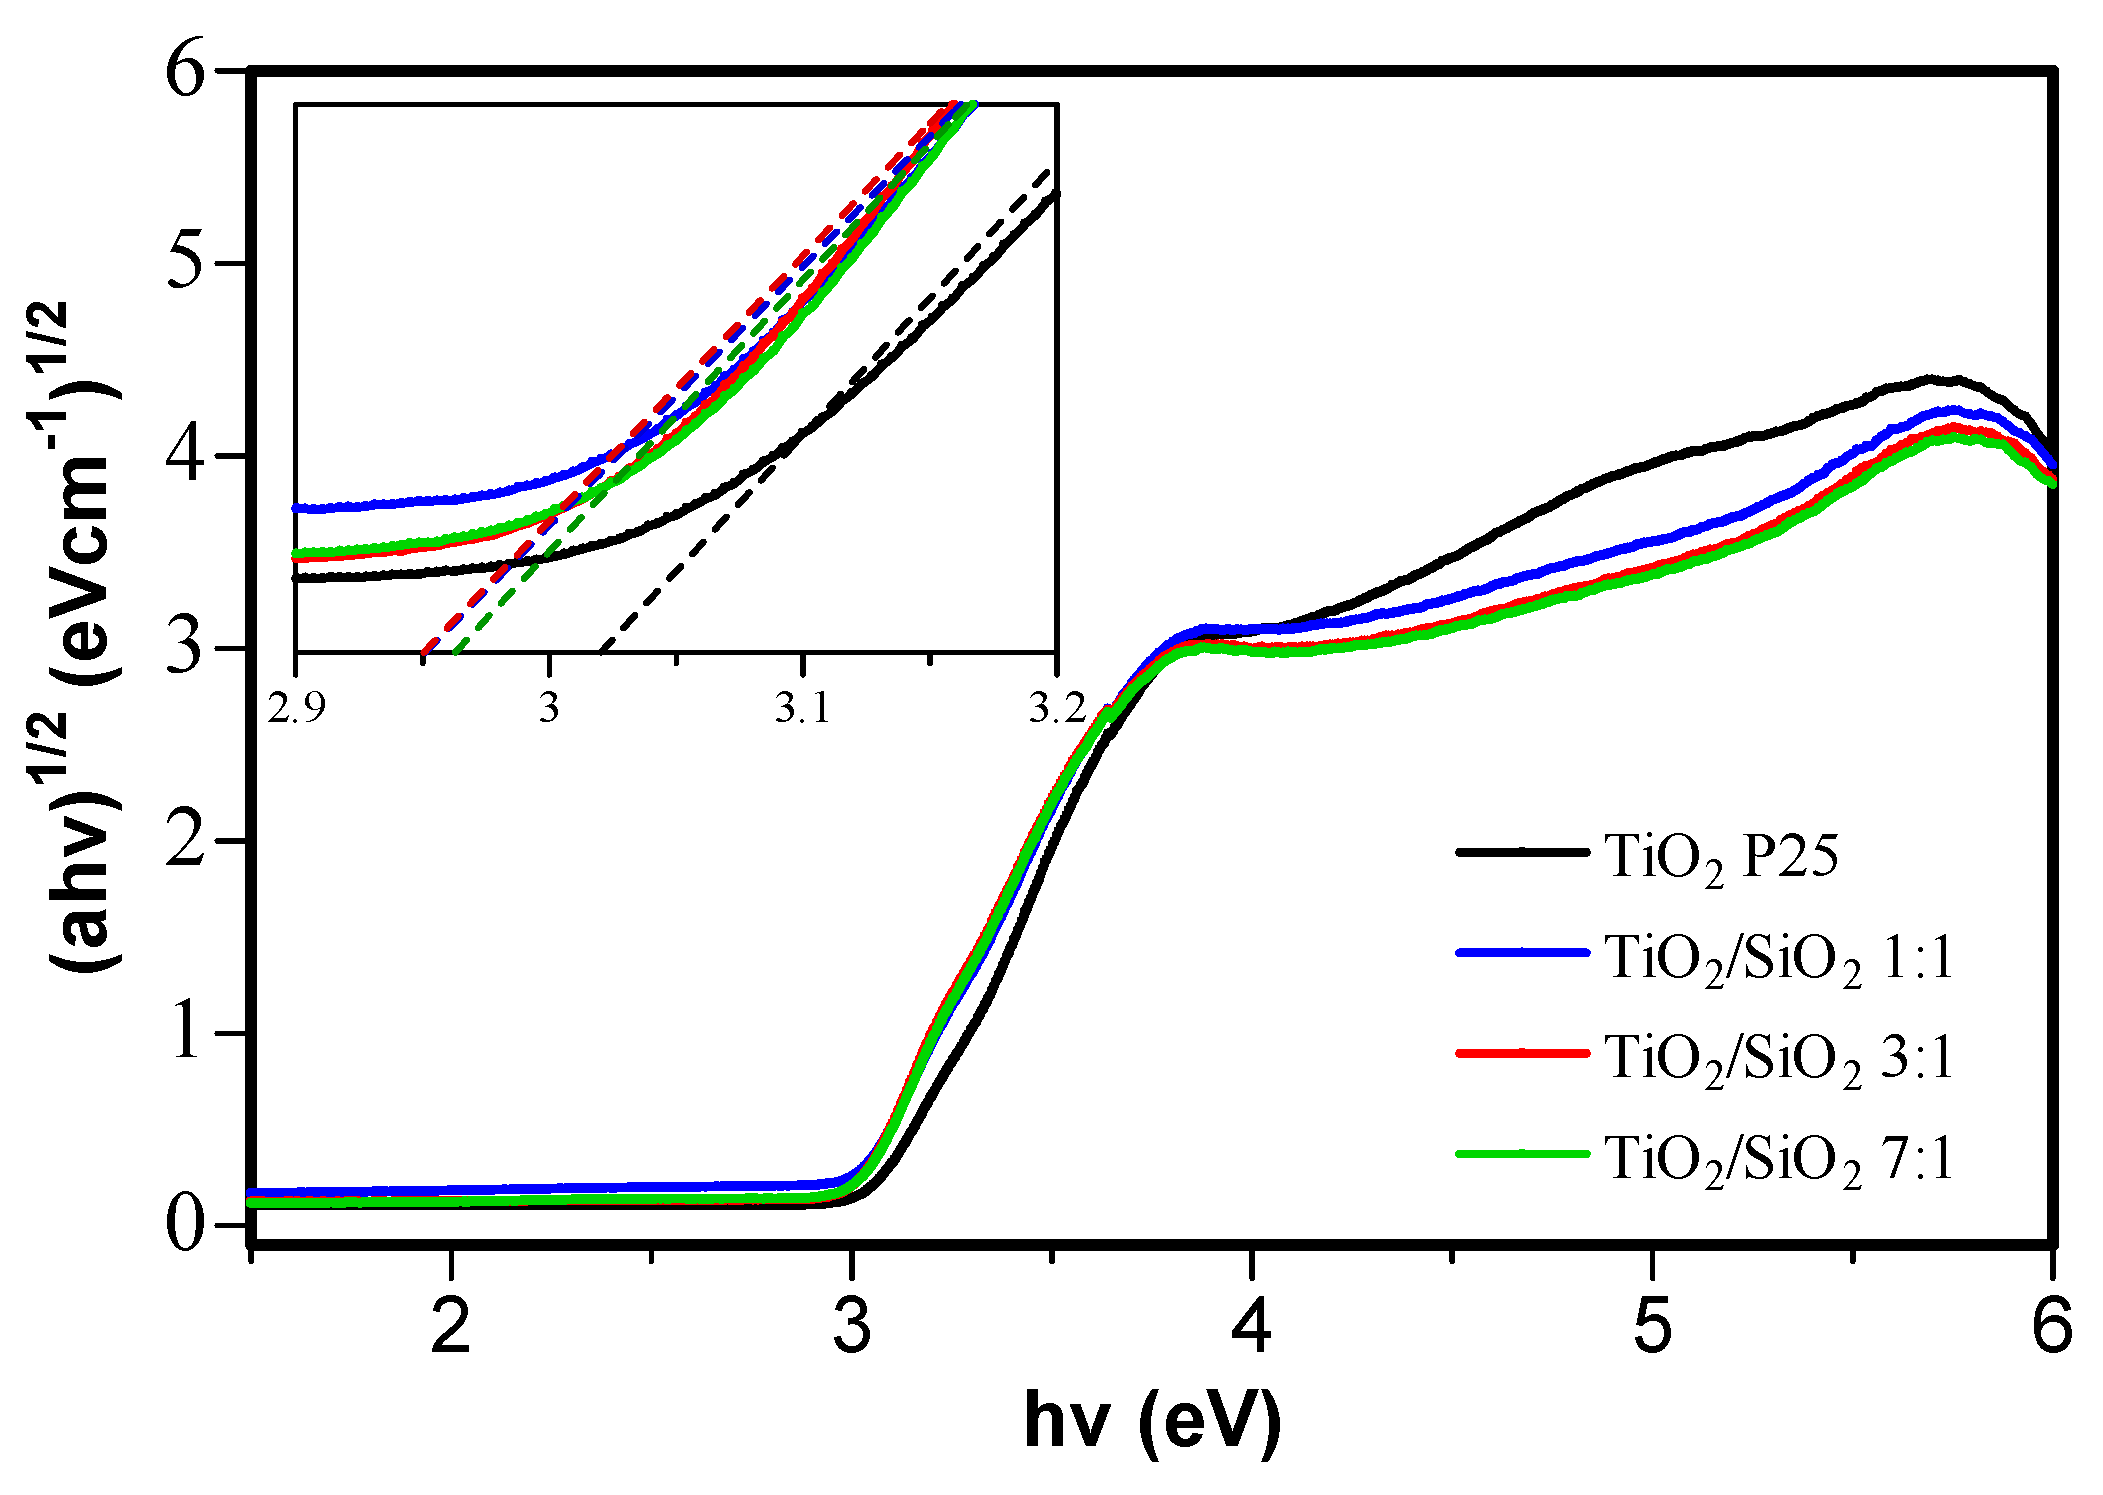
3.5. Bandgap Characterization of TiO2/SiO2 Composites

UV-vis analysis on the catalyst was used to determine the bandgap of the photocatalyst. TiO2 P25 Degussa has clear ultraviolet light absorption characteristics. Although not significant, there was a decrease in the bandgap for the synthesized composites compared to TiO2 P25 Degussa, indicating that SiO2 gave a slight change to the electronic state of TiO2. The optical bandgap energy (Eg) is obtained using the Tauc equation [40]:
)n = A( − Eg),
where α is the absorption coefficient, is the energy of the photons, and A denotes the proportionality constant. The transition property is represented by n, where n = 1/2 for the indirect bandgap allowed [40]. Bandgap energy is calculated by plotting (α)1/2 vs. (Figure 5). The bandgap values of TiO2 P25 Degussa and TiO2/SiO2 composites are shown in Table 7. TiO2 P25 Degussa has a bandgap value of 3.02 eV, where the TiO2/SiO2 composites have a smaller bandgap, namely, 2.95 eV for TiO2/SiO2 1:1 and 2.96 eV for TiO2/SiO2 3:1 and 7:1.
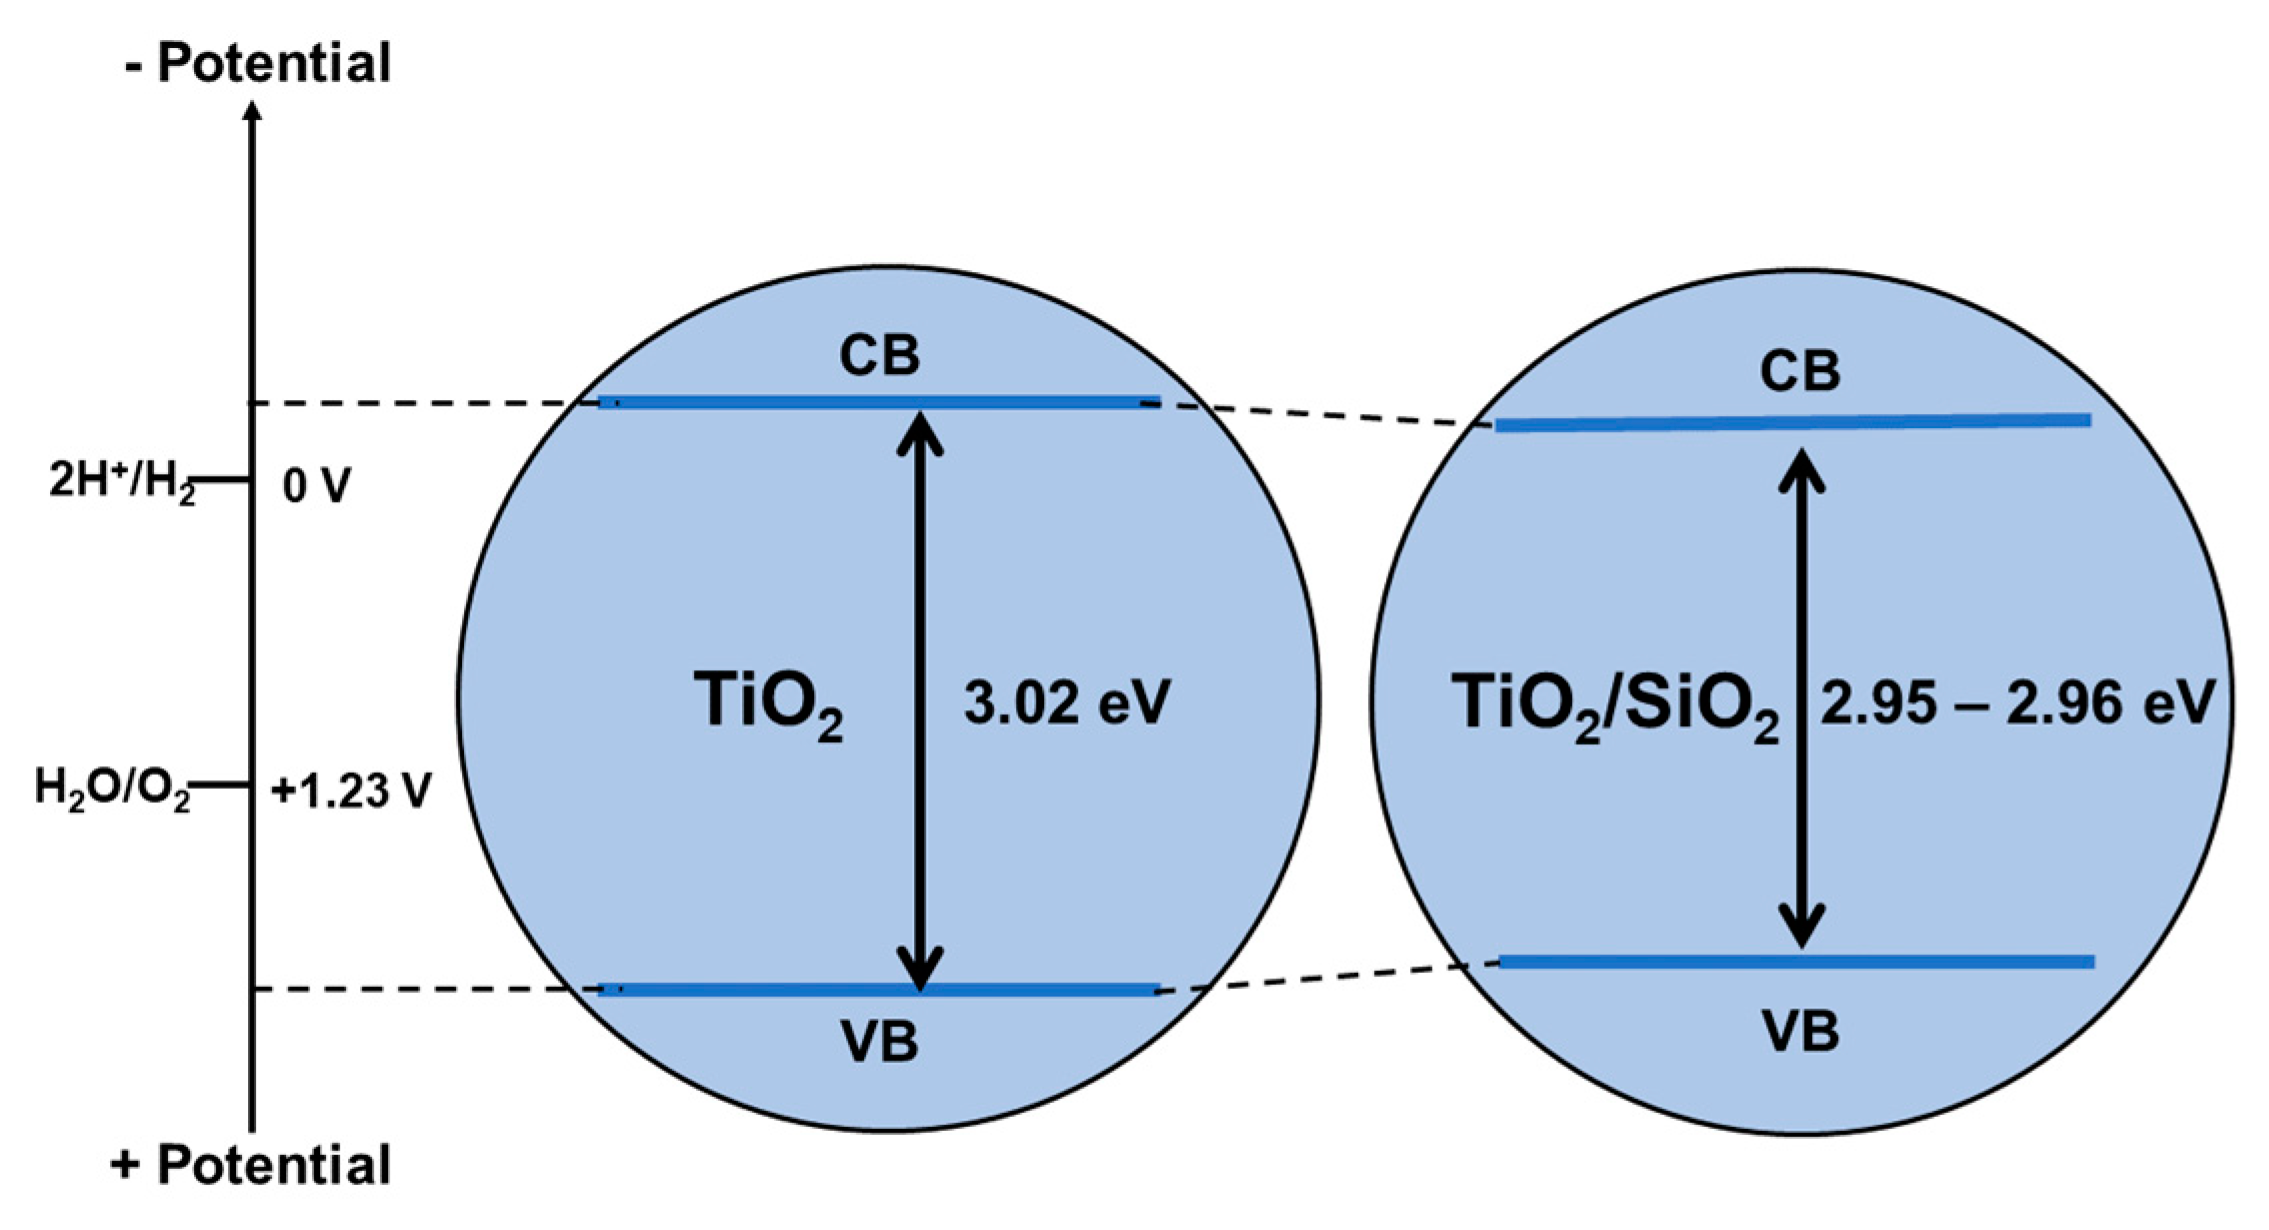
The difference in bandgap values can be explained in terms of changes in the energy of the TiO2 bandgap due to SiO2. The cause of this bandgap difference is possible through three mechanisms: (i) quantum size effect [33]; (ii) Ti–O–Si bond formation, leading to electronic structure modification [30]; and (iii) percentage difference between the anatase and rutile phases, where rutile has a different bandgap with anatase [41]. Figure 6 shows the energy band diagram of the TiO2 and SiO2/TiO2 composites. Due to the very large SiO2 bandgap (8.6 eV) [42], electron heterojunction between the valence band and conduction band of TiO2 and SiO2 is difficult. Bandgap changes only occur due to Ti–O–Si bond formation.

3.6. Photocatalytic Activity Test of TiO2/SiO2 Composites on Phenol

Various previous studies have reported composites between TiO2 and SiO2. Several sources of SiO2 are reported from various sources, such as extraction from natural materials and commercial SiO2. Examples of studies using TiO2 and SiO2 composites from various sources are presented in Table 8. The SiO2 used in this study was extracted from Bengkulu beach sand, Indonesia (extracted by Ishmah et al. [24]). Research on TiO2/SiO2 composites with SiO2 as a source of sand is still rarely reported.
The activity of the TiO2/SiO2 composite photocatalysts was tested against the decrease in phenol concentrations to determine the performance of the synthesized photocatalysts compared to TiO2 P25 Degussa. Phenol was chosen as a media for photocatalyst application because it is a toxic organic compound found in industrial waste in rivers and streams [4,45]. This test was performed using a simulated sample of phenol standard solution that was analyzed using high-performance liquid chromatography. The results of the phenol photocatalytic test are shown in
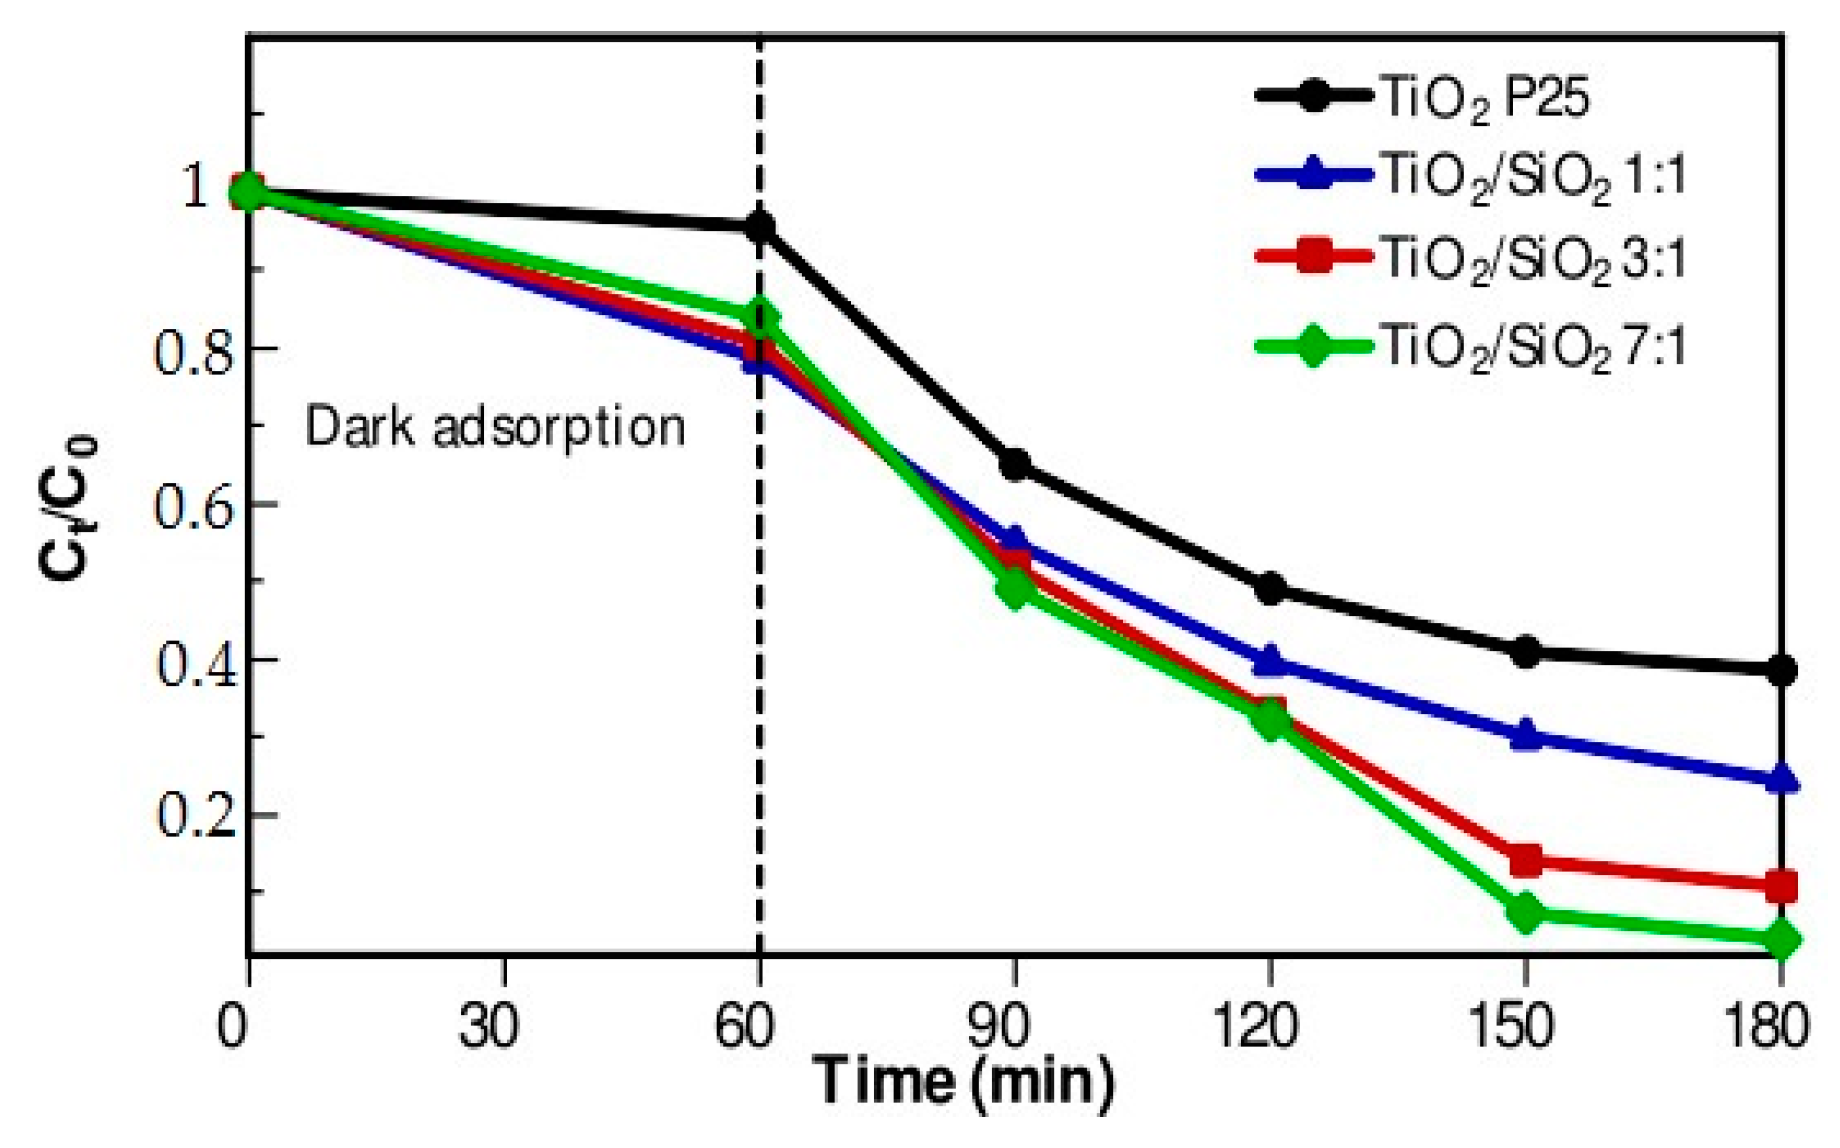
 Figure 7.
From Figure 7, it was observed that the decrease in concentration until the 60th min was the effect of adsorption from the photocatalyst since the test was carried out without UV light irradiation until the 60th min. Furthermore, tests with UV light irradiation were carried out at 60 to 180 min, where a significant decrease in concentration was observed after activation of the photocatalyst by light. The TiO2 photocatalyst added with SiO2 resulted in a decrease in the phenol concentration, which was observed on a more descending curve.
In the adsorption process until the 60 min, it was observed in the curve that TiO2 had adsorption ability; however, the resulting decrease in concentration was lower. Meanwhile, when added with SiO2, the adsorption ability increased significantly. The addition of SiO2 to the TiO2 photocatalyst was directly proportional to the percentage of phenol adsorption. The percentage of phenol reduction during the adsorption process (without UV light irradiation) using TiO2 P25, for TiO2/SiO2 composites with the variations 7:1, 3:1, and 1:1, is 4.60, 16.11, 19.45, and 21.48%, respectively. Data of the phenol concentration and percentage reduction at any time are presented in Table 9.
The photocatalysts exhibited a higher percentage reduction under exposure to UV light. This indicated the performance in phenol oxidation is influenced by photons from UV light. In photocatalysts exposed to UV light, photo-oxidation is commenced by absorbing photons of a higher energy than the photocatalyst’s bandgap. This results in an electron jump from the valence (ecb) to the conduction band (hvb). Consequently, holes and electrons are formed in the hvb and ecb, respectively. These react with oxygen (O2) and water (H2O) from the environment, provided by the photocatalyst, respectively, to produce •OH radicals. The •OH radicals formed reacted with the metal and the phenol degradation process occurred [46,47,48]. Meanwhile, for unexposed photocatalysts to UV light (dark state), there were no photons (UV light) to activate the photocatalyst’s performance; therefore, there was no photo-oxidation reaction. The process of the decrease in the phenol concentration was the adsorption process from the catalyst that became larger in capacity due to the large silica content in the photocatalyst, considering that silica is a good adsorbent with a large adsorption capacity [15].
From Table 9, it was observed that the addition of SiO2 increased the percentage of phenol degradation. SiO2 substrate was an adsorbent that provided an adsorption side to support TiO2 through the adsorption process; therefore, more pollutants were degraded [
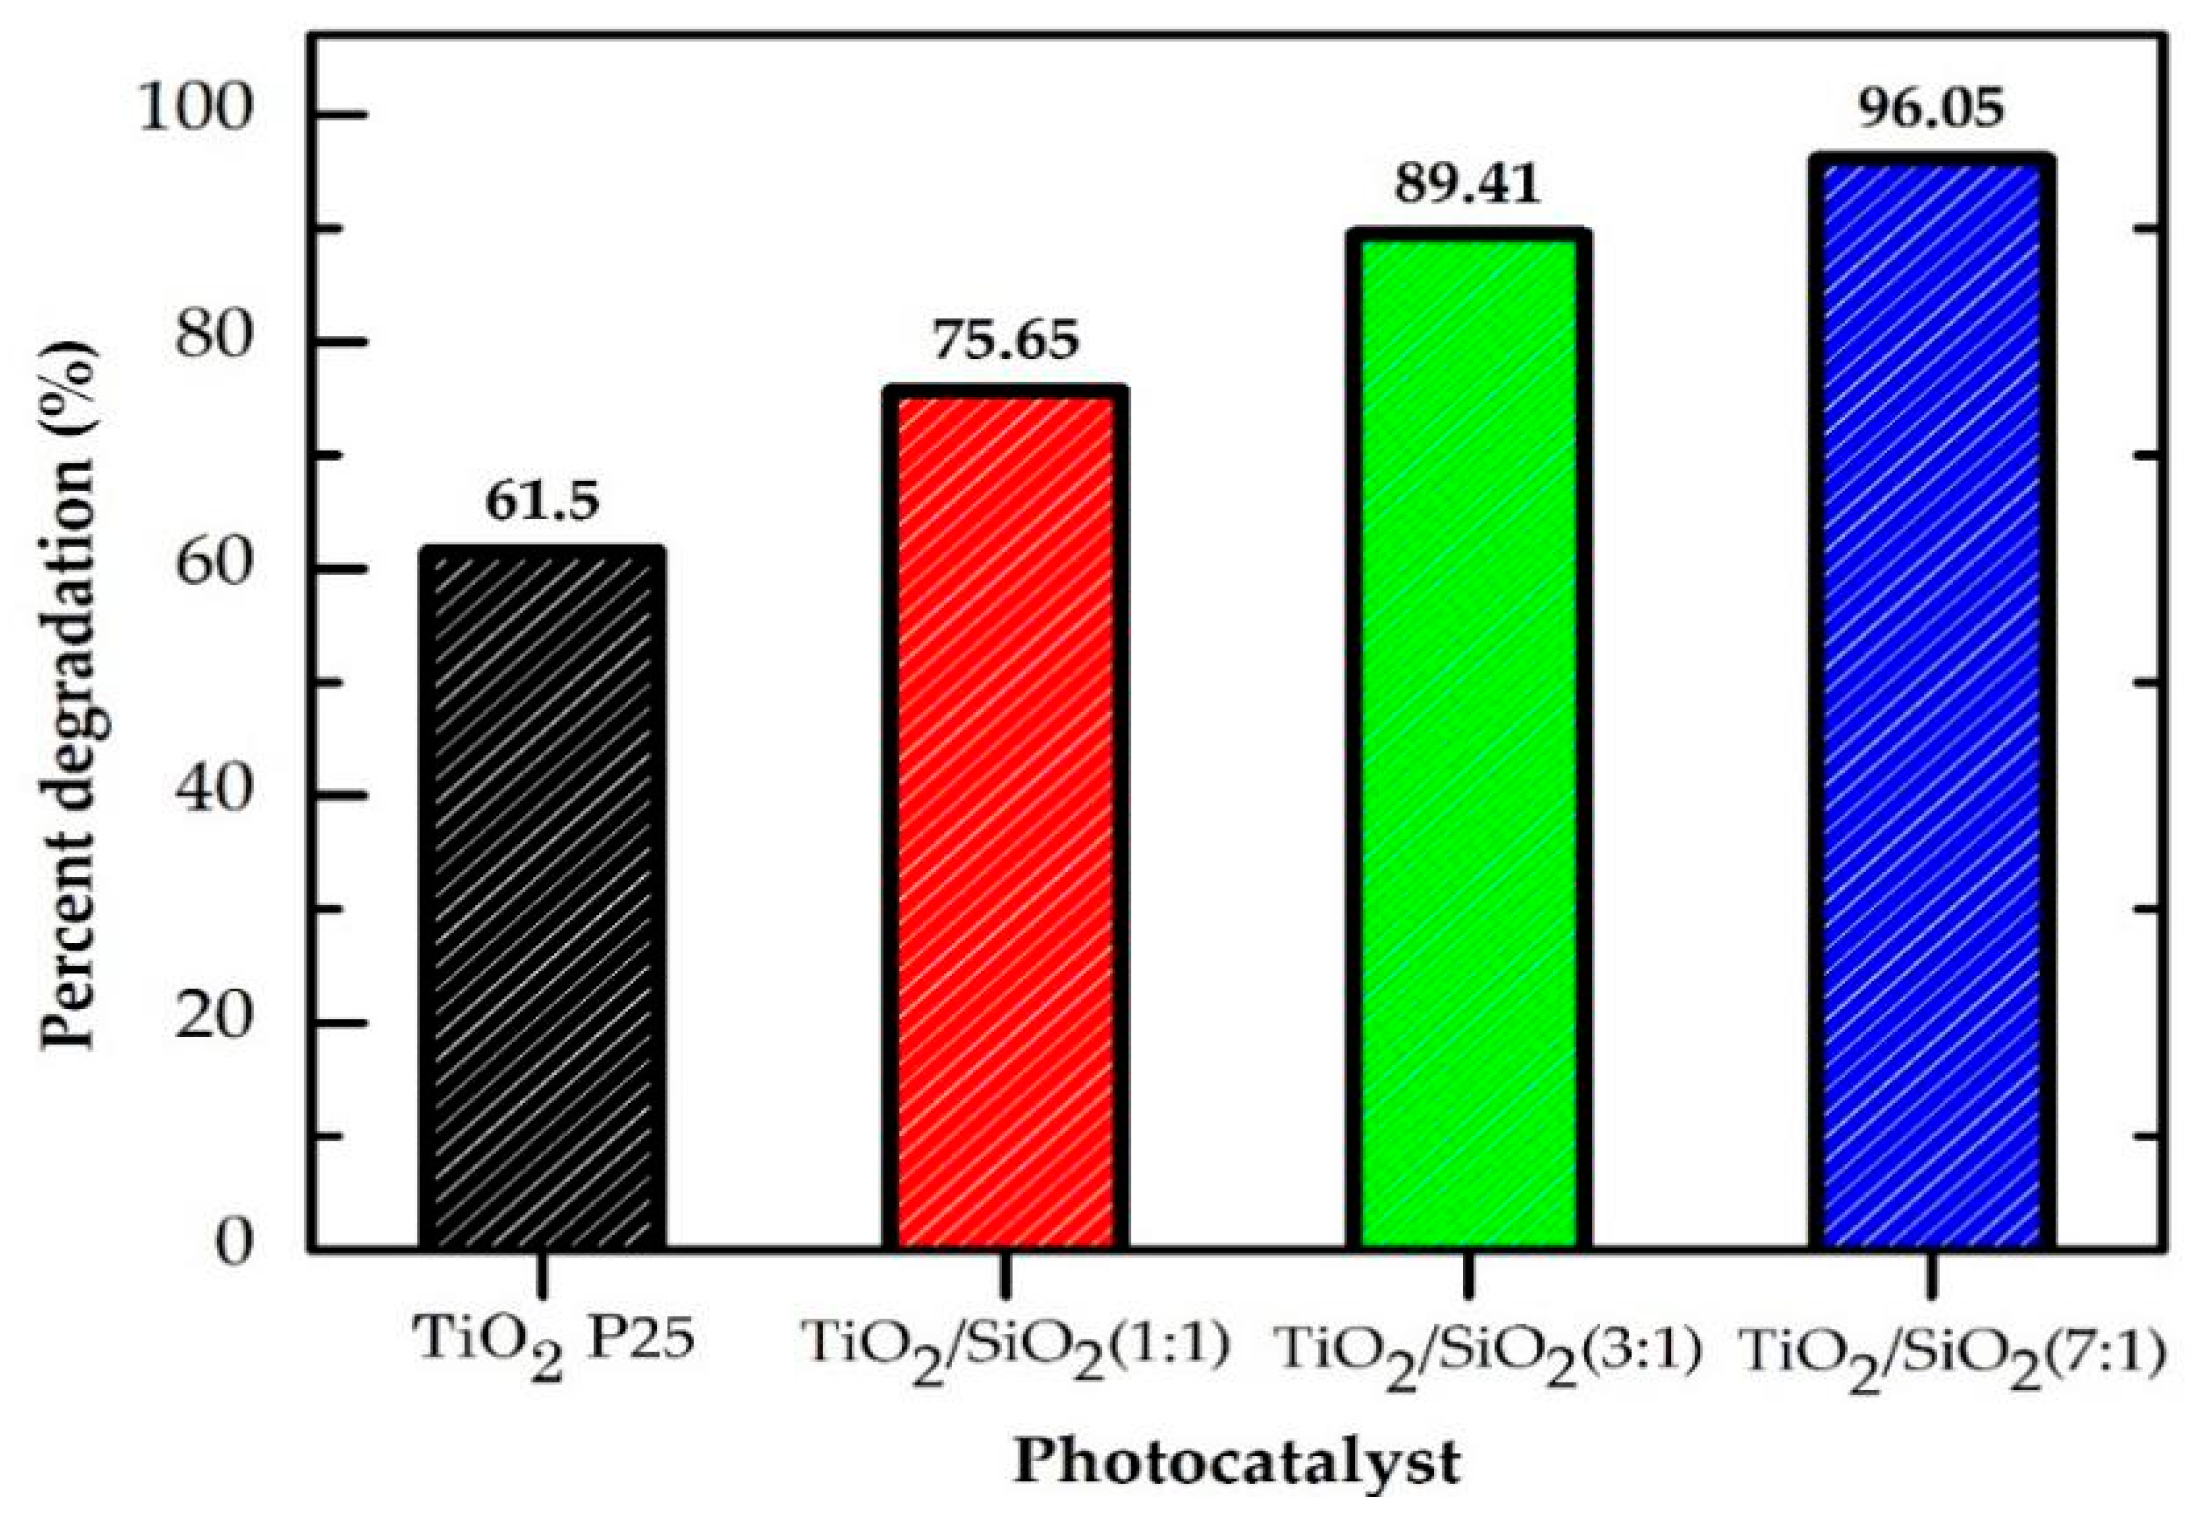
49]. The efficiency of the phenol concentration reduction is seen in Figure 7. After testing for 180 min, it was observed that the TiO2 P25 Degussa photocatalyst had a phenol reduction percentage of 61.5%, while the percentage of phenol reduction for the TiO2/SiO2 composites with the variations of 1:1, 3:1, and 7:1 were 75.65, 89.41, and 96.05%, respectively. Furthermore, the highest percentage of phenol reduction was shown by the photocatalyst of the TiO2/SiO2 composites with the 7:1 variation. This occurred because this variation had the smallest and most homogeneous particle size among the samples; therefore, this photocatalyst provided a larger surface area, which improved its performance in decreasing the phenol concentration. The efficiency of reducing the phenol concentration is seen in Figure 8.
The kinetics of the photocatalysis was observed using the Langmuir–Hinshelwood first-order and second-order kinetic model. The first-order kinetics was calculated using [50]:
–dC/dt = k1C,
where C represents the concentration of phenol (mg.L−1) and k1 denotes the first-order rate constant (min−1). Meanwhile, at the start of the reaction, t = 0 and Ct = Ci. Therefore, the equation below is obtained after integration:
ln(Ct/Ci) = −k1t + b,
where, Ci signifies the initial concentration of phenol in mg.L−1, Ct represents the concentration (mg.L−1) of phenol in the solution at t min, b denotes a constant, and k1 (min−1) is the first-order rate constant.
Table 10 shows the increase in reaction kinetic constant due to the addition of SiO2. The highest k value is found in the TiO2/SiO2 composite ratio of 7:1, namely, with a k1 of 0.0267 min−1, followed by the composite ratio 3:1 and the composite ratio 1:1. The results show that phenol removal efficiency of the TiO2/SiO2 composite with the 7:1 ratio was 3.5 times higher compared to TiO2 P25, indicating that SiO2 promoted the photocatalytic ability significantly on TiO2.
The catalytic activity in the photodegradation of phenol is compared with the data that have been reported in the literature shown in Table 11, clearly showing that our data on photoactivity are compared with those published in the literature.

4. Conclusions

In this research, the photocatalytic removal of phenol from an aqueous solution by TiO2/SiO2 composites was examined. The modification of titanium dioxide using silicon dioxide extracted from sand beach increased the photocatalytic activity, thereby decreasing the phenol concentration. The best ratio of TiO2/SiO2 composite was 7:1, which also gave the highest crystallinity (92.52%), largest crystal size (16.28 nm for anatase and 26.06 nm for rutile), and smallest particle size (210.9 nm). The addition of silicon dioxide reduces the crystallinity, causing the volume of the anatase and rutile crystal lattice to decrease and the particle size to decrease. TiO2/SiO2 composites also exhibited chemical bonding rather than a simple physical mixing process. However, there was no significant change in the shape and the band gap of TiO2. By using the optimized condition, the reduction percentage of the phenol concentrations by using the TiO2/SiO2 composite was 96.05% in 120 min and has 3.5 times more efficient compared to TiO2 P25. These results indicate that the TiO2/SiO2 composite can be used as a green approach for phenolic compounds removal in industrial wastewater.

Supplementary Materials

The following are available online at https://www.mdpi.com/article/10.3390/app11199033/s1, Figure S1: Rietveld refinement of XRD pattern of TiO2 P25, Figure S2: Rietveld refinement of XRD pattern of composite TiO2/SiO2 1:1, Figure S3: Rietveld refinement of XRD pattern of composite TiO2/SiO2 3:1, Figure S4: Rietveld refinement of XRD pattern of composite TiO2/SiO2 7:1.

Author Contributions

Conceptualization, D.R.E. and M.L.F.; methodology, S.N.I.; software, S.N.I. and M.D.P.; validation, D.R.E., M.L.F. and I.R.; formal analysis, S.N.I.; investigation, S.N.I. and M.D.P.; resources, S.N.I.; data curation, S.N.I.; writing—original draft preparation, S.N.I.; writing—review and editing, D.R.E. and M.D.P.; visualization, M.D.P.; supervision, D.R.E. and M.L.F.; project administration, D.R.E.; funding acquisition, Y.A.E.-B., E.E.H. and Z.M.E.-B. All authors have read and agreed to the published version of the manuscript.

Funding

This research was funded by Taif University, Researchers Supporting Project, grant number TURSP-2020/106.

Institutional Review Board Statement

Not applicable.

Informed Consent Statement

Not applicable.

Data Availability Statement

Not applicable.

Acknowledgments

The authors would like to acknowledge the financial support provided from Taif University Researchers Supporting Project Number (TURSP-2020/106). D.R.E is grateful for the facilities from Universitas Padjadjaran, Indonesia, through the Academic Leadership Grant (ALG) to Iman Rahayu (ID: 1959/UN6.3.1/PT.00/2021), Indonesian Ministry of Research, and by the Penelitian Dasar Unggulan Perguruan Tinggi (PDUPT ID: 1207/UN6.3.1/PT.00/2021) and Word Class Professor (WCP) 2021 grant. The authors also acknowledge support from the University of Yamanashi, Japan, for support during the instrumental analysis.

Conflicts of Interest

The authors declare no conflict of interest.

References

  1. Lestari, P.R.; Takei, T.; Yanagida, S.; Kumada, N. Hybridization of Metal Nanoparticle of ZnAl Layered Double Hydroxide and its Application for Photocatalyst Phenol Degradation. J. Ion Exch. 2018, 29, 48–52. [Google Scholar] [CrossRef]
  2. Ajmal, A.; Majeed, I.; Malik, R.N.; Idriss, H.; Nadeem, M.A. Principles and mechanisms of photocatalytic dye degradation on TiO2 based photocatalysts: A comparative overview. RSC Adv. 2014, 4, 37003–37026. [Google Scholar] [CrossRef]
  3. Sane, P.; Chaudhari, S.; Nemade, P.; Sontakke, S. Photocatalytic reduction of chromium(VI) using combustion synthesized TiO2. J. Environ. Chem. Eng. 2018, 6, 68–73. [Google Scholar] [CrossRef]
  4. Peiró, A.M.; Ayllón, J.A.; Peral, J.; Doménech, X. TiO2-photocatalyzed degradation of phenol and ortho-substituted phenolic compounds. Appl. Catal. B 2001, 30, 359–373. [Google Scholar] [CrossRef]
  5. Joshi, K.M.; Shrivastava, V.S. Photocatalytic degradation of Chromium(VI) from wastewater using nanomaterials like TiO2, ZnO, and CdS. Appl. Nanosci. 2011, 1, 147–155. [Google Scholar] [CrossRef] [Green Version]
  6. Dudita, M.; Bogatu, C.; Enesca, A.; Duta, A. The influence of the additives composition and concentration on the properties of SnOx thin films used in photocatalysis. Mater. Lett. 2011, 65, 2185–2189. [Google Scholar] [CrossRef]
  7. Kusiak-Nejman, E.; Wojnarowicz, J.; Morawski, A.W.; Narkiewicz, U.; Sobczak, K.; Gierlotka, S.; Lojkowski, W. Size-dependent effects of ZnO nanoparticles on the photocatalytic degradation of phenol in a water solution. Appl. Surf. Sci. 2021, 541, 148416. [Google Scholar] [CrossRef]
  8. Besançon, M.; Michelin, L.; Josien, L.; Vidal, L.; Assaker, K.; Bonne, M.; Lebeau, B.; Blin, J.L. Influence of the porous texture of SBA-15 mesoporous silica on the anatase formation in TiO2-SiO2 nanocomposites. New J. Chem. 2016, 40, 4386–4397. [Google Scholar] [CrossRef]
  9. Lee, M.S.; Hong, S.S.; Mohseni, M. Synthesis of photocatalytic nanosized TiO2–Ag particles with sol–gel method using reduction agent. J. Mol. Catal. A Chem. 2005, 242, 135–140. [Google Scholar] [CrossRef]
  10. Park, S.M.; Razzaq, A.; Park, Y.H.; Sorcar, S.; Park, Y.; Grimes, C.A.; In, S.I. Hybrid CuxO–TiO2 Heterostructured Composites for Photocatalytic CO2 Reduction into Methane Using Solar Irradiation: Sunlight into Fuel. ACS Omega 2016, 1, 868–875. [Google Scholar] [CrossRef] [Green Version]
  11. Asencios, Y.J.; Lourenço, V.S.; Carvalho, W.A. Removal of phenol in seawater by heterogeneous photocatalysis using activated carbon materials modified with TiO2. Catal. Today 2020. [Google Scholar] [CrossRef]
  12. Bai, S.; Liu, H.; Sun, J.; Tian, Y.; Chen, S.; Song, J.; Luo, R.; Li, D.; Chen, A.; Liu, C.C. Improvement of TiO2 photocatalytic properties under visible light by WO3/TiO2 and MoO3/TiO2 composites. Appl. Surf. Sci. 2015, 338, 61–68. [Google Scholar] [CrossRef]
  13. Liu, Y.; Xin, F.; Wang, F.; Luo, S.; Yin, X. Synthesis, characterization, and activities of visible light-driven Bi2O3–TiO2 composite photocatalysts. J. Alloys Compd. 2010, 498, 179–184. [Google Scholar] [CrossRef]
  14. Riazian, M. Dependence of Photocatalytic activity of TiO2-SiO2 nanopowders. J. Nanostruct. 2014, 4, 433–441. [Google Scholar] [CrossRef]
  15. Cheng, Y.; Luo, F.; Jiang, Y.; Li, F.; Wei, C. The effect of calcination temperature on the structure and activity of TiO2/SiO2 composite catalysts derived from titanium sulfate and fly ash acid sludge. Colloids Surf. A Physicochem. Eng. Asp. 2018, 554, 81–85. [Google Scholar] [CrossRef]
  16. Luttrell, T.; Halpegamage, S.; Tao, J.; Kramer, A.; Sutter, E.; Batzill, M. Why is anatase a better photocatalyst than rutile? -Model studies on epitaxial TiO2 films. Sci. Rep. 2015, 4, 1–8. [Google Scholar] [CrossRef] [Green Version]
  17. Pal, A.; Jana, T.K.; Chatterjee, K. Silica supported TiO2 nanostructures for highly efficient photocatalytic application under visible light irradiation. Mat. Res. Bull. 2016, 76, 353–357. [Google Scholar] [CrossRef]
  18. Ishmah, S.N. Ekstraksi Silika Pasir Pantai Bengkulu sebagai Pendukung Fotokatalis Titanium Dioksida. Available online: https://repository.unpad.ac.id/frontdoor/index/index/year/2020/docId/12163 (accessed on 2 November 2020).
  19. Eddy, D.R.; Puri, F.N.; Noviyanti, A.R. Synthesis and Photocatalytic Activity of Silica-based Sand Quartz as the Supporting TiO2 Photocatalyst. Procedia Chem. 2015, 17, 55–58. [Google Scholar] [CrossRef] [Green Version]
  20. Wang, Y.; Gan, Y.; Whiting, R.; Lu, G. Synthesis of sulfated titania supported on mesoporous silica using direct impregnation and its application in esterification of acetic acid and n-butanol. J. Solid State Chem. 2009, 182, 2530–2534. [Google Scholar] [CrossRef]
  21. Hindryawati, N.; Maniam, G.P. Novel utilization of waste marine sponge (Demospongiae) as a catalyst in ultrasound-assisted transesterification of waste cooking oil. Ultrason. Sonochem. 2015, 22, 454–462. [Google Scholar] [CrossRef]
  22. Eddy, D.R.; Ishmah, S.N.; Permana, M.D.; Firdaus, M.L. Synthesis of Titanium Dioxide/Silicon Dioxide from Beach Sand as Photocatalyst for Cr and Pb Remediation. Catalysts 2020, 10, 1248. [Google Scholar] [CrossRef]
  23. Firdaus, M.L.; Madina, F.E.; Yulia, F.S.; Elvia, R.; Ishmah, S.N.; Eddy, D.R. Cid-Andres, A.P. Silica Extraction from Beach Sand for Dyes Removal: Isotherms, Kinetics and Thermodynamics. Rasayan J. Chem. 2020, 13, 249–254. [Google Scholar] [CrossRef]
  24. Ishmah, S.N.; Permana, M.D.; Firdaus, M.L.; Eddy, D.R. Extraction of Silica from Bengkulu Beach Sand using Alkali Fusion Method. PENDIPA J. Sci. Edu. 2020, 4, 1–5. [Google Scholar] [CrossRef]
  25. Degen, T.; Sadki, M.; Bron, E.; König, U.; Nénert, G. The highscore suite. Powder Diffr. 2014, 29, S13–S18. [Google Scholar] [CrossRef] [Green Version]
  26. Lestari, P.R.; Takei, T.; Yanagida, S.; Kumada, N. Facile and controllable synthesis of Zn-Al layered double hydroxide/silver hybrid by exfoliation process and its plasmonic photocatalytic activity of phenol degradation. Mater. Chem. Phys. 2020, 250, 122988. [Google Scholar] [CrossRef]
  27. Cromer, D.T.; Herrington, K. The structures of anatase and rutile. J. Am. Chem. Soc. 1955, 77, 4708–4709. [Google Scholar] [CrossRef]
  28. Sanchez, E.; Lopez, T.; Gomez, R.; Morales, A.; Novaro, O. Synthesis and Characterization of Sol–Gel Pt/TiO2 Catalyst. J. Solid State Chem. 1996, 122, 309–314. [Google Scholar] [CrossRef]
  29. Pinho, L.; Mosquera, M.J. Photocatalytic activity of TiO2–SiO2 nanocomposites applied to buildings: Influence of particle size and loading. Appl. Catal. B. 2013, 134, 205–221. [Google Scholar] [CrossRef]
  30. Klankaw, P.; Chawengkijwanich, C.; Grisdanurak, N.; Chiarakorn, S. The hybrid photocatalyst of TiO2–SiO2 thin film prepared from rice husk silica. Superlattices Microstruct. 2012, 51, 343–352. [Google Scholar] [CrossRef]
  31. Tobaldi, D.M.; Tucci, A.; Škapin, A.S.; Esposito, L. Effects of SiO2 addition on TiO2 crystal structure and photocatalytic activity. J. Eur. Ceram. Soc. 2010, 30, 2481–2490. [Google Scholar] [CrossRef]
  32. Eddy, D.R.; Rahayu, I.; Hartati, Y.W.; Firdaus, M.L.; Bakti, H.H. Photocatalytic activity of gadolinium doped TiO2 particles for decreasing heavy metal chromium concentration. J. Phys. Conf. Ser. 2018, 1080, 012013. [Google Scholar] [CrossRef]
  33. Yaparatne, S.; Tripp, C.P.; Amirbahman, A. Photodegradation of taste and odor compounds in water in the presence of immobilized TiO2-SiO2 photocatalysts. J. Hazard. Mater. 2018, 346, 208–217. [Google Scholar] [CrossRef] [PubMed]
  34. Hou, T.D.; Wang, X.C.; Wu, L.; Chen, X.F.; Ding, Z.X.; Wang, X.X.; Fu, X.Z. N-doped SiO2/TiO2 mesoporous nanoparticles with enhanced photocatalytic activity under visible-light irradiation. Chemosphere 2008, 72, 414–421. [Google Scholar] [CrossRef]
  35. Bellardita, M.; Addamo, M.; Di Paola, A.; Marcì, G.; Palmisano, L.; Cassar, L.; Borsa, M. Photocatalytic activity of TiO2/SiO2 systems. J. Hazard. Mater. 2010, 174, 707–713. [Google Scholar] [CrossRef] [PubMed]
  36. Danhier, F.; Lecouturier, N.; Vroman, B.; Jérôme, C.; Marchand-brynaert, J.; Feron, O.; Préat, V. Paclitaxel-loaded PEGylated PLGA-based nanoparticles: In vitro and in vivo evaluation. J. Control. Release 2009, 133, 11–17. [Google Scholar] [CrossRef]
  37. Yeni, G.; Silfia, S.; Diza, Y.H. Effect of Solvent Type and Homogenizer Speed on Particle Characteristics of Gambier Catechins. J. Litbang Ind. 2019, 9, 9–14. [Google Scholar] [CrossRef]
  38. Sirimahachai, U.; Ndiege, N.; Chandrasekharan, R.; Wongnawa, S.; Shannon, M.A. Nanosized TiO2 particles decorated on SiO2 spheres: Synthesis and photocatalytic activities. J. Sol.-Gel Sci. Technol. 2010, 56, 3–6. [Google Scholar] [CrossRef]
  39. Chowdhury, I.H.; Roy, M.; Kundu, S.; Naskar, M.K. TiO2 hollow microspheres impregnated with biogenic gold nanoparticles for the efficient visible light-induced photodegradation of phenol. J. Phys. Chem. Solids. 2019, 129, 329–339. [Google Scholar] [CrossRef]
  40. Fujishima, A.; Zhang, X.; Tryk, D.A. TiO2 photocatalysis and related surface phenomena. Surf. Sci. Rep. 2008, 63, 515–582. [Google Scholar] [CrossRef]
  41. Yang, J.K.; Kim, W.S.; Park, H.H. Chemical bonding states and energy band gap of SiO2-incorporated La2O3 films on n-GaAs (001). Thin Solid Films 2006, 494, 311–314. [Google Scholar] [CrossRef]
  42. Rawal, S.B.; Bera, S.; Lee, D.; Jang, D.J.; Lee, W.I. Design of visible-light photocatalysts by coupling of narrow bandgap semiconductors and TiO2: Effect of their relative energy band positions on the photocatalytic efficiency. Catal. Sci. Technol. 2013, 3, 1822–1830. [Google Scholar] [CrossRef]
  43. Šuligoj, A.; Štangar, U.L.; Ristić, A.; Mazaj, M.; Verhovšek, D.; Tušar, N.N. TiO2–SiO2 films from organic-free colloidal TiO2 anatase nanoparticles as photocatalyst for removal of volatile organic compounds from indoor air. Appl. Catal. B 2016, 184, 119–131. [Google Scholar] [CrossRef]
  44. Cetinkaya, T.; Neuwirthová, L.; Kutláková, K.M.; Tomášek, V.; Akbulut, H. Synthesis of nanostructured TiO2/SiO2 as an effective photocatalyst for degradation of acid orange. Appl. Surf. Sci. 2013, 279, 384–390. [Google Scholar] [CrossRef]
  45. Anku, W.W.; Mamo, M.A.; Govender, P.P. Phenolic compounds in water: Sources, reactivity, toxicity and treatment methods. In Phenolic Compounds-Natural Sources, Importance and Applications; IntechOpen: London, UK, 2017; Volume 3, pp. 419–443. [Google Scholar]
  46. Lakshmi, M.V.V.C.; Sridevi, V. A Review on Biodegradation of Phenol from Industrial Effluents. J. Ind. Pollut. Control. 2009, 25, 13–27. [Google Scholar]
  47. Mu’azu, N.D.; Jarrah, N.; Zubair, M.; Alagha, O. Removal of Phenolic Compounds from Water Using Sewage Sludge-Based Activated Carbon Adsorption: A Review. Int. J. Environ. Res. Public Health 2017, 14, 1094. [Google Scholar] [CrossRef] [Green Version]
  48. Sheeja, R.Y.; Murugesan, T. Mass Transfer Studies on The Biodegradation of Phenol in Up-flow Packed Bed Reactors. J. Hazard. Mater. 2002, 89, 287–301. [Google Scholar] [CrossRef]
  49. Sellapan, R. Mechanisms of Enhanced Activity of Model TiO2/Carbon and TiO2/Metal Nanocomposite Photocatalysts. Ph.D. Thesis, Chalmers University of Technology, Gotebrog, Sweden, 2013. [Google Scholar]
  50. Turki, A.; Guillard, C.; Dappozze, F.; Ksibi, Z.; Berhault, G.; Kochkar, H. Phenol photocatalytic degradation over anisotropic TiO2 nanomaterials: Kinetic study, adsorption isotherms and formal mechanisms. Appl. Catal. B 2015, 163, 404–414. [Google Scholar] [CrossRef]
  51. Abdullah, N.S.A.; So’aib, S.; Krishnan, J. Effect of calcination temperature on ZnO/TiO2 composite in photocatalytic treatment of phenol under visible light. Malaysian J. Anal. Sci. 2017, 21, 173–181. [Google Scholar]
  52. Chen, M.; Xu, Y. Trace Amount CoFe2O4 Anchored on a TiO2 Photocatalyst Efficiently Catalyzing O2 Reduction and Phenol Oxidation. Langmuir 2019, 35, 9334–9342. [Google Scholar] [CrossRef]
  53. Lara-López, Y.; García-Rosales, G.; Jiménez-Becerril, J. Synthesis and characterization of carbon-TiO2-CeO2 composites and their applications in phenol degradation. J. Rare Earths 2017, 35, 551–558. [Google Scholar] [CrossRef]
  54. Lendzion-Bieluń, Z.; Wojciechowska, A.; Grzechulska-Damszel, J.; Narkiewicz, U.; Śniadecki, Z.; Idzikowski, B. Effective processes of phenol degradation on Fe3O4–TiO2 nanostructured magnetic photocatalyst. J. Phys. Chem. Solids 2020, 136, 109178. [Google Scholar] [CrossRef]
  55. Ratnawati, R.; Enjarlis, E.; Husnil, Y.A.; Christwardana, M.; Slamet, S. Degradation of Phenol in Pharmaceutical Wastewater using TiO2/Pumice and O3/Active Carbon. Bull. Chem. React. Eng. Catal. 2020, 15, 146–154. [Google Scholar] [CrossRef] [Green Version]
  56. Lisowski, P.; Colmenares, J.C.; Mašek, O.; Lisowski, W.; Lisovytskiy, D.; Kamińska, A.; Łomot, D. Dual functionality of TiO2/biochar hybrid materials: Photocatalytic phenol degradation in the liquid phase and selective oxidation of methanol in the gas phase. ACS Sustain. Chem. Eng. 2017, 5, 6274–6287. [Google Scholar] [CrossRef] [Green Version]
  57. Alizadeh, B.; Delnavaz, M.; Shakeri, A. Removal of Cd(II) and phenol using novel cross-linked magnetic EDTA/chitosan/TiO2 nanocomposite. Carbohydr. Polym. 2018, 181, 675–683. [Google Scholar] [CrossRef] [PubMed]
  58. Wang, Y.; Zhao, J.; Xiong, X.; Liu, S.; Xu, Y. Role of Ni2+ ions in TiO2 and Pt/TiO2 photocatalysis for phenol degradation in aqueous suspensions. Appl. Catal. B 2019, 258, 117903. [Google Scholar] [CrossRef]
Figure 1. X-ray diffraction pattern of (a) TiO2 P25, (b) TiO2/SiO2 composite 1:1 ratio, (c) TiO2/SiO2 composite 3:1 ratio, and (d) TiO2/SiO2 composite 7:1 ratio.
Applsci 11 09033 g001
Figure 2. FTIR spectra of (a) TiO2 P25, (b) TiO2/SiO2 composite 1:1 ratio, (c) TiO2/SiO2 composite 3:1 ratio, and (d) TiO2/SiO2 composite 7:1 ratio.
Applsci 11 09033 g002
Figure 3. Surface morphology of (a) TiO2 P25 [32], (b) TiO2/SiO2 composite 1:1 ratio, (c) TiO2/SiO2 composite 3:1 ratio, and (d) TiO2/SiO2 composite 7:1 ratio.
Applsci 11 09033 g003
Figure 4. PSA histogram (a) TiO2 P25, (b) TiO2/SiO2 1:1 ratio, (c) TiO2/SiO2 3:1 ratio, and (d) TiO2/SiO2 7:1 ratio.
Applsci 11 09033 g004
Figure 5. Tauc plot obtained through the application of Equation (3) for the photocatalyst of TiO2 P25 Degussa and composite of TiO2/SiO2.
Applsci 11 09033 g005
Figure 6. The proposed bandgap of the TiO2/SiO2 composite and the potential levels of CB (conduction band) and VB (valence band) (vs. NHE).
Applsci 11 09033 g006
Figure 7. The normalized concentration of the photocatalytic phenol removal using TiO2 P25 and various TiO2/SiO2 ratios. The experiment was conducted using 50 mL phenol solution 20 mg.L−1 and 75 mg catalyst.
Applsci 11 09033 g007
Figure 8. The efficiency diagram of the phenol concentration reduction using various ratios of TiO2 P25 photocatalyst and TiO2/SiO2 composites.
Applsci 11 09033 g008
Table 1. Percentage of phase composition of the samples.
SamplePhase Composition (%)
AnataseRutile
TiO2 P2586.313.7
TiO2/SiO2 (1:1)88.211.8
TiO2/SiO2 (3:1)86.813.1
TiO2/SiO2 (7:1)85.914.1
Table 2. The crystallinity and crystallite size of the samples.
SampleCrystallinity (%)Crystallite Size 1 (nm)
AnataseRutile
TiO2 P2588.1715.30 ± 2.3820.24 ± 5.68
TiO2/SiO2 (1:1)87.4916.04 ± 2.4221.99 ± 6.35
TiO2/SiO2 (3:1)91.5416.14 ± 2.1425.65 ± 7.17
TiO2/SiO2 (7:1)92.5216.28 ± 2.3026.06 ± 2.52
1 Data are shown as the mean ± the standard deviation.
Table 3. Rietveld refinement parameters and unit cell parameters of the samples.
SchemeUnit Cell ParametersRietveld Refinement Parameters
AnataseRutileVariablesRexpRwpGoF
a = b (Å)c (Å)Volume (Å3)a = b (Å) c (Å)Volume (Å3)
TiO2 P253.78439.5040136.10434.59202.957062.3545122.654.222.53
TiO2/SiO2 (1:1)3.78799.5081136.43064.59612.958662.4995142.674,152.41
TiO2/SiO2 (3:1)3.78589.5040136.21234.59312.958962.4245262.743.451.58
TiO2/SiO2 (7:1)3.78589.5057136.24024.59342.598862.4286142.844.362.36
Table 4. Types of vibrations in TiO2 P25, TiO2/SiO2 composites with the ratio variation of 1:1, 3:1, and 7:1 based on the peaks that appear in each wavenumber.
Wavenumber (cm−1)Vibration Type
TiO2 P25TiO2/SiO2 (1:1)TiO2/SiO2 (3:1)TiO2/SiO2 (7:1)
3410343534333428-OH stretching
1634163316361635-OH bending
669686675667Ti–O–Ti stretching
-110311021101Si–O–Si stretching
-942not detectednot detectedTi–O–Si stretching
Table 5. The specific surface area of the photocatalyst.
CatalystBET Surface Area (m2/g)
TiO2 P2544.093
SiO2185.191
TiO2/SiO2 (1:1)63.890
TiO2/SiO2 (3:1)53.934
TiO2/SiO2 (7:1)46.019
Table 6. Data measurement results using a PSA (particle size analyzer).
Measurement ParametersParticle Size (nm)
TiO2 P25TiO2/SiO2 (1:1)TiO2/SiO2 (3:1)TiO2/SiO2 (7:1)
Mode236.6232.6204.5204.8
Mean251.7248.1220.1210.9
Median247.4240.7208.7206.6
Z-Average288.2322.8320.2223.4
PI0.3990.4340.3870.353
Table 7. The bandgap values of the photocatalyst.
CatalystBandgap Energy (eV)
TiO2 P25 Degussa3.02
TiO2/SiO2 (1:1)2.95
TiO2/SiO2 (3:1)2.96
TiO2/SiO2 (7:1)2.96
Table 8. Comparison of various TiO2/SiO2 composites with SiO2 sources and their applications.
CompositeSiO2 SourceSynthesis MethodApplicationRef.
TiO2/SiO2Tetraethylorthosilicate (TEOS)Sol-gelPhotocatalyst degrade of 2-methylisoborneol and geosmin[33]
TiO2/SiO2Hexagonal silica structuresSonochemistryPhotocatalyst for removal formaldehyde[43]
TiO2/SiO2SiO2 solPrecipitationPhotocatalytic oxidation of benzene[35]
TiO2/SiO2Rice husk silicaSelf-assemblyPhotocatalytic decolorization of methylene blue[30]
TiO2/SiO2Commercial SiO2 (cabot, axim and fly ash)Wet methodPhotocatalytic degradation of 2-propanol, NOx, and 4-nitrophenol[36]
TiO2/SiO2SiO2 powderSol-gelPhotocatalytic degradation of acid orange[44]
Table 9. Concentration and percentage of phenol removal over time.
Time (min)Phenol Concentration (mg.L−1)Percentage of Removal (%)
P25TiO2/SiO2 1:1TiO2/SiO2 3:1TiO2/SiO2 7:1P25TiO2/SiO2 1:1TiO2/SiO2 3:1TiO2/SiO2 7:1
020.0020.0020.0020.00----
6019.0915.7016.1116.784.6021.4819.4516.11
9012.9710.9710.349.8135.1345.1448.2850.95
1209.817.906.626.4150.9560.5266.9167.94
1508.175.992.801.4659.1370.1086.0292.72
1807.704.872.120.7961.5075.6589.4196.05
Table 10. The kinetic study of the photocatalysts.
PhotocatalystsKinetics Equationk1 (min−1) R2
TiO2 P25−ln (Ct/Ci) = 0.0076 t + 0.10620.00760.9279
TiO2/SiO2 (1:1)−ln (Ct/Ci) = 0.0098 t + 0.04860.00980.9896
TiO2/SiO2 (3:1)−ln (Ct/Ci) = 0.0179 t + 0.05040.01790.9785
TiO2/SiO2 (7:1)−ln (Ct/Ci) = 0.0267 t + 0.20400.02670.9558
Table 11. Comparison of the photocatalytic activity of this work with several previous reports of various TiO2 composites in phenol degradation.
CompositeInitial Concentration of Phenol (mg.L−1)Irradiation Time (min)Reaction Constant (min−1)Efficiency of Degradation (%)Ref.
TiO2/ZnO103000.002045.12[51]
TiO2/CoFe2O4401200.008162.17[52]
TiO2/C/CeO230240-27.00[53]
TiO2/Fe3O450180-70.00[54]
TiO2/Pumice11.5240-35.71[55]
TiO2/Biochar50240-64.1[56]
TiO2/EDTA/Chitosan1002400.0102100[57]
TiO2/Pt40900.010265.11[58]
TiO2/SiO2201200.026796.05This work
Publisher’s Note: MDPI stays neutral with regard to jurisdictional claims in published maps and institutional affiliations.

