
Lightning Surge Analysis for Overhead Lines Considering Corona Effect


Abstract
:1. Introduction
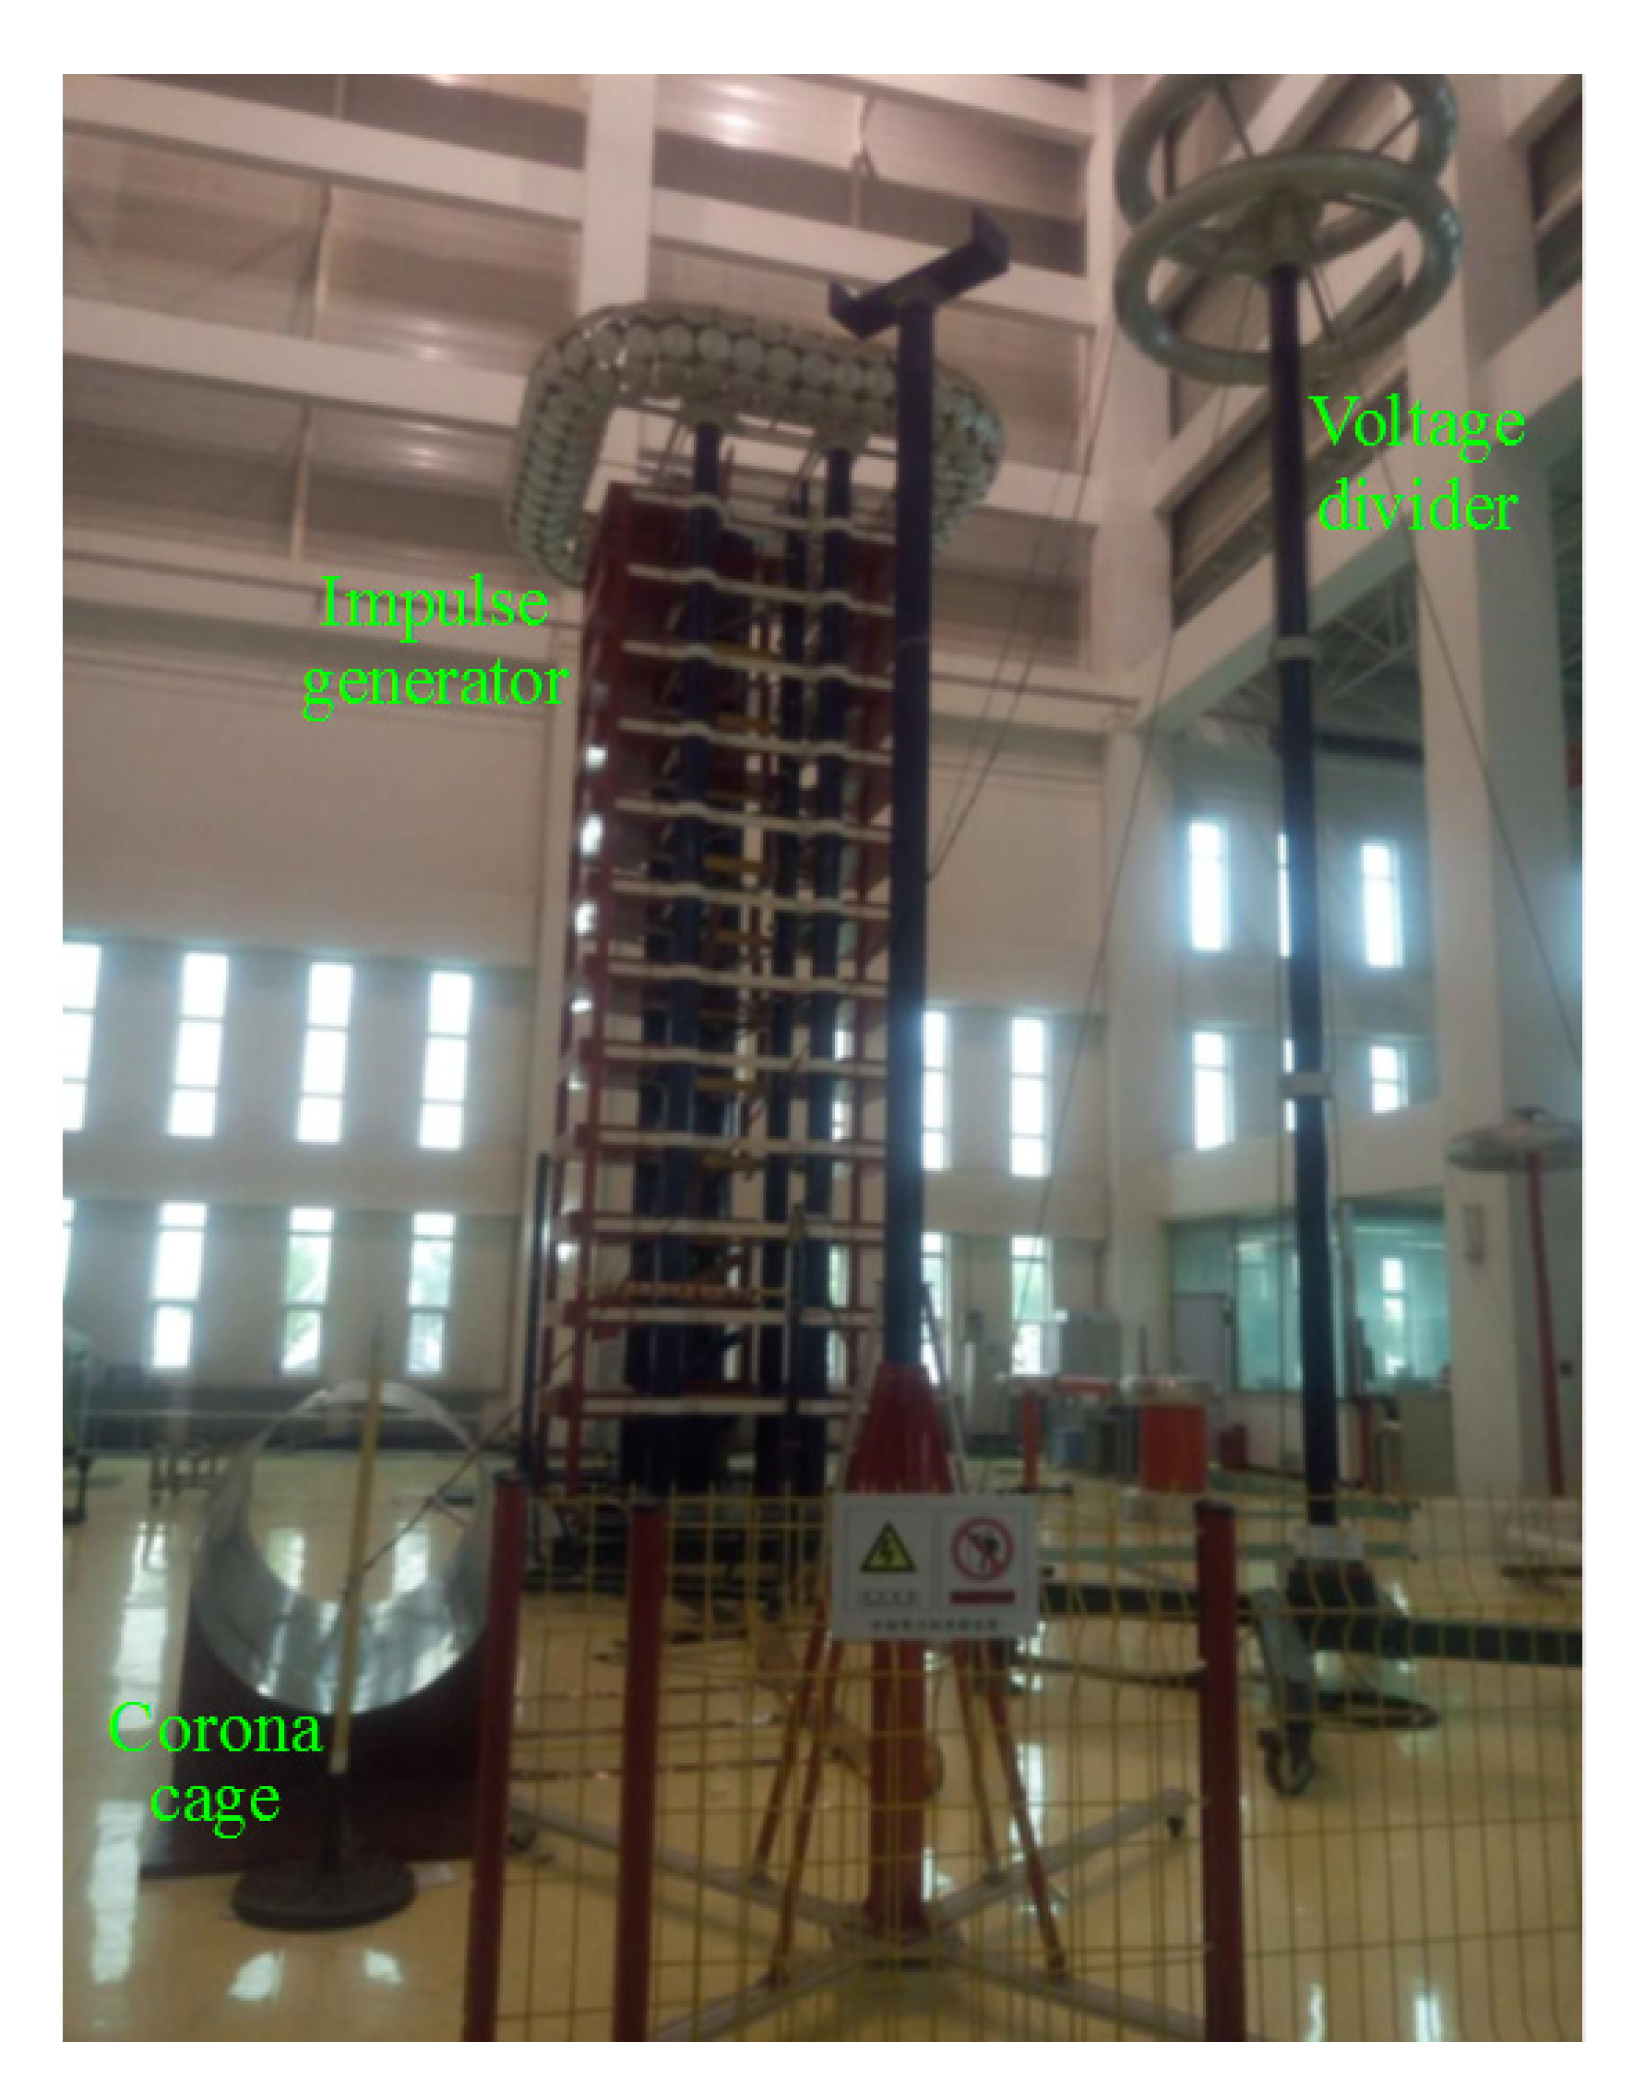
2. Experimental Investigation on Corona Characteristics
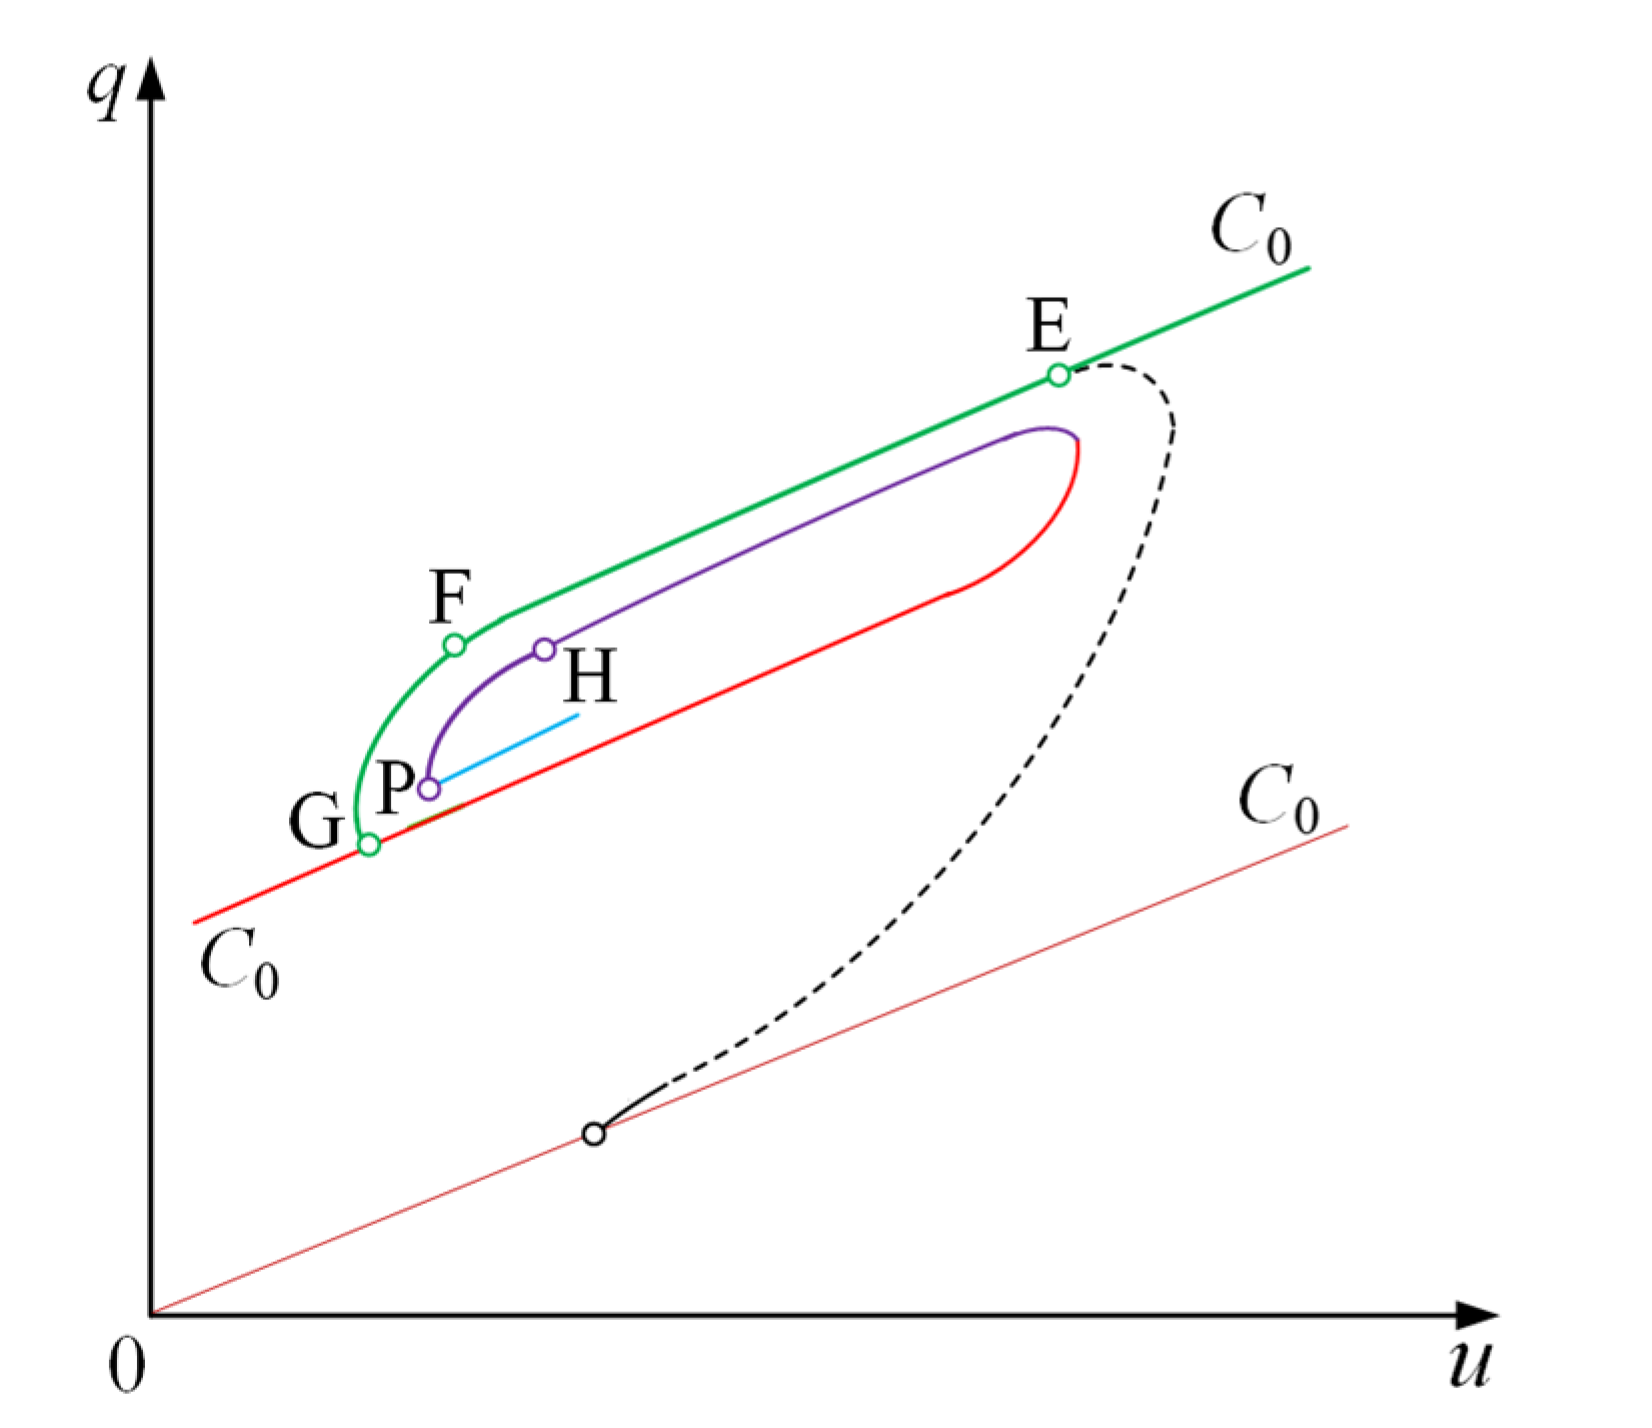
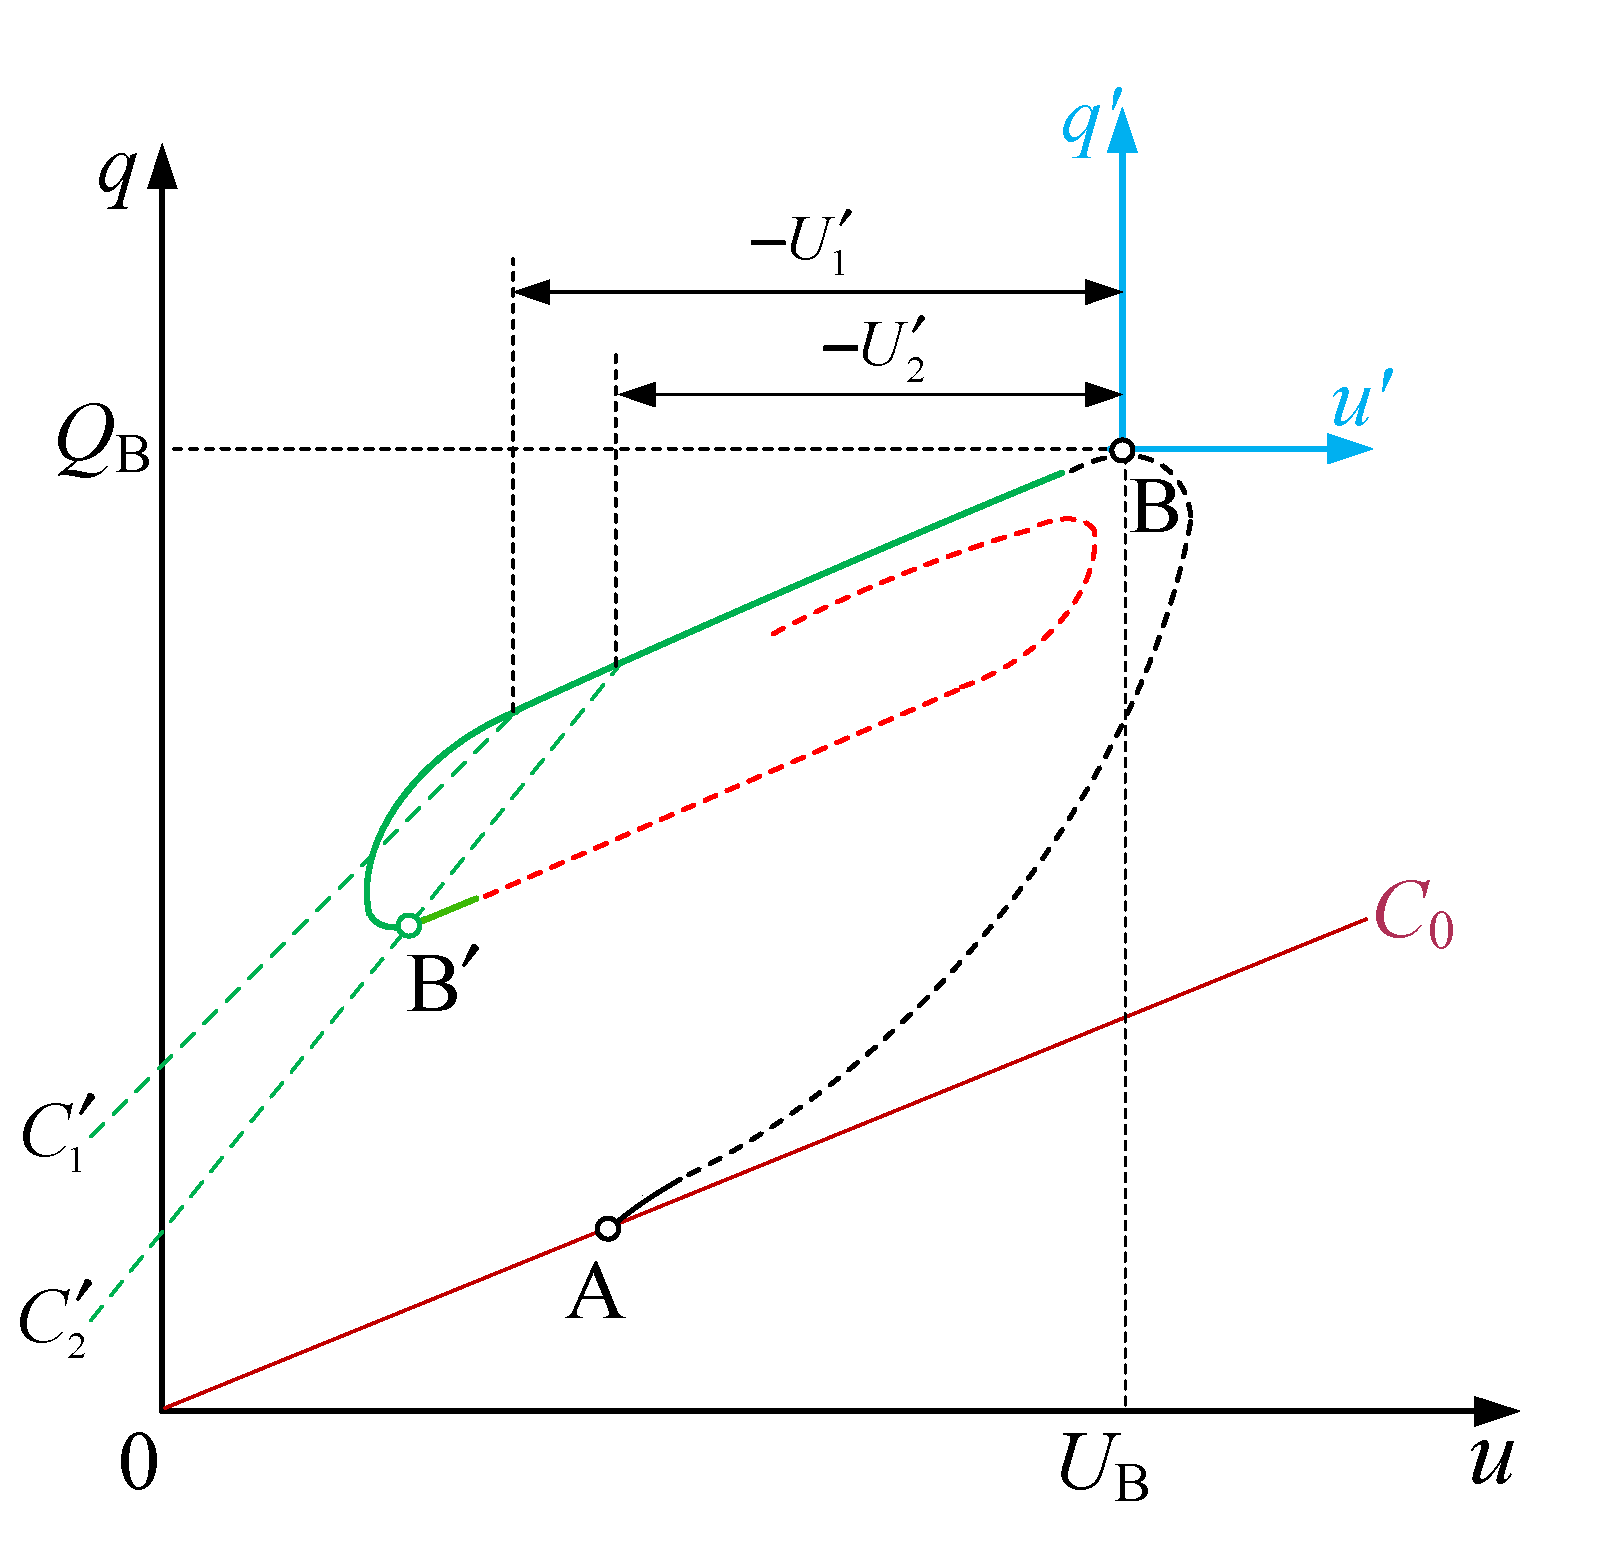
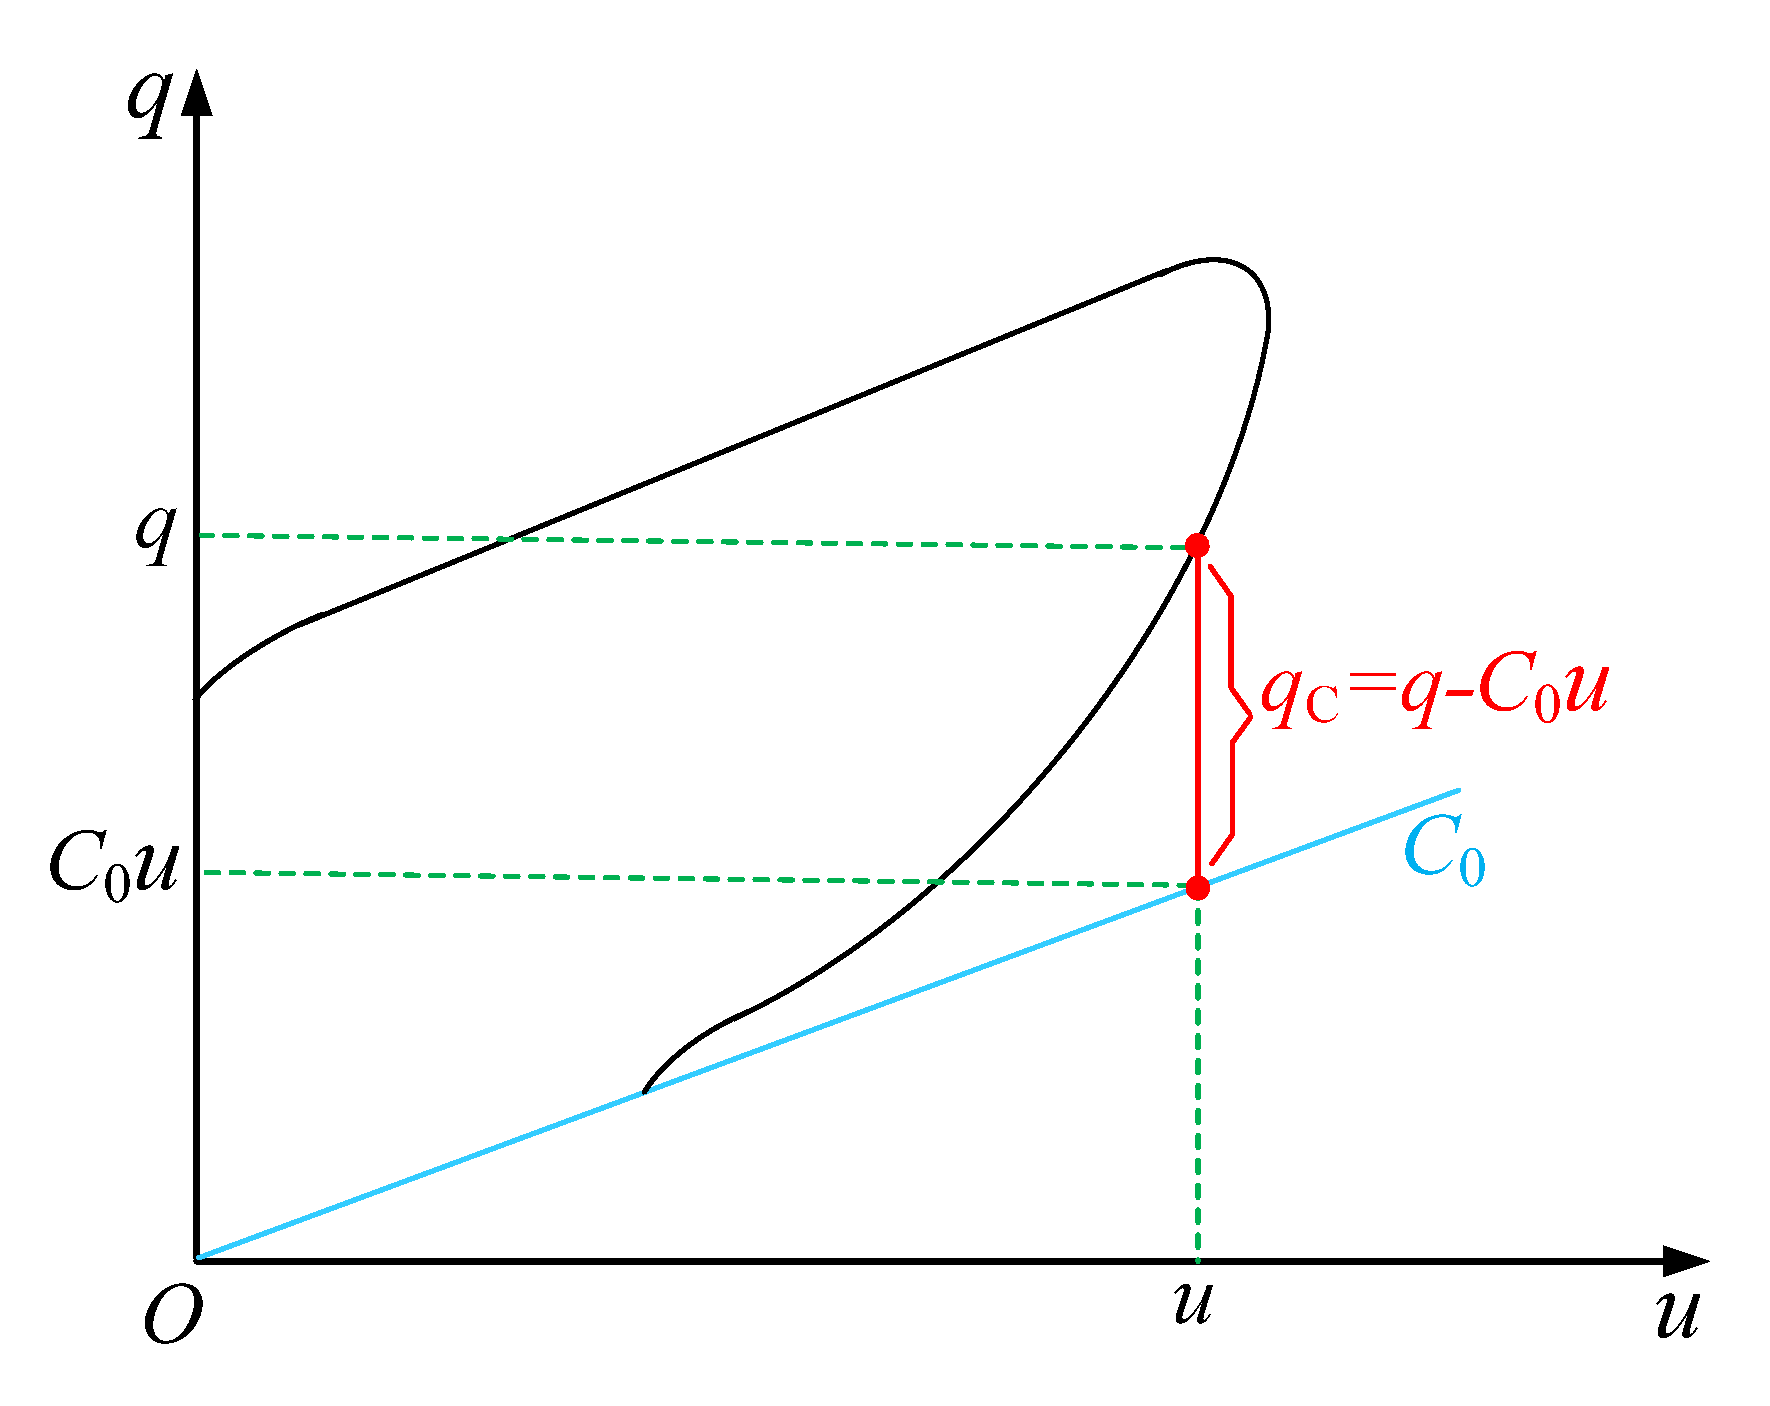
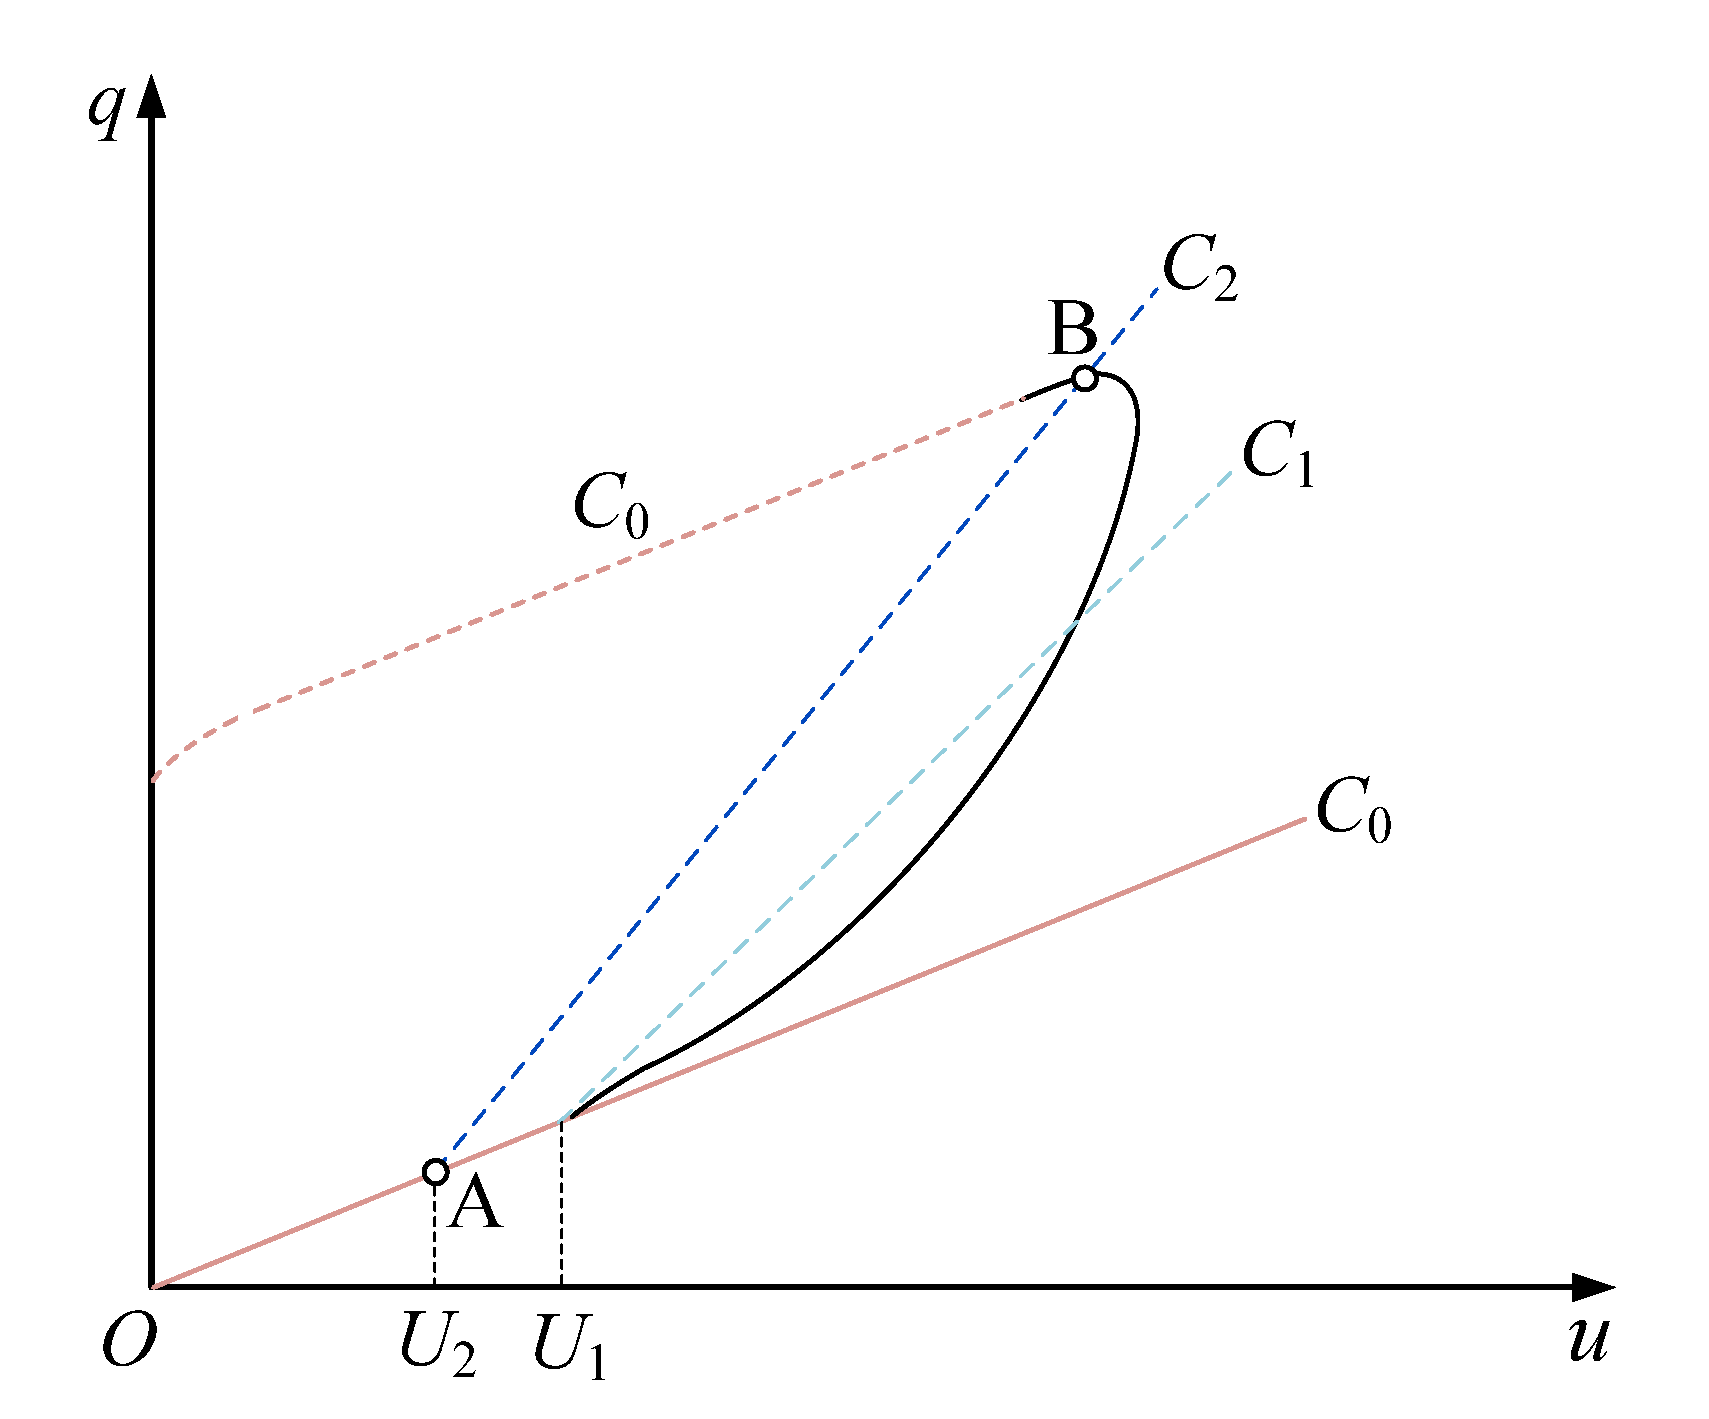
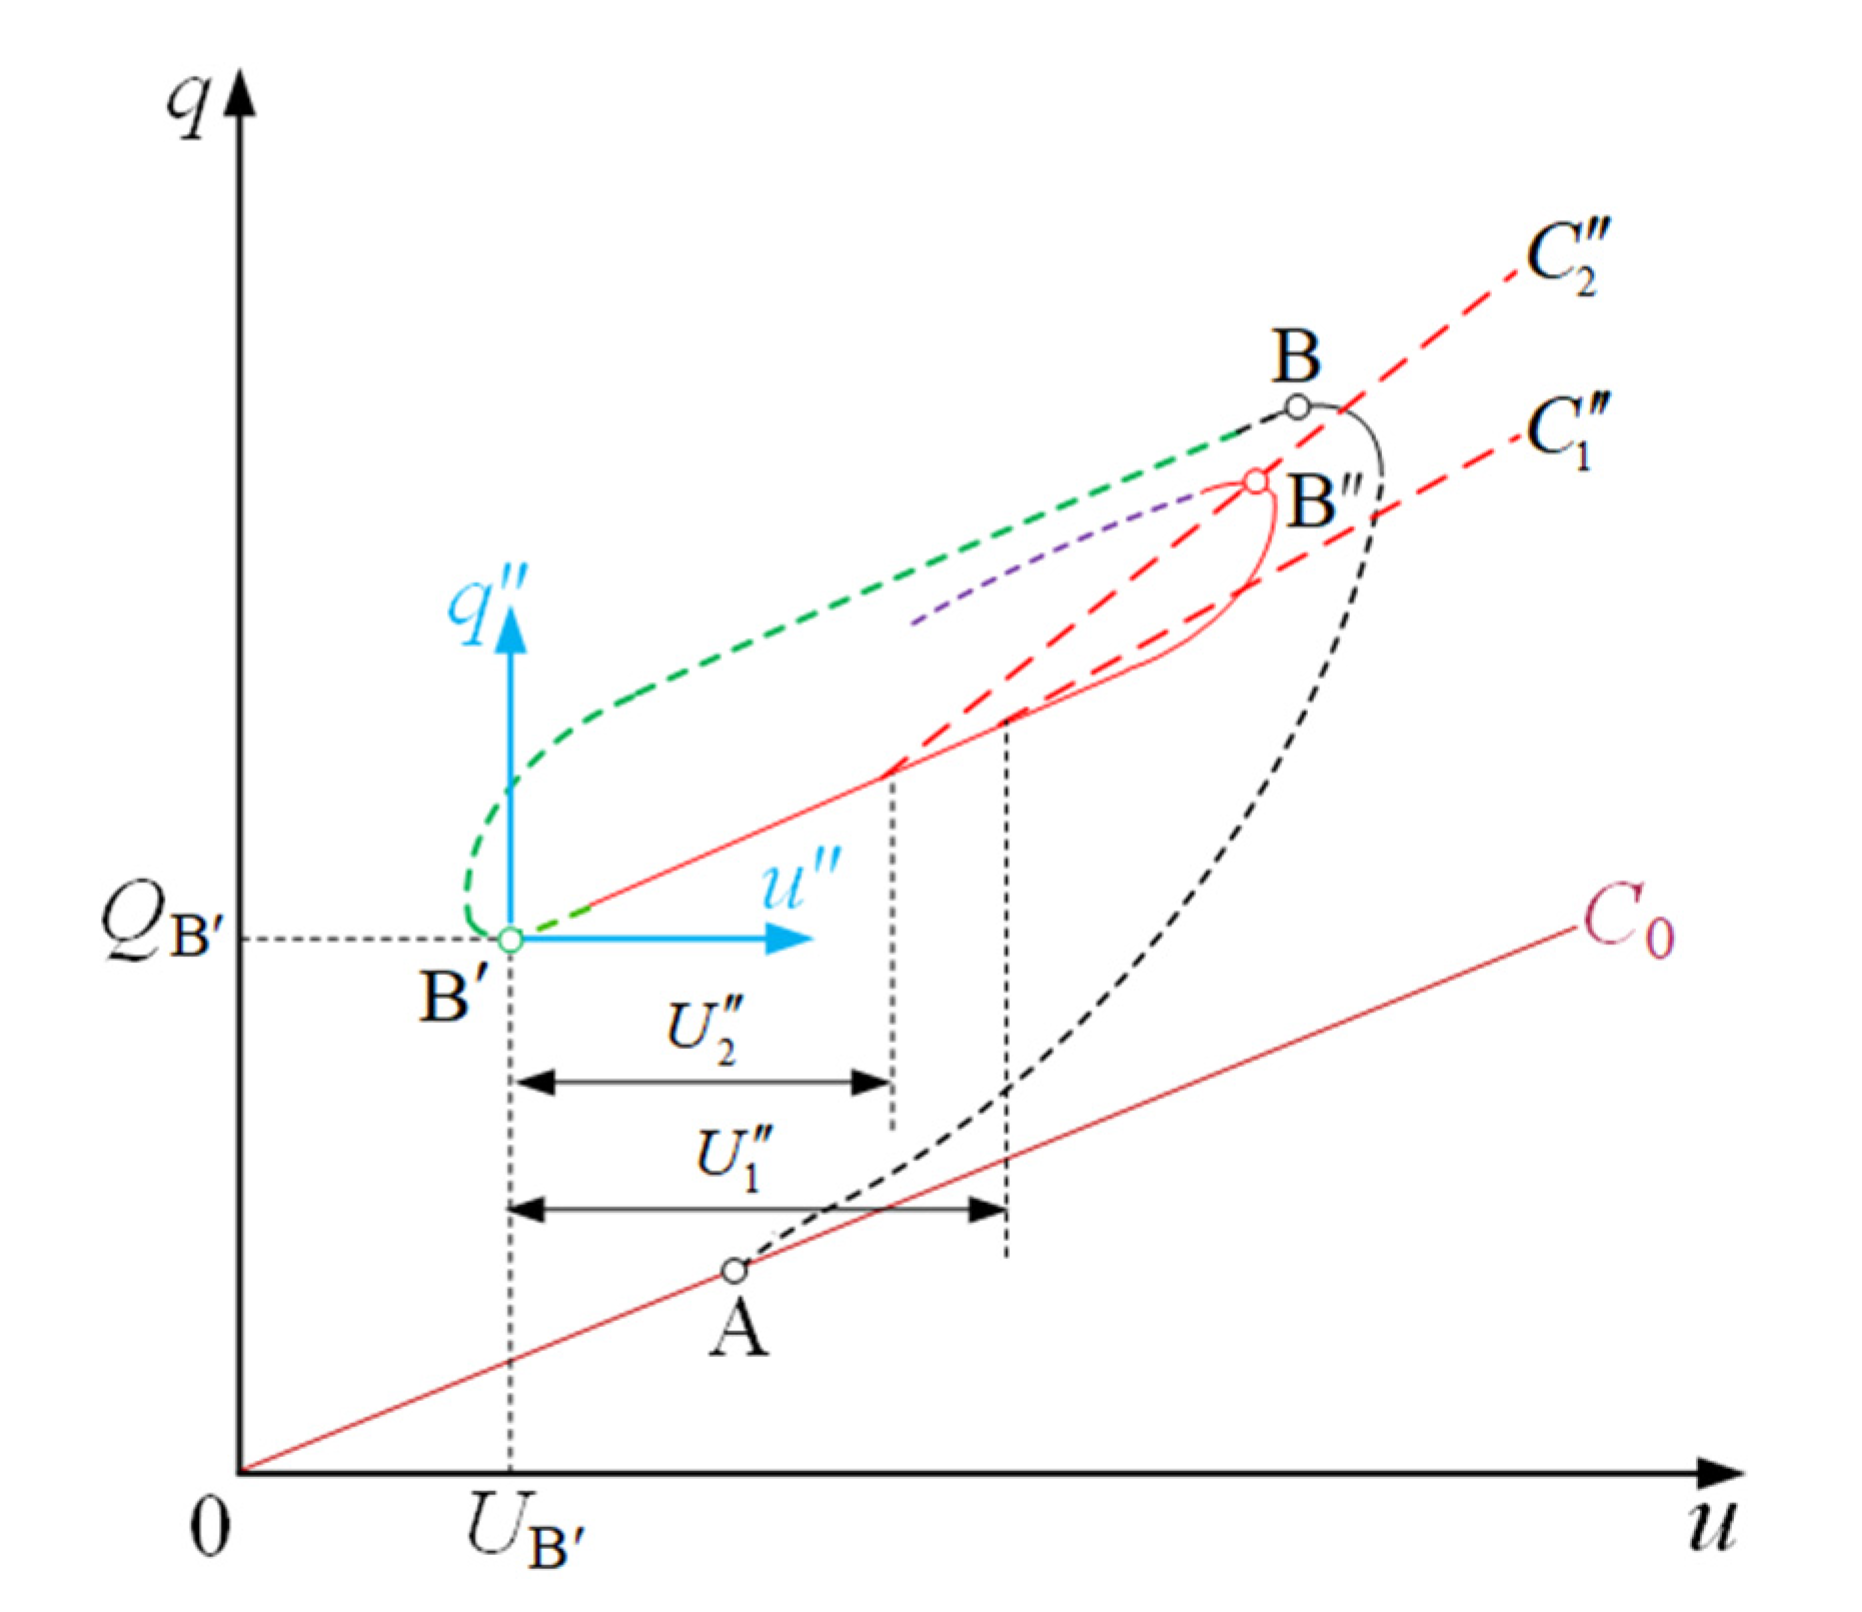
3. Modeling of Corona q–u Curves
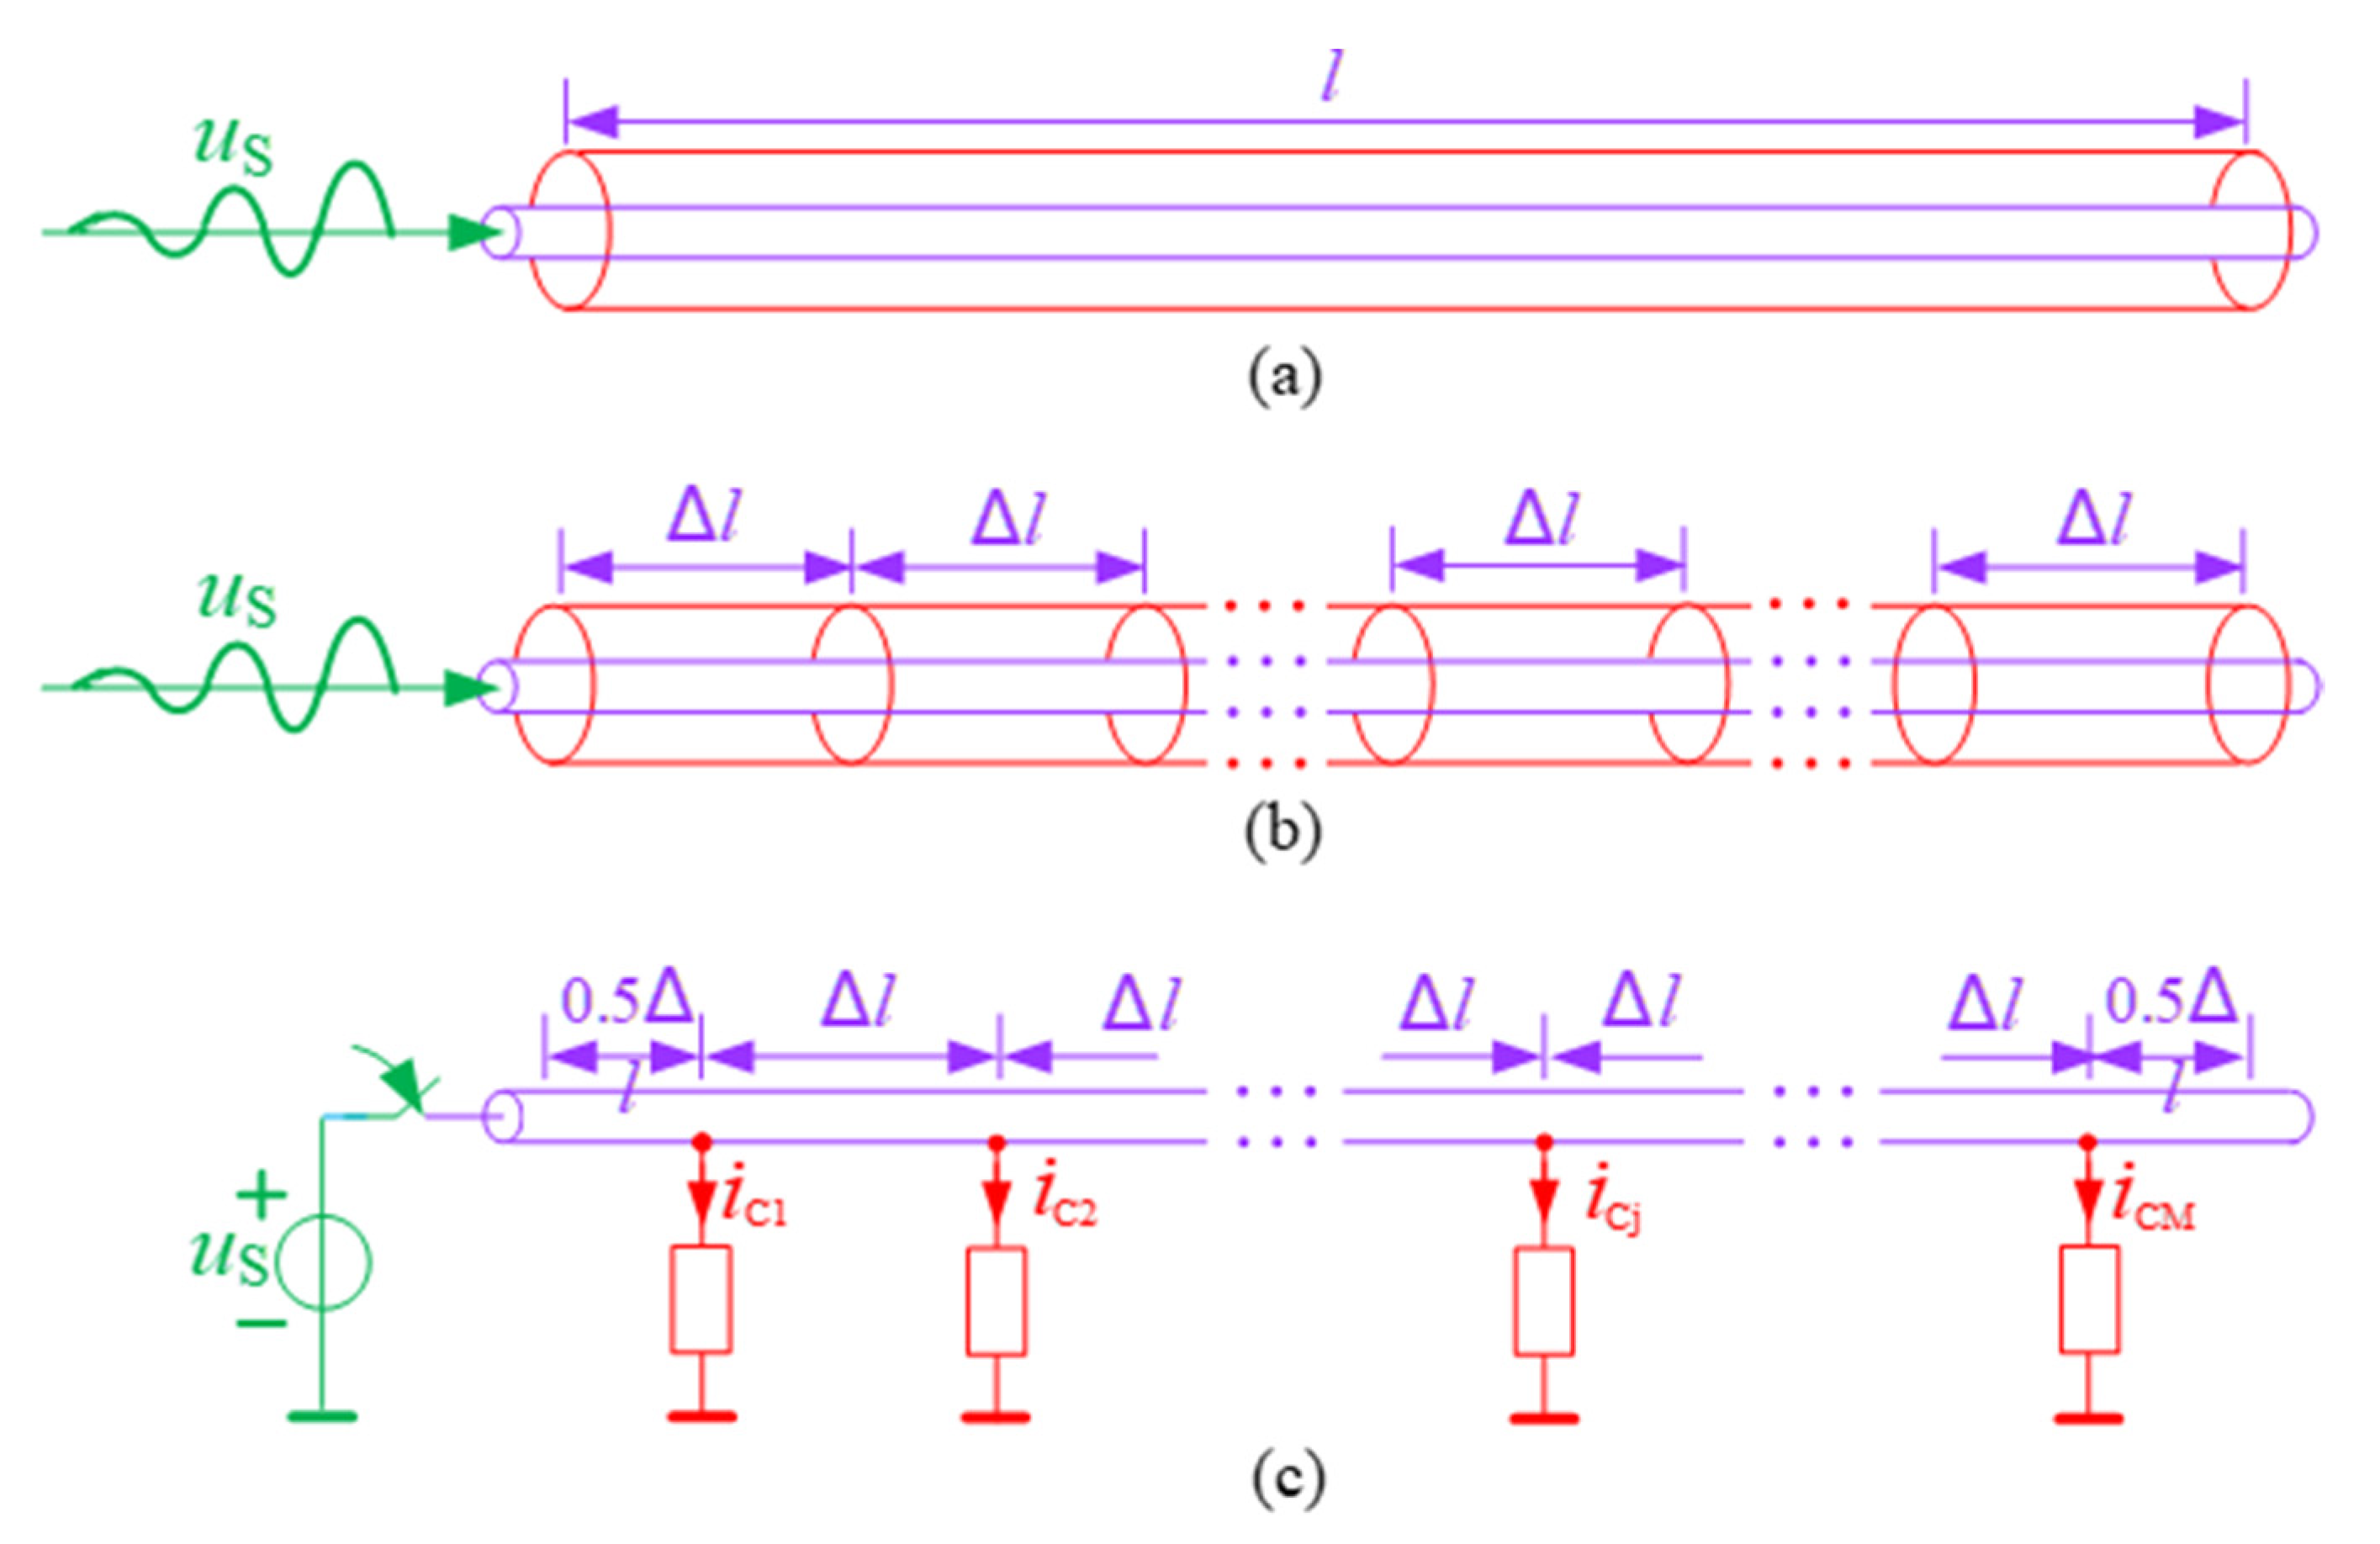
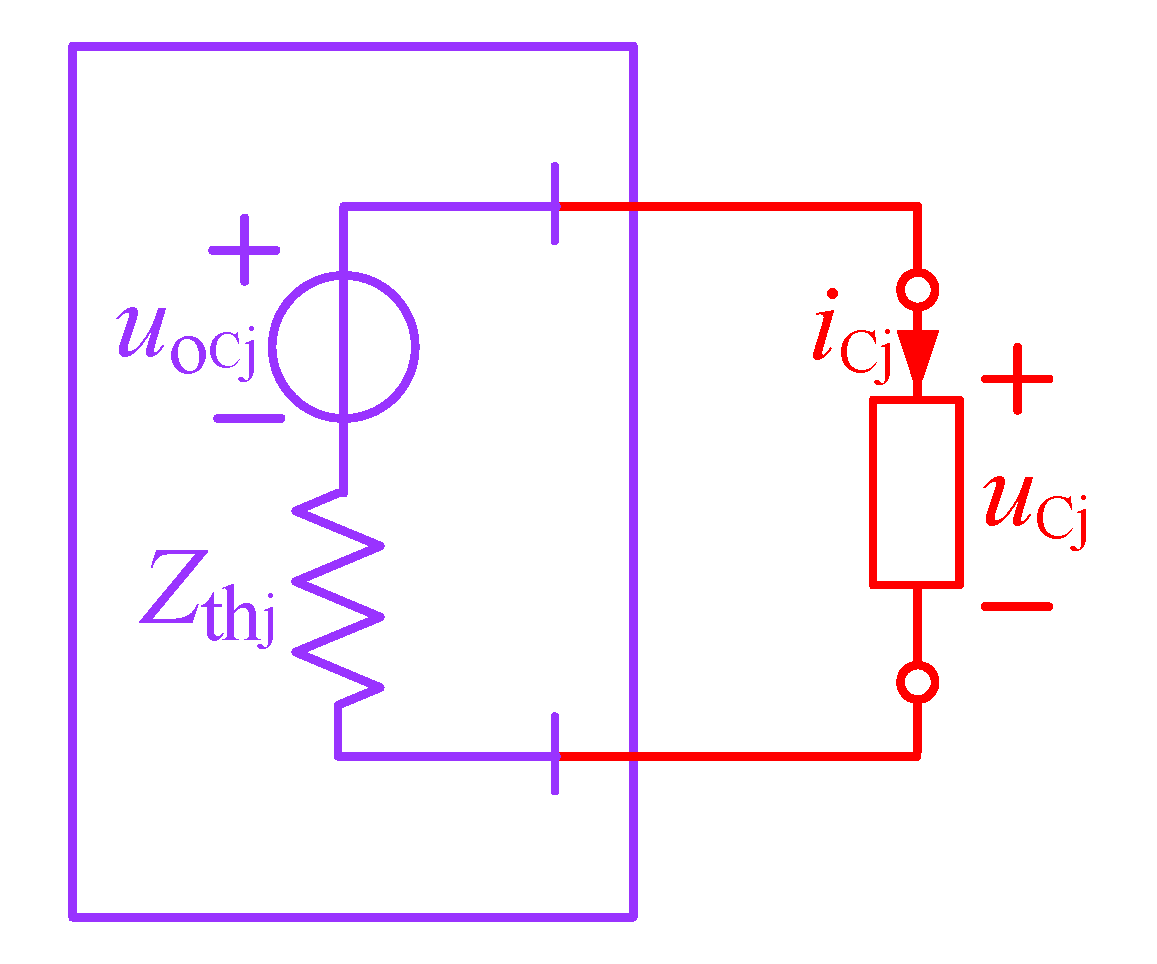
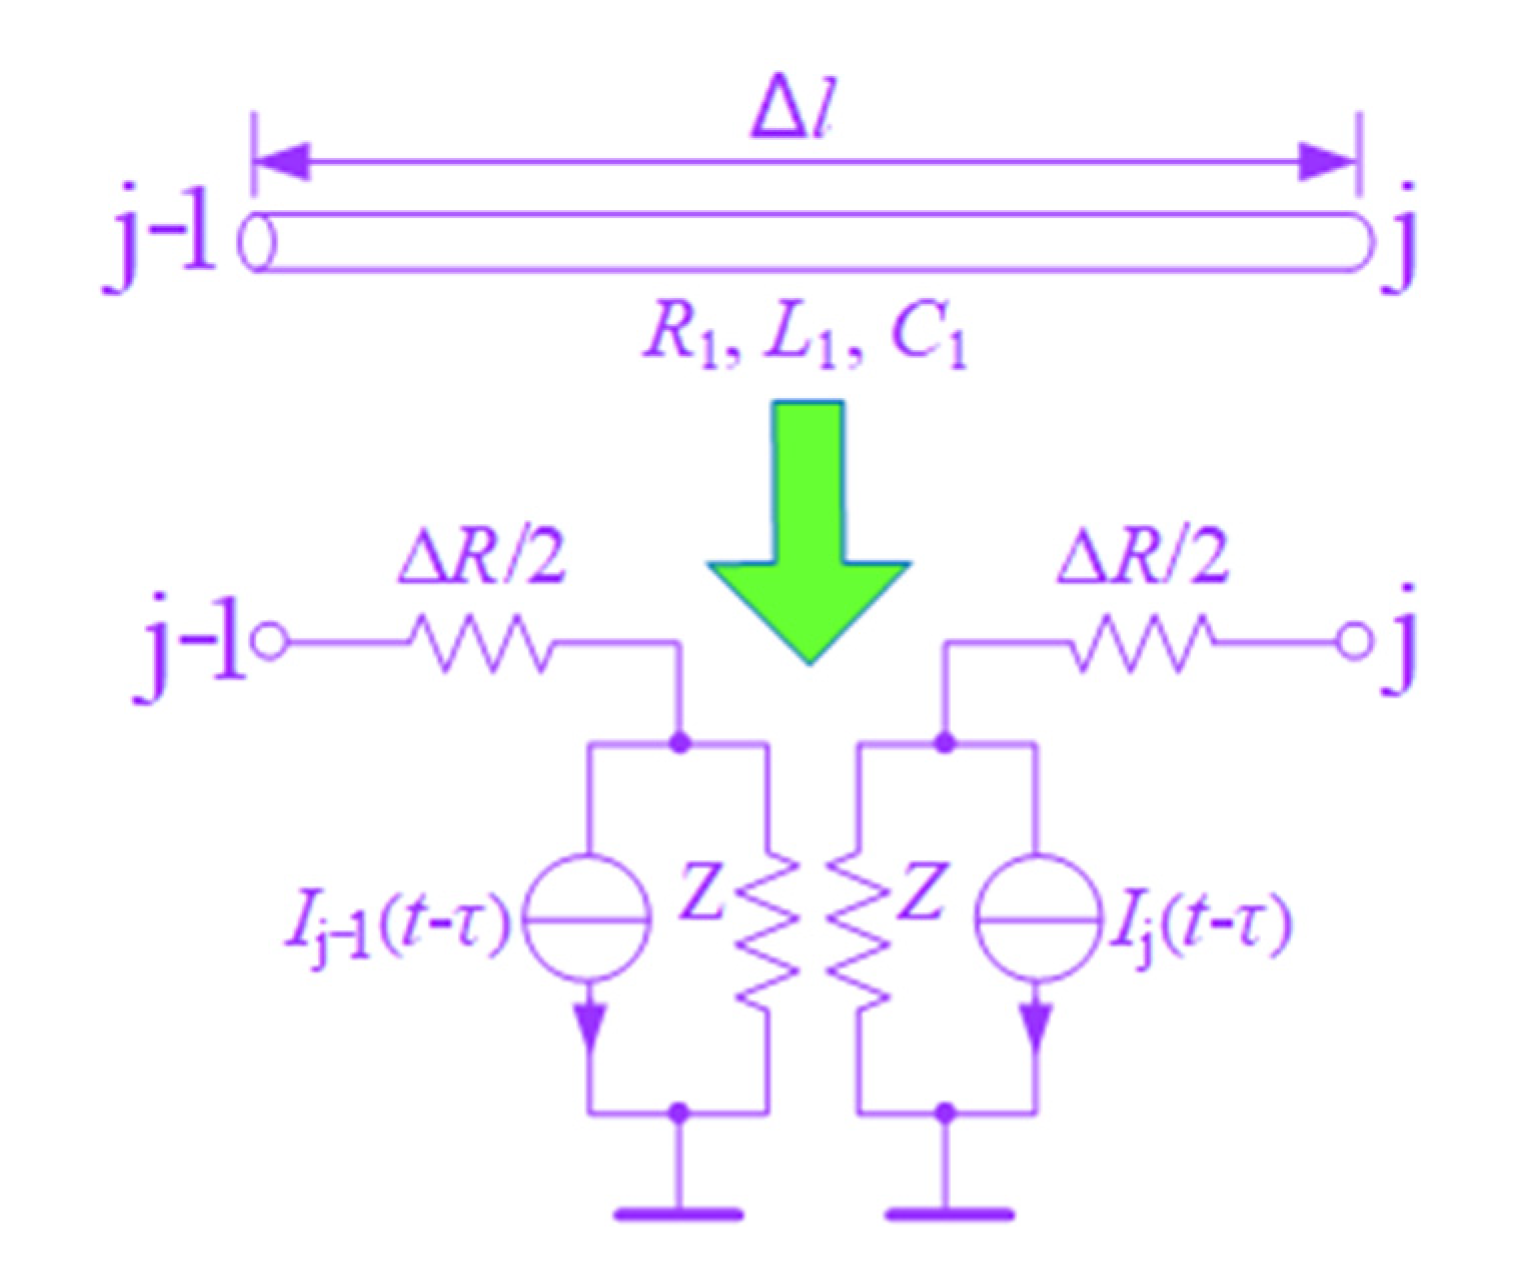
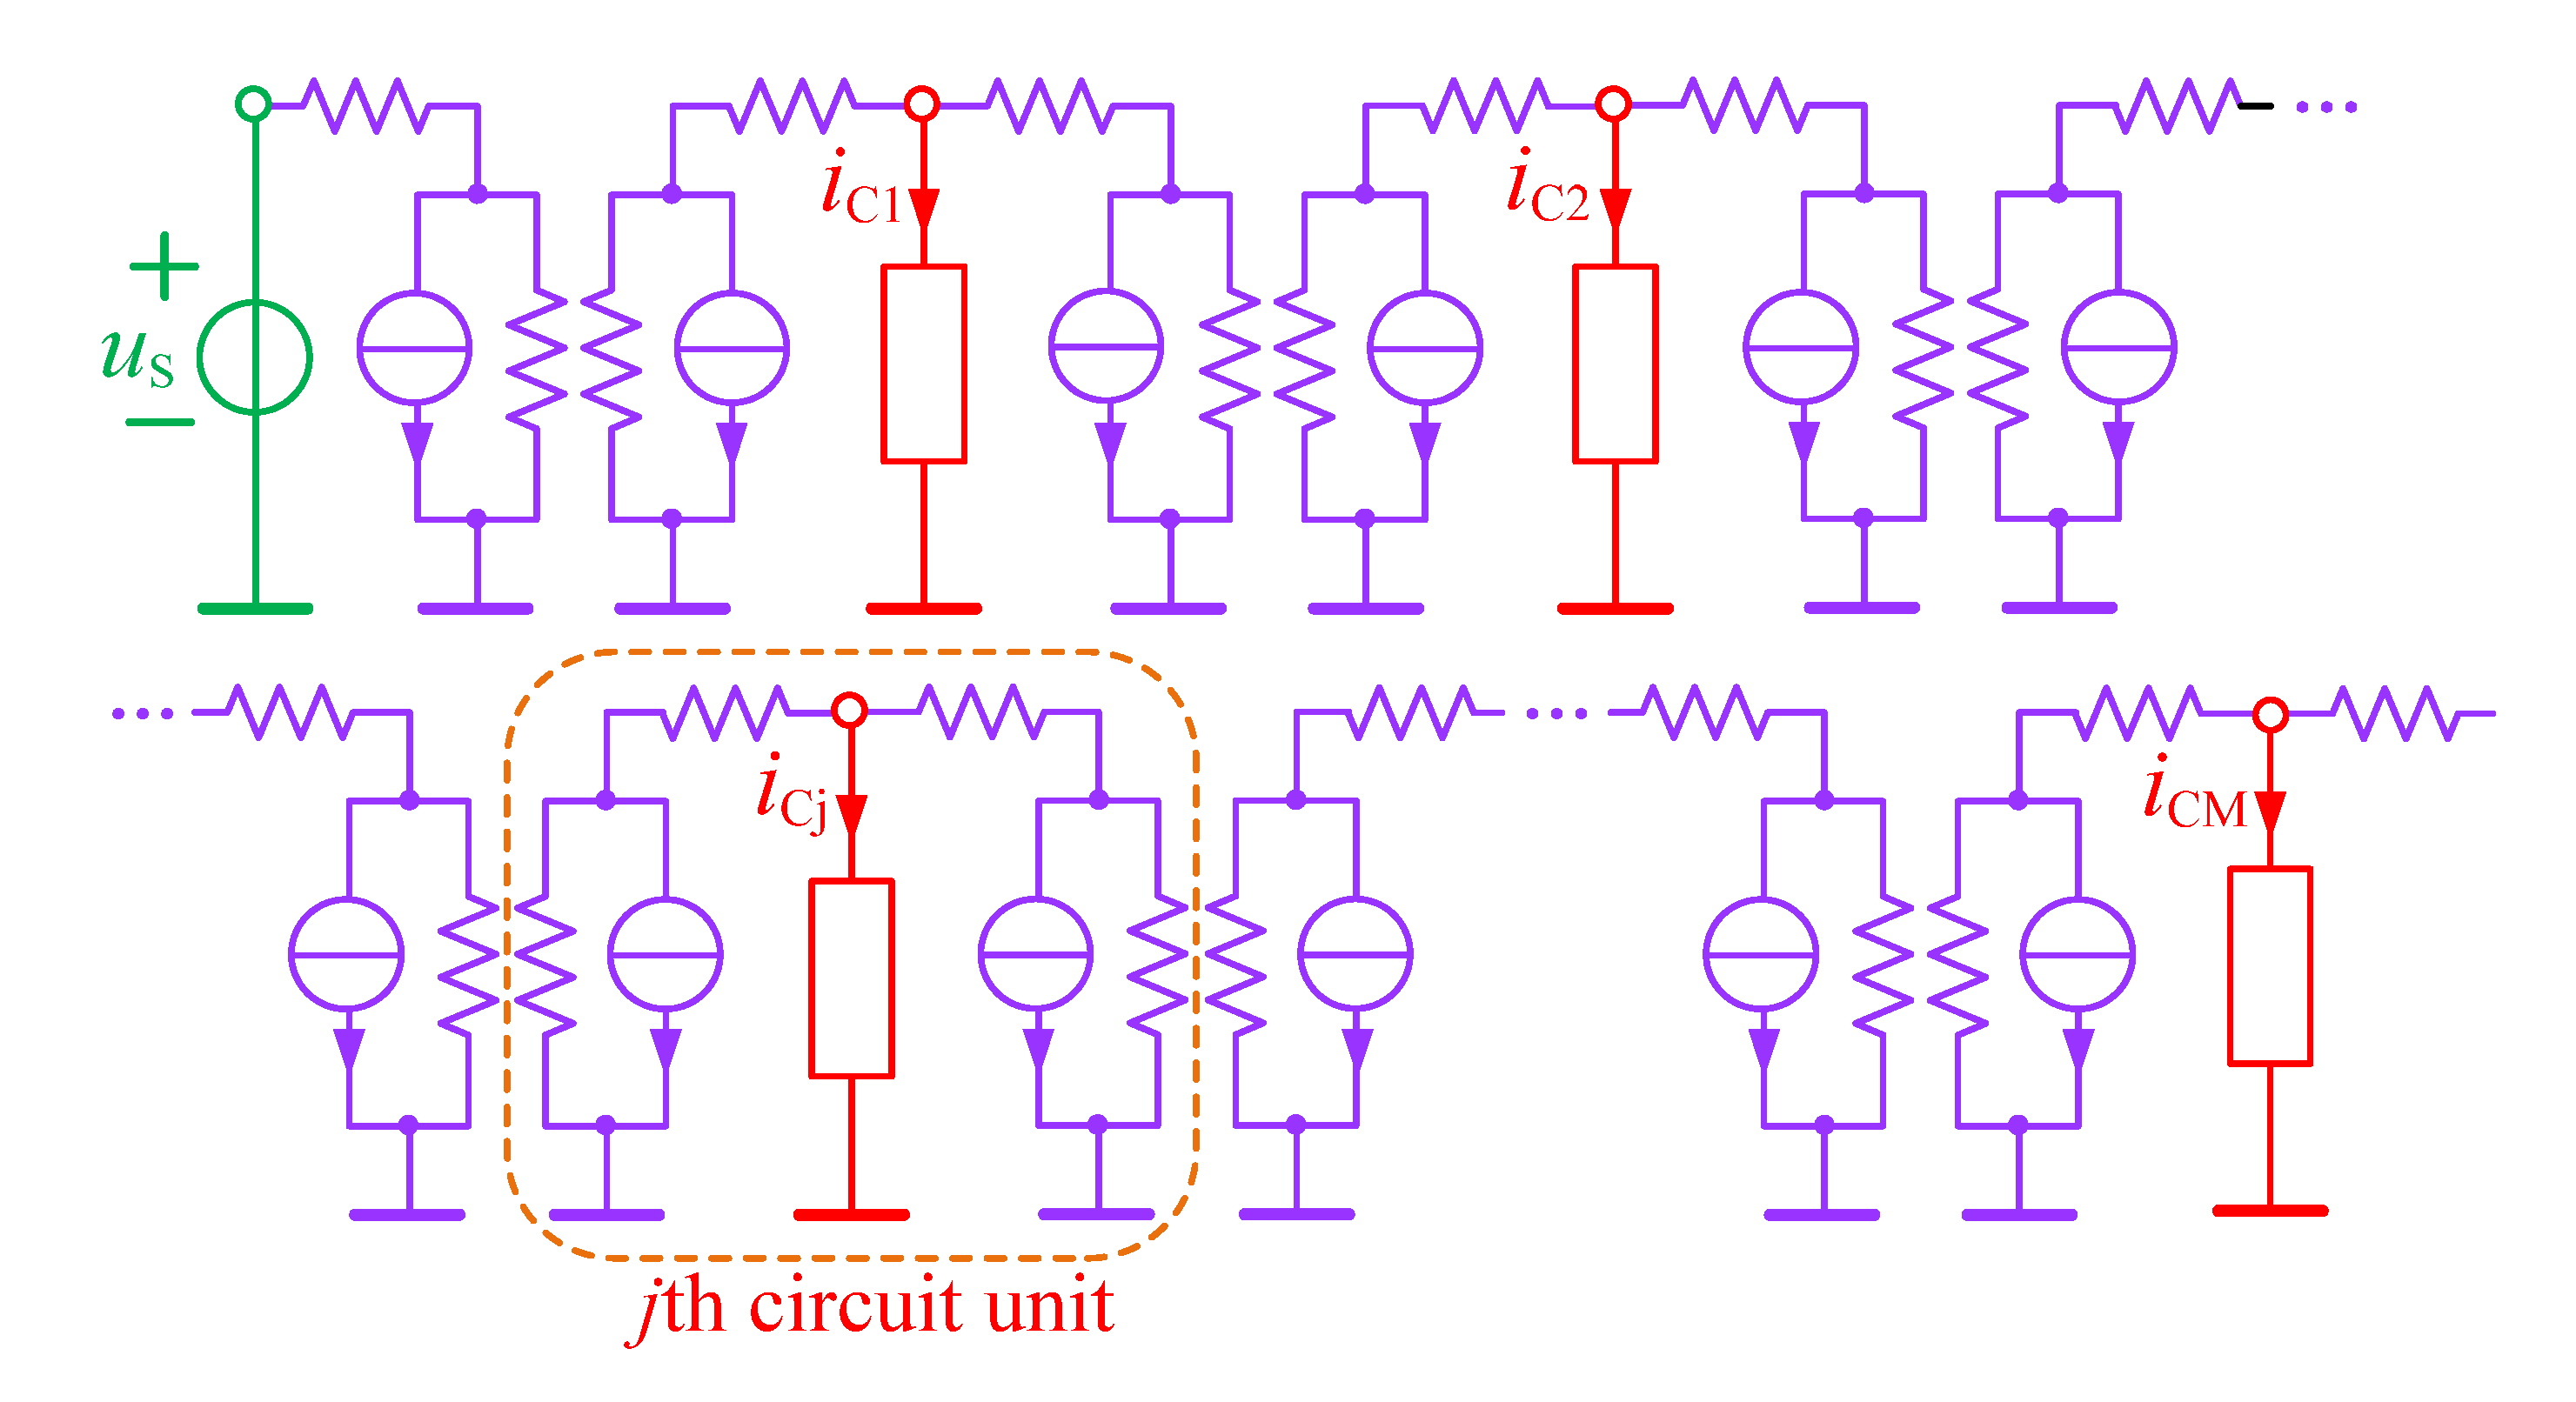
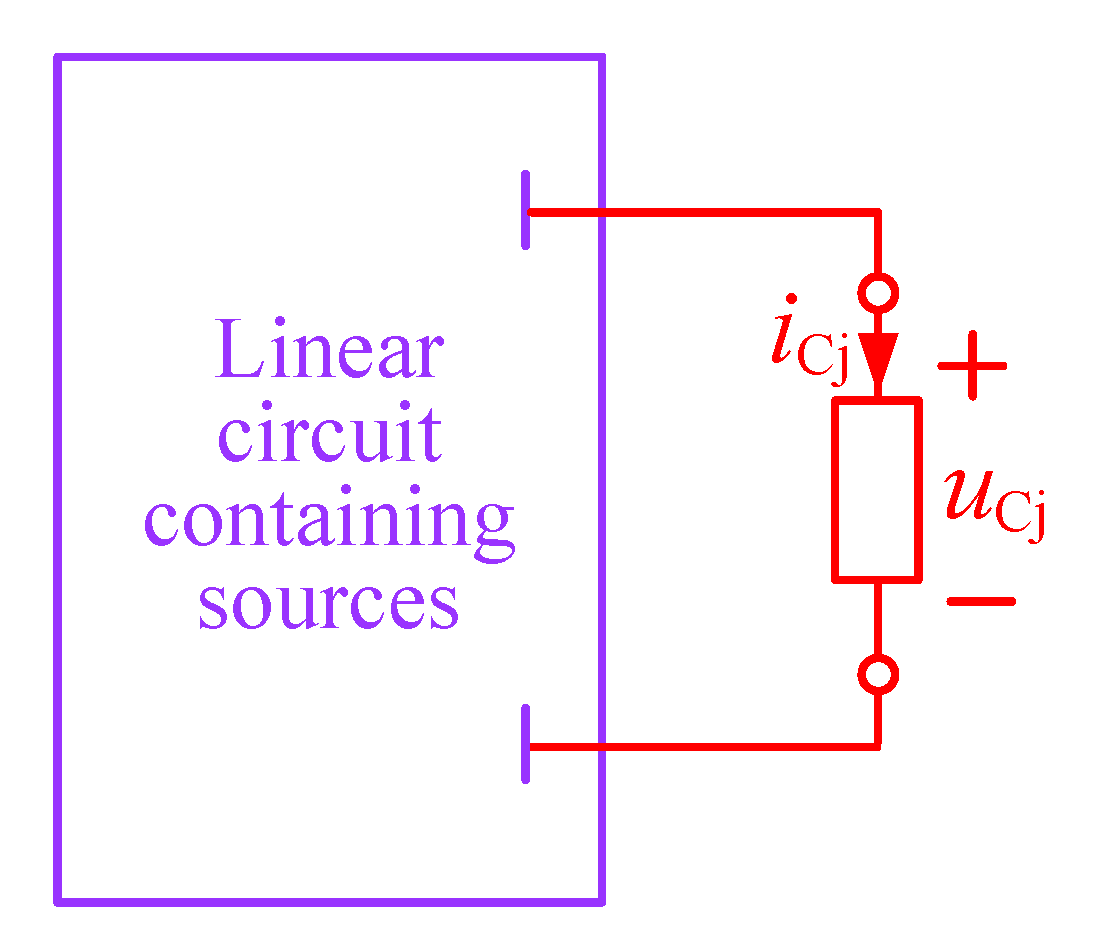
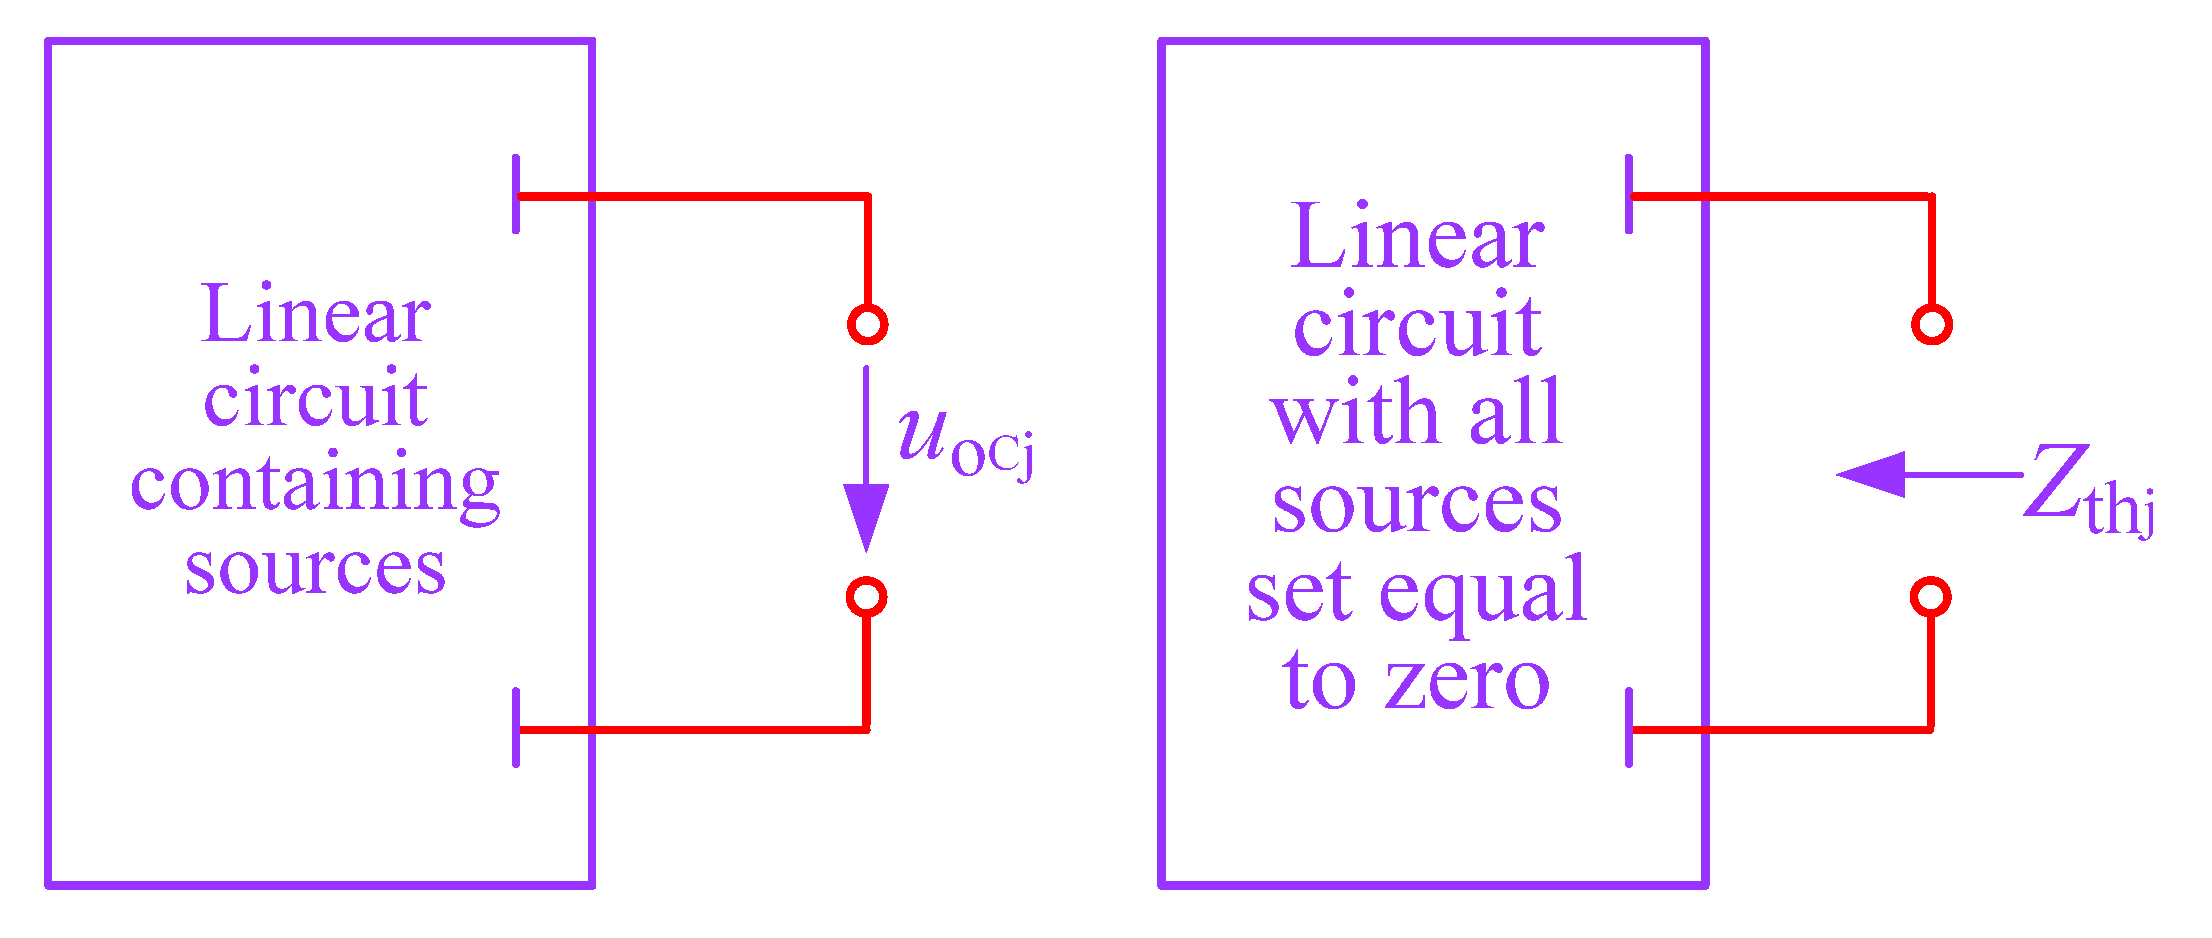
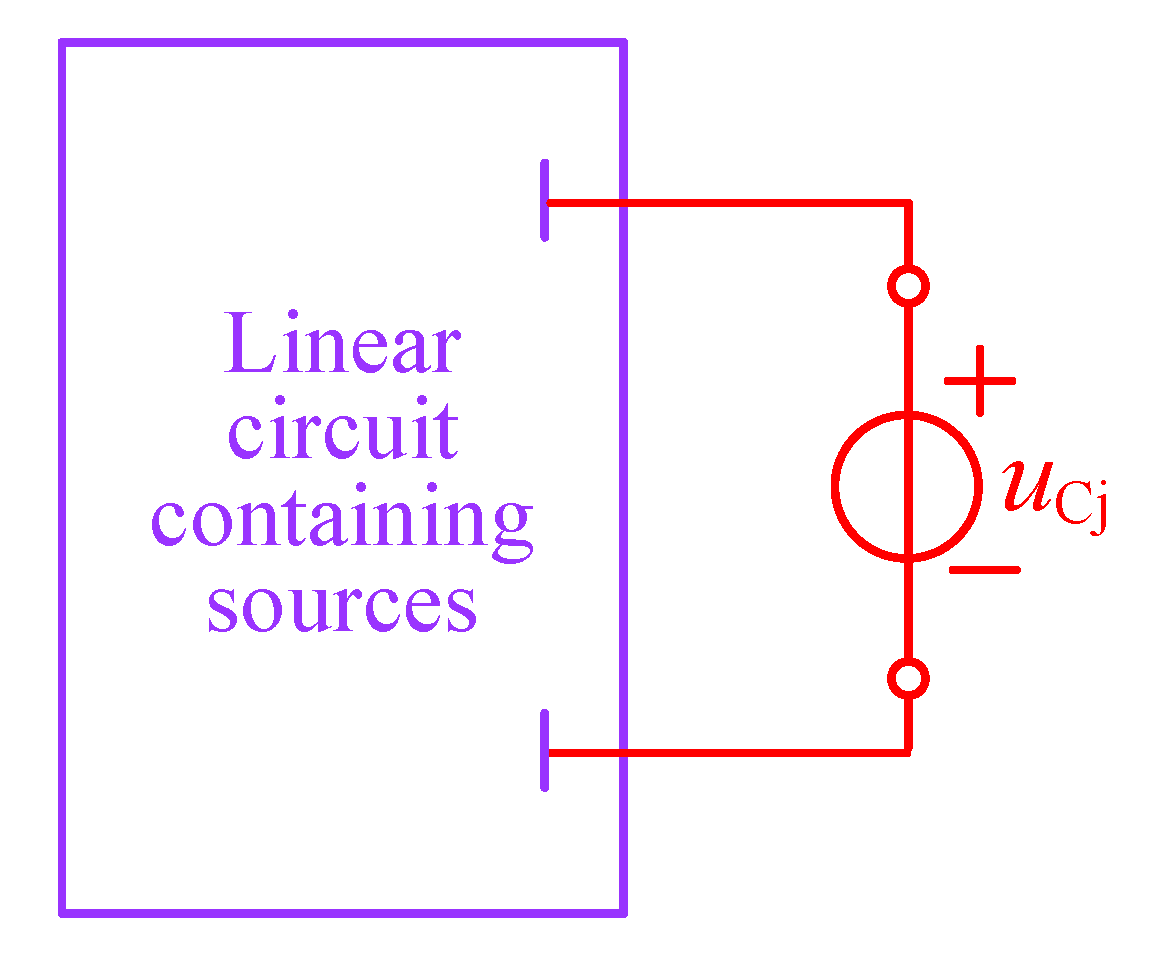
4. Transient Calculation Considering Corona Effect
5. Calculated Results and Discussions
6. Conclusions
Author Contributions
Funding
Institutional Review Board Statement
Informed Consent Statement
Data Availability Statement
Conflicts of Interest
References
- Said, A.; Anane, Z. Corona lightning overvoltage analysis for 500kV hybrid line. IET Gener. Transm. Distrib. 2020, 14, 532–541. [Google Scholar] [CrossRef]
- Mestriner, D.; Brignone, M. Corona effect influence on the lightning performance of overhead distribution lines. Appl. Sci. 2020, 10, 4902. [Google Scholar] [CrossRef]
- Yutthagowitha, P.; Tran, T.H.; Baba, Y.; Ametani, A.; Rakov, V.A. PEEC simulation of lightning overvoltage surge with corona discharges on the overhead wires. Electr. Power Syst. Res. 2020, 180, 106118. [Google Scholar] [CrossRef]
- Abouelatta, M.A.; Ward, S.A.; Sayed, A.M.; Mahmoud, K.; Lehtonen, M.; Darwish, M.M.F. Measurement and assessment of corona current density for HVDC bundle conductors by FDM integrated with full multigrid technique. Electr. Power Syst. Res. 2021, 199, 107370. [Google Scholar] [CrossRef]
- Abouelatta, M.A.; Ward, S.A.; Sayed, A.M.; Mahmoud, K.; Lehtonen, M.; Darwish, M.M.F. Fast corona discharge assessment using FDM integrated with full multigrid method in HVDC transmission lines considering wind Impact. IEEE Access 2020, 8, 225872–225883. [Google Scholar] [CrossRef]
- Abdel-Gawad, N.M.K.; Shaalan, E.M.; Darwish, M.M.F.; Basuny, M.A.M. Influence of fault locations on the pipeline induced voltages near to power transmission lines. In Proceedings of the 2019—21st International Middle East Power Systems Conference (MEPCON), Cairo, Egypt, 17–19 December 2019; pp. 761–767. [Google Scholar]
- Yang, P.C.; Chen, S.M.; He, J.L. Lightning impulse corona characteristic of 1000-kV UHV transmission lines and its influences on lightning overvoltage analysis results. IEEE Trans. Power Deliv. 2013, 28, 2518–2525. [Google Scholar] [CrossRef]
- Maruvad, P.S.; Menemenlis, H.; Malewaki, R. Corona characteristics of conductor bundles under impulse voltages. IEEE Trans. Power App. Syst. 1977, 96, 102–114. [Google Scholar] [CrossRef]
- Podporkin, G.V.; Sivaev, A.D. Lightning impulse characteristics of conductors and bundles. IEEE Trans. Power Deliv. 1997, 12, 1842–1847. [Google Scholar] [CrossRef]
- Bochkovskii, V.V. Impulse corona on single and bundled conductors. Elektrichestvo 1966, 7, 22–27. [Google Scholar]
- Carneiro, S.; Marti, J.R. Evaluation of corona and line models in electromagnetic transients simulations. IEEE Trans. Power Deliv. 1991, 6, 334–342. [Google Scholar] [CrossRef]
- He, J.L.; Zhang, X.; Yang, P.H.; Chen, S.M.; Zeng, R. Attenuation and deformation characteristics of lightning impulse corona traveling along bundled transmission lines. Electr. Power Syst. Res. 2015, 118, 29–36. [Google Scholar] [CrossRef]
- Araneo, R.; Maccioni, M.; Lauria, S.; Geri, A.; Gatta, F.M.; Celozzi, S. Comparison of corona models for computing the surge propagation in multiconductor power lines. In Proceedings of the 2016 IEEE 16th International Conference on Environment and Electrical Engineering (EEEIC), Florence, Italy, 7–10 June 2016; pp. 1–6. [Google Scholar]
- Ozawa, J.; Ohsaki, E.; Ishii, M.; Kojima, S.; Ishihara, H.; Kouno, T.; Kawamura, T. Lightning surge analysis in a multi-conductor system for substation insulation design. IEEE Trans. Power App. Syst. 1985, PAS-104, 2244–2254. [Google Scholar] [CrossRef]
- Takami, J.; Okabe, S.; Zaima, E. Study of lightning surge overvoltages at substations due to direct lightning strokes to phase conductors. IEEE Trans. Power Deliv. 2010, 25, 425–433. [Google Scholar] [CrossRef]
- Rickard, D.A.; Harid, N.; Waters, R.T. Modelling of corona at a high-voltage conductor under double exponential and oscillation impulses. IEE Proc.-Sci. Meas. Technol. 1996, 143, 277–284. [Google Scholar] [CrossRef]
- Zayients, S.L.; Kostenko, M.V.; Lyapin, A.G. An experimental investigation on the deformation of travelling wave due to impulse corona. Bull. Polytech. Inst. Leningr. 1958, 195, 342–372. [Google Scholar]
- Hang, K.J.; Zhang, X.Q. An experimental study on corona q–u curves under non–standard lightning impulses. J. Electrost. 2016, 81, 37–41. [Google Scholar] [CrossRef]
- Ananea, Z.; Bayadia, A.; Haridb, N. A dynamic corona model for EMTP computation of multiple and non-standard impulses on transmission lines using a type-94 circuit component. Electr. Power Syst. Res. 2018, 163, 133–139. [Google Scholar] [CrossRef]
- Mihailescu-Suliciu, M.; Suliciu, I. A rate type constitutive equation for the description of the corona effect. IEEE Trans. Power App. Syst. 1981, PAS-100, 3681–3685. [Google Scholar] [CrossRef]
- Zhang, X.Q. A realistic corona model for lightning transient studies. Electr. Mach. Power Syst. 1994, 22, 105–112. [Google Scholar]
- Davis, R.; Cook, R.W.E.; Standring, W.G. The surge corona discharge. Proc. IEE-Part C Monogr. 1961, 108, 230–239. [Google Scholar] [CrossRef]
- Maruvad, P.S.; Nguyen, D.H.; Hamadani-Zadeh, H. Studies on modeling corona attenuation of dynamic overvoltages. IEEE Trans. Power Deliv. 1989, 4, 1441–1449. [Google Scholar] [CrossRef]
- Huang, W.G.; Semlyen, A. Computation of electromagnetic transients on three-phase transmission lines with corona and frequency dependent parameters. IEEE Trans. Power Deliv. 1987, 2, 887–898. [Google Scholar] [CrossRef]
- Nawi, Z.M.; Ab Kadir, M.Z.A.; Azis, N.; Ahmad, W.F.; Rawi, I.N.; Ungku Amiruldm, A.U.; Nordin, F.H. Comparative analysis of ACSR and ACCC conductors on corona effect for lightning surge studies. In Proceedings of the 11th Asia-Pacific International Conference on Lightning, Hong Kong, China, 12–14 June 2019; pp. 1–5. [Google Scholar]
- Dommel, H.W. Electromagnetic Transients Program Theory Book; BPA: Portland, OR, USA, 1995; pp. 3–19. [Google Scholar]
- Sundaram, M.M.; Appadoo, D. Traditional salt-in-water electrolyte vs. water-in-salt electrolyte with binary metal oxide for symmetric supercapacitors: Capacitive vs. faradaic. Dalton Trans. 2020, 49, 11743–11755. [Google Scholar] [CrossRef]
- Divakaran, A.M.; Hamilton, D.; Manjunatha, K.N.; Minakshi, M. Development and thermal analysis of reusable Li-ion battery module for future mobile and stationary applications. Energies 2020, 13, 1477. [Google Scholar] [CrossRef] [Green Version]
- Razavi, S.E.; Arefi, A.; Ledwich, G.; Nourbakhsh, G.; Smith, D.B.; Minakshi, M. From load to net energy forecasting: Short-term residential forecasting for the blend of load and PV behind the meter. IEEE Access 2020, 8, 224343–224353. [Google Scholar] [CrossRef]
- Beiza, J.; Hosseinian, S.H.; Vahidi, B. Multiphase transmission line modeling for voltage sag estimation. Electr. Eng. 2010, 92, 99–109. [Google Scholar] [CrossRef]
- Hollman, J.A.; Marti, J.R. Step-by-step eigenvalue analysis with EMTP discrete-time solutions. IEEE Trans. Power Syst. 2010, 25, 1220–1231. [Google Scholar] [CrossRef] [Green Version]
- Huang, K.J. Impulse Corona Characteristics and Their Influence on Transmission Line Transient Computation. Ph.D. Thesis, Beijing Jiaotong University, Beijing, China, April 2017. [Google Scholar]

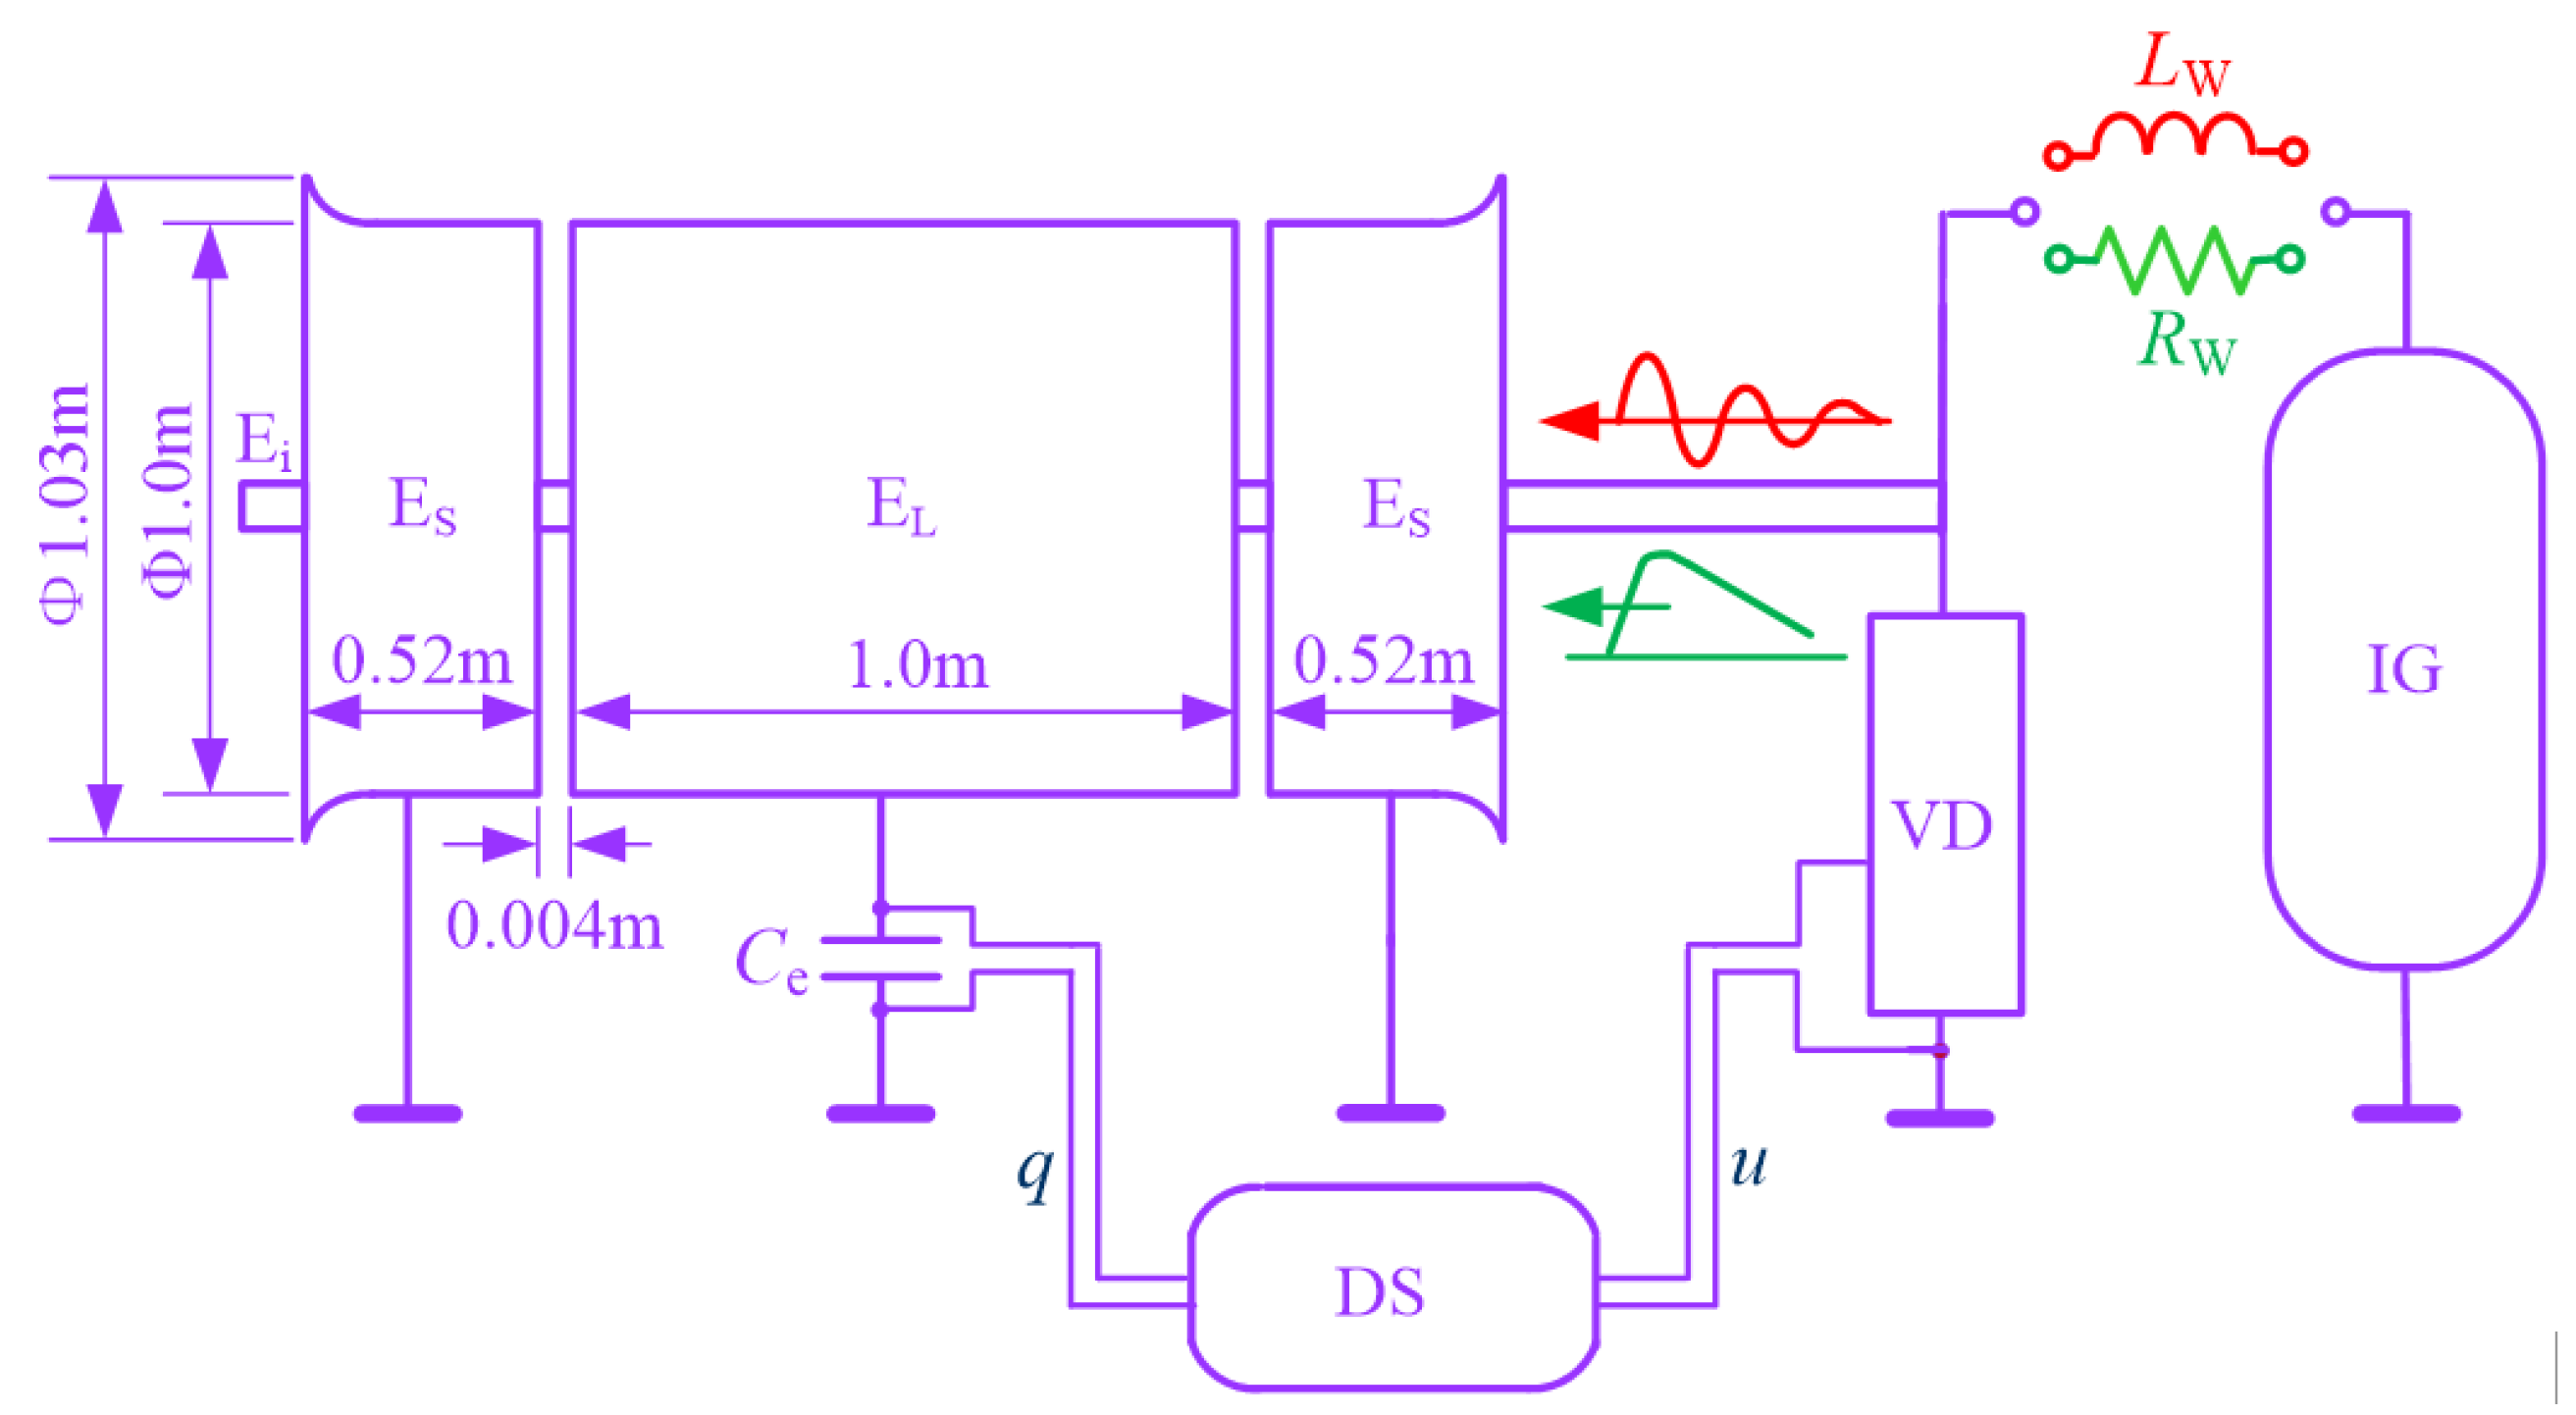
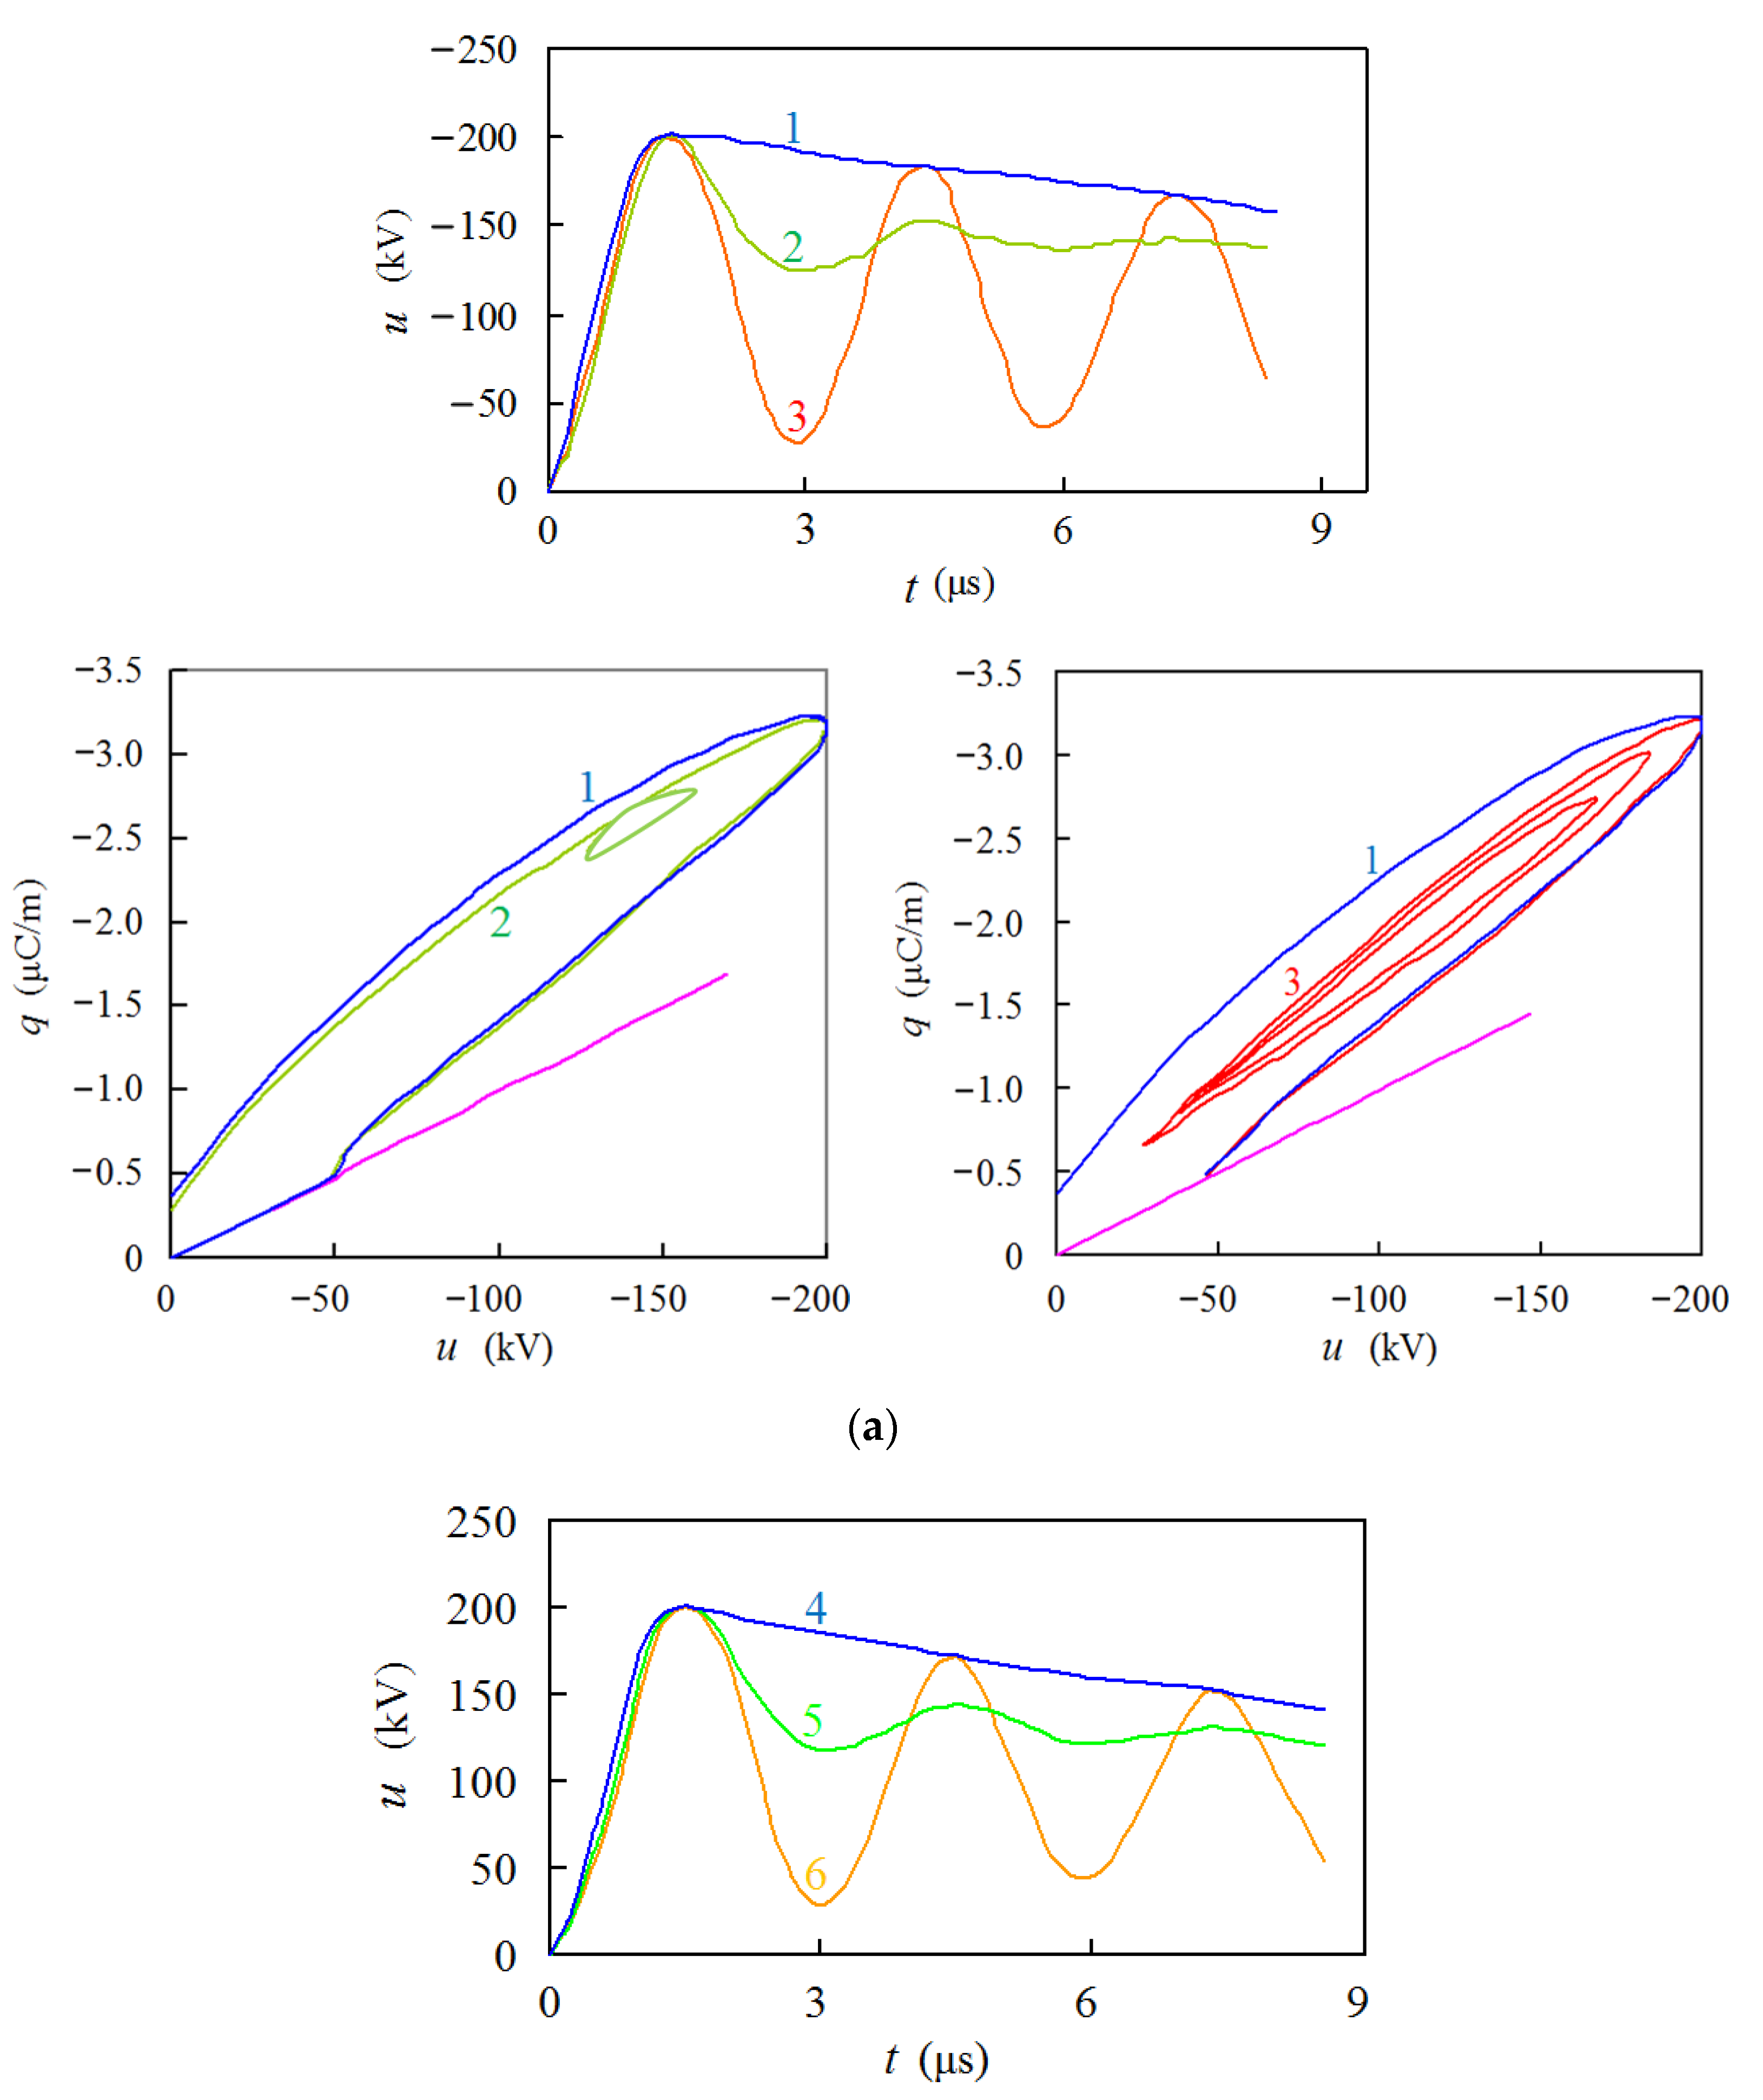


 sending end;
  field test;
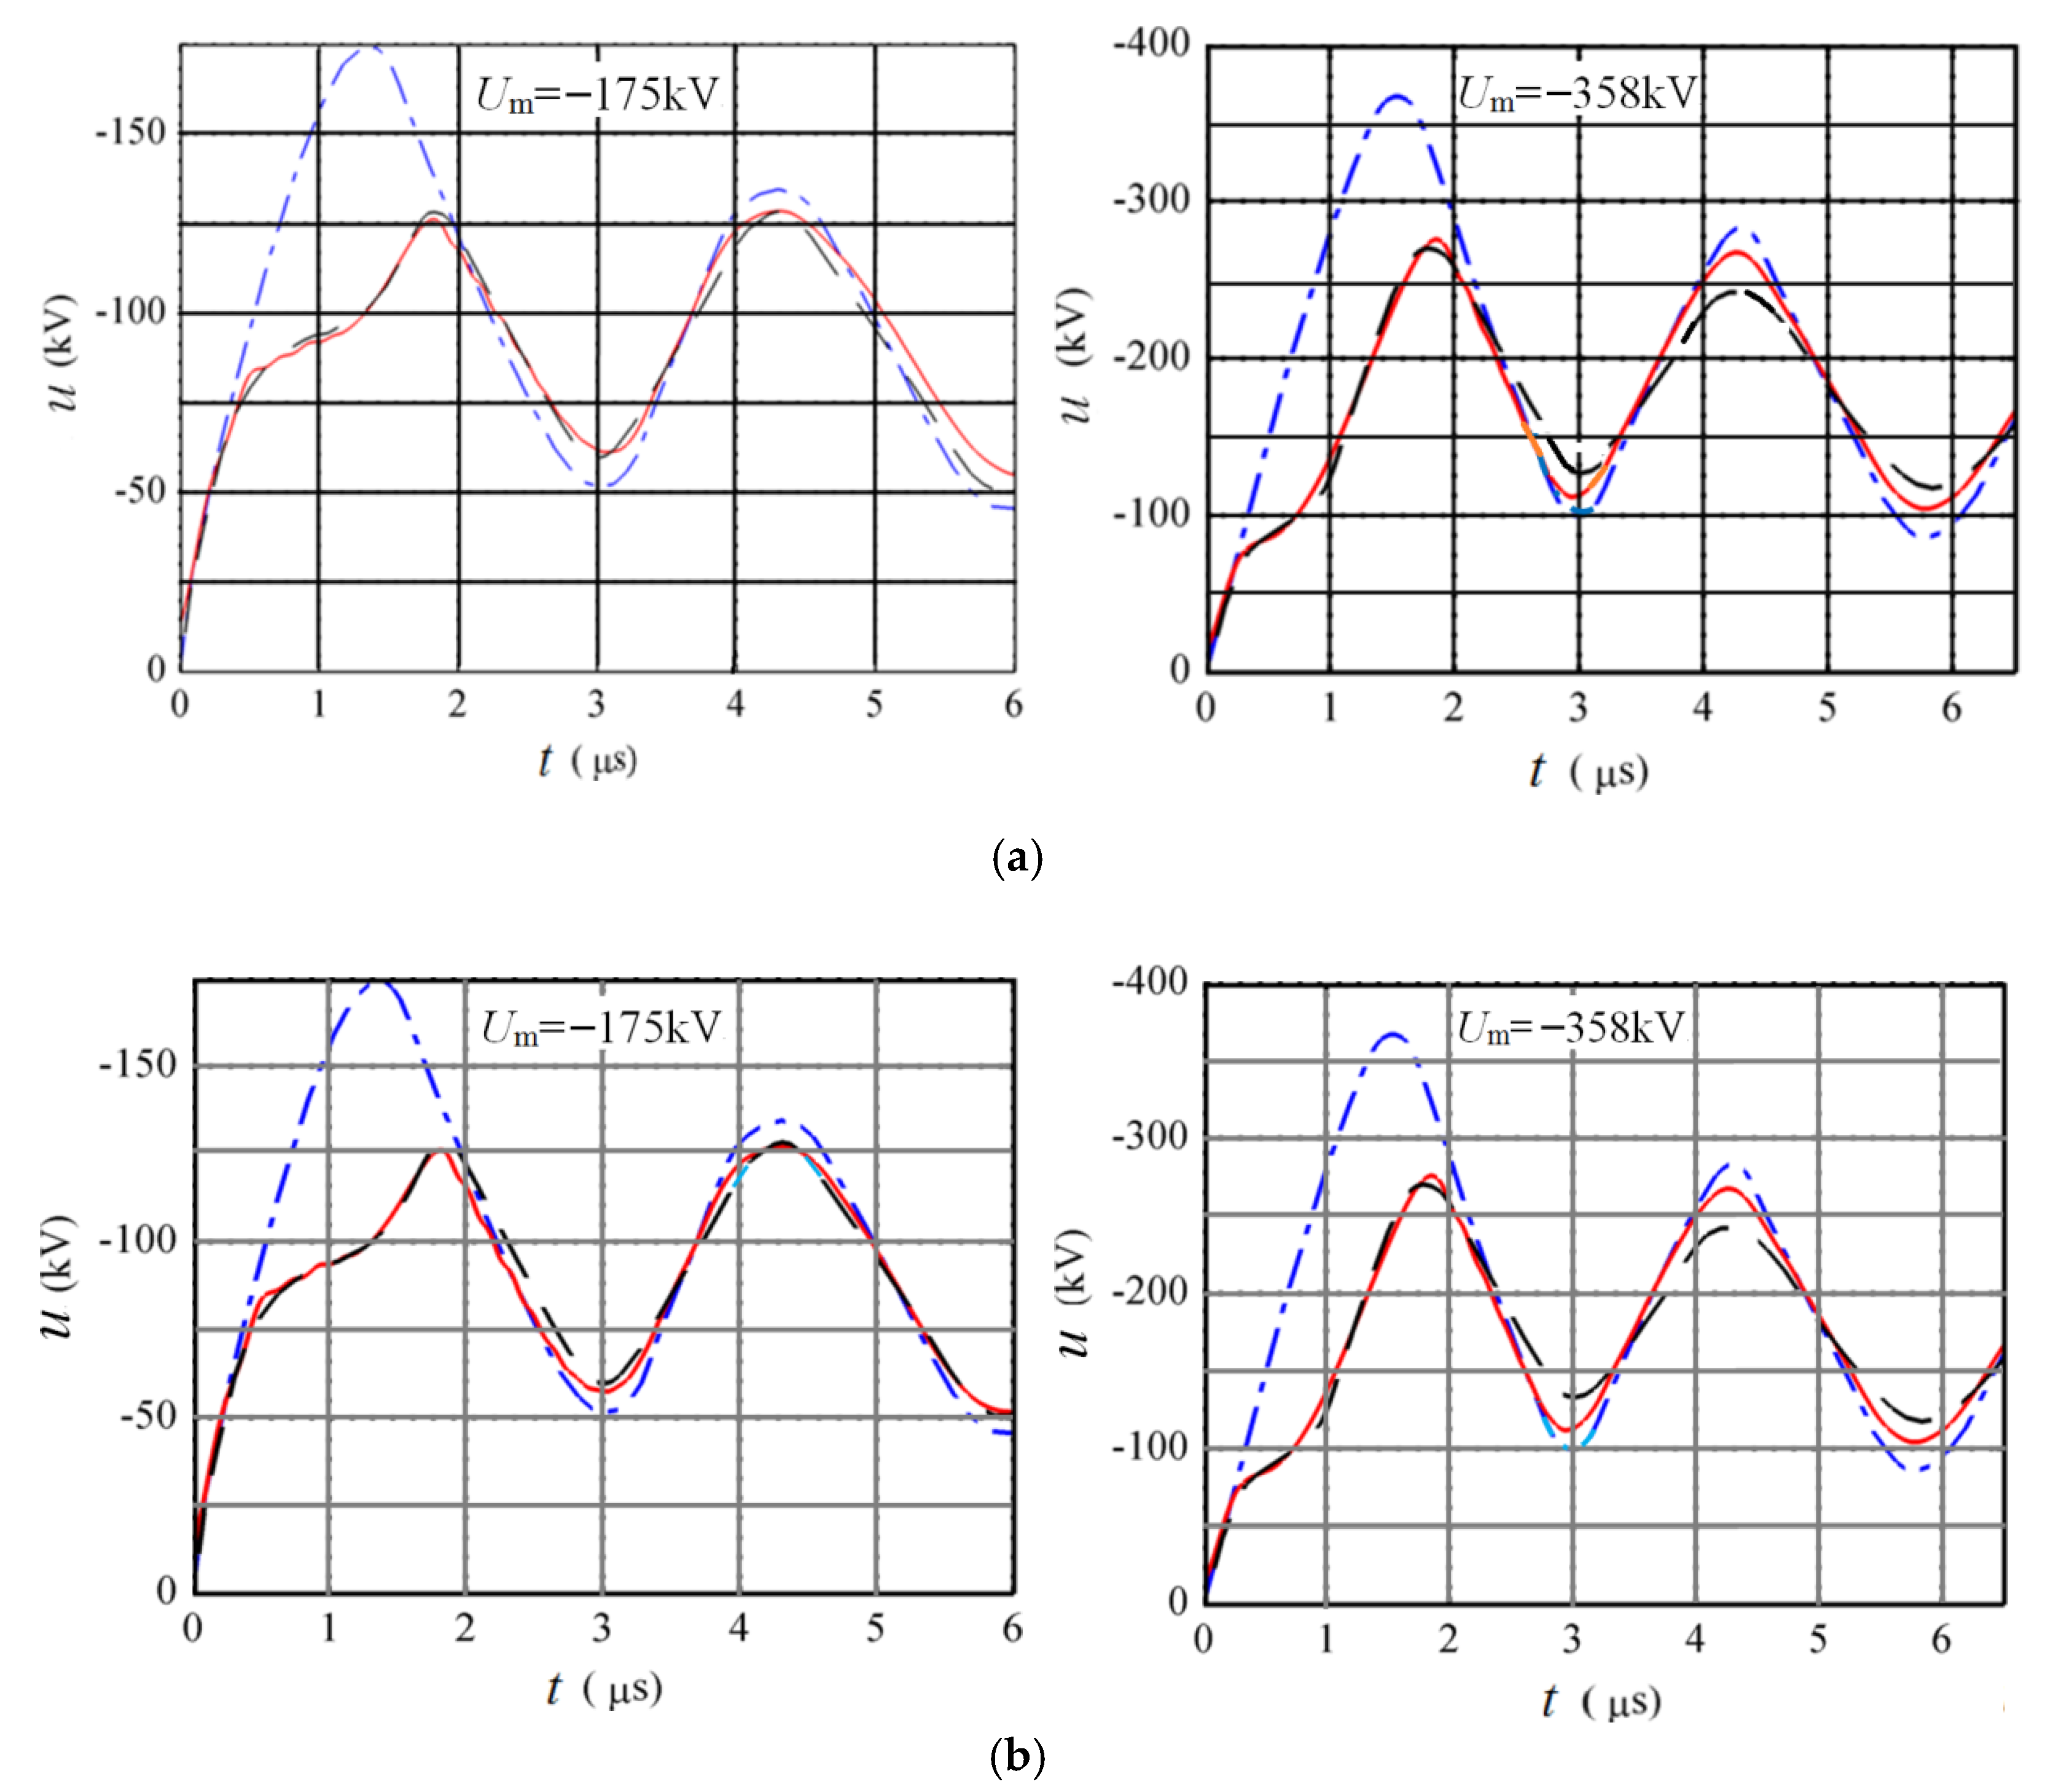
  calculated). (a) In the presence of minor loops, (b) in the absence of minor loops.
sending end; field test; calculated). (a) In the presence of minor loops, (b) in the absence of minor loops.
calculated). (a) In the presence of minor loops, (b) in the absence of minor loops.
sending end; field test; calculated). (a) In the presence of minor loops, (b) in the absence of minor loops.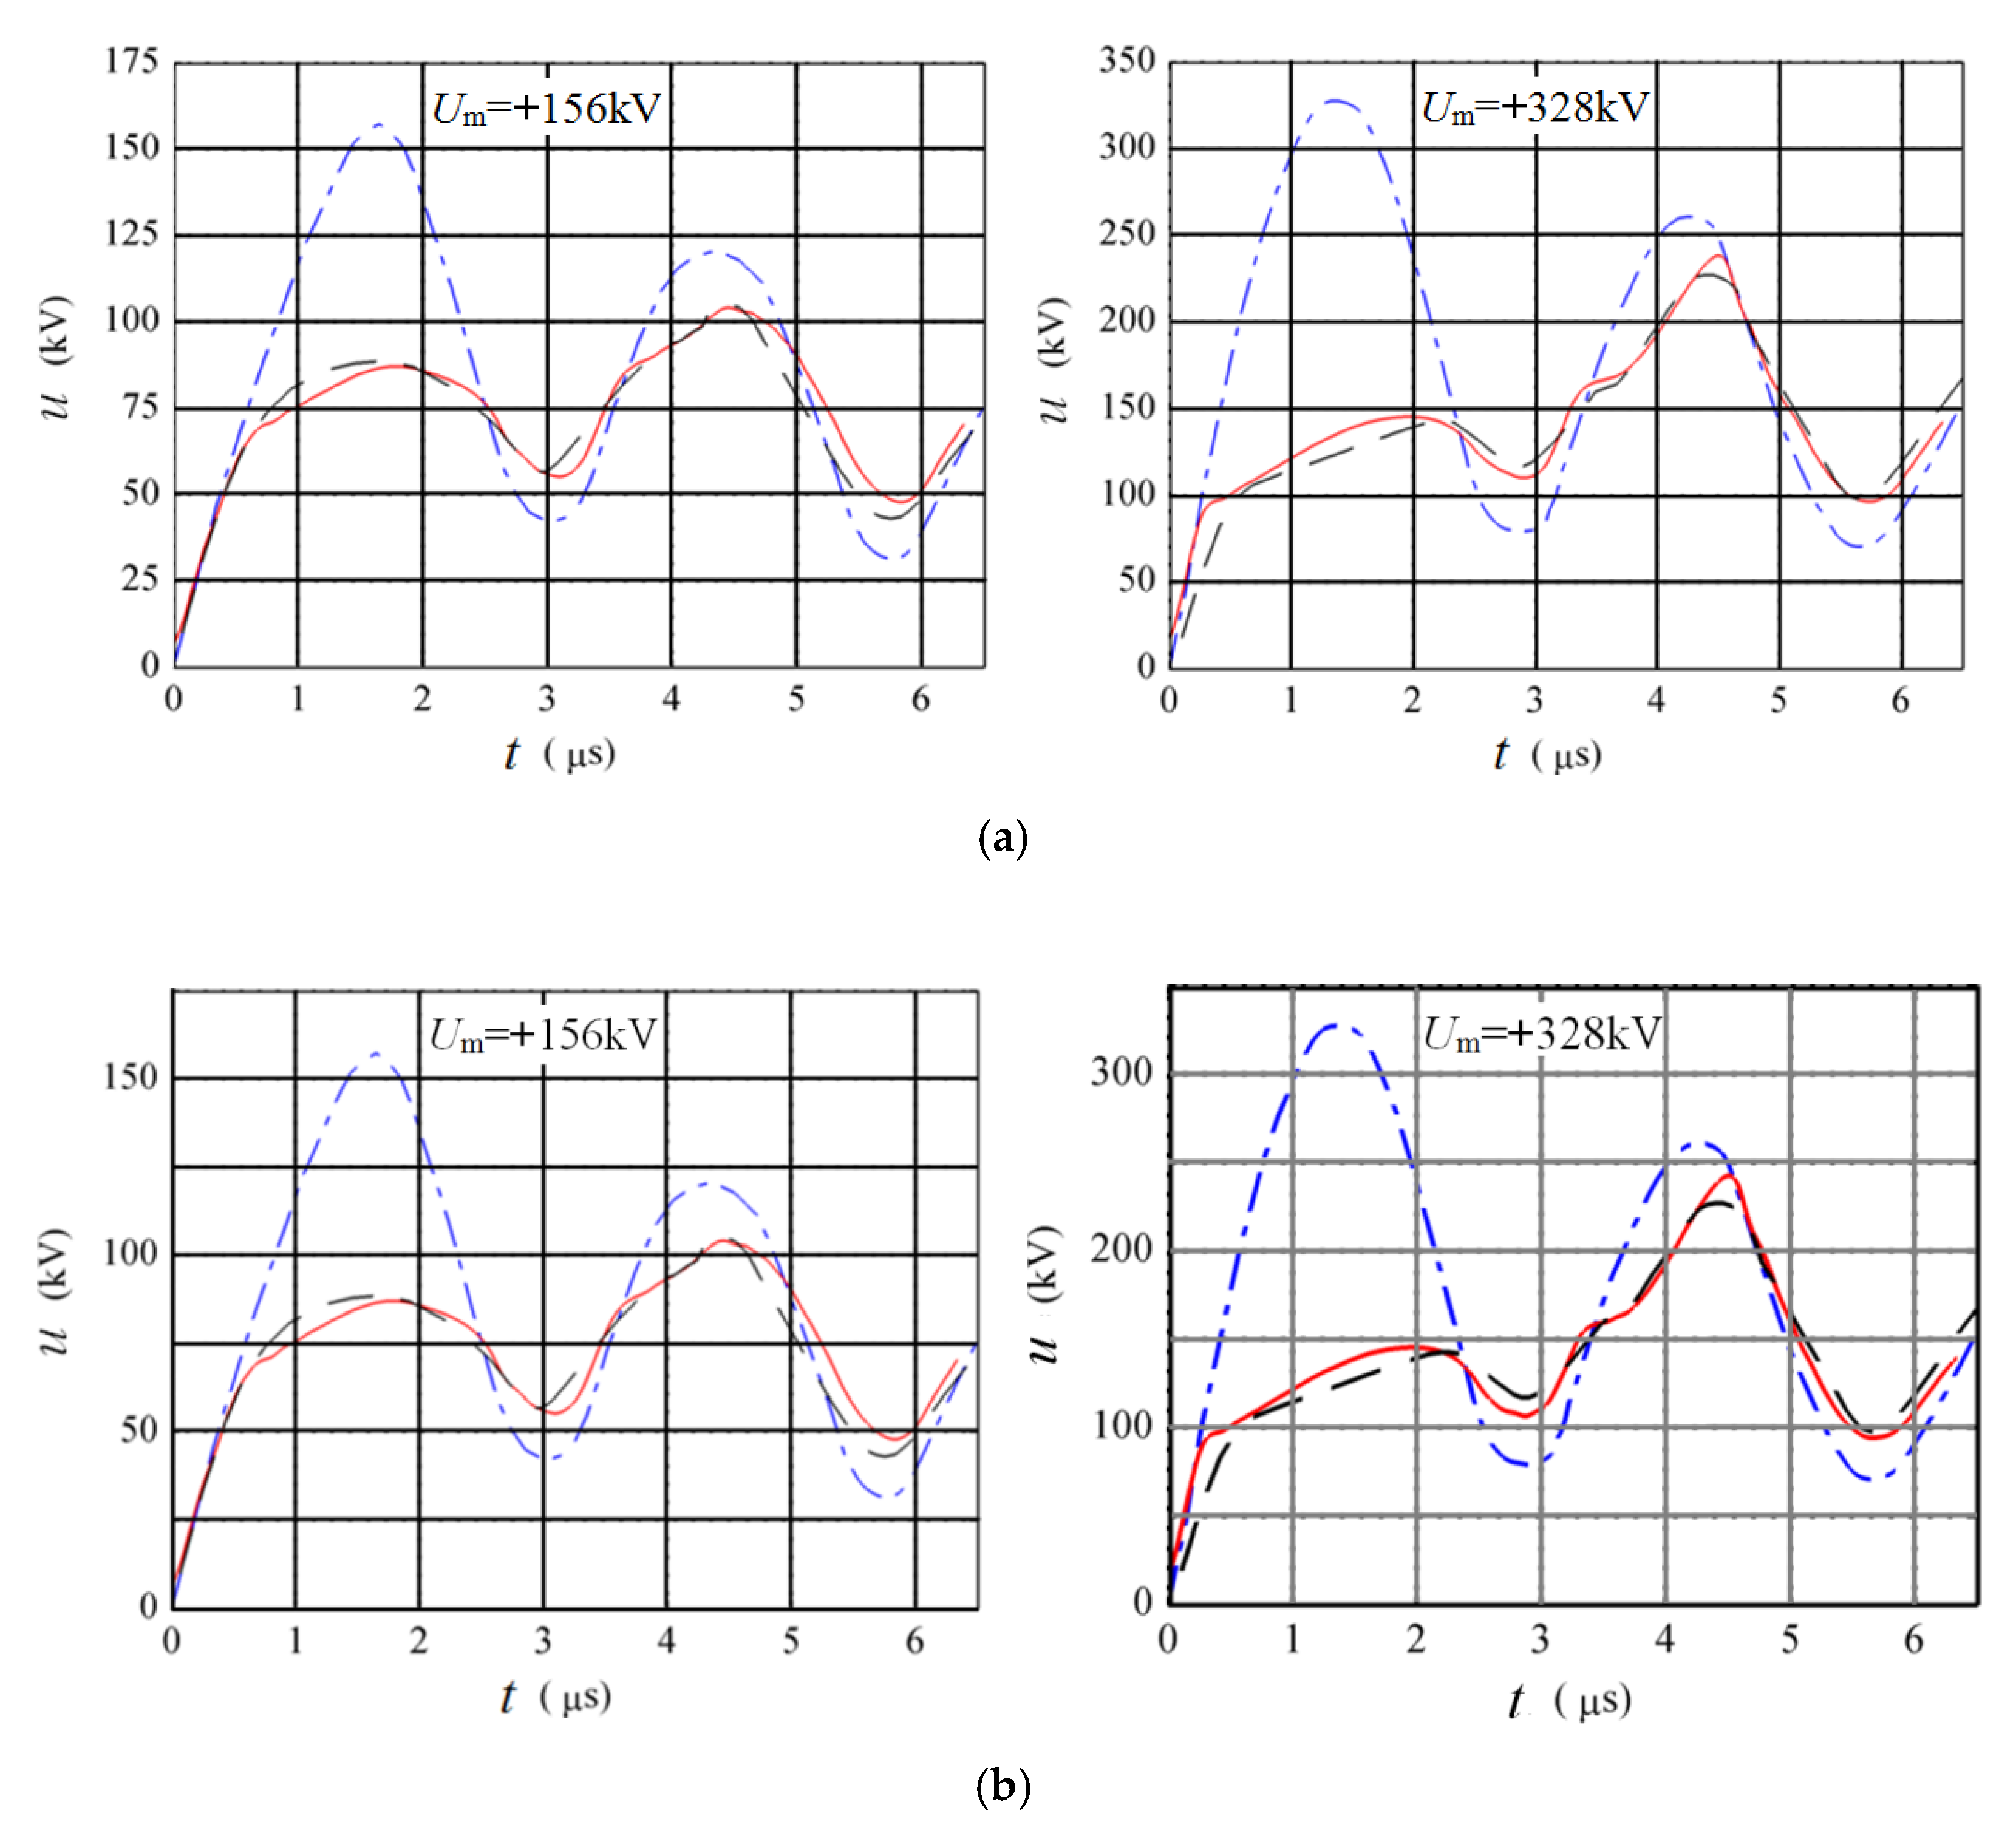
 sending end;
  field test;
  calculated). (a) In the presence of minor loops, (b) in the absence of minor loops.
sending end; field test; calculated). (a) In the presence of minor loops, (b) in the absence of minor loops.
calculated). (a) In the presence of minor loops, (b) in the absence of minor loops.
sending end; field test; calculated). (a) In the presence of minor loops, (b) in the absence of minor loops.
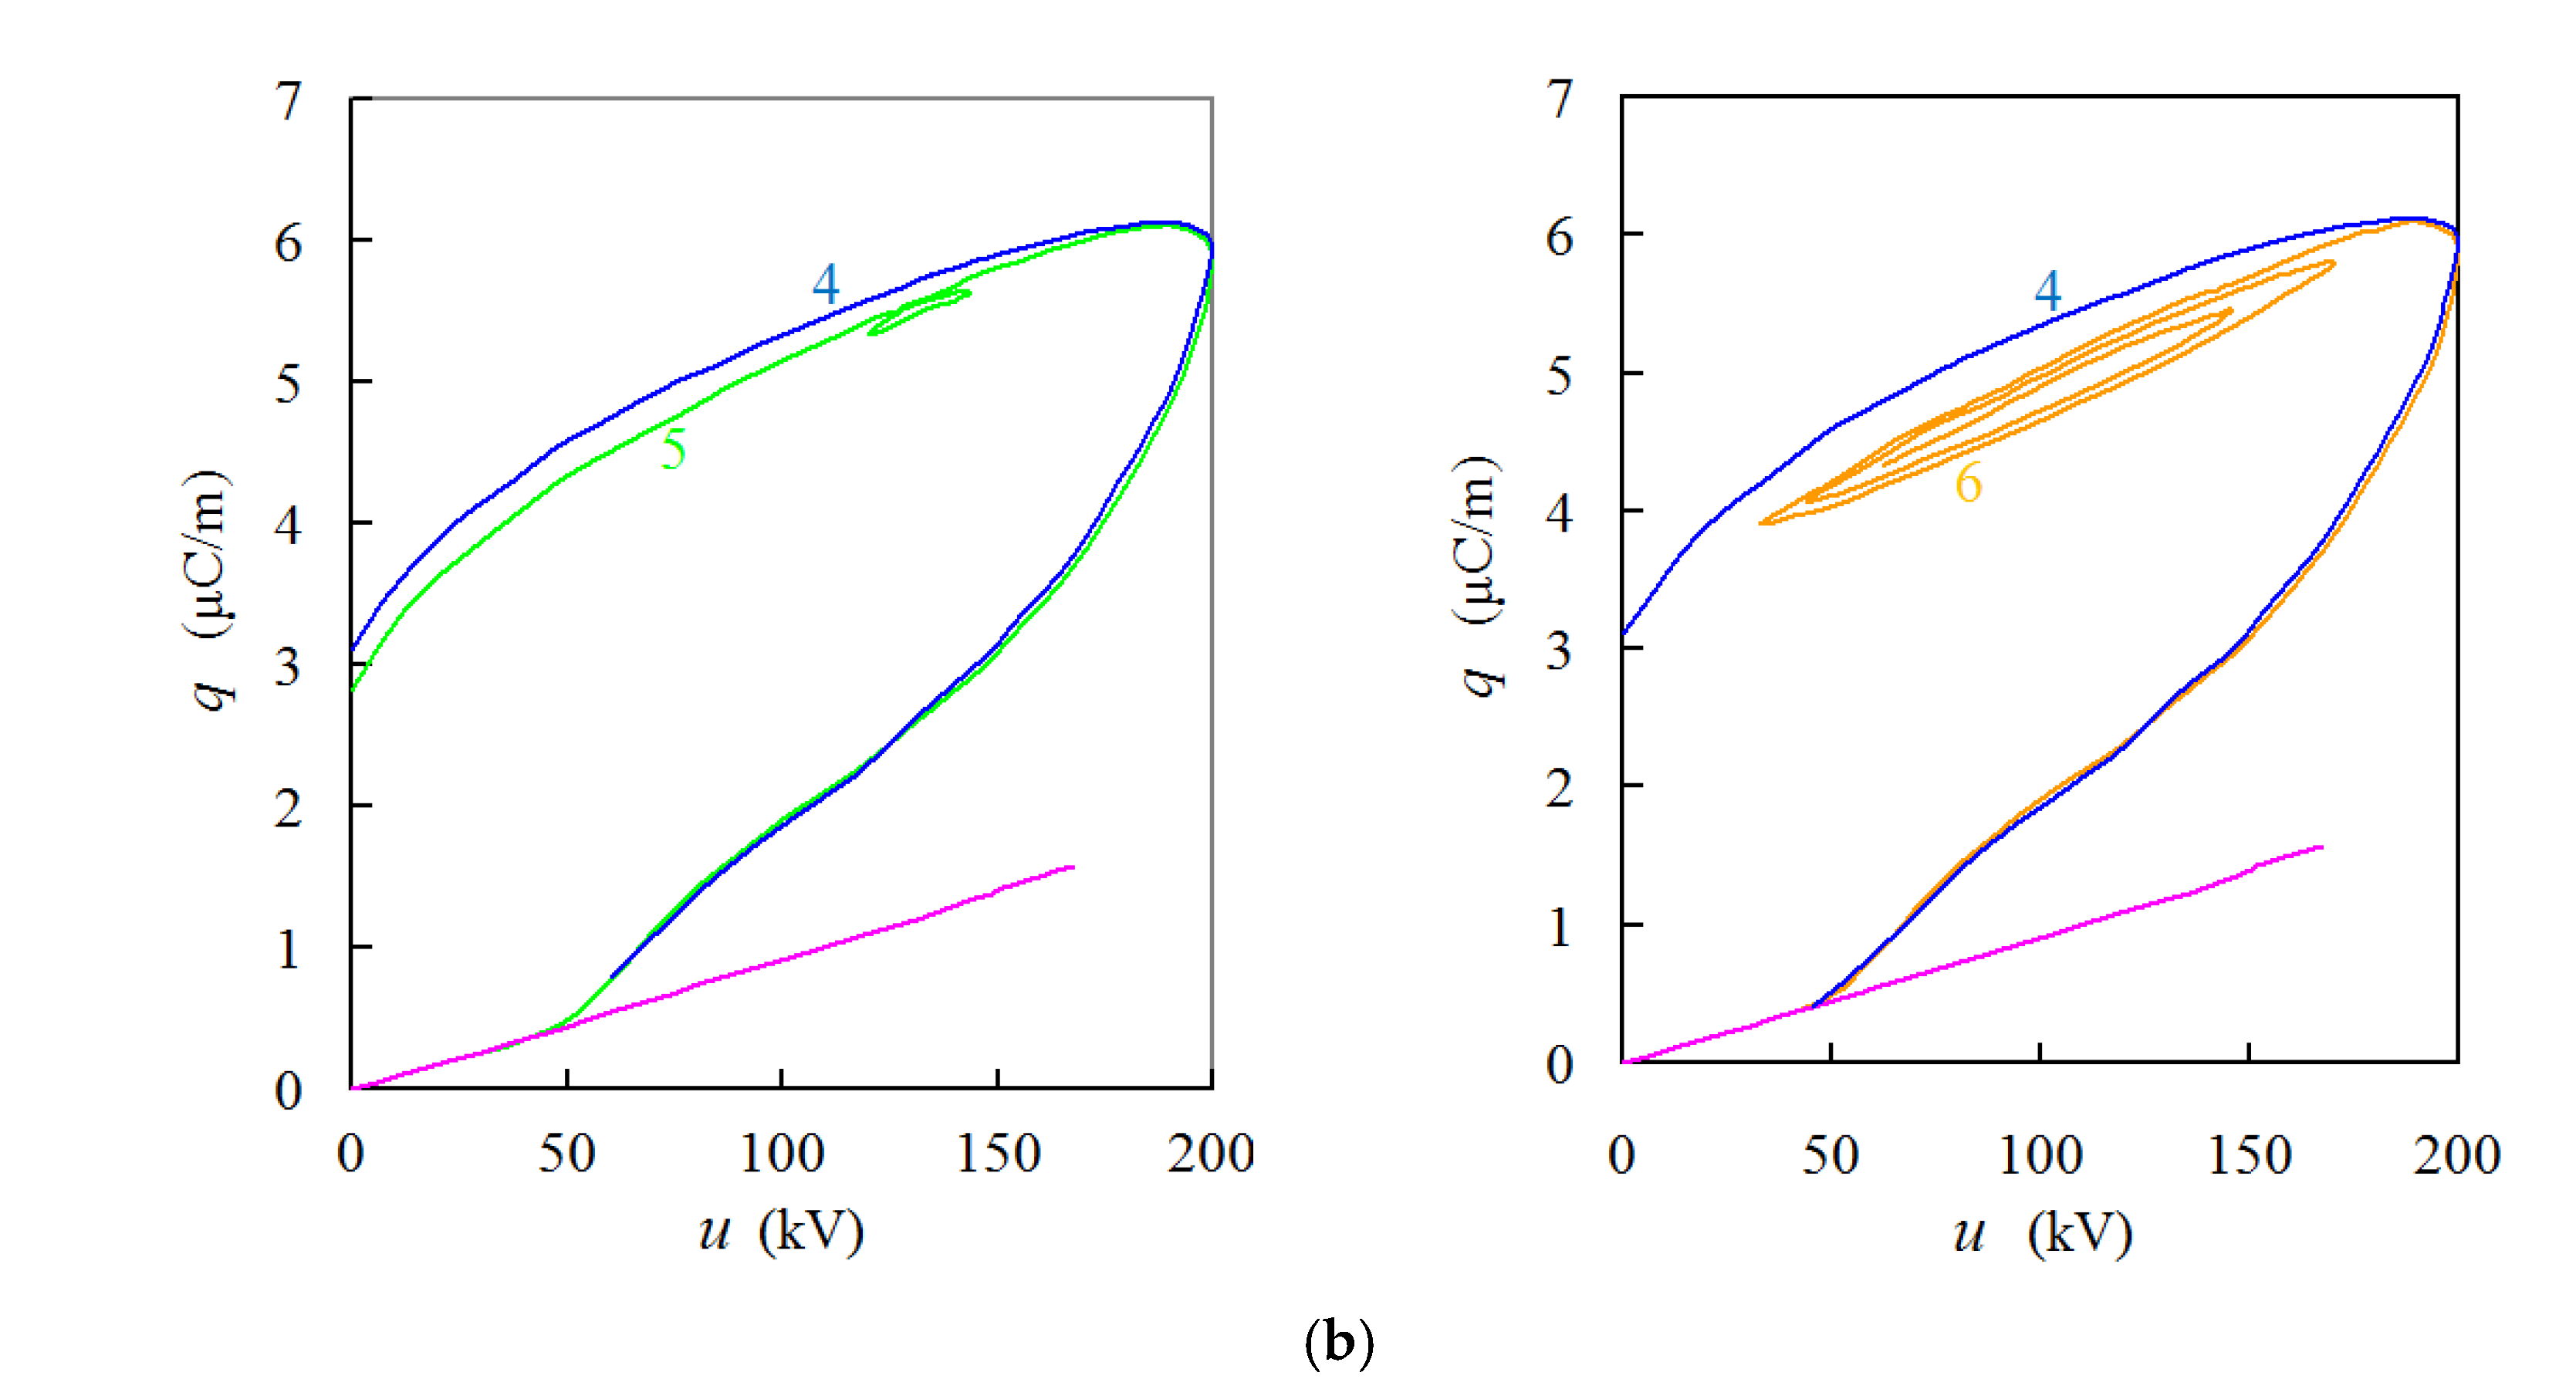
 sending end;
  field test;
  proposed method;
  FDTD).
sending end; field test; proposed method; FDTD).
FDTD).
sending end; field test; proposed method; FDTD).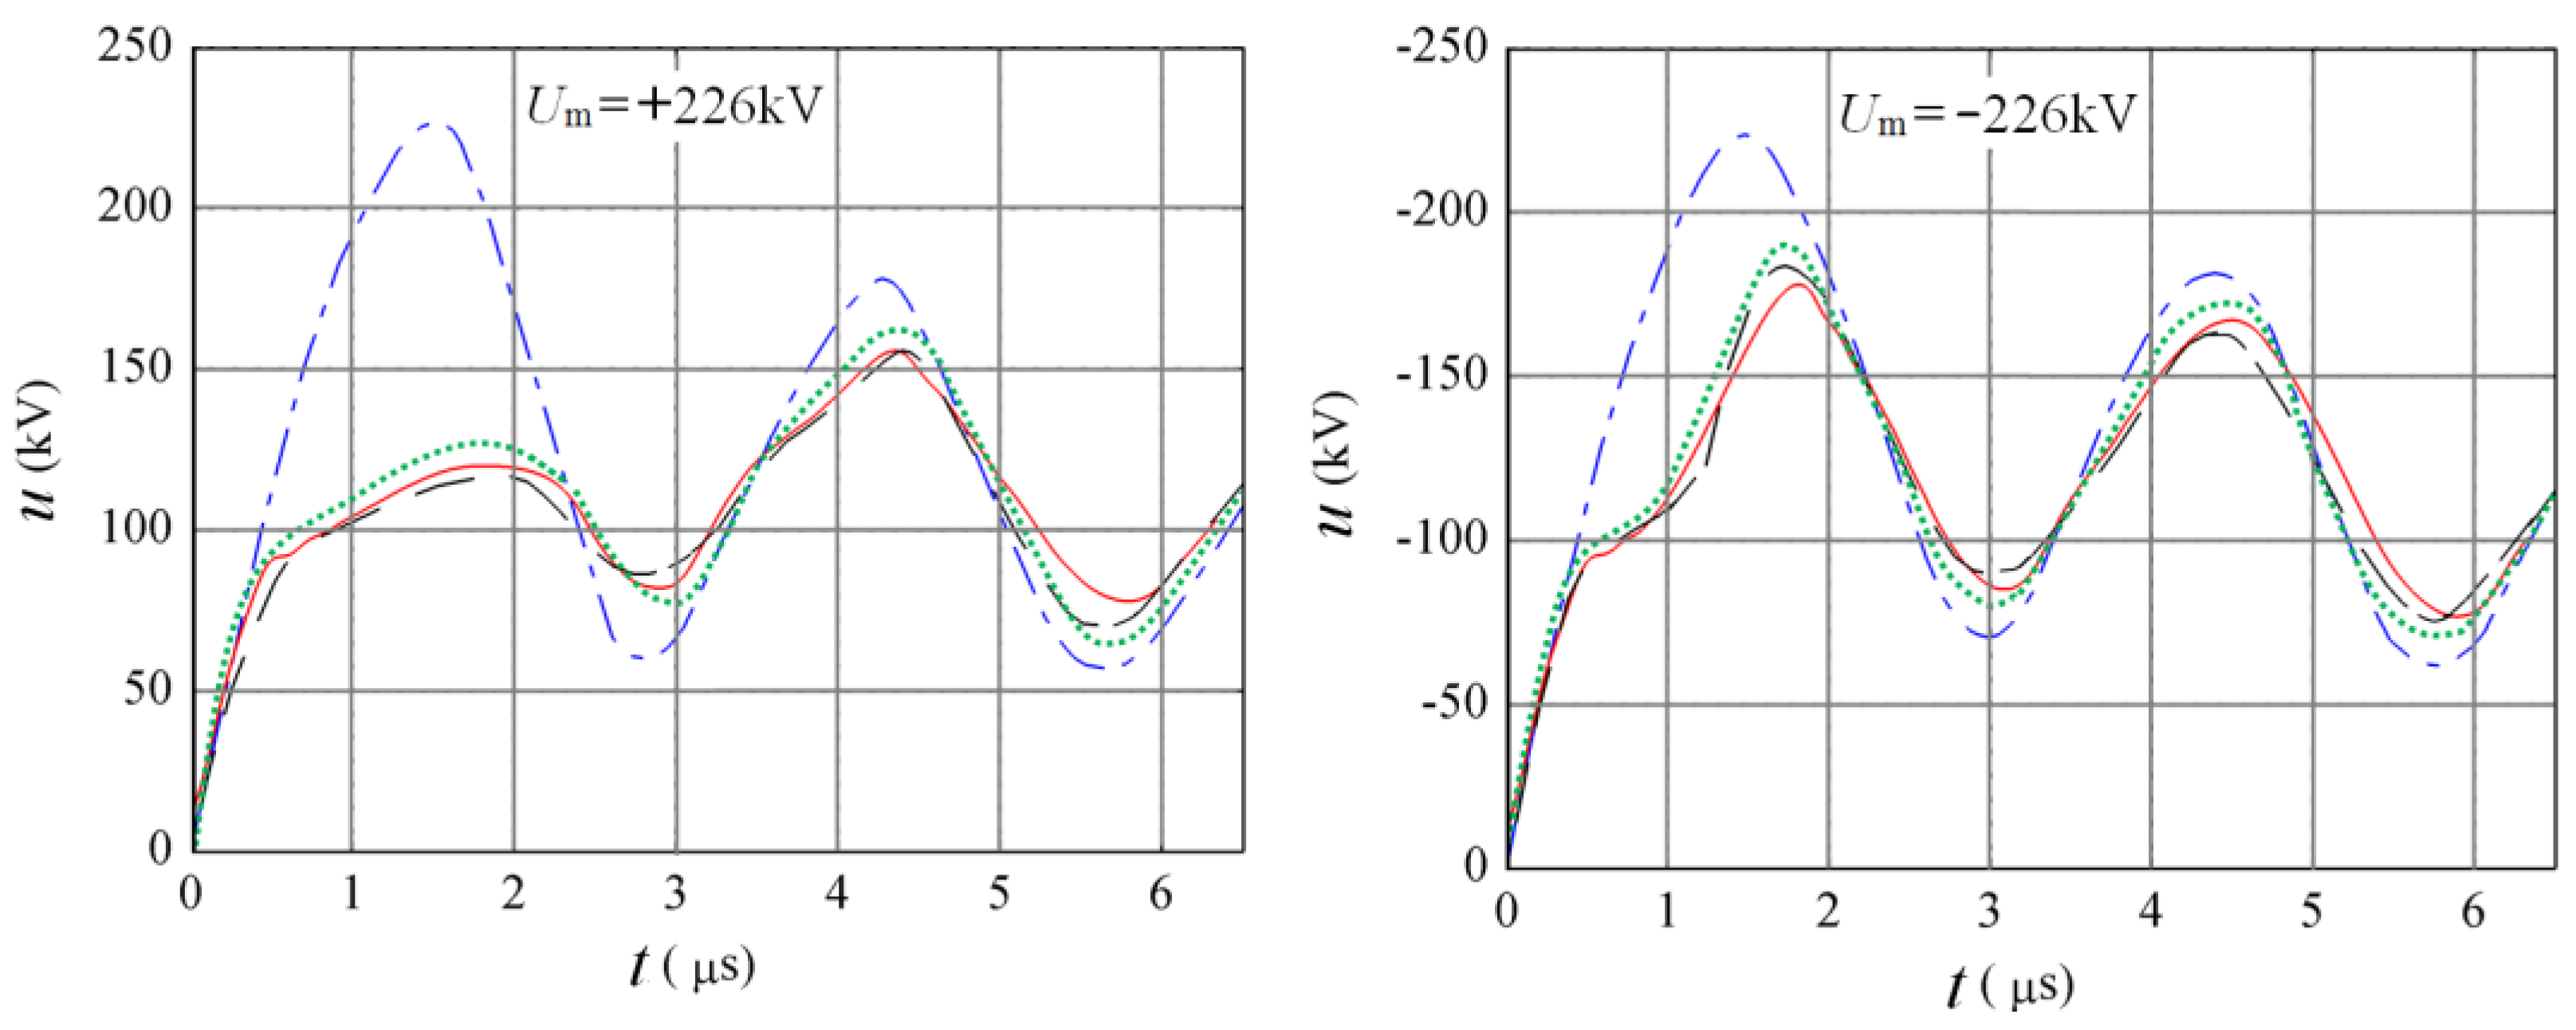

| α | α′ | α″ | β | β′ | β″ | |
| (MHz) | (kHz) | |||||
| (+) | 0.4 | 4.5 | 1.5 | 110.0 | 1.1 | 110.0 |
| (−) | 8.0 | 4.5 | 15.0 | 210.0 | 1.1 | 110.0 |
| C1 | C2 | C1′ | C1″ | C2′ | C2″ | |
| (pF/m) | ||||||
| (+) | 13.5 | 20.0 | 6.2 | 8.0 | 6.3 | 14.0 |
| (−) | 7.5 | 8.0 | 6.5 | 6.5 | 6.5 | 7.0 |
| U1 | U2 | U1′ | U1″ | U2′ | U″ | |
| (kV) | ||||||
| (+) | 95.0 | 90.0 | −5.0 | 45.0 | −4.0 | 35.0 |
| (−) | 90.0 | 85.0 | −5.0 | 55.0 | −4.0 | 50.0 |
| Applied voltage amplitude | 156 | 178 | 199 | 226 | 254 | 275 | 319 | 328 | |
| The first wave crest | Calculated | 87.4 | 114.2 | 116.5 | 117.8 | 120.6 | 127.3 | 136.7 | 142.8 |
| Field test | 84.5 | 112.5 | 114.7 | 120.3 | 126.5 | 131.7 | 140.8 | 144.7 | |
| The first wave trough | Calculated (in the presence of minor loops) | 55.2 | 60.3 | 70.2 | 82.2 | 84.0 | 92.8 | 109.6 | 110.2 |
| Calculated (in the absence of minor loops) | 52.6 | 55.2 | 68.1 | 78.9 | 82.2 | 91.3 | 104.7 | 106.8 | |
| Field test | 55.1 | 56.8 | 67.9 | 82.0 | 86.4 | 94.4 | 110.6 | 117.1 | |
| The second wave crest | Calculated (in the presence of minor loops) | 104.1 | 117.1 | 134.9 | 153.6 | 158.0 | 170.0 | 207.9 | 237.8 |
| Calculated (in the absence of minor loops) | 106.8 | 118.2 | 136.3 | 157.4 | 165.3 | 171.7 | 215.5 | 241.2 | |
| Field test | 105.2 | 114.4 | 135.8 | 155.7 | 157.1 | 170.4 | 212.3 | 227.1 | |
| Applied voltage amplitude | 175 | 188 | 195 | 226 | 258 | 292 | 340 | 358 | |
| The first wave crest | Calculated | 128.3 | 149.2 | 151.1 | 186.1 | 200.3 | 224.6 | 263.4 | 271.9 |
| Field test | 125.7 | 147.5 | 149.7 | 181.8 | 197.2 | 222.5 | 261.6 | 269.5 | |
| The first wave trough | Calculated in the presence of minor loops) | 58.7 | 64.9 | 67.3 | 86.7 | 99.1 | 104.5 | 117.5 | 134.8 |
| Calculated (in the absence of minor loops) | 56.5 | 62.3 | 65.8 | 79.4 | 90.7 | 98.6 | 105.8 | 119.5 | |
| Field test | 59.6 | 68.1 | 70.7 | 89.4 | 104.2 | 106.7 | 116.5 | 133.0 | |
| The second wave crest | Calculated (in the presence of minor loops) | 129.5 | 139.3 | 142.9 | 166.9 | 193.8 | 214.9 | 230.1 | 250.5 |
| Calculated (in the absence of minor loops) | 134.8 | 143.1 | 145.7 | 170.1 | 198.4 | 225.2 | 241.3 | 261.4 | |
| Field test | 128.3 | 136.0 | 136.7 | 163.2 | 190.1 | 215.2 | 218.2 | 242.2 | |
Publisher’s Note: MDPI stays neutral with regard to jurisdictional claims in published maps and institutional affiliations. |
© 2021 by the authors. Licensee MDPI, Basel, Switzerland. This article is an open access article distributed under the terms and conditions of the Creative Commons Attribution (CC BY) license (https://creativecommons.org/licenses/by/4.0/).
Share and Cite
Zhang, X.; Huang, K. Lightning Surge Analysis for Overhead Lines Considering Corona Effect. Appl. Sci. 2021, 11, 8942. https://doi.org/10.3390/app11198942
Zhang X, Huang K. Lightning Surge Analysis for Overhead Lines Considering Corona Effect. Applied Sciences. 2021; 11(19):8942. https://doi.org/10.3390/app11198942
Chicago/Turabian StyleZhang, Xiaoqing, and Kejie Huang. 2021. "Lightning Surge Analysis for Overhead Lines Considering Corona Effect" Applied Sciences 11, no. 19: 8942. https://doi.org/10.3390/app11198942
APA StyleZhang, X., & Huang, K. (2021). Lightning Surge Analysis for Overhead Lines Considering Corona Effect. Applied Sciences, 11(19), 8942. https://doi.org/10.3390/app11198942