Abstract
Stay cable is the major load-carrying element in cable-stayed bridges. The process of monitoring cable forces would be beneficial to ensure the safety of bridges. The conventional sensor-based approaches to measure stay cable forces is complicated in operation, time-consuming and relatively expensive. In order to confront these disadvantages, a lightweight measurement method using smartphone imagery was proposed in this paper. The video data acquisition process was first standardized by using a pre-designed target. Then, a novel algorithm to extract the vibration displacement of stay cables under complex condition was developed. An automatic correction algorithm was provided to further improve the displacement results. On top of that, a smartphone-based software for determining cable forces was developed and tested on a real-life bridge. The results showed a maximum error of 1.99% compared with the cable force obtained by using a dynamic tester. The developed software is proven to be feasible in real-life projects and can achieve high accuracy in cable force determination. At the same time, the proposed method does not require a fixed camera for measurement and is not limited by personnel experience and measurement time, facilitating real-time monitoring of multiple projects, multiple cable surfaces and multiple personnel in a visual vibration environment.
1. Introduction
As a major load-bearing element, stay cables play an important role in a cable-stayed bridge. It directly determines the safety of the structure during construction and the reasonable distribution of internal forces after the completion of the bridge. Currently, the methods of measuring cable force mainly include the pressure oil meter method, pressure sensor method and vibration method. The first two methods are generally only applicable with respect to tensioned cables during construction, while the vibration method is the most widely used method in cable force measurement for cables in operation [1,2]. Other tools, such as accelerometers, piezoelectric strain sensors [3] and electromagnetic (EM) sensors [4], can be used to measure cable forces more directly. With the development of optical and computer technology, image-based techniques have been extensively studied and widely used in the field of civil engineering. A critical review on their implementations on construction sites can be found in [5]. Moreover, computer vision techniques have been used to collect as-is inventory data of existing civil assets [6] and to facilitate as-is 3D reconstruction [7,8]. Furthermore, image-based methods for dynamic response measurement, defect detection and condition assessment on existing structures have been summarized and presented in [9,10,11]. For line-like structures such as stay cables in particular, Ji and Chang [12] used a nontarget stereo vision system to accurately monitor their dynamic responses (i.e., natural frequencies and mode shapes) by retrieving the spatio-temporal displacements out of the two image sequences. Using a single camcorder, Chen et al. [13] developed a videogrammetric approach to measure dynamic parameters of stay cables using no artificial targets and verified its advantages on a real bridge. Similarly, Ji and Chang [14] adopted optical flow methods to eliminate the need for target installation in the proposed image-based technique for cable vibration measurement. Based on the identified dynamic properties, stay cable forces can be further determined. Du et al. [15] used two methods, i.e., digital image processing (DIP) and digital image correlation (DIC), to first identify modal frequencies and then to determine the cable force at a single point and multiple points. The identified frequencies and cable tensile forces were compared with sensor-based frequency measurement and numerical analysis results separately. Acceptable deviations on cable tensions, i.e., 1.09% for single-point and 3.05% for multi-point measurement, proved the reliability of the proposed methods. The DIC technique was also used to extract temporal displacements of cables in [16], where the cable force estimation was achieved based on cable mode shapes. In order to extend the applicability of image-based measurement systems for long-term monitoring of cable forces, a set of consecutive studies [17,18] focused on the development of a vision-based monitoring system, which was installed on a real-life cable-stayed bridge and tested under various weather conditions in order to validate its applicability. The vision-based monitoring system achieved satisfactory accuracy, with an error rate of ±1% for modal frequency identification and a maximum error of ±5% for cable force determination. Feng et al. [19] used a fixed industrial camera to estimate the cable force and tested on a cable-supported roof structure of a stadium under renovations. After close monitoring of the ever-changing cable forces, it was found the maximum deviation between estimations and the “ground truth” was 5.6%.
Other than fixed cameras, the use of mobile reality capture devices would be beneficial in practice. Tian et al. [20] used an unmanned aerial vehicle (UAV)-based camera to obtain vibration images of cables for frequency retrieval. A line segment detector, a line matching algorithm and frequency difference-based cable force estimation were integrated in order to eliminate the impacts of UAV motion and to improve the robustness of the proposed method. Smartphones among all the other mobile devices integrated a wide range of advanced technology such as embedded sensors, growing storage capability, computational power and network connections. For this reason, a group of studies utilized smartphones as the smart terminal to collect dynamic properties of stay cables. A series of consecutive studies [21,22,23,24,25,26] proposed a wireless cable force measurement method by applying the built-in acceleration sensor in an iPhone; developed a cable force measurement software, Orion-Cloud Cell (i.e., Orion CC), based on the IOS; and further developed a two-mode acquisition program and a command control program to allow the synchronous collaboration of multiple iPhones in vibration testing. Morgenthal, et al. [27] developed a micro-electromechanical (MEMS) acceleration sensor and linked it to the smartphone for cable force measurement. The experimental results showed that the resolution and sampling resolution of the sensor directly affected measurement accuracy, while manual and environmental excitation affected the reliable identification of natural frequencies. A summary of previous studies on cable force estimation methods is presented in Table 1.

Table 1.
Summary on previous studies for cable force determination.
To conclude, the use of digital image processing technology in cable force measurement has advanced drastically in recent years, and the feasibility and economic efficiency of this technology have been verified. Compared to conventional sensor-based methods, this technology is intrinsically simple in terms of operation, requires no preinstalled sensors and can achieve reliable accuracy. However, most of the above-mentioned studies used fixed industrial cameras/camcorder to collect vibration videos of stay cables or built-in sensors in mobile devices to monitor dynamic responses of stay cables, based on which cable forces were estimated. Few studies used mobile devices for image data collection and analysis, with the exception of [20,24]. This paper proposed a lightweight cable force measurement method based on smartphone, which can realize multi-project, multi-cable surface, multi-person and real-time monitoring of cable force in a visual vibration environment at any time. The proposed method is more convenient, economical and efficient compared to previous studies.
2. The Proposed Method for Cable Force Determination
In this section, the proposed method for cable force determination based on smartphone imagery will be illustrated. First, the video data of cable vibration is obtained with the aid of a pre-designed artificial target. The parameter settings of the smart terminal, i.e., smartphone camera, are specified as well. Then, a sequence of image processing algorithms is introduced in order to retrieve the time history of cable displacements. The cable force can then be determined based on the dynamic responses.
2.1. Vibration Video Data Collection
In the proposed measurement method, a smartphone is used as a handheld smart terminal to collect video data on cable vibration. The feature points of stay cables need to be predefined so as to eliminate the vibration noise caused by shaking of the handheld smartphone. In this research, specifically designed targets were attached and used for efficient detection. The identified targets will then be compared to the reference points in the video so as to extract the cable vibration displacements. The following five aspects, including the compilation of cable basic information, target design, target placement, smartphone parameters for data acquisition and video recording, will be specified in order to standardize the data collection process.
2.1.1. Data Compilation of Stay Cables
Based on the basic cable information of the entire bridge, including project name, cable number, cable length, mass per unit length, flexural stiffness, etc., a standard form of cable data was created and shown in Table 2. Based on the standardized compilation of cable information, a waterproof QR code was generated, linked and attached to the corresponding stay cable, as shown in Figure 1.
Table 2.
Standard form of stay cable data.
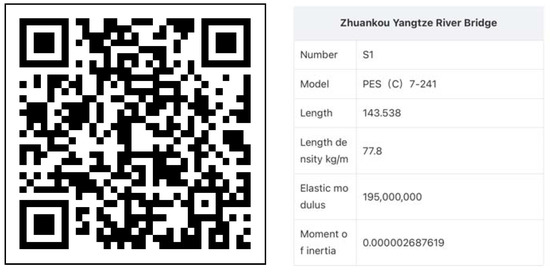
Figure 1.
Generation of information QR code for cable.
2.1.2. Target Design
The target is characterized by its shape, color and size (see Figure 2), which are commonly prespecified in order to facilitate detection. Specifically, the shape of the target plays a decisive role in determining the image search method. The color of the target affects the recognition accuracy and speed, and it relates closely to the ability to resist noises. The size of the target is vital to the flatness of the on-site paste and the fitting accuracy of the target center. In this study, the shape of the circle is chosen for the target due to its robustness relative to shooting perspectives. This means that while taking images from different shooting angles, the position of the center of a circle will not change. As for the color, potential noises in the surroundings were evaluated. For example, a PE sheath will affect the detection of white targets, trees are noises for green target identification and skies and rivers will impact the recognition of blue targets. As a result, a solid red circle with a diameter of 5 cm was chosen as the target.
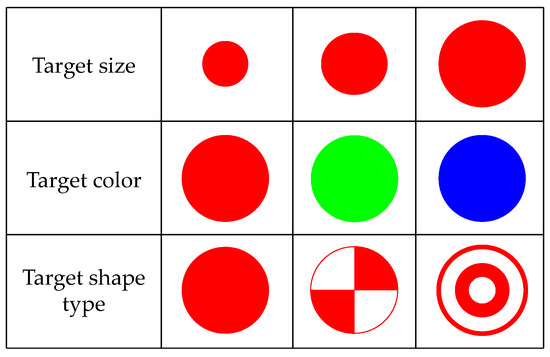
Figure 2.
The selection of the target features.
2.1.3. On-Site Target Placement
According to the requirements of target identification and displacement correction, four simple targets are attached, as shown in Figure 3. To illustrate, the number 1 element refers to a stay cable, the number 2 element is a fixed structure such as a retaining wall/guardrail and the number 3 refers to the QR code for stay cable information. Monitoring targets 4-P1 and 4-P2 are attached on the stay cable, while 4-P3 and 4-P4 are targets attached on the fixed structure. The dotted bordered rectangle (i.e., number 5) denotes the viewing area from the mobile phone. It is worth noting that the position of target 4-P1 should be as high as possible: 4-P2 is 1 m~2 m away from 4-P1, and 4-P3 and 4-P4 are below 4-P1 and 4-P2 in order to fix the structure.
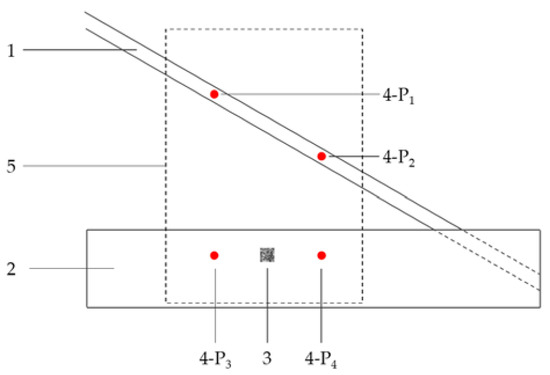
Figure 3.
The layout of targets.
2.1.4. Data Acquisition Parameters of Smartphone
The data acquisition parameters of the smart terminal such as image resolution, acquisition frame rate and sampling duration can affect the sampling accuracy of the collected vibration video data. Taking the maximum viewing range of 2 m × 3 m as an example, when the image resolution is set to 1080 × 1920, the pixel accuracy is 1.85 mm/pix. The amplitude of two pixels is set to be the displacement extraction resolution; thus, when the cable vibration displacement is equal to or more than 3.7 mm, the vibration displacement of the cable can be extracted with the resolution of 1080 P. Therefore, the image resolution is recommended to be 1080 P (1920 × 1080) or 4 K (3840 × 2160) for video data collection.
According to the sampling theorem, for the signal with the highest frequency , the sampling rate should fulfill requirement in order to avoid distorting the signal. Generally, is used in engineering [17]. To meet the test requirements, a frame rate of 24 FPS can collect cable vibration signals within 4 Hz for long cables, while for short cables, the frame rate can be increased to be appropriately 30 FPS or 60 FPS. The video sampling duration is recommended to be 20 s, the corresponding frequency resolution is calculated to be 0.05, as shown in Equation (1):
where is the frequency resolution, is the sampling frequency, is the number of sampling points, and is the sampling duration. The sampling frequency error equals to .
2.1.5. Standardized Video Recording
Taking four targets in the view frame as a standard shooting range (as shown in Figure 3), the smartphone is set 1.5 m away from the stay cable and perpendicular to the ground. Moreover, the smartphone camera should be kept stable in order to ensure a fixed shooting range. The video resolution can be set to 1080 P or 4 K, the frame rate is set to 24 FPS, 30 FPS or 60 FPS and the video capture time is 20 s. After the video is captured, it is uploaded to the processing software for data analysis.
2.2. Image Data Processing and Analysis
The image sequences of cable vibration will be processed following the procedures in Figure 4. The processing starts with target identification, tracking and ends with displacement correction. As a result, the distance between the stay cable target and the fixed point in each frame of the image can be obtained. Based on that, the time history matrix of target vibration was established, and the stay cable force can be obtained by substituting fundamental frequency of the cable vibration into the calculation formula. The entire image processing scheme is shown in Figure 4.
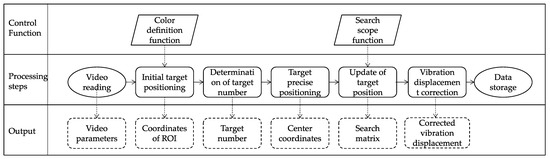
Figure 4.
Image data processing procedure.
2.2.1. Initial Target Positioning
Due to the complex background environment and the poor detection stability of the Hough variation method [28,29,30], binarization and blob detection were applied to extract the position information of the pasted target. Since the test can be conducted during daytime or night, there would be considerable color differences for the detected target. Thus, image binarization based on red pixels is performed and can be expressed as Equation (2).
In the equation, is the pixel points with the coordinates (i, j). , and are values of the red, green and blue channel of the point . T is the threshold for red color for which its empirical range is 1.5~2.2. This means that the red channel value of the pixel point considered as red is larger than 1.5 times of the green and blue channels and less than 2.2 times. In the experiment, T was set to be 1.8 for daytime scenario and 2.0 for the night-time scenario. To cope with complex situations where environmental noises are considerable, the T value in the developed software can be further adjusted to 2.2. It is noted that the requirement aims to remove the target pixels that blend into the background in a dark environment in order to improve the extraction accuracy of target edges. After color-based filtering, blob detection algorithms can be applied to generate the coordinates and radius of the target.
2.2.2. Determination of Tracking Target
Since targets on stay cables and the fixed structure cannot be easily distinguished, targets were sorted according to their x coordinates. As shown in Figure 5, the first two targets are stay cable targets P1 and P2, and the last two targets are fixed structure targets P3 and P4. The slopes of P1P2, P1P3, P1P4, P2P3 and P2P4 are first determined, based on which the intersection angles of them are calculated using Equation (3).
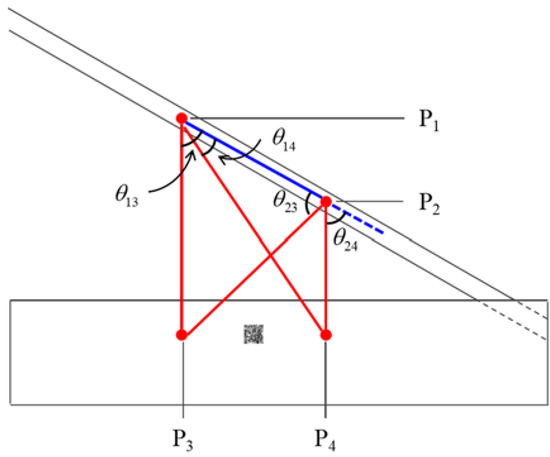
Figure 5.
Determination of tracking target.
In the equation, is the intersection angle. and are the slopes of two intersecting lines. As specified in Figure 5, the intersection angles of P1P2 and P1P3, P1P2 and P1P4, P2P1 and P2P3 and the supplementary angle of are marked as , , and , respectively (the angle range is 0~90°). The cable vibration (noted as ) is in the direction perpendicular to P1P2, and the components of vibration in the direction of P1P3, P1P4, P2P3 and P2P4 can be expressed as , , and , respectively. Therefore, in order to obtain the maximum displacement of the target cable, the tracking targets are chosen according to the maximum angle among , , and . For example, in the case of Figure 5 where is the maximum angle, P2 and P3 are targeted for tracking.
2.2.3. Target Precise Positioning
According to the characteristics of a circle, the intersecting red pixel of the largest row and the largest column was marked as the circle center. While searching for the largest row (or largest column), there will be multiple largest rows, and the median of all the largest rows is regarded as the center of the circle. Figure 6 illustrates the initial point and end point for target center searching. Since there is no significant change in the shape and brightness of each target during video shooting, each frame of image adopts the same positioning algorithm. The tracking accuracy is slightly less than that using template matching or circle center fitting, and the calculation time is greatly reduced.
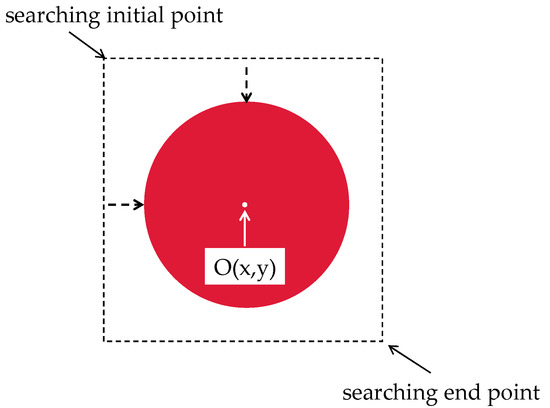
Figure 6.
Precise positioning of target center.
2.2.4. Update of Target Position
Considering the different shaking degrees of the handheld terminal for different users, coordinates [x − r − k, y − r − k] is taken as the starting point for searching in the next frame of the image, and [x + r + k, y + r + k] was taken as the ending point, where [x, y] is the coordinate of the target circle center in the current frame, r is the target radius and k is the extended range. An increase in k will result in a larger search range and longer running time for the program.
2.2.5. Vibration Displacement Correction
Distinct from previous approaches using fixed cameras to collect vibration video of cables, in this study, inevitable shaking of the handheld terminal exists. As a result, the shooting angles and distances will constantly change in the video data, which adversely impacts the displacement measurement. In order remove such noise, the distance between two fixed points on the structure is used for correction. Specifically, the actual distance between P3 and P4 remains unchanged, yet the pixel distance varies in different frames. Thus, the pixel distance in the i-th frame reflects the noises caused by the handheld shooting method. By multiplying a correction coefficient, , the estimated distance between targets on the cable in the i-th frame will be corrected. The displacement-time history is presented in Figure 7.
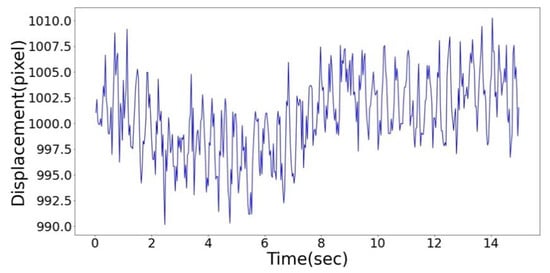
Figure 7.
Displacement-time history.
2.3. Cable Force Determination
2.3.1. Determination of Fundamental Frequency
According to string theory, the natural frequency of stay cable is an integer multiple of the fundamental frequency [2]. The fundamental frequency is generally determined as the (average) difference between two adjacent peak frequencies [14], as indicated in Equations (4) and (5).
Based on the corrected target displacements, a fast Fourier transform (FFT) is performed in order to obtain the frequency spectrum. Take the displacement-time history in Figure 7 as an example, the corresponding spectrum analysis results are shown in Figure 8 where the first peak represents the direct current component and the second peak occurs at the frequency of 2.609 Hz. The exemplified spectrum does not present a pattern of multiple peaks with constant frequency difference.
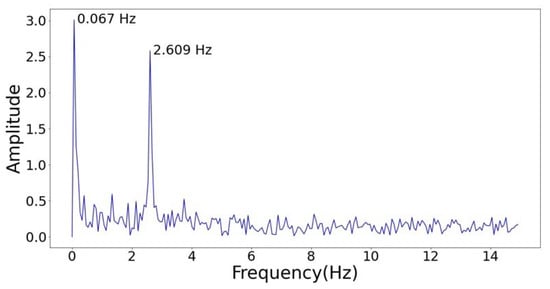
Figure 8.
Spectrum analysis results.
In the case where there is only one peak frequency (excluding the direct current component), its corresponding order can be determined using either of the following two methods:
- (1)
- Manual inference: Since the variations of both fundamental frequency and cable force are relatively small during the construction phase, an initial measurement of cable forces for the entire bridge can be carried out using a dynamic tester. On top of the direct force measurements, the range of natural frequencies can be identified and used to infer the order of corresponding peak frequency.
- (2)
- Automatic recommendations from software: It is first assumed that the order of peak frequency is , where . The range of [2,5] is empirical and the observable order of natural frequencies for stay cables near the bridge end normally falls in it. The possibility that a peak represents the n-th order of natural frequencies is denoted by . The peak frequency is denoted by , where is the sequence position of the peak in a series of frequency data. The possibility . can be calculated using Equation (6), where is the range for data comparison.
Again, take the displacement-time history data in Figure 7 as an example for illustration. When the variable is 3, the possibilities of the peak representing the n-th order of natural frequencies can be calculated, as shown in Table 3.
Table 3.
Determination of order of frequency.
2.3.2. Cable Force Calculation
At this stage, the main vibration frequency and the order of frequency have been obtained, based on which the cable force can be calculated by using Equation (7).
In this equation, is the cable force, is the cable mass per unit length and is the length of cable. corresponds to the -th natural frequency of the cable. represents the elastic modulus and the inertia of moment of the cable, respectively. Considering that the impacts of flexural stiffness on cable force is less than 3% and would further decrease when the cable length increases, the equation can be further simplified as follows, i.e., Equation (8).
In this manner, the cable force can be efficiently estimated by substituting the peak frequency and corresponding order of frequency obtained in the previous steps.
3. Experiment and Validation
A light-weight method for cable force determination using smartphone digital images has been proposed starting from the video data collection of cable vibration, imagery data processing for displacement detection and tracking to cable force estimation. In order to validate its feasibility and accuracy, two real-life cable-stayed bridge projects were used.
3.1. Shuidongwan Bridge in Guangdong, China
The Shuidongwan bridge is located in Maoming City, Guangdong Province in China. It has a total length of 3.333 km. The main bridge is a prestressed concrete cable-stayed bridge with double towers and double cable planes, featuring a main span of 328 m length and side spans of 150 m length each on either side. The main bridge, as shown in Figure 9, was chosen for the experiment.
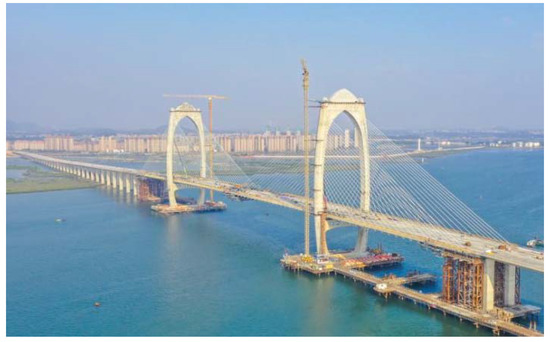
Figure 9.
Picture of the experimental bridge.
Three stay cables, i.e., 18#, 20# and 21#, were selected for the test. They are located at the middle span, linking the western tower and the girder, as shown in Figure 10. The experiment was conducted during both daytime and night-time. The wind speed level during tests is 2~3. An iPhone XS was used to collect video data, its video resolution was set to be 1080 P (1920 × 1080) or 4 K (3840 × 2160) and frame rates were set to be 24 FPS, 30 FPS or 60 FPS. When cable vibration is not obvious, manual excitation can be applied. The pre-designed targets were attached to the three chosen cables, as indicated in Figure 11. A standardized filming of cable vibrations was carried out according to Section 2.1, and the on-site picture is shown in Figure 12a.
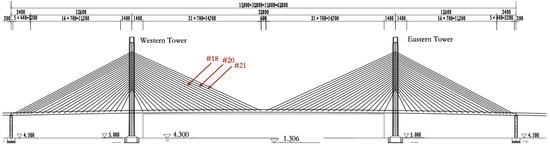
Figure 10.
Layout of test cables.
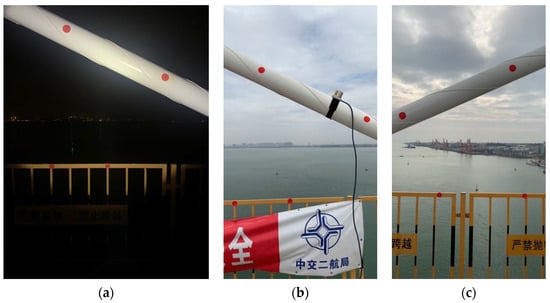
Figure 11.
Attached targets on test cables: (a) Cable 18#, (b) Cable 20# and (c) Cable 21#.
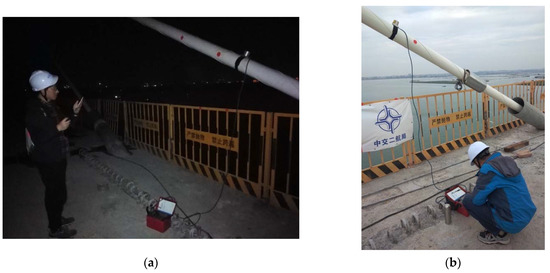
Figure 12.
Photos of on-site filming and dynamic measurement. (a) On-site filming using smartphone. (b) Direct measurement using a dynamic tester.
3.1.1. Reference Data Collection
On top of the proposed method, a direct measurement of cable vibration using a dynamic tester was conducted. Figure 12b presents the picture of sensor-based dynamic measurements. The results of on-site dynamic measuring for Cable 18#, 20# and 21# are shown in Figure 13. Such collected data will be referenced in the subsequent steps in order to validate the accuracy of the smartphone-based method.
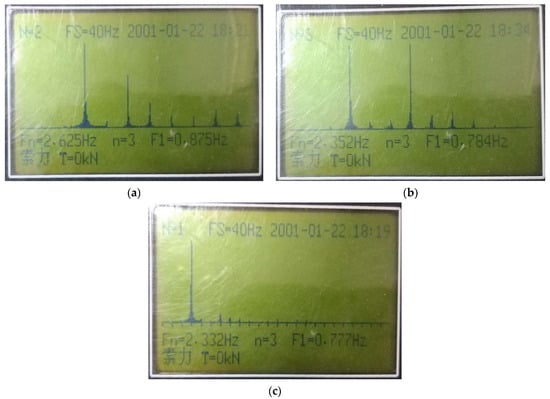
Figure 13.
Results of the sensor-based dynamic measuring: (a) Cable 18#, (b) Cable 20# and (c) Cable 21#.
3.1.2. Validation of the Proposed Method
The vibration video data of the chosen cables under seven different working conditions was obtained. The seven working conditions are specified in Table 4, regarding various lighting conditions, video resolutions, frame rates and durations. By following the image processing procedures in Section 2.2, cable displacements were first identified and tracked. Spectrum analyses were then conducted on top of the displacement-time history, and the results are presented in Figure 14. Cable forces were estimated based on the dynamic responses, i.e., peak frequencies and the corresponding orders of frequency. Errors of frequencies, i.e., , were calculated by comparing the estimations and on-site measurement, based on which the cable force errors, i.e., , were generated. The following equations, i.e., Equations (9) and (10), can be used.
Table 4.
Experimental results of Shuidongwan main bridge and accuracy evaluation.
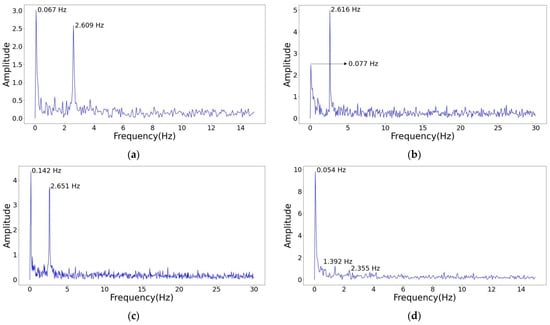
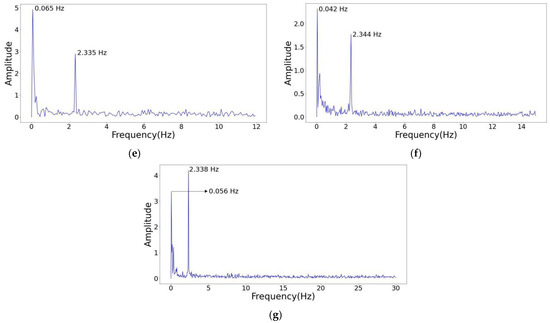
Figure 14.
Spectrum analysis under seven on-site working conditions. (a) Working condition 1. (b) Working condition 2. (c) Working condition 3. (d) Working condition 4. (e) Working condition 5. (f) Working condition 6. (g) Working condition 7.
It is noted that and represent the frequency and cable force obtained by using the proposed smartphone-based method, while and represent the the frequency and cable force measured by sensors, respectively.
The measurements and accuracy comparison under seven working conditions are summarized in Table 4. It can be inferred from Figure 14 that due to the influence of hardware equipment, shaking noise, lighting conditions, etc., the recognized dynamic responses of stay cables based on the smart terminal was of a third-order vibration frequency. Low-order and high-order vibration frequencies were not obvious, but this does not mean that the low-order or high-order vibration frequency cannot be identified under other working conditions. The successful identification of frequencies in other orders is related to factors such as the cable status, the vibration reduction measures and the external environment while sampling. As for the accuracy of the proposed smartphone-based method, it was observed that the light-weight method achieved a maximum error of 0.99% for frequency identification and a maximum error of 1.99% for cable force estimation, which can meet the requirements in practical applications and have improved the methods proposed in previous studies (as summarized in Table 1).
Based on the experiment results, discussion will be illustrated in the following three aspects. Firstly, the reliability and accuracy of the proposed smartphone-based method has been verified given the fact that the maximum error of cable force estimation and the traditional dynamic measurement is 1.99% and the average error is 0.85%. Secondly, since the third-order vibration frequency is in the range of 2.332 Hz~2.625 Hz, a frame rate of 24 FPS can meet the requirements for video data collection. However, if the vibration frequency is higher or higher-order vibration frequencies need to be identified, the sampling frame rate needs to be increased accordingly. Thirdly, increasing sampling duration can improve sampling accuracy. However, an increase in the video resolution, sampling frame rate and sampling time can result in an increase in the time for data processing.
3.2. Baijusi Yangtze River Bridge in Chongqing, China
To further prove the practicability of the proposed method, another experiment was conducted on Baijusi Yangtze River Bridge, a two-tower cable-stayed steel truss bridge in Chongqing, China. Two cables, #15 and #17, were chosen for the test. Other experimental settings were the same as the first experiment. The results are presented in Table 5, where frequency and cable force were obtained by using the proposed smartphone-based method and compared to sensor-based dynamic measurements. The maximum error for frequency identification was 0.82% (under the fourth working condition), and the corresponding error for cable force estimation was 1.64%.
Table 5.
Experimental results of Baijusi Yangtze River bridge and accuracy evaluation.
It is worth noting that while using the vision-based method for cable force determination, observable displacements of cables are critical to the identification process. The cables fail to present considerable displacements when the cable length is not long enough, ambient excitations are low or vibration mitigation measures are applied. As a result, the proposed method will fail to accurately retrieve cable displacements. External excitations can be applied until the cable vibrations are easily identifiable.
4. Conclusions
Based on the conventional vibration frequency method for cable force determination, a lightweight measurement method using non-fixed smartphone was developed in this paper and verified through real-life bridge experiments. This study contributes to the body of literature in the following three aspects:
- Based on the smartphone terminal, a standardized procedure for on-site cable vibration video collection is proposed, including target design and layout, parameter settings of data acquisition and video recording method. The standardization of the procedure can facilitate multi-project and multi-person data collection in practice.
- The procedure of video data processing and analysis is developed, including target recognition, target tracking and displacement correction. The vibration displacement of stay cables can be automatically extracted based on video data. The algorithm is verified to be stable and efficient.
- By comparing with the sensor-based cable force measurement, the maximum error of the proposed method based on the smartphone terminal is 1.99%, which is smaller than conventional methods. The proposed method is proven to generate reliable and accurate cable force estimations.
- The proposed method and the developed software allow simultaneous tests on multiple projects and multiple cable surfaces by multiple personnel. By scanning the QR code for cable location and information retrieval, the users can upload videos of cable vibration and perform cable force measurement with efficiency and accuracy. For future work, the algorithms can be improved and application on smartphones can be developed to allow real-time cable force analysis.
The proposed method based on smartphone imagery is advantageous in practice since there is no need to carry special equipment or to fix the camera. The measurement method in the field will be simple, with reliable accuracy and low cost, thus boosting great promotion value in engineering applications.
Author Contributions
Conceptualization, Y.W., K.L. and Y.C.; methodology, Y.W., K.L., Y.C. and S.X.; software, K.L. and Y.C.; validation, Y.W., K.L. and Y.C.; formal analysis, Y.W.; investigation, Y.W., K.L. and Y.C.; resources, Y.W. and W.S.; data curation, Y.W., K.L. and Y.C.; writing—original draft preparation, Y.W. and S.X.; writing—review and editing, S.X.; visualization, S.X. and W.S.; supervision, Y.W. and W.S.; project administration, Y.W.; funding acquisition, Y.W. All authors have read and agreed to the published version of the manuscript.
Funding
This research was funded by National Key Research and Development Program of China (grant number 2017YFC0805304).
Institutional Review Board Statement
Not applicable.
Informed Consent Statement
Not applicable.
Data Availability Statement
Not applicable.
Conflicts of Interest
The authors declare no conflict of interest.
References
- Chen, C.-C.; Wu, W.-H.; Leu, M.-R.; Lai, G. Tension determination of stay cable or external tendon with complicated constraints using multiple vibration measurements. Measurement 2016, 86, 182–195. [Google Scholar] [CrossRef]
- Geier, R.; De Roeck, G.; Flesch, R. Accurate cable force determination using ambient vibration measurements. Struct. Infrastruct. Eng. 2006, 2, 43–52. [Google Scholar] [CrossRef]
- Kim, J.-T.; Nguyen, K.-D.; Huynh, T.-C. Wireless health monitoring of stay cable using piezoelectric strain response and smart skin technique. Smart Struct. Syst. 2013, 12, 381–397. [Google Scholar] [CrossRef]
- Wang, M. Health monitoring and assessment of long-span bridges. In Proceedings of the 2nd International Conference on Structural Health Monitoring of Intelligent Infrastructure, Shenzhen, China, 16–18 November 2005; pp. 121–132. [Google Scholar]
- Xu, S.; Wang, J.; Shou, W.; Ngo, T.; Sadick, A.M.; Wang, X. Computer Vision Techniques in Construction: A Critical Review. Arch. Comput. Methods Eng. 2021, 28, 3383–3397. [Google Scholar] [CrossRef]
- Xu, S.; Wang, J.; Wu, P.; Shou, W.; Wang, X.; Chen, M. Vision-Based Pavement Marking Detection and Condition Assessment—A Case Study. Appl. Sci. 2021, 11, 3152. [Google Scholar] [CrossRef]
- Xue, F.; Lu, W.; Chen, K. Automatic Generation of Semantically Rich As-Built Building Information Models Using 2D Images: A Derivative-Free Optimization Approach. Comput.-Aided Civ. Infrastruct. Eng. 2018, 33, 926–942. [Google Scholar] [CrossRef]
- Fathi, H.; Dai, F.; Lourakis, M. Automated as-built 3D reconstruction of civil infrastructure using computer vision: Achievements, opportunities, and challenges. Adv. Eng. Inform. 2015, 29, 149–161. [Google Scholar] [CrossRef]
- Mohan, A.; Poobal, S. Crack detection using image processing: A critical review and analysis. Alex. Eng. J. 2018, 57, 787–798. [Google Scholar] [CrossRef]
- Koch, C.; Georgieva, K.; Kasireddy, V.; Akinci, B.; Fieguth, P. A review on computer vision based defect detection and condition assessment of concrete and asphalt civil infrastructure. Adv. Eng. Inform. 2015, 29, 196–210. [Google Scholar] [CrossRef] [Green Version]
- Feng, D.; Feng, M.Q. Computer vision for SHM of civil infrastructure: From dynamic response measurement to damage detection—A review. Eng. Struct. 2018, 156, 105–117. [Google Scholar] [CrossRef]
- Ji, Y.; Chang, C. Nontarget stereo vision technique for spatiotemporal response measurement of line-like structures. J. Eng. Mech. 2008, 134, 466–474. [Google Scholar] [CrossRef]
- Chen, C.-C.; Tseng, H.-Z.; Wu, W.-H.; Chen, C.-H. Modal frequency identification of stay cables with ambient vibration measurements based on nontarget image processing techniques. Adv. Struct. Eng. 2012, 15, 929–942. [Google Scholar] [CrossRef]
- Ji, Y.; Chang, C. Nontarget image-based technique for small cable vibration measurement. J. Bridge Eng. 2008, 13, 34–42. [Google Scholar] [CrossRef]
- Du, W.; Lei, D.; Bai, P.; Zhu, F.; Huang, Z. Dynamic measurement of stay-cable force using digital image techniques. Measurement 2020, 151, 107211. [Google Scholar] [CrossRef]
- Yan, B.; Li, D.; Chen, W.; Deng, L.; Jiang, X. Mode shape-aided cable force determination using digital image correlation. Struct. Health Monit. 2020. [Google Scholar] [CrossRef]
- Kim, S.-W.; Jeon, B.-G.; Cheung, J.-H.; Kim, S.-D.; Park, J.-B. Stay cable tension estimation using a vision-based monitoring system under various weather conditions. J. Civ. Struct. Health Monit. 2017, 7, 343–357. [Google Scholar] [CrossRef]
- Kim, S.-W.; Jeon, B.-G.; Kim, N.-S.; Park, J.-C. Vision-based monitoring system for evaluating cable tensile forces on a cable-stayed bridge. Struct. Health Monit. 2013, 12, 440–456. [Google Scholar] [CrossRef]
- Feng, D.; Scarangello, T.; Feng, M.Q.; Ye, Q. Cable tension force estimate using novel noncontact vision-based sensor. Measurement 2017, 99, 44–52. [Google Scholar] [CrossRef]
- Tian, Y.; Zhang, C.; Jiang, S.; Zhang, J.; Duan, W. Noncontact cable force estimation with unmanned aerial vehicle and computer vision. Comput.-Aided Civ. Infrastruct. Eng. 2021, 36, 73–88. [Google Scholar] [CrossRef]
- Zhao, X.; Han, R.; Ding, Y.; Yu, Y.; Guan, Q.; Hu, W.; Li, M.; Ou, J. Portable and convenient cable force measurement using smartphone. J. Civ. Struct. Health Monit. 2015, 5, 481–491. [Google Scholar] [CrossRef]
- Zhao, X.; Han, R.; Yu, Y.; Hu, W.; Jiao, D.; Mao, X.; Li, M.; Ou, J. Smartphone-based mobile testing technique for quick bridge cable–force measurement. J. Bridge Eng. 2017, 22, 06016012. [Google Scholar] [CrossRef]
- Zhao, X.; Ri, K.; Han, R.; Yu, Y.; Li, M.; Ou, J. Experimental Research on Quick Structural Health Monitoring Technique for Bridges Using Smartphone. Adv. Mater. Sci. Eng. 2016, 2016, 1871230. [Google Scholar] [CrossRef] [Green Version]
- Zhao, X.; Ri, K.; Wang, N. Experimental verification for cable force estimation using handheld shooting of smartphones. J. Sens. 2017, 2017, 5625396. [Google Scholar] [CrossRef] [Green Version]
- Zhao, X.; Ri, K.; Yu, Y.; Kang, C.; Li, M.; Ou, J. Feasibility Study for Vision-Based Cable Force Measurement Using Smartphone. In Proceedings of the Smart Materials, Adaptive Structures and Intelligent Systems, Stowe, VT, USA, 28–30 September 2016; p. V001T005A010. [Google Scholar]
- Zhao, X.; Yu, Y.; Hu, W.; Jiao, D.; Han, R.; Mao, X.; Li, M.; Ou, J. Cable force monitoring system of cable stayed bridges using accelerometers inside mobile smart phone. In Proceedings of the Sensors and Smart Structures Technologies for Civil, Mechanical, and Aerospace Systems 2015, San Diego, CA, USA,, 9–12 March 2015; p. 94351. [Google Scholar]
- Morgenthal, G.; Rau, S.; Taraben, J.; Abbas, T. Determination of Stay-Cable Forces Using Highly Mobile Vibration Measurement Devices. J. Bridge Eng. 2018, 23, 04017136. [Google Scholar] [CrossRef]
- Feng, Z.; Chao, Y.; Chenguang, W.; Bingquan, W.; Jian, L. Circle detection and its number identification in complex condition based on random Hough transform. Chin. J. Sci. Instrum. 2013, 34, 622–628. [Google Scholar]
- Yonglin, H.; Yutang, Y.; Zhenlong, C.; Naosheng, Q. New method of fast Hough transform for circle detection. J. Electron. Meas. Instrum. 2010, 24, 837–841. [Google Scholar]
- Ting, L.; Ning, L. Study on circle locating technology based on machine vision. Comput. Eng. Appl. 2012, 48, 153–156. [Google Scholar]
Publisher’s Note: MDPI stays neutral with regard to jurisdictional claims in published maps and institutional affiliations. |
© 2021 by the authors. Licensee MDPI, Basel, Switzerland. This article is an open access article distributed under the terms and conditions of the Creative Commons Attribution (CC BY) license (https://creativecommons.org/licenses/by/4.0/).