1. Introduction
Skin analysis, particularly of facial skin, is very important in many cosmetic and medical applications. In this paper, we present our latest research on skin characterizations by two novel skin imaging technologies—i.e., Contact Capacitive Imaging and High-Resolution Ultrasound Imaging. The aim is to measure the skin water content and skin layer thickness of different skin sites, mainly for facial skin, and to perform skin image analysis by using Machine Learning Algorithms.
Contact Capacitive Imaging is a novel imaging technique based on the dielectric constant measurement principle. It was originally developed for biometric applications, and has found applications for skin water content as well as skin texture measurements [
1,
2,
3,
4,
5]. Our previous studies show that with Contact Capacitive Imaging we can analyze skin water content, skin solvent penetrations, skin texture and skin micro-relief analysis [
6,
7,
8,
9].
Ultrasound imaging [
10,
11,
12] is a well-established technique that has been applied in medicine since the 1950s. Over the years, it has significantly improved with advancements in technology, such as miniaturization, faster data processing and improved image quality. Little changes in the imaging system make it applicable to aesthetic beauty, wound care and dermatology. The EPISCAN I-200 High-Resolution Ultrasound (HRUS) [
13] imaging system is a state-of-the-art ultrasound system, with frequencies ranging from 20 MHz to 50 MHz. These high frequencies help to generate high-resolution skin images which make it possible to differentiate different skin layers such as stratum corneum, epidermis, dermis and subcutaneous [
14,
15].
Comprehensive detailing with a friendly interface is EPISCAN’s main feature. Additionally, it also allows the tiling of multiple images on the scanner screen along with an illustration of the progression of conditions, thus making comparison quick and flexible. Any suspected damage to skin tissues can be diagnosed using EPISCAN. high frequency ultrasonic waves facilitate estimation of changes and damages to the skin. Clinical skin assessment has become easier and quicker with such advanced tools.
Contact Capacitive Imaging and High-Resolution Ultrasound Imaging provide complementary information to other skin diagnostic devices, such as skin water content, skin trans-dermal water loss, skin elasticity, skin sebum measurement devices and so on. The advantage of the two technologies is that they are imaging based, which provides more information, whilst the disadvantages are that they are expensive and need complex analysis methods to extract information from the images. Therefore, to develop new Machine Learning algorithms to analyze skin capacitive images and high-resolution ultrasound images is very important, and is the main novelty and the main contribution of this research.
2. Materials and Methods
2.1. Apparatus
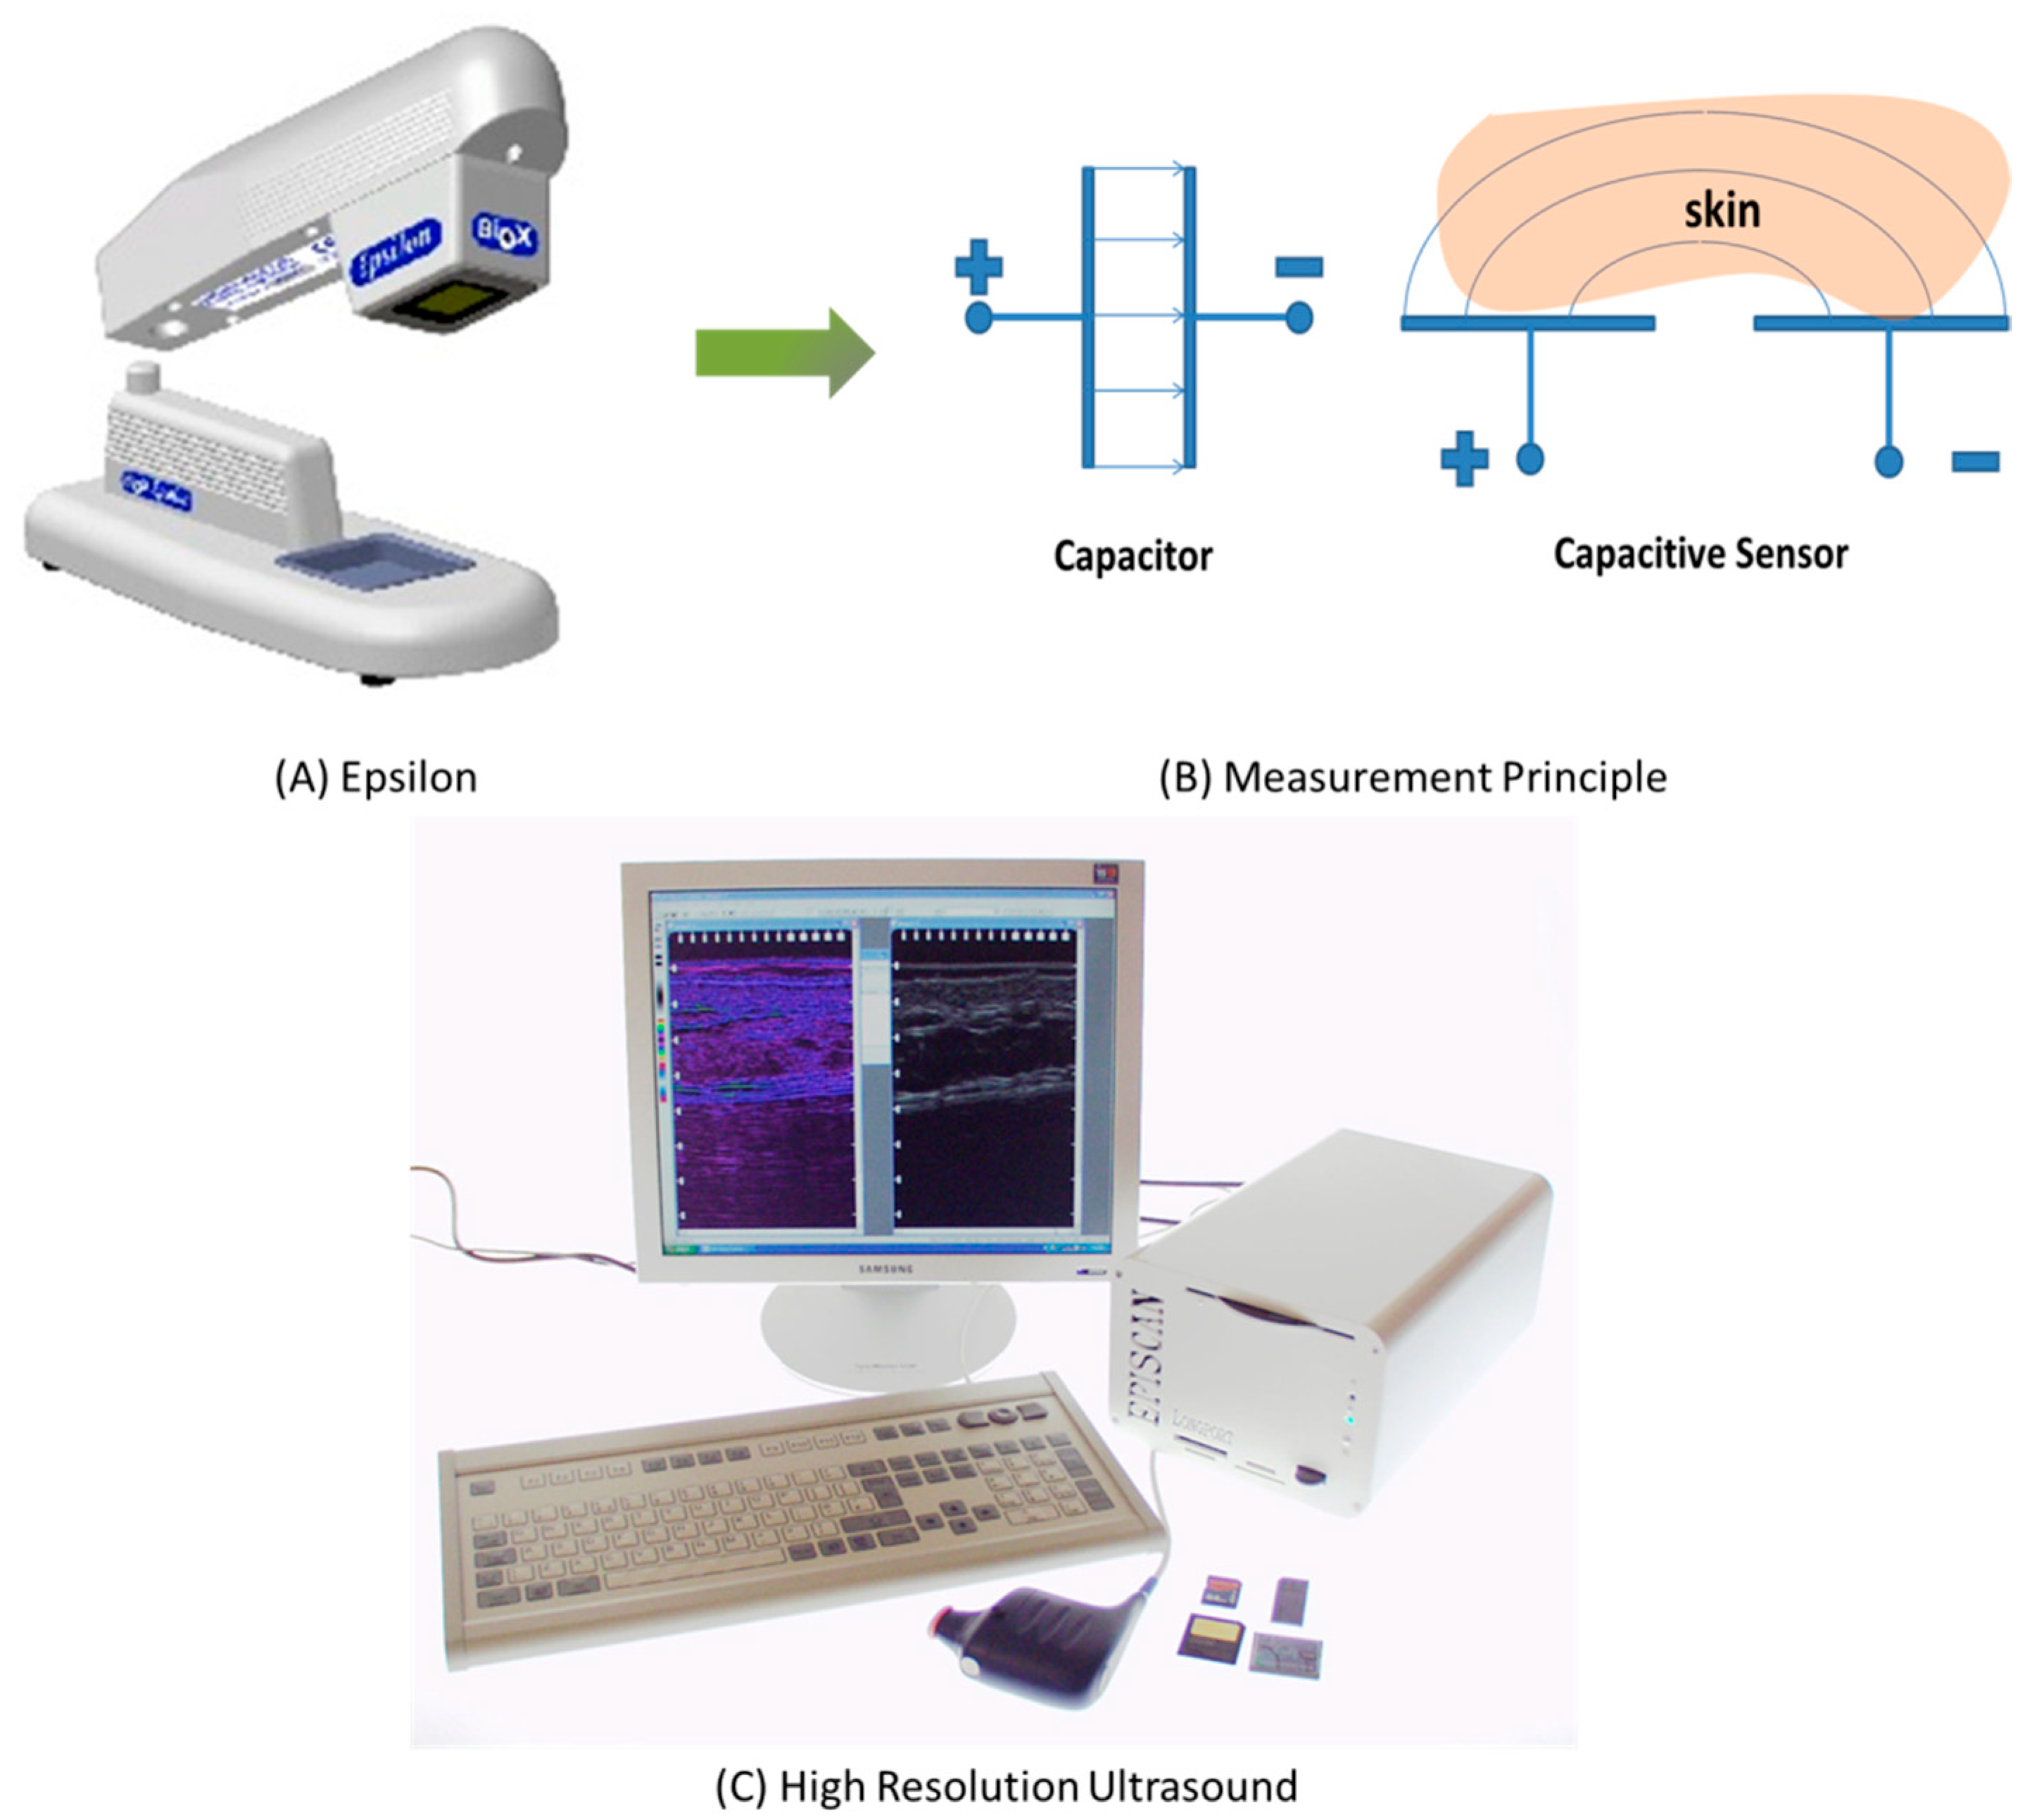
Figure 1 shows photos and schematic diagrams of the Epsilon permittivity imaging system (Biox Systems Ltd., London, UK) and the EPISCAN I-200 High-Resolution Ultrasound (HRUS) imaging system (Longport Inc., Chadds Ford, PA, USA). The Epsilon is based on a Fujitsu fingerprint sensor [
16], which has a resolution of 256 × 300 pixels with 50 μm spatial resolution and 8-bit grey-scale capacitance resolution per pixel. The measurements can be conducted by pressing the probe against the skin surface. Each measurement typically takes 2 to 3 s, with controlled contact time and pressure. The EPISCAN is a High-Resolution Ultrasound (HRUS) imaging system that utilizes ultrasound at frequencies as high as 50 MHz to image the skin and underlying soft tissue. The system has been designed to provide users with images of very high resolution and clarity and offers a user-friendly interface, enabling the EPISCAN to be utilized in a broad range of clinical applications, as well as in research and development. The EPISCAN enables the examination of tissue at a microscopic level without the need to perform damaging biopsies. The measurements can be conducted by filling the probe with water, then sealing the probe with a designated thin rubber film. A small quantity of ultrasound gel is also needed on the skin site. A measurement typically takes a few seconds.
2.2. Machine Learning Algorithms
Skin image classification is a very important aspect of skin image analysis. For the skin Contact Capacitive image classification, we used different Deep Learning Neural Networks, such as AlexNet [
17], GoogLeNet [
18], VGG [
19], ResNet [
20], Inception [
21], MobileNet [
22], DenseNet [
23], SqueezeNet [
24], InceptionResNet [
25] and Xception [
26]. They are pre-trained Convolutional Neural Networks (CNNs) that have been trained on over 1 million images from the ImageNet Dataset [
27]. They can classify images into 1000 object categories (e.g., keyboard, mouse, coffee mug, pencil). Through Transfer Learning [
28], we can take the advantages of pre-trained models and re-train these models over the skin Contact Capacitive images, and achieve classification over different skin sites.
For the skin High-Resolution Ultrasound Imaging classifications, we have developed two new feature-based classification methods. One is based on the luminosity values (0 to 255) from the red, green or blue channels of the images. In this approach, Logistic Regression, K-Nearest Neighbor (KNN), Neural Networks (NNs) and Random Forest were used as classifiers. Logistic Regression is a parametric model where KNN is a non-parametric model, and KNN is comparatively slower than Logistic Regression. KNN supports non-linear solutions where Logistic Regression supports only linear solutions. NNs need a large volume of training data compared to KNN to achieve sufficient accuracy. NNs need lot of hyperparameter tuning compared to KNN.
Another new classification method is based on skin ultrasound image texture. In this approach, ten types of textural features were extracted from each skin ultrasound image. Of the ten textural features, five were traditional textural features and five were from the output of one intermediate layer of pre-trained convolutional networks, such as DenseNet, MobileNet, ResNet, VGG and Xception. We then applied principal component analysis (PCA) on each feature class and retained the first two principal components to generate scatter plots for exploratory data analysis.
Although the classification algorithms developed in this study are mainly for differentiating skin sites, they can also be used for other classification tasks, such as differentiating dry skin from normal skin, damaged skin from intact skin, young skin from aged skin, healthy skin from diseased skin, and even different types of skin diseases.
2.3. Measurement Methods
All the measurements were performed under normal ambient laboratory conditions of 20–21 °C and 40–50% relative humidity.
The measurements were performed on the different skin sites, such as the volar forearm, cheek, chin, eye corner, forehead, lips, neck and nose, of healthy volunteers (aged 20–70, both male and female, Caucasian and Asian). The test skin sites used were initially wiped clean with ETOH/H2O (95/5) solution. The volunteers were acclimatized in the laboratory for 20 min prior to the experiments.
3. Results
3.1. Skin Contact Capacitive Images
Skin Contact Capacitive Imaging produces 2D skin surface images.
Figure 2 shows the typical contact capacitive images of different skin sites, such as the volar forearm, cheek, chin, eye corner, forehead, lips, neck and nose. The signal intensity (image brightness) is proportional to the water content. As illustrated, the skin contact capacitive images can show not only the water content of different skin sites, but also the skin texture. The volar forearm has the most uniform skin texture, while the nose, cheek and eye corner are less uniform. The textural differences of the different skin sites are also clearly seen.
3.1.1. Skin Water Content
Table 1 shows the mean and the standard deviation of measured skin Epsilon values of different volunteers at the different skin sites. Epsilon values are in arbitrary units, but proportional to the skin water content. The results show that the lips and nose have the lowest water content, whilst the cheek, eye corner and under-eye have the highest water content. The lips and nose also have the lowest standard deviation, whilst the neck, eye corner and under-eye have the highest standard deviation.
3.1.2. Skin Image Classification
Table 2 shows the skin Contact Capacitive image classification results by using different Deep Learning Neural Networks, such as AlexNet, GoogLeNet, VGG16, ResNet-50, InceptionV3, MobileNetV2, DenseNet 201, SqueezeNet, InceptionResNetV2 and Xception, through Transfer Learning. The results show that DenseNet 201 gives the best accuracy (83.8%), but it also takes a long time to train (110 min). GoogLeNet gives the best performance if you consider both the accuracy (73.5%) and training time (21 min), VGG16 gives the worse performance with both accuracy (59.1%) and training time (114 min). SqueezeNet is the quickest to train (8 min) but the accuracy is very low (61.1%). The training was carried out by using MATLAB software on a standard desktop computer with Intel
® Core™ i7-3770 CPU @3.4 GHz, 8 cores, 16 GB RAM and Windows 8.1 operating system.
3.2. High-Resolution Skin Ultrasound Images
Differently from skin Contact Capacitive Imaging, which produces surface images of the skin, the EPISCAN I-200 High-Resolution Ultrasound (HRUS) Imaging system returns a cross-sectional view along a plane approximately orthogonal to the skin surface.
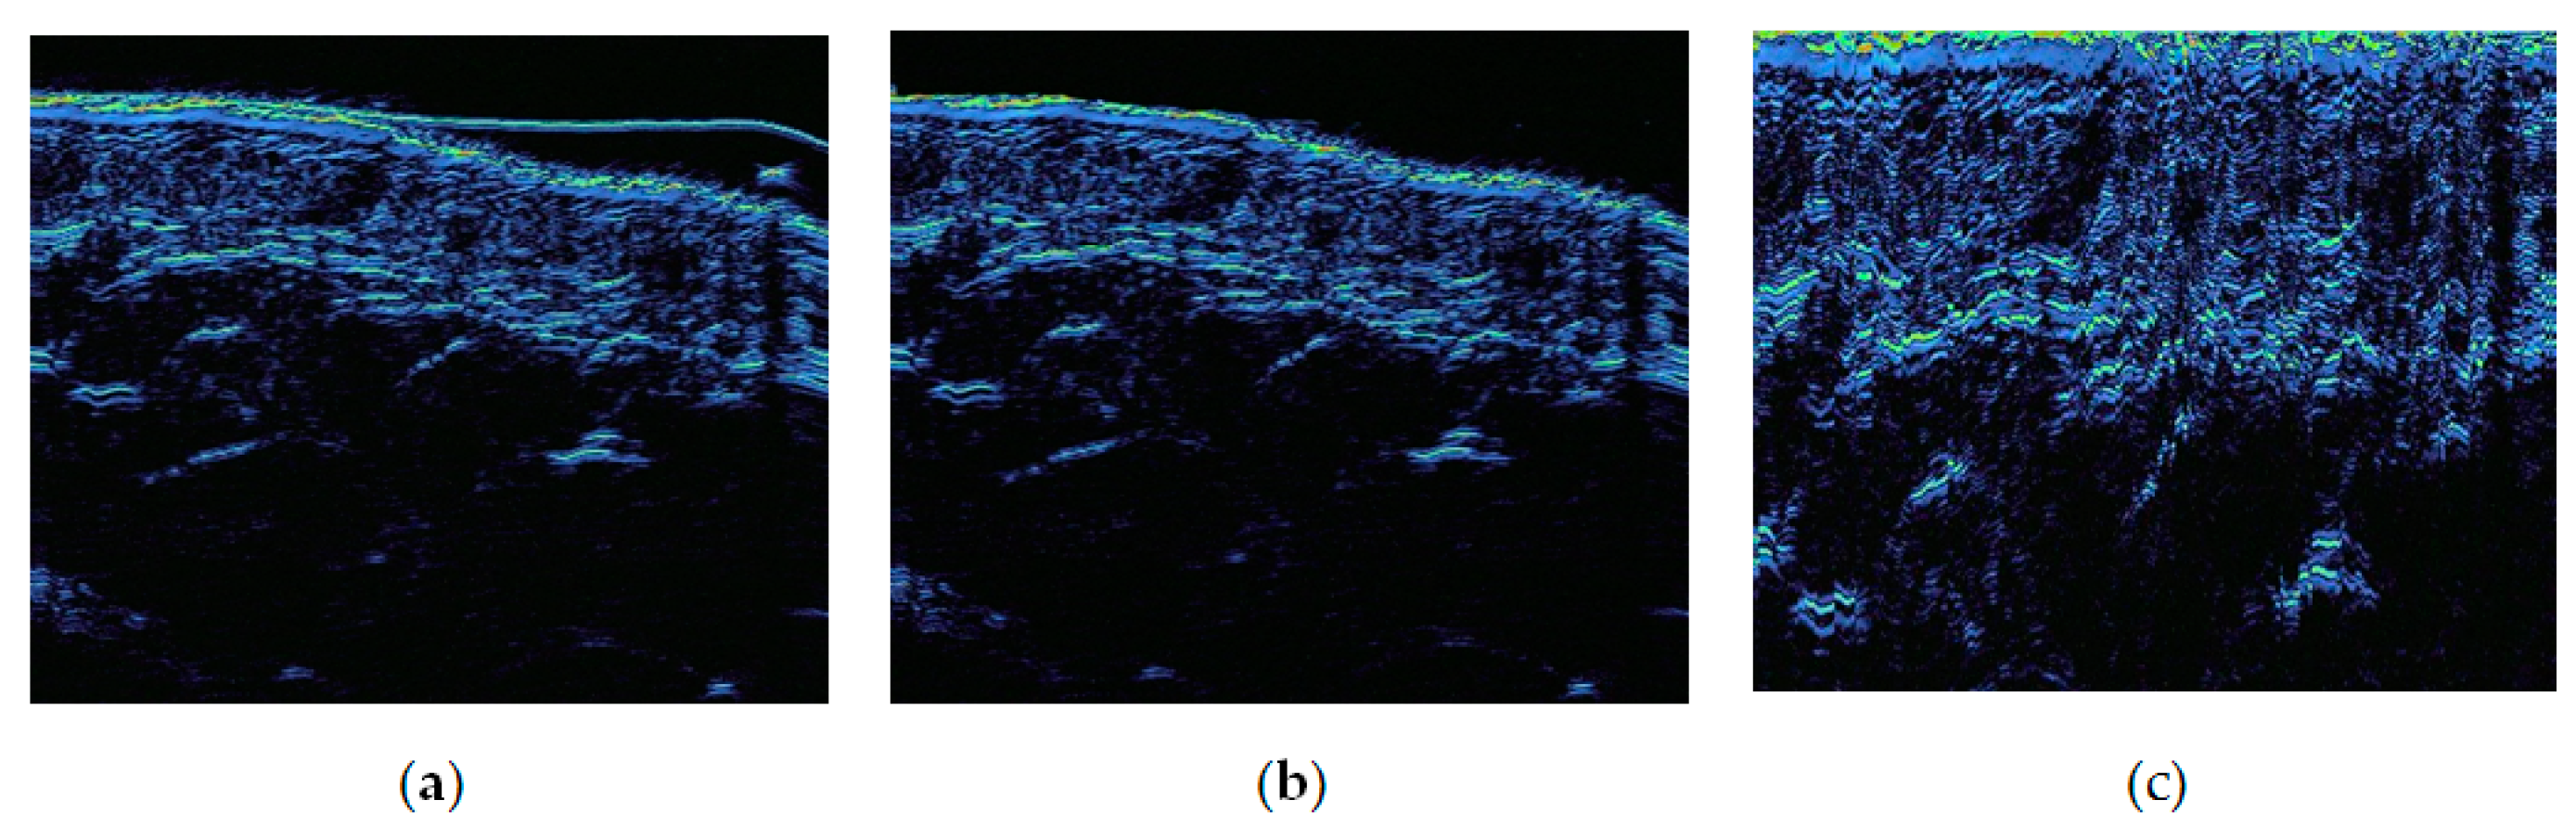
Figure 3 shows the typical high-resolution ultrasound images at the different skin sites: cheeks, chin, forearm, forehead, lips and nose.
3.2.1. Skin Layer Thickness
By analyzing the skin ultrasound images, we can obtain the thickness information of the different skin layers.
Figure 4 shows the skin layers at different cross-sections in the high-resolution ultrasound image [
6].
In this experiment, a sample of 605 color images was obtained from eight different areas of the body: the arm, cheek, chin, eyelid, forehead, lips, neck and nose.
Table 3 shows the skin layers’ thickness measured at the different skin sites. The results show that the cheek contains the highest percentage of dermis among all facial sites, about 95.3%, while the neck’s dermis percentage was the lowest at 92.0%. The value for the stratum corneum was found to be highest on the chin, at 0.038 mm, and lowest on the arm—merely 0.024 mm. Likewise, the epidermis thickness measurements recorded for the arm and chin were lowest (0.047 mm) and highest (0.083 mm), respectively. A deviation from the mean indicates poor skin condition. The risk of skin damage will be higher when the standard deviation is high.
Figure 5 shows the average stratum corneum thickness at the different skin sites with +1 sigma and −1 sigma.
3.2.2. Luminosity Feature-Based Skin Image Classifications
A new classification method, based on the luminosity values (0 to 255) from the red, green or blue channels, rather than images themselves, has been developed. To achieve this, we need to analyze the images first, to extract the luminosity feature values.
Expert evaluation of the ultrasound images allows formulating the following observations/hypotheses:
Areas of different colors correspond to different elements of the skin: fat, etc.
Properties of skin, e.g., density of the elements, may only depend on the depth. As such, we are not looking for any two-dimensional patterns and the problem is essentially one-dimensional.
Coloration of the images is essential, so moving to monochrome representation will lose information.
There are three major issues with the ultrasound images, as shown in
Figure 3.
The large empty area on top, which is not perfectly black. This is due to the design of the probe.
The natural curvature of skin.
Possible presence of the gel layer, due to the imperfect contact between the probe’s thin rubber film and the skin.
To rectify the issues, the following three transformations of the images were performed:
Gel was manually removed if present.
Curvature was removed algorithmically.
Nearly black area on top, if present, was removed algorithmically and only 50% of the image vertical area was kept.
Figure 6 illustrates the transformations performed.
Table 4 summarizes the training dataset with total 368 images, modified to remove outliers per site from the original set of images.
Factor Specification
The pre-processed images were used as input for the training algorithms. Images were first represented as three matrices of luminosity values from 0 to 255, with each matrix representing red, green or blue channels.
Due to the relatively small number of observations, we chose the following features for classification per channel:
Mean luminosity value.
Standard deviation of luminosity value.
Median luminosity value.
Tail of the luminosity histogram with bin values (150, 170, 200, 256).
Consequently, there were six features per channel and 18 features on the whole image. Values of those 18 factors were then used as the explanatory variable for the classification. The output variable was a number from 1 to 7, coding the facial site.
Three standard classifiers were used: Logistic, K-Nearest neighbor and Neural Networks. Training was repeated 10 times and on each iteration the set was split randomly into 20% and 80% groups, representing testing and training sets. Score and accuracy across all runs were then aggregated.
Table 5 presents a typical average output; the best ever average score we observed was 0.68 or 68%. Score represents the quality of training, while accuracy represents the quality of classification on the testing set. It can be concluded that Logistic classifier performs best. We expect its performance to be improved for larger sample sizes and more rigorous systematic measurements. Random Forest was also originally tried, but it appeared constantly overfit and underclassified.
3.2.3. Texture-Based Skin Image Classification
Another image classification method based on image texture was also investigated in this study. In this approach, the original EPISCAN images in DICOM (.dcm) format were cropped to patches of dimension 512 × 1024 pixels (
Figure 7) and converted, losslessly, to 8-bit gray-scale bitmaps (.bmp). No further pre-processing operation, such as filtering, de-noising, intensity clipping and/or resampling, was applied.
Ten types of textural features (five traditional and five based on convolutional networks—see below) were extracted from each image, this way obtaining as many
Mi data matrices,
i ∈ {1, …, 10}, each of dimension
N ×
Fi, where
Fi indicates the number of features generated by the
i-th descriptor. We applied principal component analysis (PCA) on each of the
Mi and retained the first two principal components to generate scatter plots for exploratory data analysis (
Figure 8 and
Figure 9).
Traditional (‘Hand-Designed’) Descriptors
Discrete Cosine Filters (DCF)
Mean and standard deviation of the transformed images processed through a bank of 25 two-dimensional separable filters. The filters were generated via pair-wise outer product of five one-dimensional DCF kernels defined on a sequence of 11 points [
29] (25 × 2 = 50 features).
Gabor filters
Mean and standard deviation of the magnitude of the transformed images processed through a bank of 25 Gabor filters with five frequencies and five orientations [
29] (525 × 2 = 50 features).
Laws’ masks
Mean and standard deviation of the transformed images processed through a bank of 25 two-dimensional separable filters. These were generated via pair-wise outer product on the five one-dimensional Laws’ kernels [
30] (25 × 2 = 50 features).
Local binary patterns (LBP)
Concatenation of directional (non-rotation-invariant) local binary patterns histograms [
31] computed on eight-pixel digital circles of radius 1 px, 2 px and 3 px (256 × 3 = 768 features).
Zernike polynomials
Mean and standard deviation of the transformed images processed through a bank of filters based on even and odd Zernike polynomials of order
r ∈ {0, …., 6} [
29,
32] (42 features).
Texture Descriptors Based on Deep Learning
We considered five learned descriptors from the following pre-trained convolutional networks: DenseNet121, MobileNet, ResNet50, VGG16 and Xception. Following the approach described in previous works [
33,
34,
35], we used the
L1-normalised output of one intermediate layer as image features. Specifically, we retrieved the features from the ‘dropout’ layer of the MobileNet, the ‘fc2′ layer of the VGG16 and the ‘avg_pool’ layer of the DenseNet121, ResNet50 and Xception networks. The number of features, respectively, was 1024 for DenseNet121 and MobileNet, 2048 for ResNet50 and Xception and 4096 for VGG16.
All the networks had been previously trained on the ImageNet dataset and were used off-the-shelf without any further adjustment or fine-tuning. The EPISCAN images were resized to fit the receptive field of each net before processing.
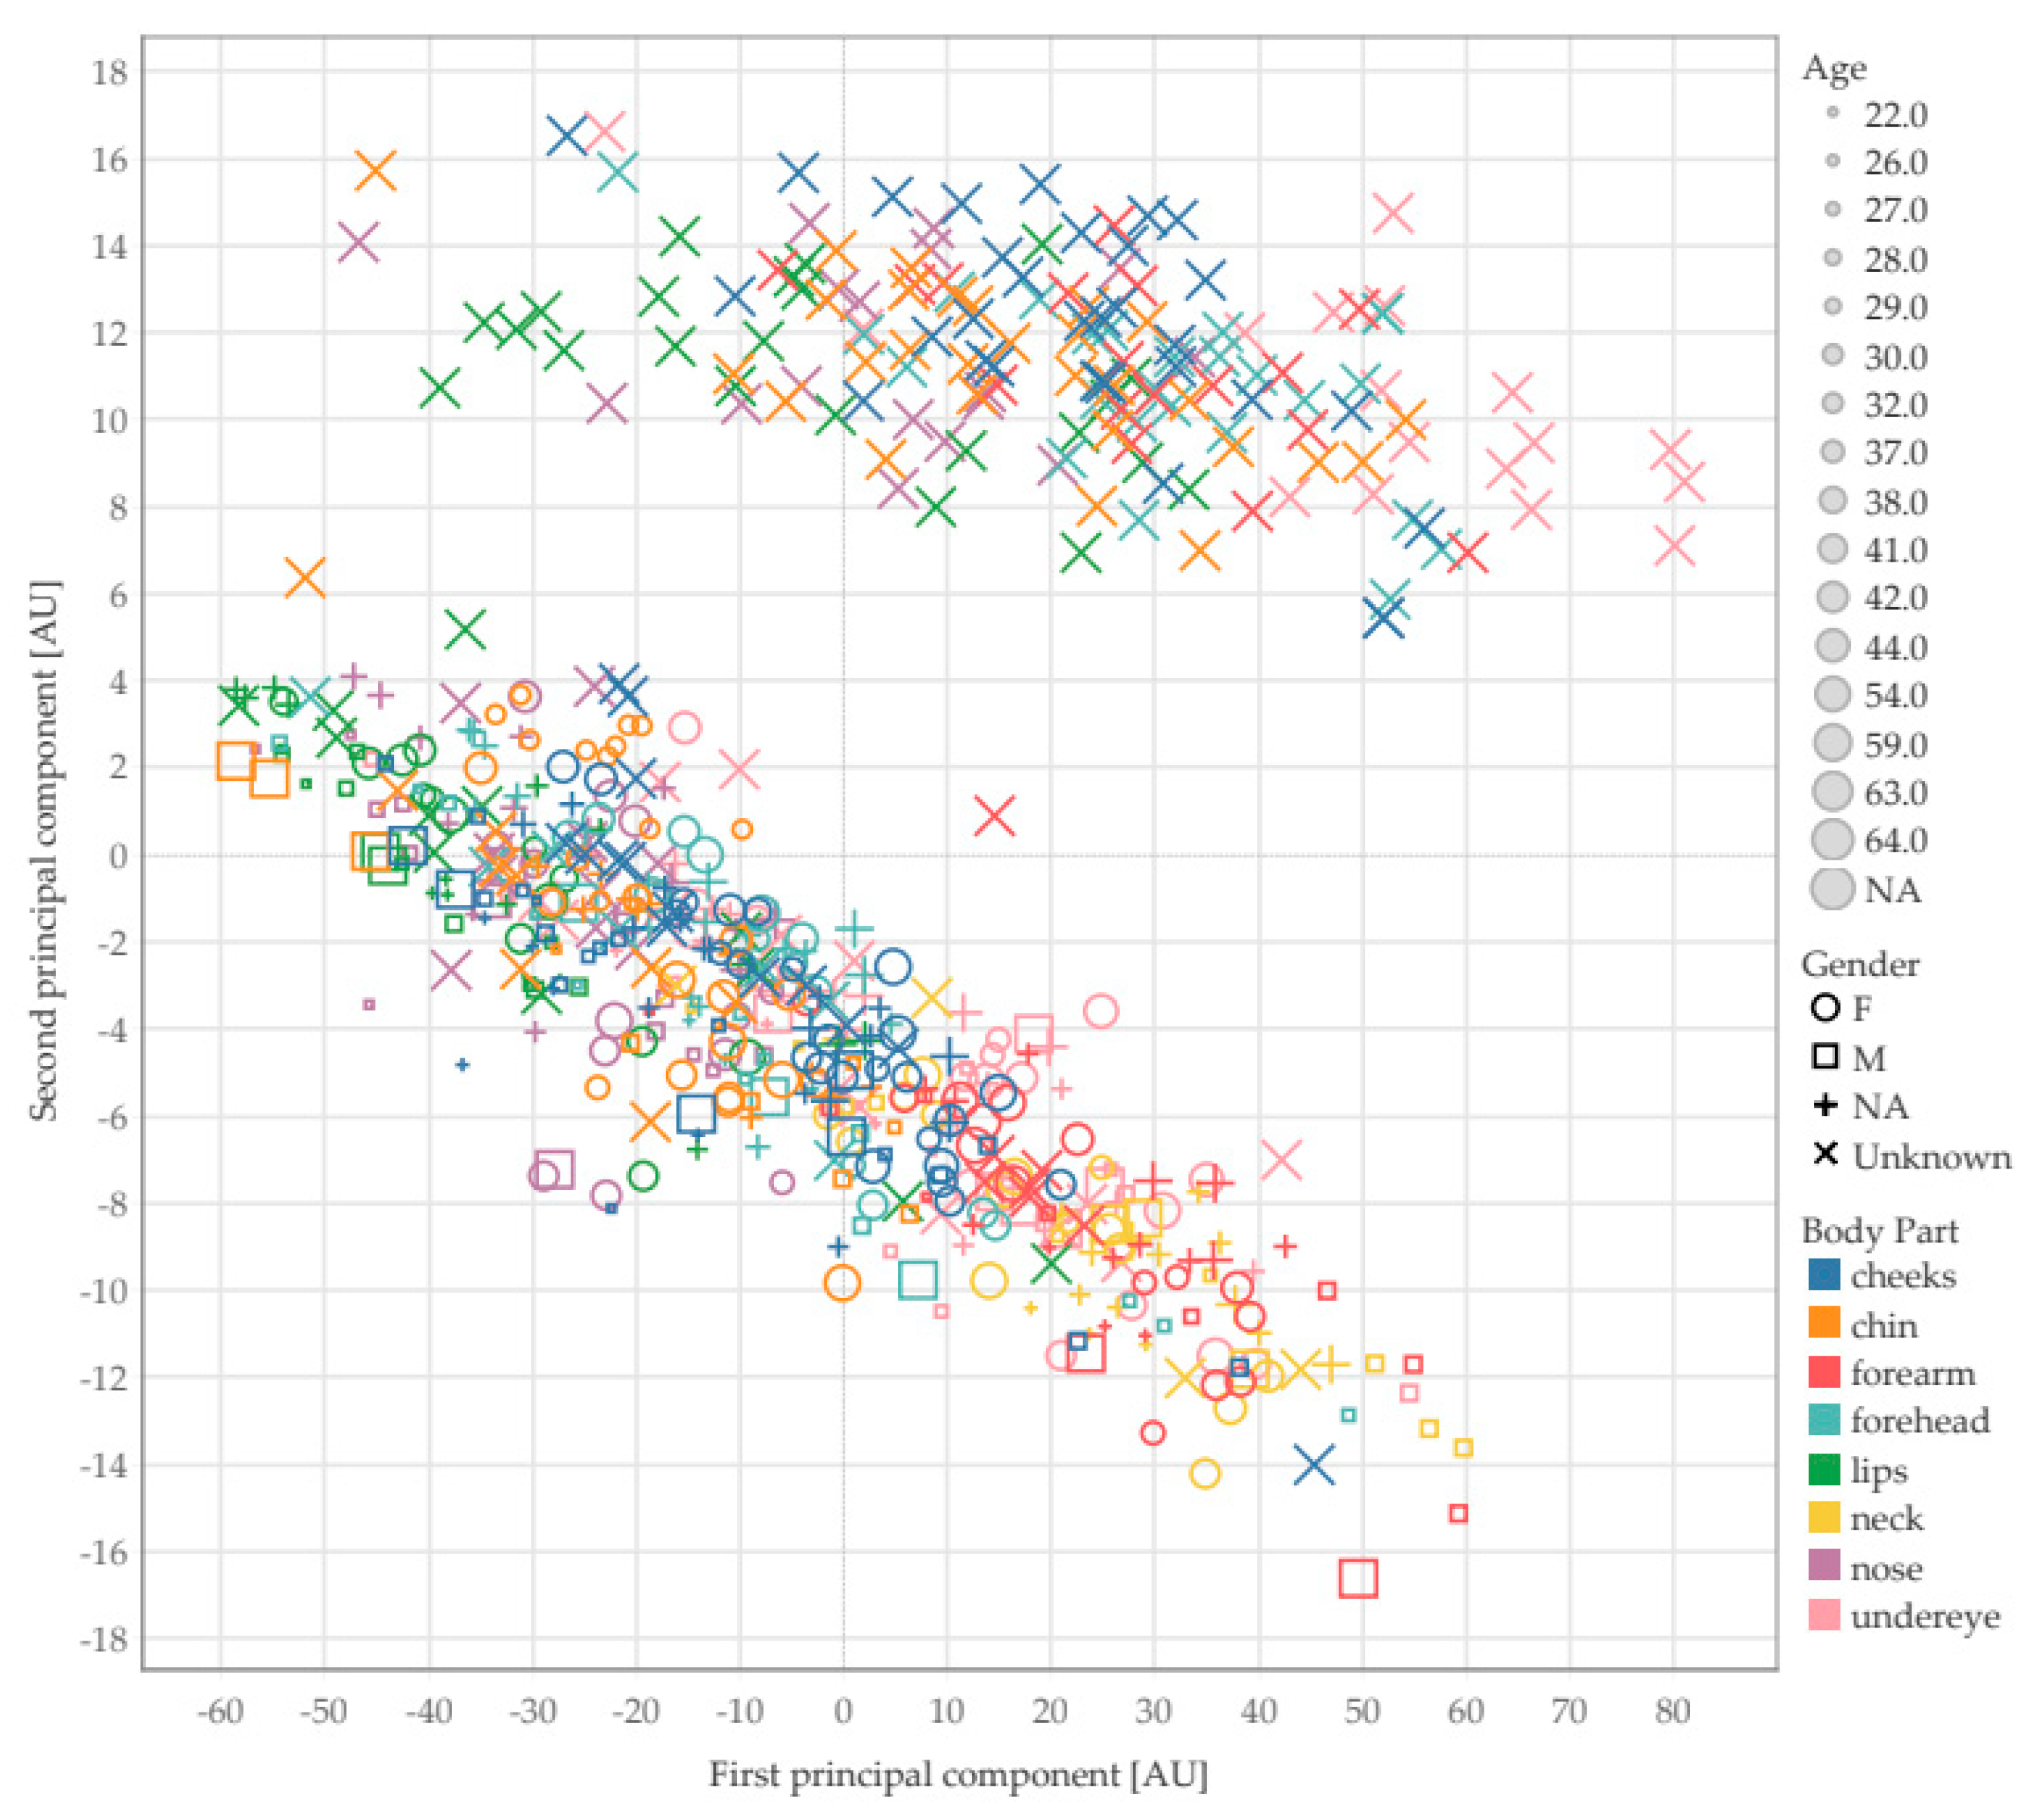
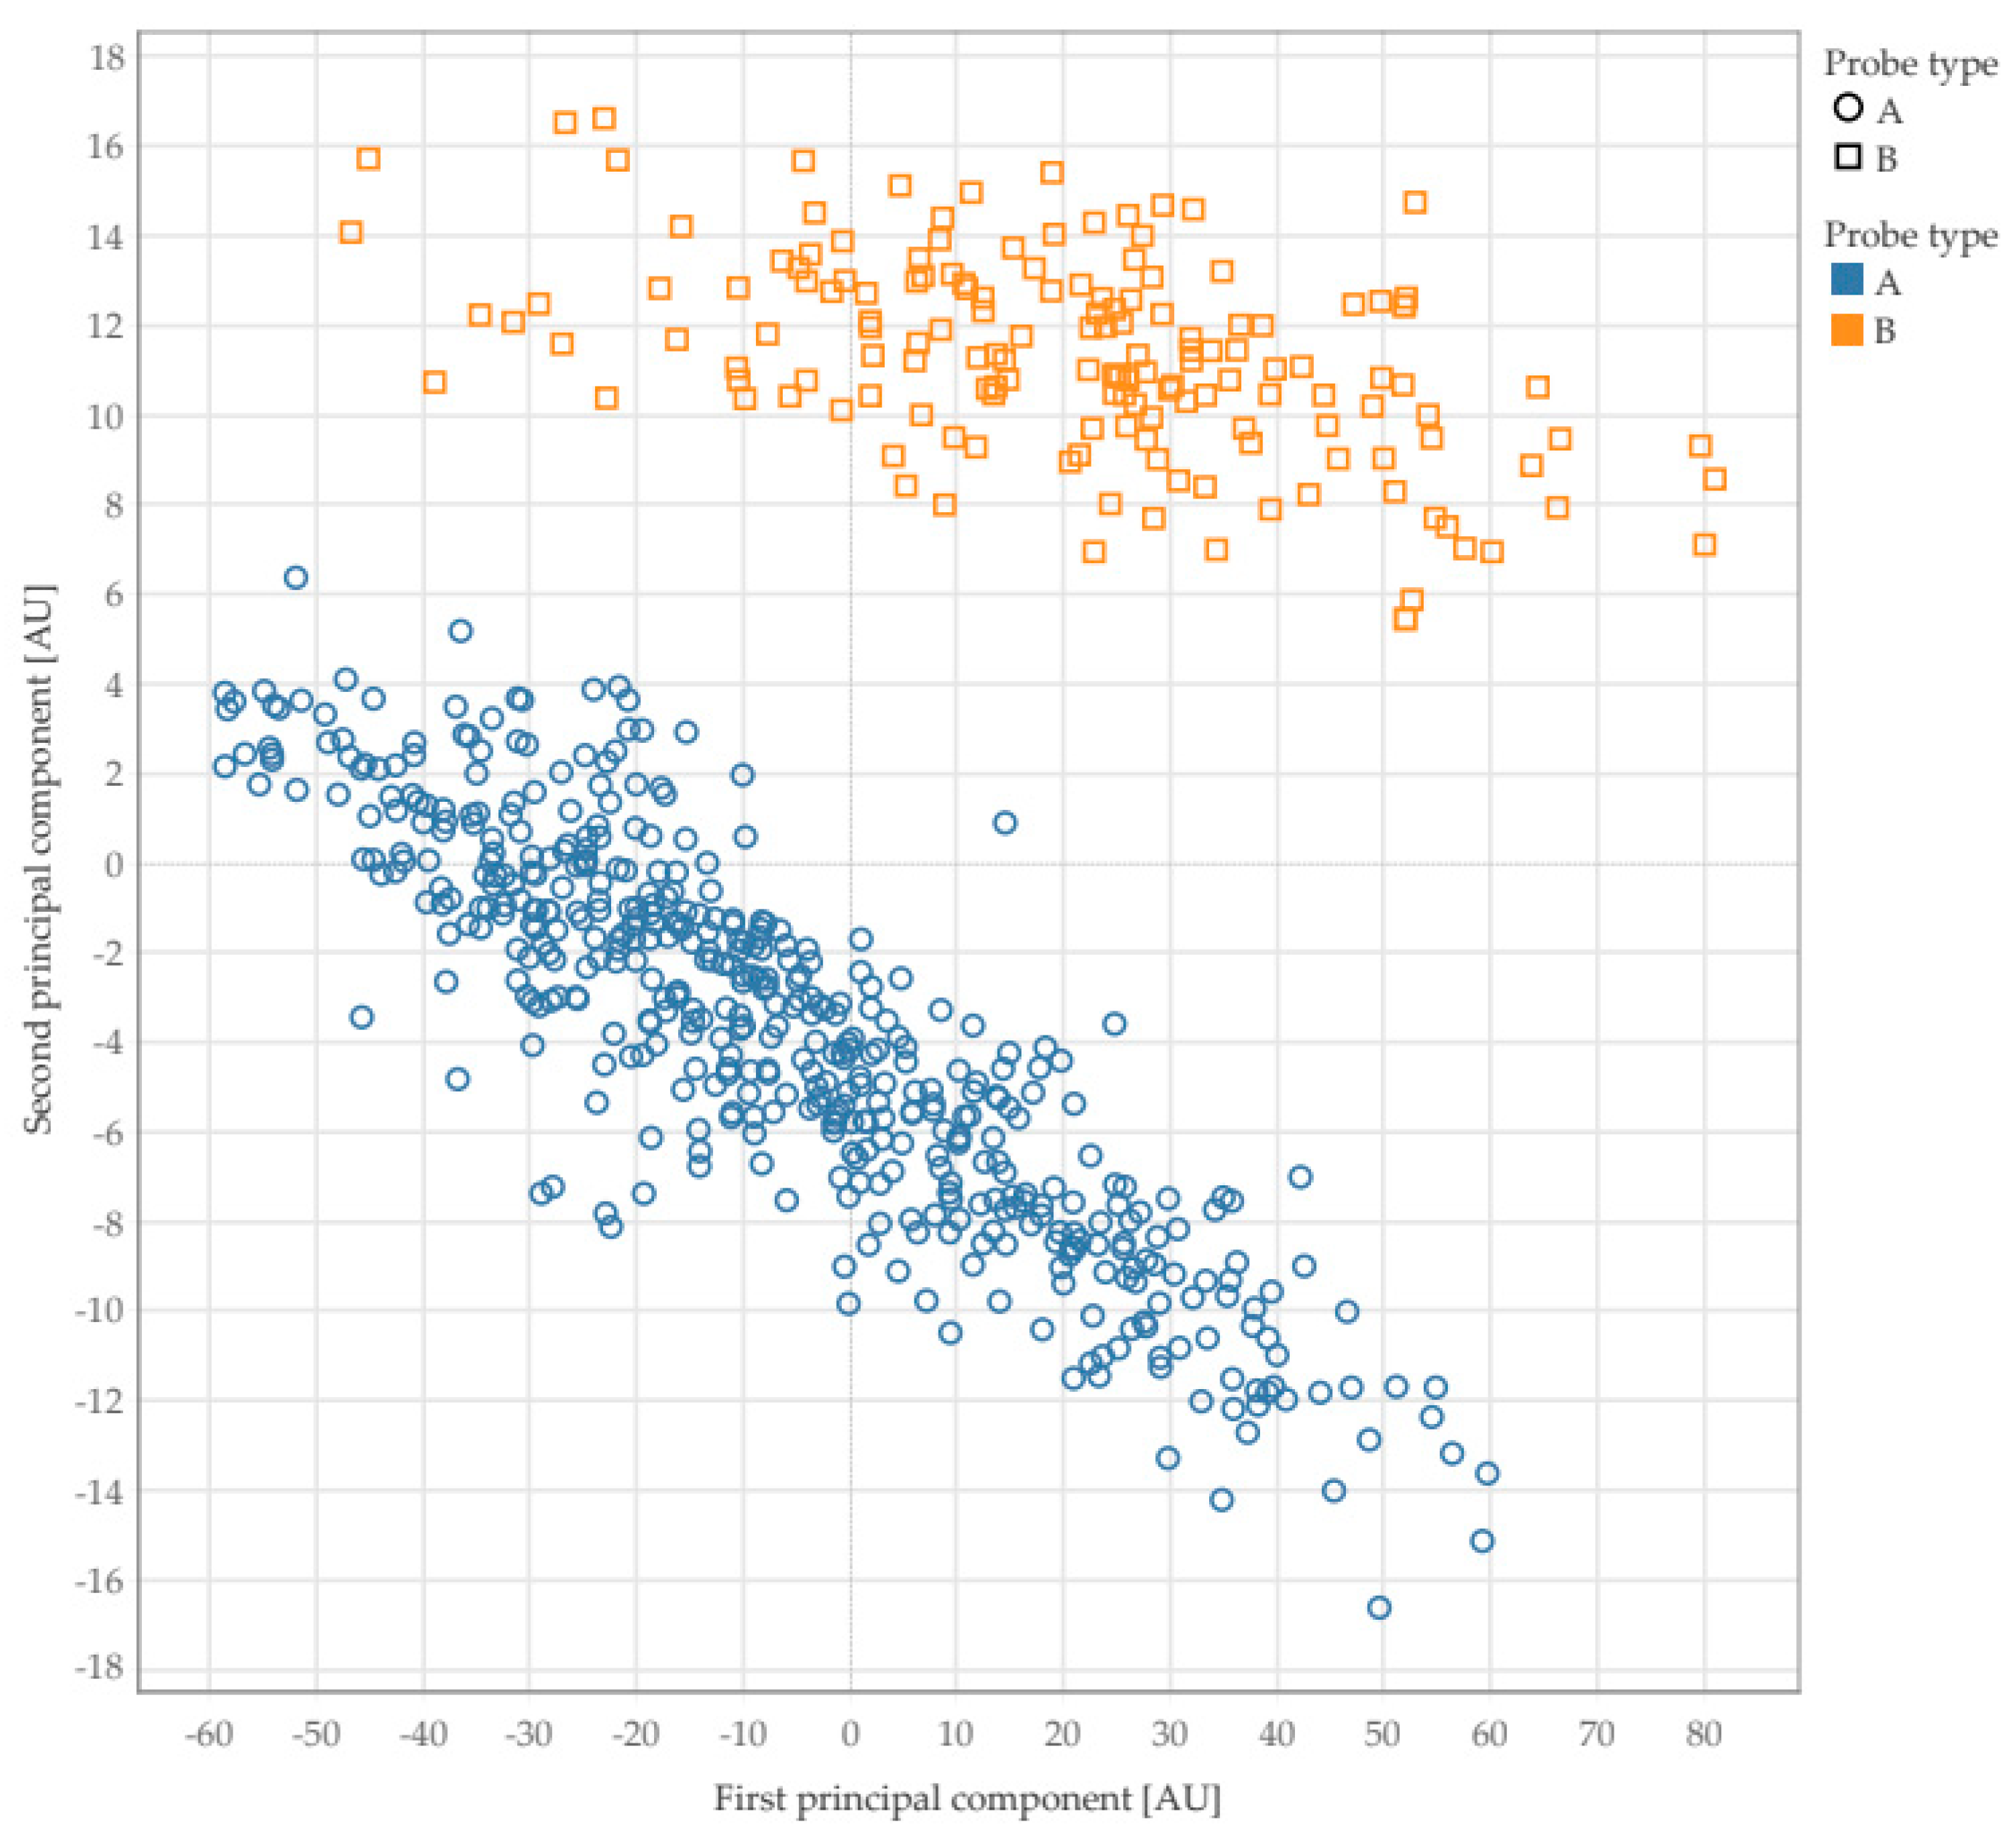
Figure 8 and
Figure 9 show the results of texture analysis on the EPISCAN data using Gabor filters as texture descriptors. As can be seen from
Figure 8, the measurement points were not separable by age, gender of the subject or anatomical site where the scan was taken. However,
Figure 8 indicates the presence of two clear clusters. Further investigation revealed that the two clusters belong to the results that were obtained by using two different types of ultrasound probes.
Figure 9 shows the results corresponding to the ultrasound probes used. The other descriptors returned similar results and the corresponding plots are provided as supplementary material.
These findings suggest that texture analysis on ultrasound scans of the skin is unable to predict the age and gender of the subject or the anatomical part. By contrast, texture analysis revealed a surprising ability to discriminate between the ultrasound probes used.
4. Discussion
Skin Contact Capacitive Imaging is a promising, novel imaging technique based on the dielectric constant measurement principle, which has been used not only for skin water content measurements, but also for solvent penetration measurements [
6], skin texture/microrelief and hair water content measurements [
7,
8]. With Skin Contact Capacitive Imaging, we have studied the water content of different facial skin sites. Although the water content results available in the literature for different face areas are not always consistent, our results agree well with Voegeli’s study [
36]. Apart from normal skin measurements, Skin Contact Capacitive Imaging can also be used for measuring diseased skin. Combined with the advances of Artificial Intelligence, which has already been used for skin classification [
9] and decision supporting in radiotherapy [
37], it is possible to develop a skin capacitive image classification system to identify different types of skin diseases, such as neoplastic lesions [
38]. With the 50 μm spatial resolution, it is also possible to detect skin diseases at an early stage.
High-Resolution Ultrasound Imaging is a state-of-the-art ultrasound technology, which allows us to measure the thickness of the different skin layers, such as the stratum corneum, epidermis and dermis. Estimating the thickness of the stratum corneum, the outmost skin layer, is very useful for skin cosmetic studies, and is not possible with any other techniques. The skin histology information can reflect skin conditions, such as damaged skin or diseased skin. Our thickness results agree generally well with literature studies [
39,
40]. We have also developed two new ultrasound image classification techniques based on image features, rather than the whole images. The first is based on skin ultrasound image luminosity values from the red, green or blue channels as well as the histogram values. The second is based on skin image texture, where 10 skin image textural features were used. Finally, we evaluated the feasibility of training standard Machine Learning classifications to identify the different facial sites based on the pre-processed High-Resolution Ultrasound images. We consider our result a moderate success, with lots of room to improve accuracy by having a more systematic measurement setup.
5. Conclusions
We conducted a detailed skin characterization study by using two state-of-the-art imaging technologies, Contact Capacitive Imaging and High-Resolution Ultrasound Imaging. With Contact Capacitive Imaging, we measured skin water content, and obtained information about skin texture. We also performed capacitive image classifications by using pre-trained Deep Learning neural networks through Transfer Learning.
With High-Resolution Ultrasound Imaging, we studied the thickness of the different skin layers, such as the stratum corneum, epidermis and dermis. We also developed two new ultrasound image classification techniques based on image features with promising results.
Future research will focus on improving the classification algorithms and to apply the two technologies to studying other types of skin samples, such as dry skin, damaged skin, young skin, aged skin, diseased skin and even samples of different types of skin diseases. The classification algorithms we developed in this study can also be used for discriminating different types of skin samples. The combination of Contact Capacitive Imaging and High-Resolution Ultrasound Imaging, with the aid of new Machine Learning algorithms, could be a powerful research tool for skin studies.
Author Contributions
Conceptualization, E.C. and P.X.; data curation, E.C., A.C., S.D.-E. and F.B.; methodology, E.C., A.C. and P.X.; software, A.C., F.B. and P.X.; supervision, P.X.; visualization, F.B.; writing—original draft, E.C., S.D.-E. and P.X.; writing—review and editing, E.C., A.C., F.B. and P.X. All authors have read and agreed to the published version of the manuscript.
Funding
This research received no external funding.
Institutional Review Board Statement
The study was conducted according to the guidelines of the Declaration of Helsinki, and approved by the Ethics Committee of London South Bank University (reference “UREC 1412”, June 2014).
Informed Consent Statement
Informed consent was obtained from all subjects.
Data Availability Statement
The datasets generated during and/or analysed during the current study are available from the corresponding author on reasonable request.
Acknowledgments
We thank London South Bank University and Biox Systems Ltd. for the financial support. We also thank Longport Inc. for providing the EPISCAN I-200 instrument.
Conflicts of Interest
The authors declare no conflict of interest.
References
- Léveque, J.L.; Querleux, B. SkinChip, a new tool for investigating the skin surface in vivo. Ski. Res. Technol. 2003, 9, 343–347. [Google Scholar] [CrossRef] [PubMed]
- Batisse, D.; Giron, F.; Léveque, J.L. Capacitance imaging of the skin surface. Ski. Res. Technol. 2006, 12, 99–104. [Google Scholar] [CrossRef]
- Singh, H.; Xiao, P.; Berg, E.P.; Imhof, R.E. In-Vivo Skin Imaging for Hydration and Micro Relief Measurements. In Proceedings of the Stratum Corneum V Conference, Cardiff, UK, 11–13 July 2007. [Google Scholar]
- Singh, H.; Xiao, P.; Berg, E.P.; Imhof, R.E. Skin Capacitance Imaging for Surface Profiles and Dynamic Water Concentration Measurements. In Proceedings of the ISBS Conference, Seoul, Korea, 7–10 May 2008. [Google Scholar]
- Bevilacqua, A.; Gherardi, A. Characterization of a capacitive imaging system for skin surface analysis. In Proceedings of the First Workshops on Image Processing Theory, Tools and Applications, Sousse, Tunisia, 23–26 November 2008. [Google Scholar]
- Ou, X.; Pan, W.; Xiao, P. In vivo skin capacitive imaging analysis by using grey level co-occurrence matrix (GLCM). Int. J. Pharm. 2014, 460, 28–32. [Google Scholar] [CrossRef] [PubMed] [Green Version]
- Ou, X.; Pan, W.; Zhang, X.; Xiao, P. Skin Image Retrieval Using Gabor Wavelet Texture Feature. Int. J. Cosmet. Sci. 2016, 38, 607–614. [Google Scholar] [CrossRef] [PubMed]
- Bontozoglou, C.; Xiao, P. Applications of Capacitive Imaging in Human Skin Texture and Hair Analysis. Appl. Sci. 2019, 10, 256. [Google Scholar] [CrossRef] [Green Version]
- Zhang, X.; Pan, W.; Bontozoglou, C.; Chirikhina, E.; Chen, D.; Xiao, P. Skin Capacitive Imaging Analysis Using Deep Learning GoogLeNet. In Intelligent Computing. SAI 2020. Advances in Intelligent Systems and Computing; Arai, K., Kapoor, S., Bhatia, R., Eds.; Springer: Cham, Switzerland, 2020; Volume 1229. [Google Scholar] [CrossRef]
- Noble, J.A.; Boukerroui, D. Ultrasound image segmentation: A survey(Review). IEEE Trans. Med. Imaging 2006, 25, 987–1010. [Google Scholar] [CrossRef] [Green Version]
- Marosán, P.; Szalai, K.; Csabai, D.; Csány, G.; Horváth, A.; Gyöngy, M. Automated seeding for ultrasound skin lesion segmentation. Ultrasonics 2021, 110, 106268. [Google Scholar] [CrossRef] [PubMed]
- Sciolla, B.; Le Digabel, J.; Josse, G.; Dambry, T.; Guibert, B.; Delachartre, P. Joint segmentation and characterization of the dermis in 50 MHz ultrasound 2D and 3D images of the skin. Comput. Biol. Med. 2018, 103, 277–286. [Google Scholar] [CrossRef] [PubMed]
- Episcan I-200. Available online: https://www.longportinc.com/episcan-i-200 (accessed on 19 July 2021).
- Chirikhina, E.; Chirikhin, A.; Xiao, P.; Dewsbury-Ennis, S.; Bianconi, F. In Vivo Assessment of Water Content, Trans-Epidermial Water Loss and Thickness in Human Facial Skin. Appl. Sci. 2020, 10, 6139. [Google Scholar] [CrossRef]
- Reginelli, A.; Belfiore, M.P.; Russo, A.; Turriziani, F.; Moscarella, E.; Troiani, T.; Brancaccio, G.; Ronchi, A.; Giunta, E.; Sica, A.; et al. A Preliminary Study for Quantitative Assessment with HFUS (High-Frequency Ultrasound) of Nodular Skin Melanoma Breslow Thickness in Adults Before Surgery: Interdisciplinary Team Experience. Curr. Radiopharm. 2020, 13, 48–55. [Google Scholar] [CrossRef] [PubMed]
- Fingerprint Sensor Solution. Available online: https://www.fujitsu.com/downloads/MICRO/fme/sensors/sensors_fingerprint_findarticle_171kb.pdf (accessed on 17 September 2021).
- Krizhevsky, A.; Sutskever, I.; Hinton, G.E. ImageNet classification with deep convolutional neural networks. In Proceedings of the International Conference on Neural Information Processing Systems, Lake Tahoe, NV, USA, 3–6 December 2012; pp. 1097–1105. [Google Scholar]
- Szegedy, C.; Liu, W.; Yangqing, J.; Pierre, S.; Scott, R.; Dragomir, A.; Dumitru, E.; Vincent, V.; Andrew, R. Going Deeper with Convolutions. In Proceedings of the IEEE Conference on Computer Vision and Pattern Recognition (CVPR), Boston, MA, USA, 7–12 June 2015; pp. 1–9. [Google Scholar]
- He, K.; Zhang, X.; Ren, S.; Sun, J. Deep Residual Learning for Image Recognition. 2015. Available online: https://arxiv.org/abs/1512.03385 (accessed on 9 September 2021).
- Simonyan, K.; Zisserman, A. Very Deep Convolutional Networks for Large-Scale Image Recognition. 2014. Available online: https://arxiv.org/abs/1409.1556 (accessed on 9 September 2021).
- Tang, J. Intelligent Mobile Projects with TensorFlow; Packt Publishing: Birmingham, UK, 2018; Chapter 2; ISBN 9781788834544. [Google Scholar]
- Sandler, M.; Howard, A.; Zhu, M.; Zhmoginov, A.; Chen, L. MobileNetV2: Inverted Residuals and Linear Bottlenecks. 2018. Available online: https://arxiv.org/abs/1801.04381v4 (accessed on 9 September 2021).
- Huang, G.; Liu, Z.; van der Maaten, L.; Weinberger, K.Q. Densely Connected Convolutional Networks. 2016. Available online: https://arxiv.org/abs/1608.06993 (accessed on 9 September 2021).
- Iandola, F.N.; Han, S.; Moskewicz, M.W.; Ashraf, K.; Dally, W.J.; Keutzer, K. SqueezeNet: AlexNet-level accuracy with 50x fewer parameters and <0.5MB model size. 2016. Available online: https://arxiv.org/abs/1602.07360 (accessed on 9 September 2021).
- Szegedy, C.; Ioffe, S.; Vanhoucke, V.; Alemi, A. Inception-v4, Inception-ResNet and the Impact of Residual Connections on Learning. 2016. Available online: https://arxiv.org/abs/1602.07261 (accessed on 9 September 2021).
- Chollet, F. Xception: Deep Learning with Depthwise Separable Convolutions. 2016. Available online: https://arxiv.org/abs/1610.02357 (accessed on 9 September 2021).
- ImageNet. Available online: http://image-net.org/index (accessed on 9 September 2021).
- Transfer Learning. Available online: https://en.wikipedia.org/wiki/Transfer_learning (accessed on 19 July 2021).
- Bianconi, F.; Cusano, C.; Napoletano, P.; Schettini, R. CNN-based refactoring of hand-designed filters for texture analysis: A classic revisited. IEEE Access 2019, 7, 173076–173085. [Google Scholar] [CrossRef]
- Laws, K. Rapid Texture Identification. In Image Processing for Missile Guidance; Wiener, T., Ed.; SPIE Proceedings: Bellingham, WA, USA, 1980; Volume 238. [Google Scholar]
- Ojala, T.; Pietikäinen, M.; Mäenpää, T. Multiresolution gray-scale and rotation invariant texture classification with local binary patterns. IEEE Trans. Pattern Anal. Mach. Intell. 2002, 24, 971–987. [Google Scholar] [CrossRef]
- Lakshminarayanan, V.; Fleck, A. Zernike polynomials: A guide. J. Mod. Opt. 2011, 58, 545–561. [Google Scholar] [CrossRef]
- Napoletano, P. Hand-Crafted vs Learned Descriptors for Color Texture Classification. In Proceedings of the 6th Computational Color Imaging Workshop (CCIW’17); Lecture Notes in Computer Science; Bianco, S., Schettini, R., Tominaga, S., Tremeau, A., Eds.; Springer: Milan, Italy, 2017; Volume 10213, pp. 259–271. [Google Scholar]
- Bello-Cerezo, R.; Bianconi, F.; Di Maria, F.; Napoletano, P.; Smeraldi, F. Comparative Evaluation of Hand-Crafted Image Descriptors vs. Off-the-Shelf CNN-Based Features for Colour Texture Classification under Ideal and Realistic Conditions. Appl. Sci. 2019, 9, 738. [Google Scholar] [CrossRef] [Green Version]
- Cusano, C.; Napoletano, P.; Schettini, R. T1k+: A database for benchmarking color texture classification and retrieval methods. Sensors 2021, 21, 1010. [Google Scholar] [CrossRef] [PubMed]
- Voegeli, R.; Rawlings, A.V.; Seroul, P.; Summers, B. A novel continuous colour mapping approach for visualization of facial skin hydration and transepidermal water loss for four ethnic groups. Int. J. Cosmet. Sci. 2015, 37, 595–605. [Google Scholar] [CrossRef]
- Fionda, B.; Boldrini, L.; D’Aviero, A.; Lancellotta, V.; Gambacorta, M.A.; Kovács, G.; Patarnello, S.; Valentini, V.; Tagliaferri, L. Artificial intelligence (AI) and interventional radiotherapy (brachytherapy): State of art and future perspectives. J. Contemp. Brachytherapy 2020, 12, 97–500. [Google Scholar] [CrossRef] [PubMed]
- Tagliaferri, L.; Ciardo, F.G.; Fionda, B.; Casà, C.; DIStefani, A.; Lancellotta, V.; Placidi, E.; Macchia, G.; Capocchiano, N.D.; Morganti, A.G.; et al. Non-melanoma Skin Cancer Treated by Contact High-dose-rate Radiotherapy (Brachytherapy): A Mono-institutional Series and Literature Review. In Vivo 2021, 35, 2313–2319. [Google Scholar] [CrossRef]
- Chopra, K.; Calva, D.; Sosin, M.; Tadisina, K.; Banda, A.; De La Cruz, C.; Chaudhry, M.; Legesse, T.; Drachenberg, C.; Manson, P.; et al. A comprehensive examination of topographic thickness of skin in the human face. Aesthetic Surg. J. 2015, 35, 1007–1013. [Google Scholar] [CrossRef] [PubMed] [Green Version]
- Kim, Y.S.; Lee, K.W.; Kim, J.S.; Gil, Y.C.; Tanvaa, T.; Shin, D.; Kim, H.J. Regional thickness of facial skin and superficial fat: Application to the minimally invasive procedures. Clin. Anat. 2019, 32, 1008–1018. [Google Scholar] [CrossRef]
| Publisher’s Note: MDPI stays neutral with regard to jurisdictional claims in published maps and institutional affiliations. |
© 2021 by the authors. Licensee MDPI, Basel, Switzerland. This article is an open access article distributed under the terms and conditions of the Creative Commons Attribution (CC BY) license (https://creativecommons.org/licenses/by/4.0/).


 and
and 


