
Visual Comfort of Tablet Devices under a Wide Range of Ambient Light Levels


Abstract
:1. Introduction
2. Methods
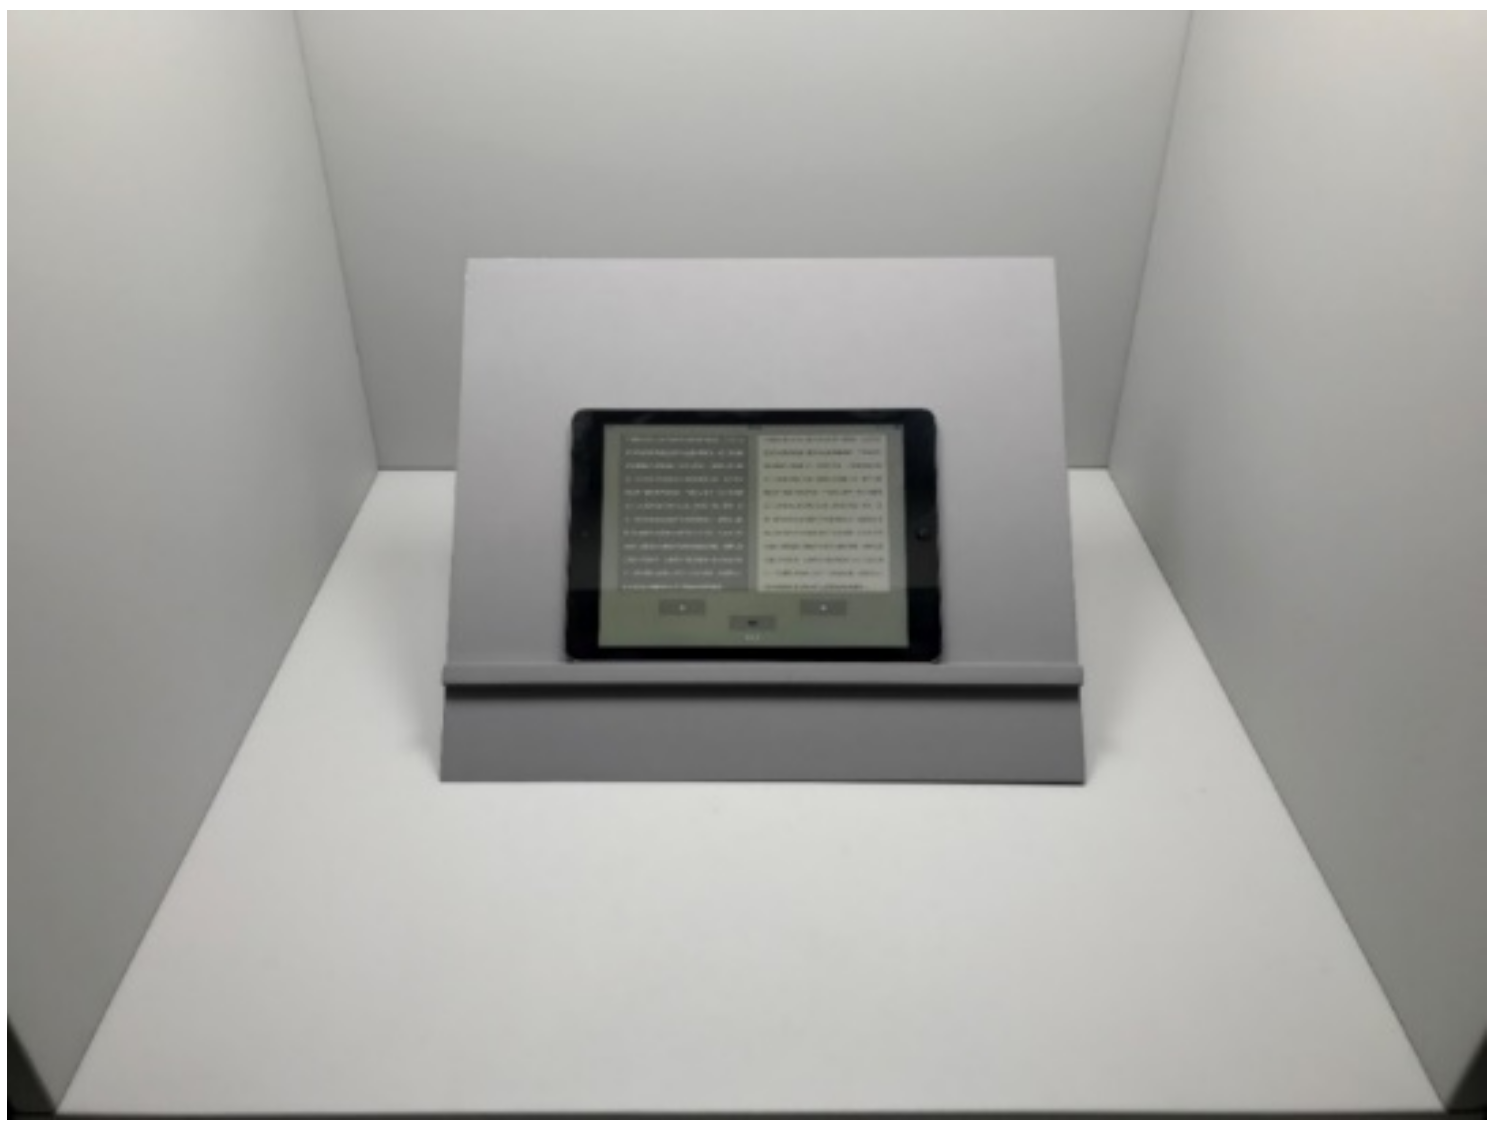
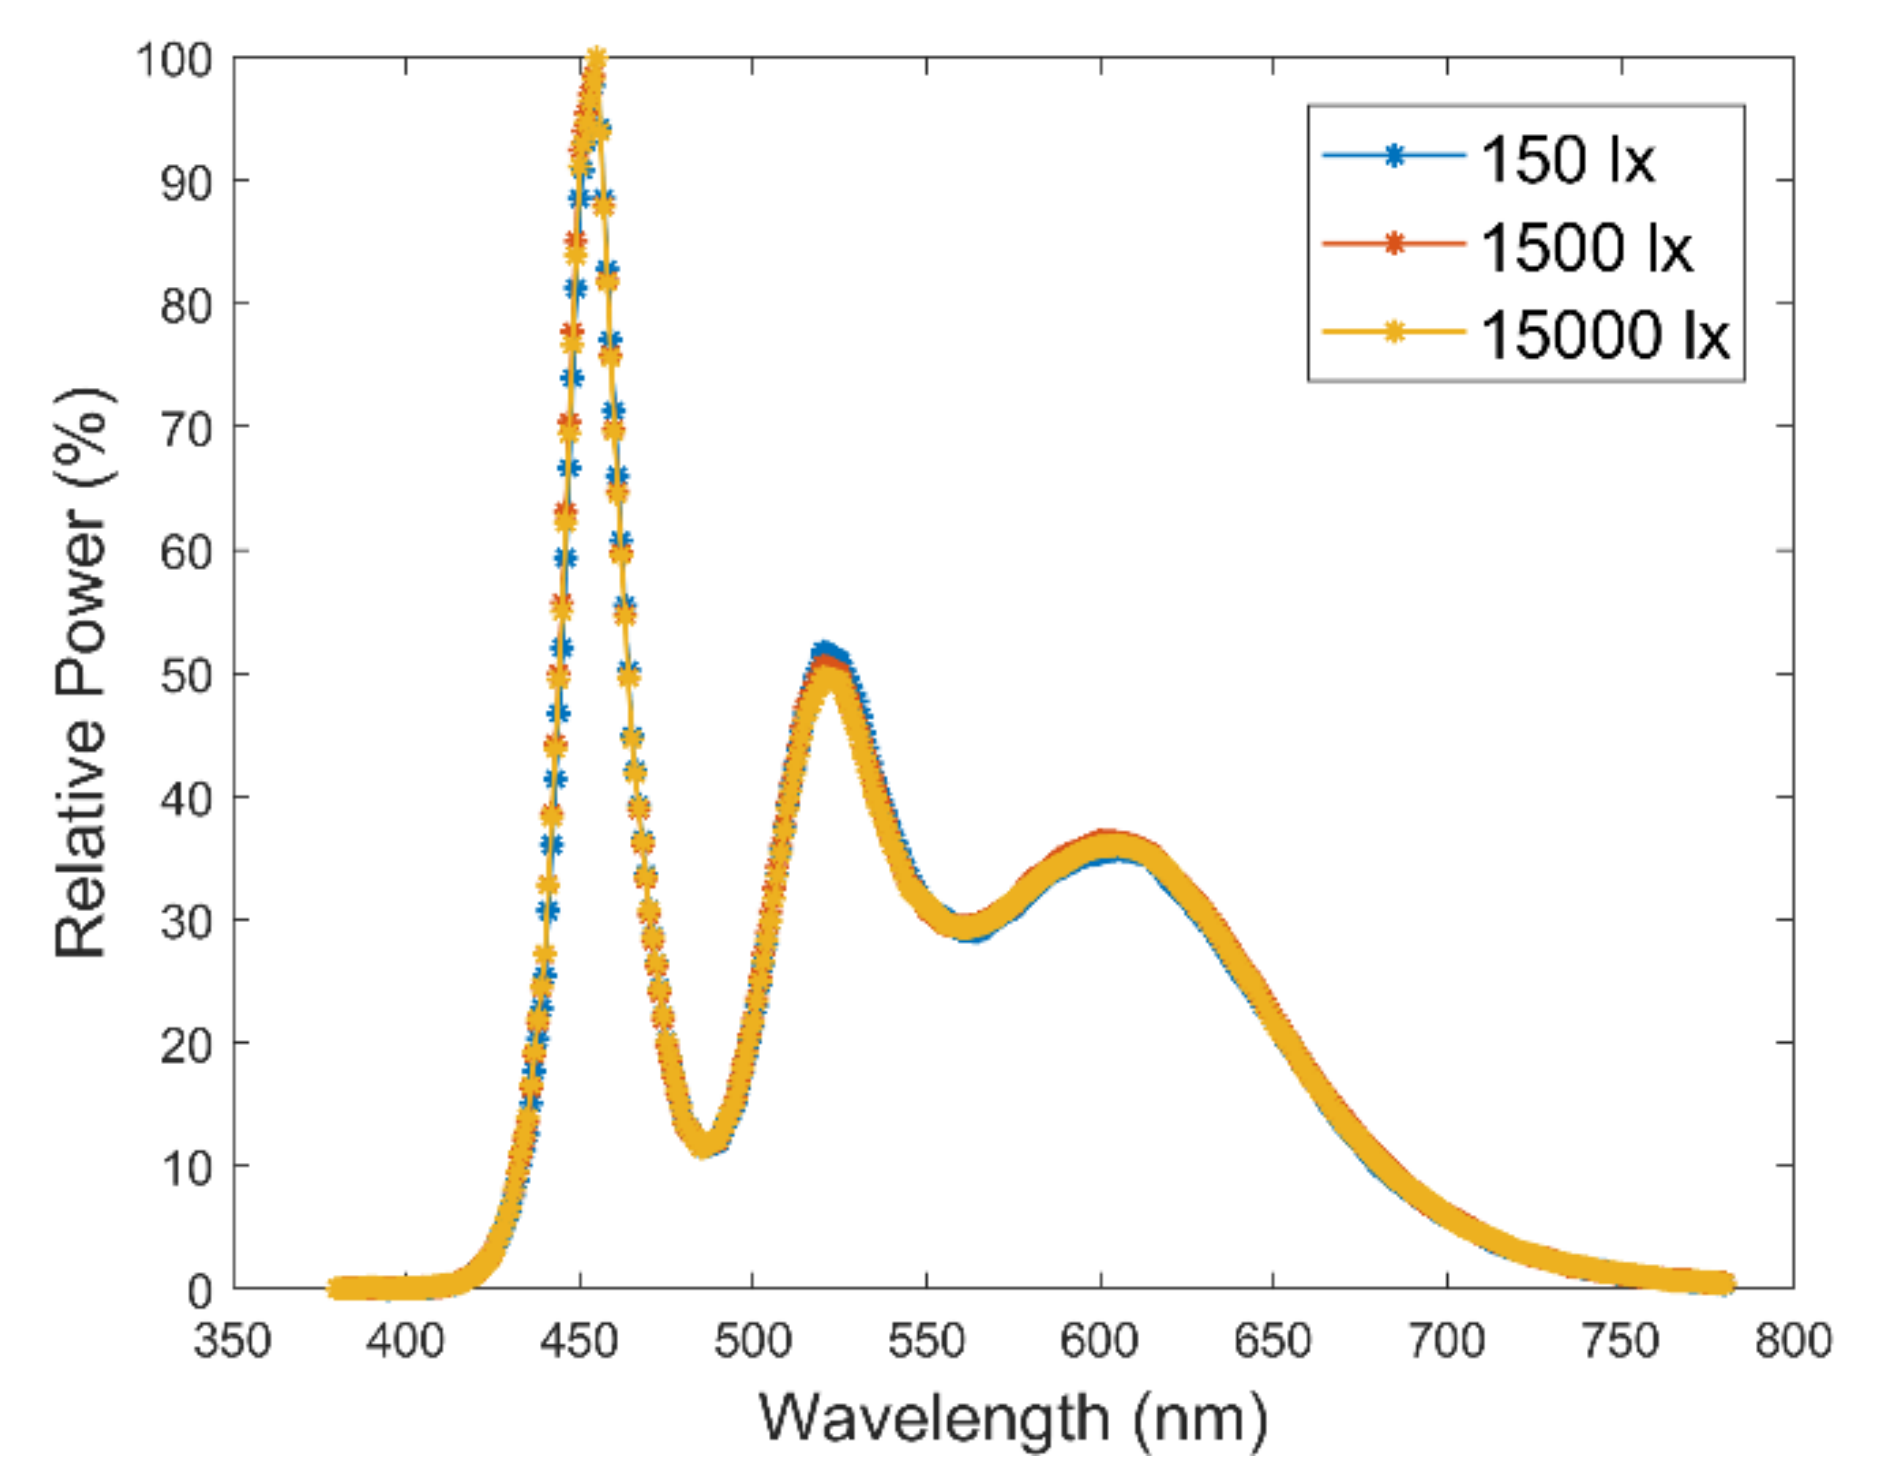
2.1. Experimental Setup
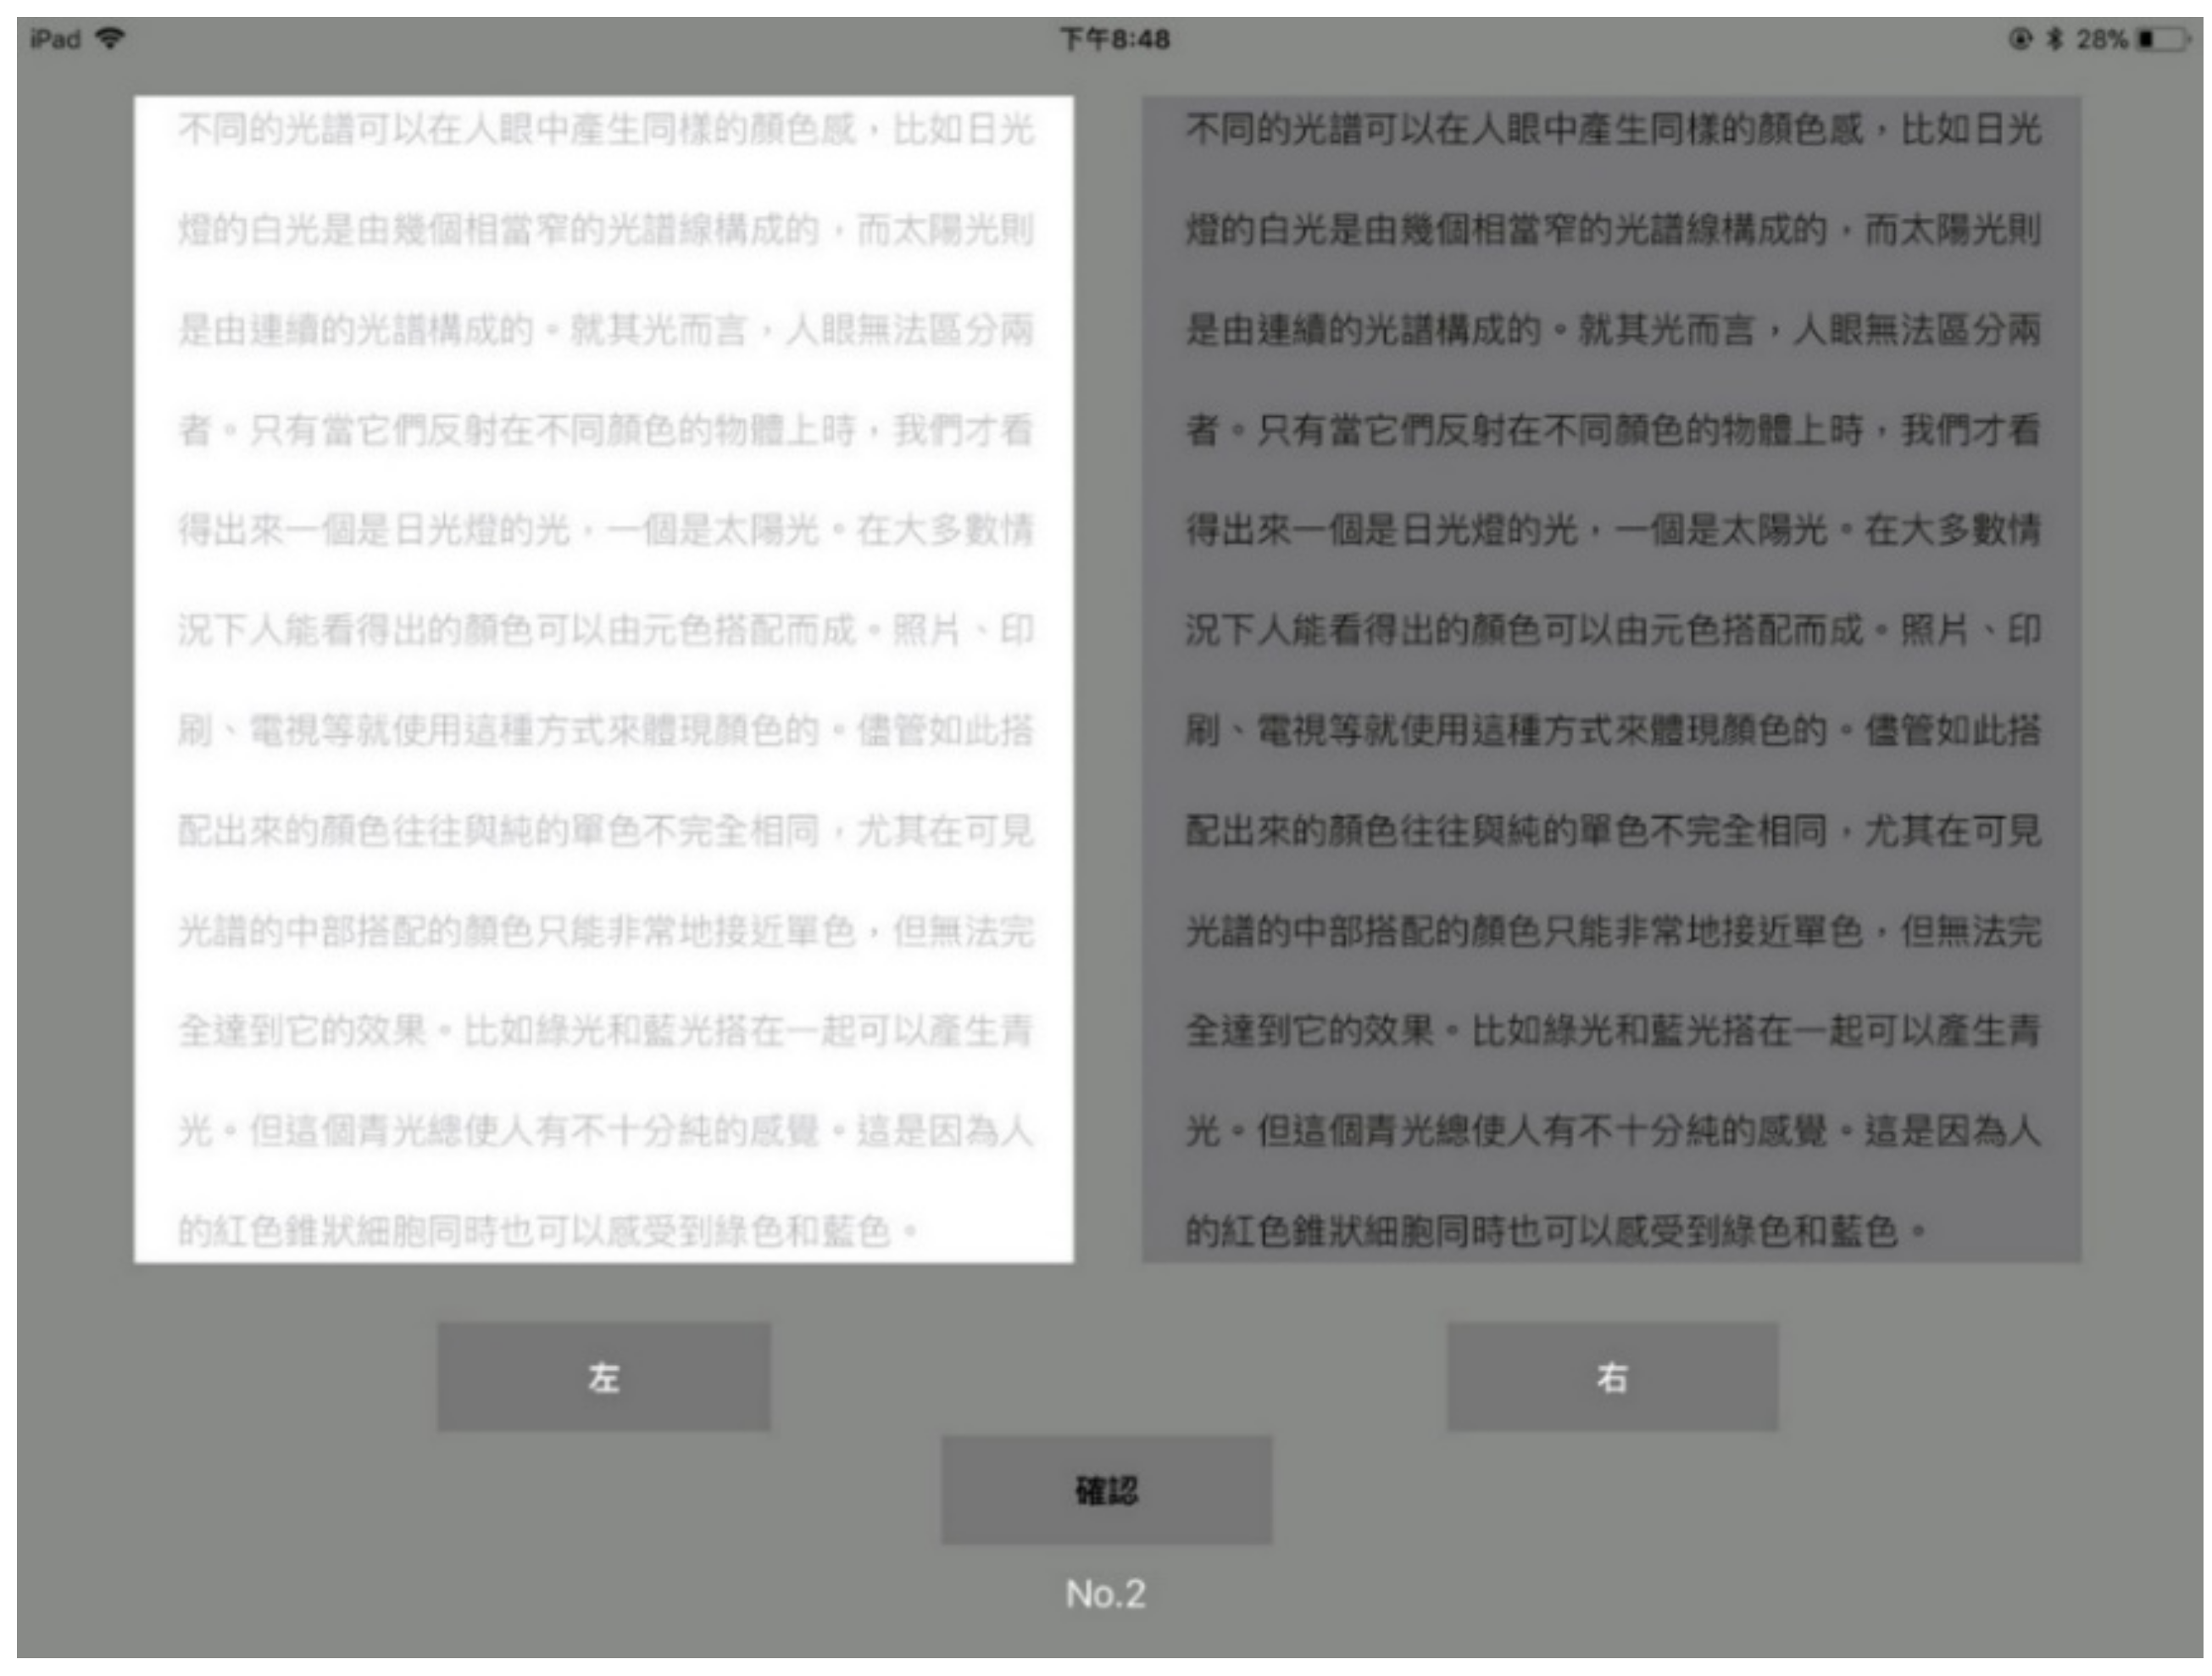
2.2. Experimental Procedures
3. Results
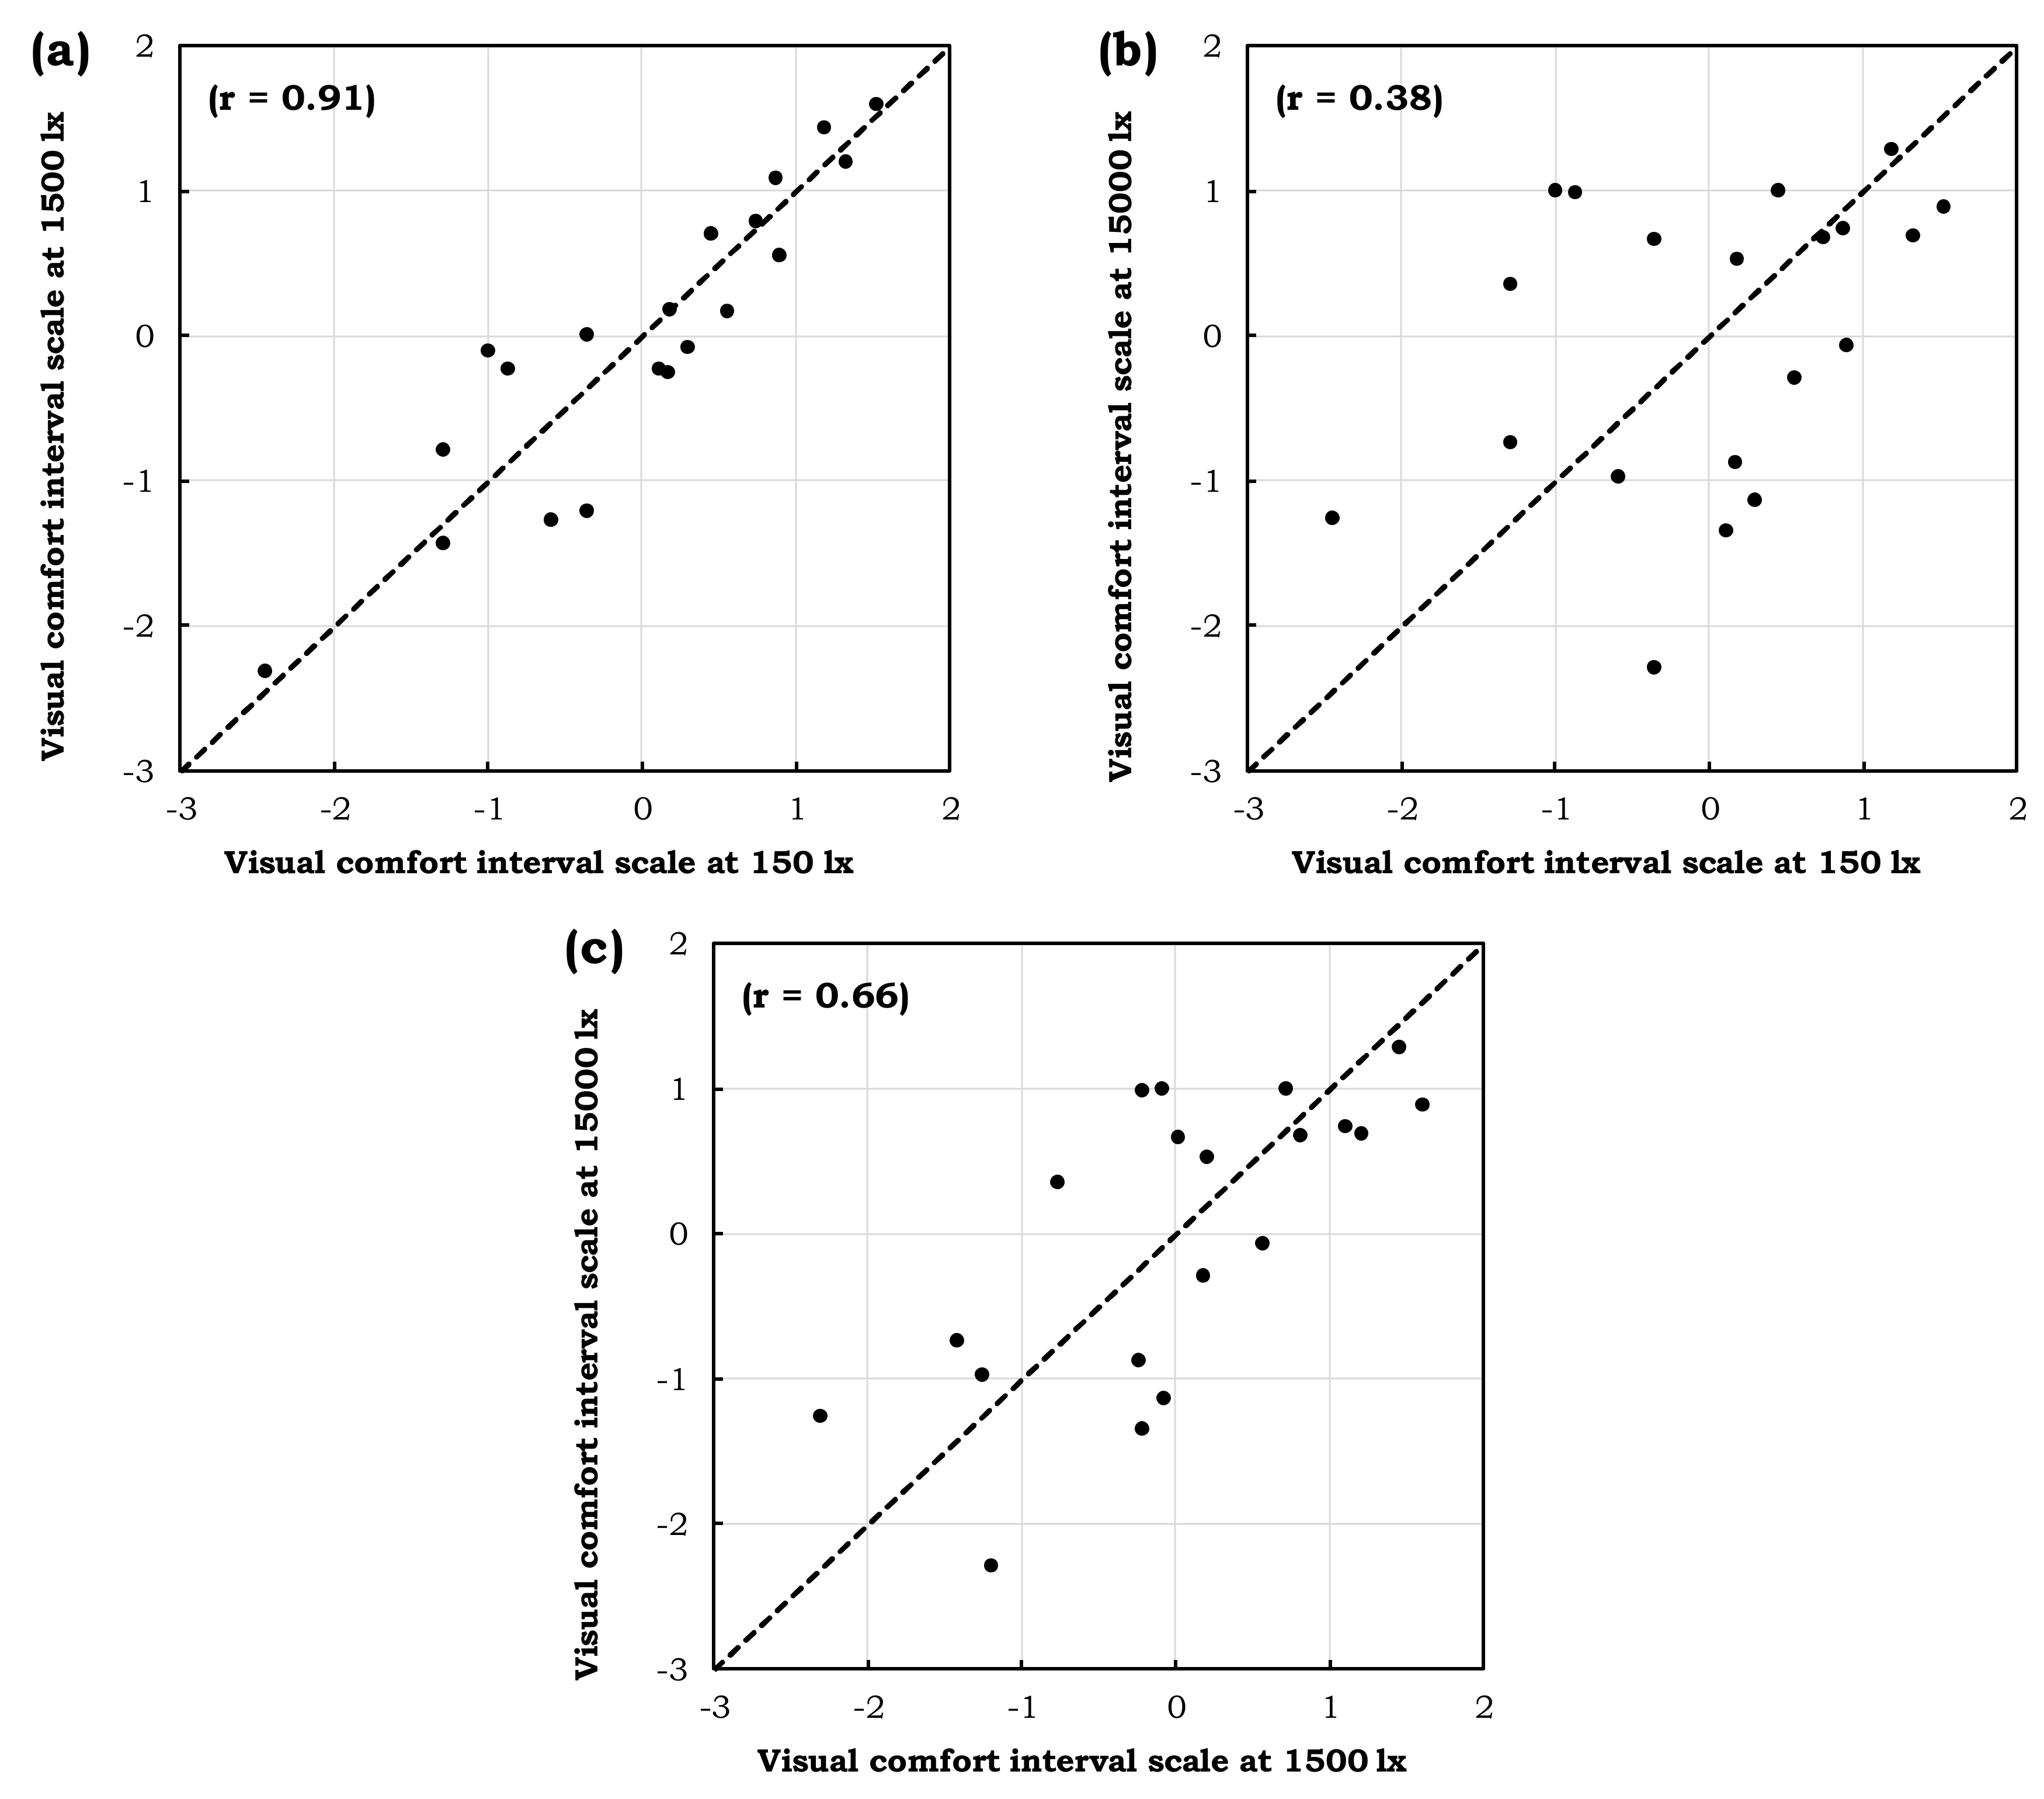
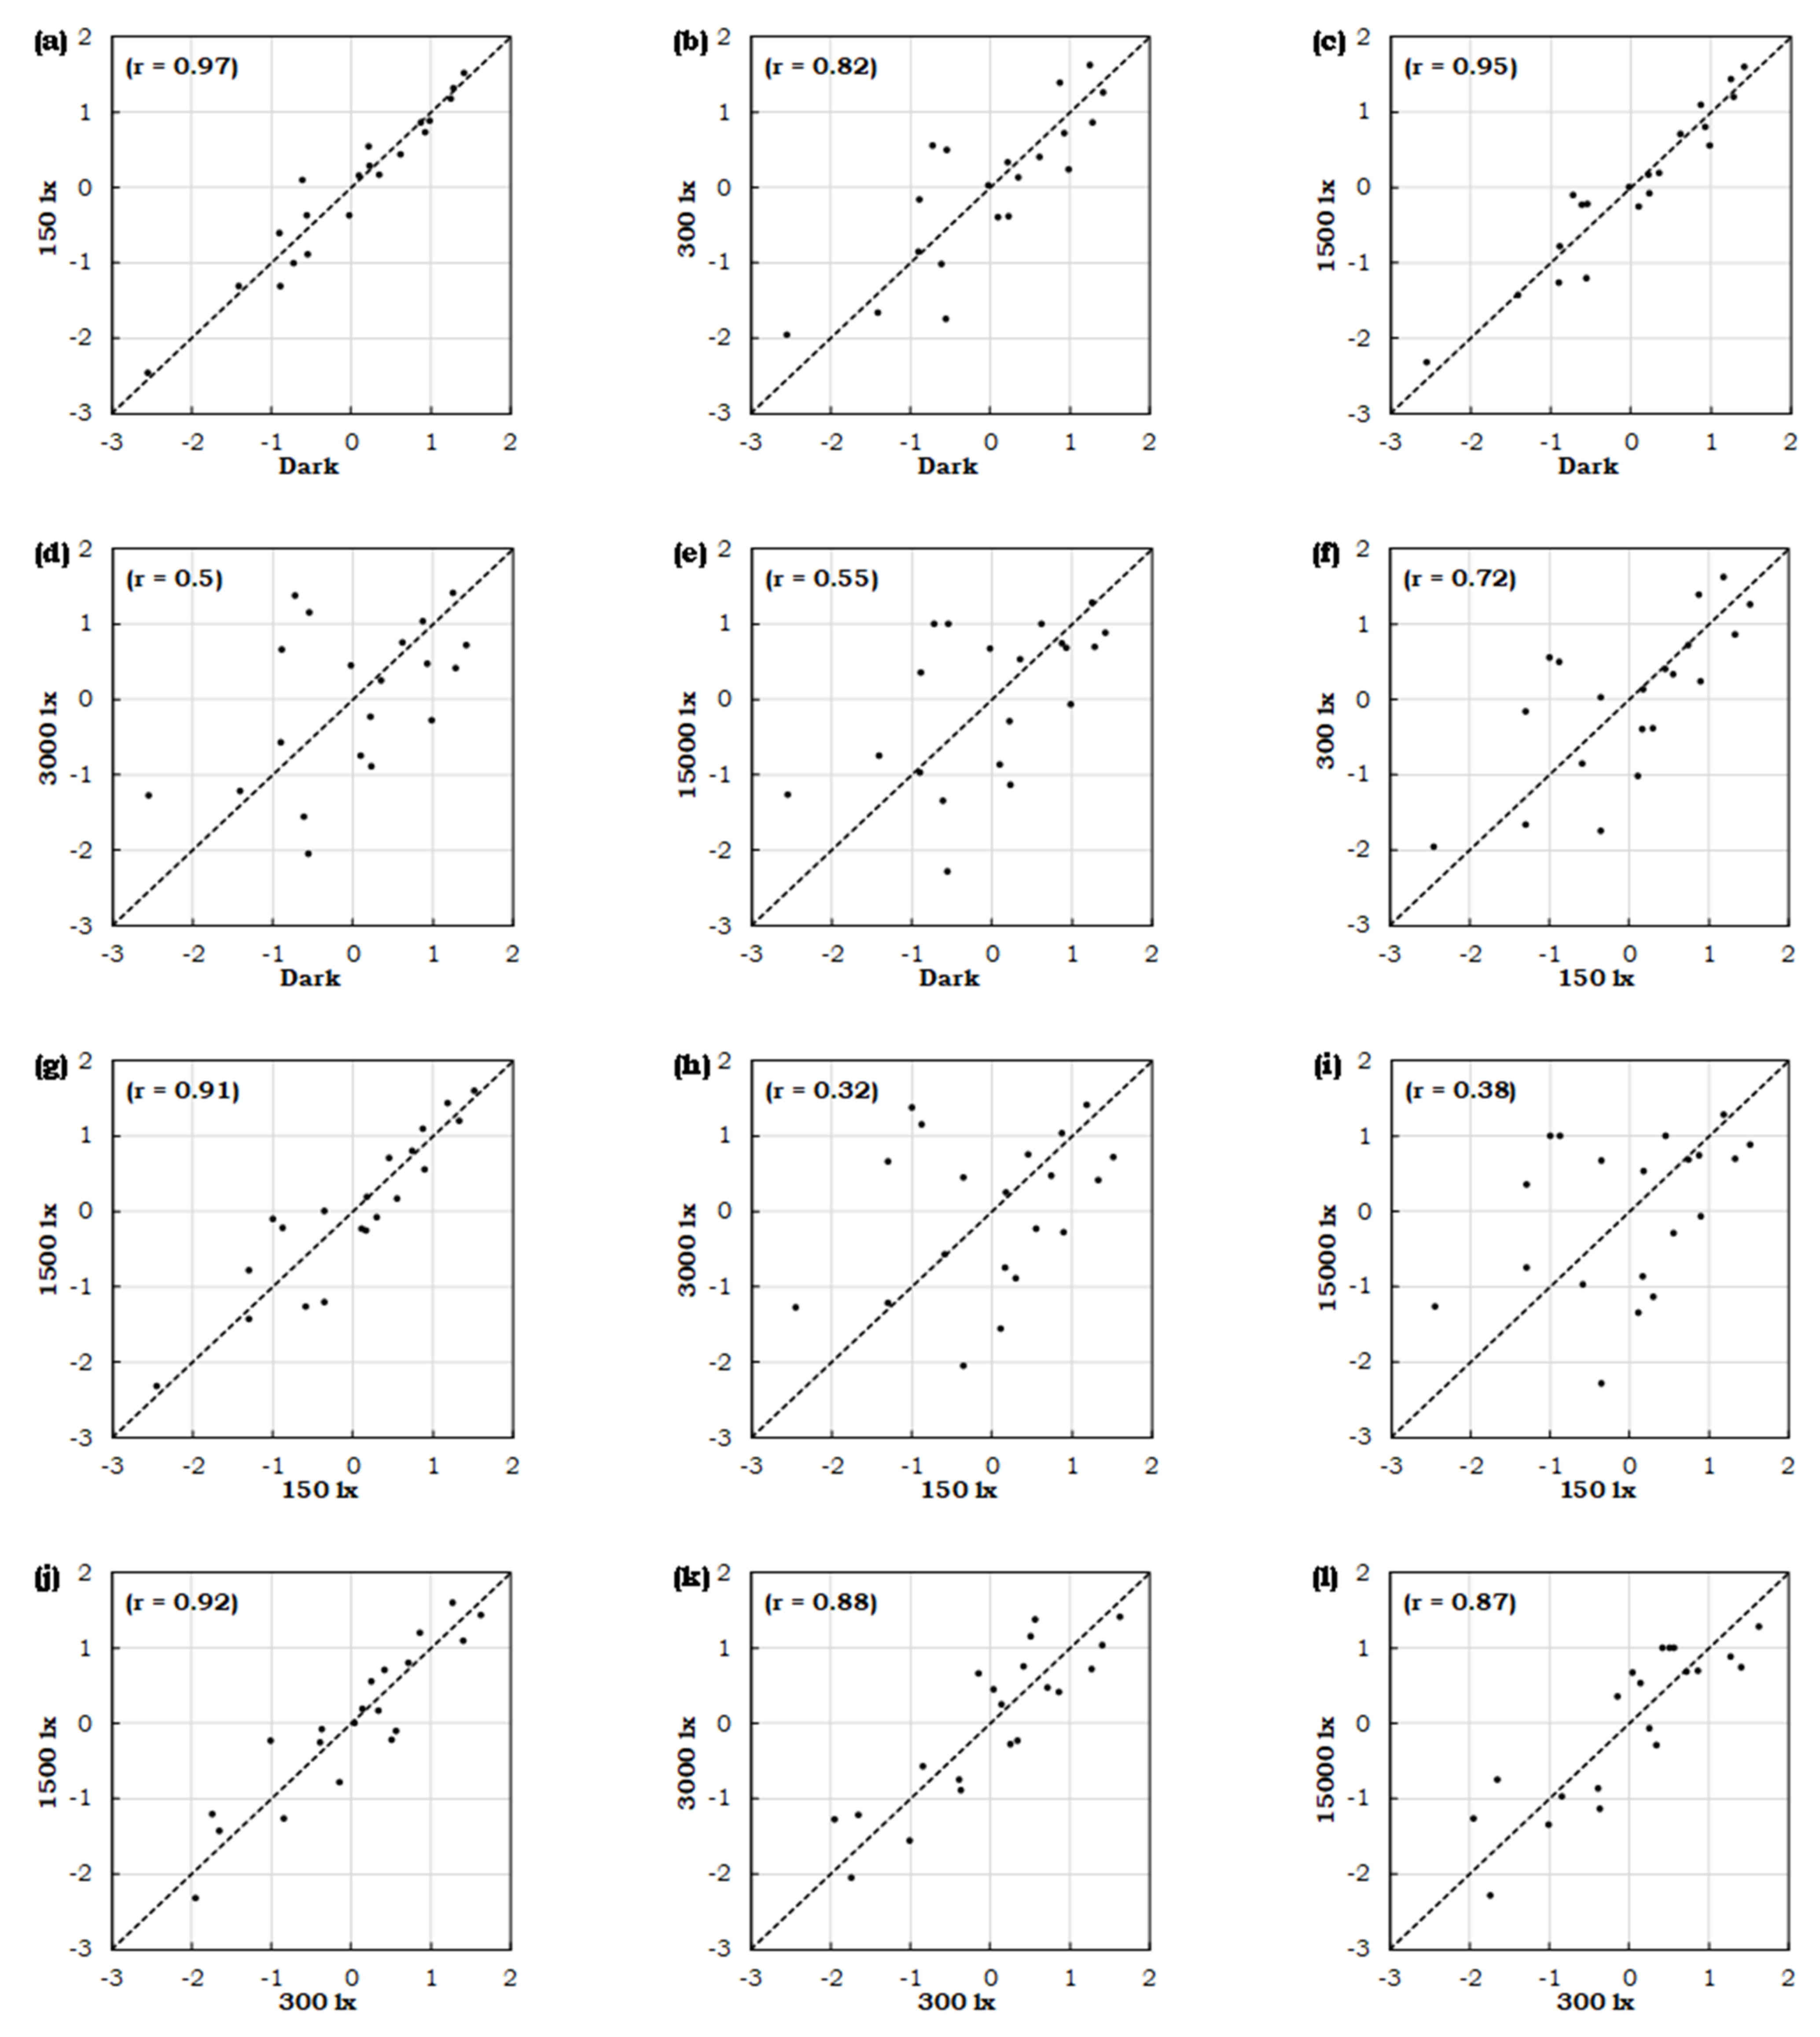
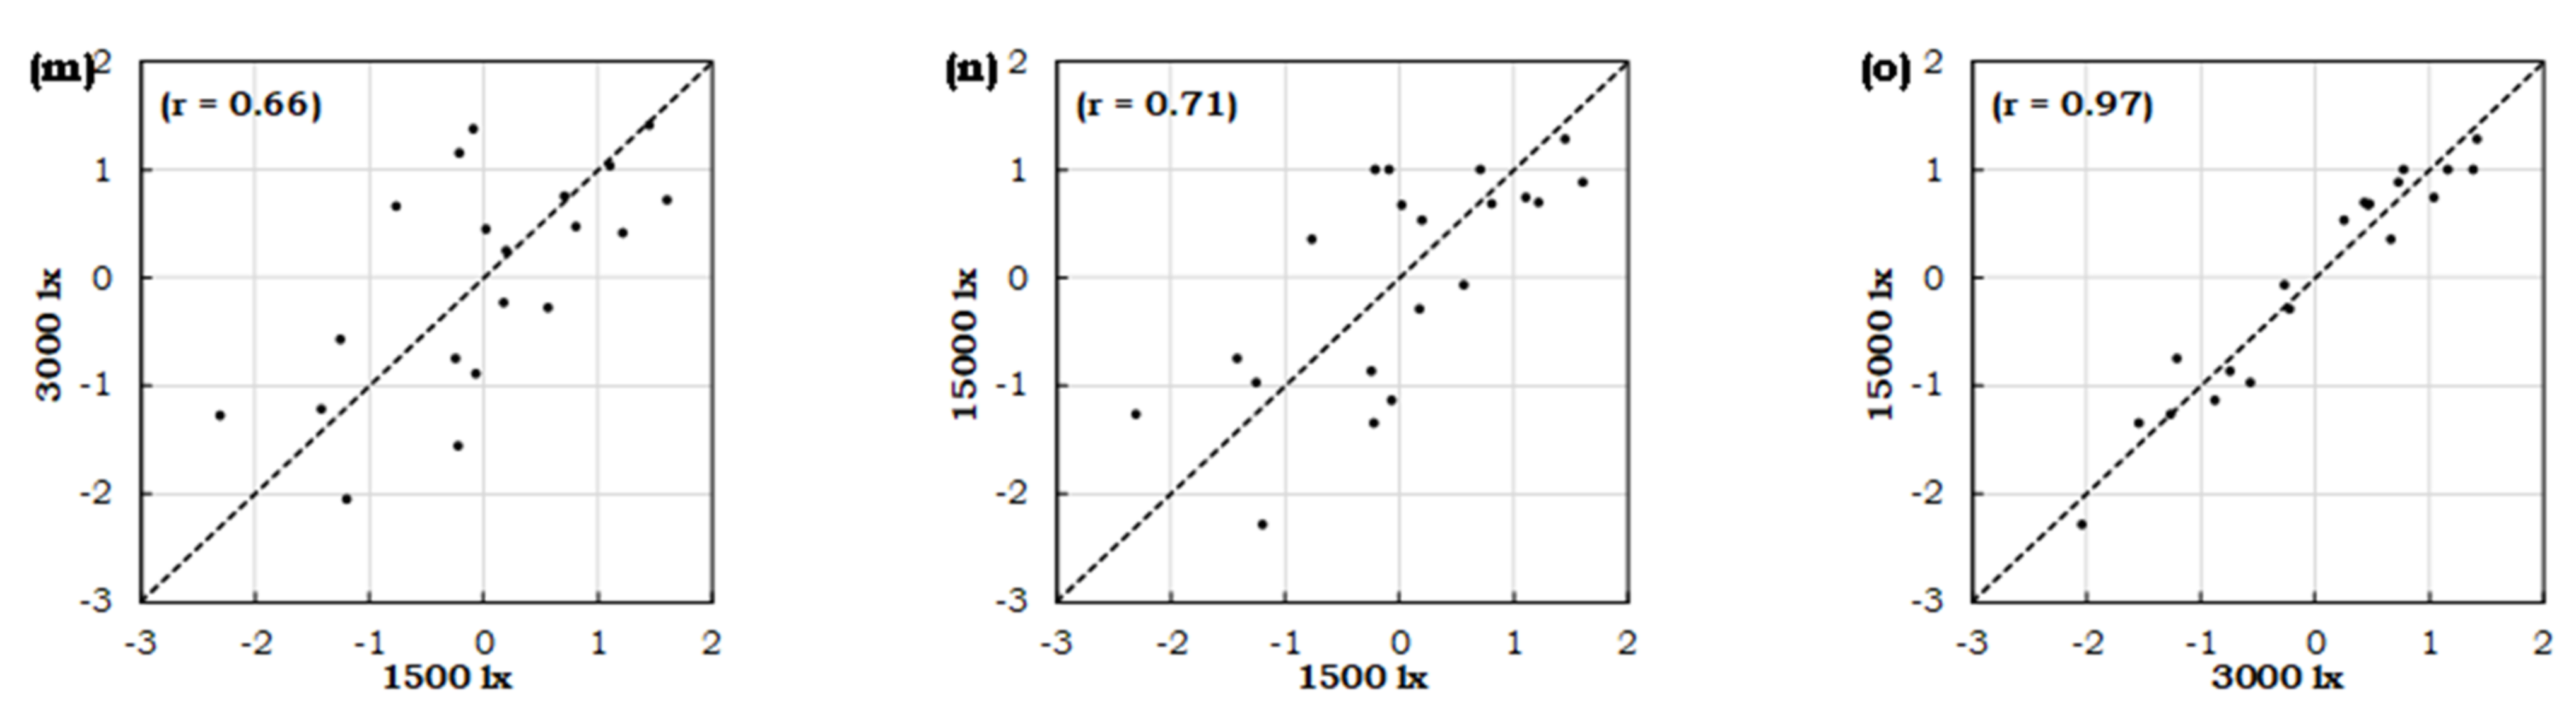
3.1. Observer Variability
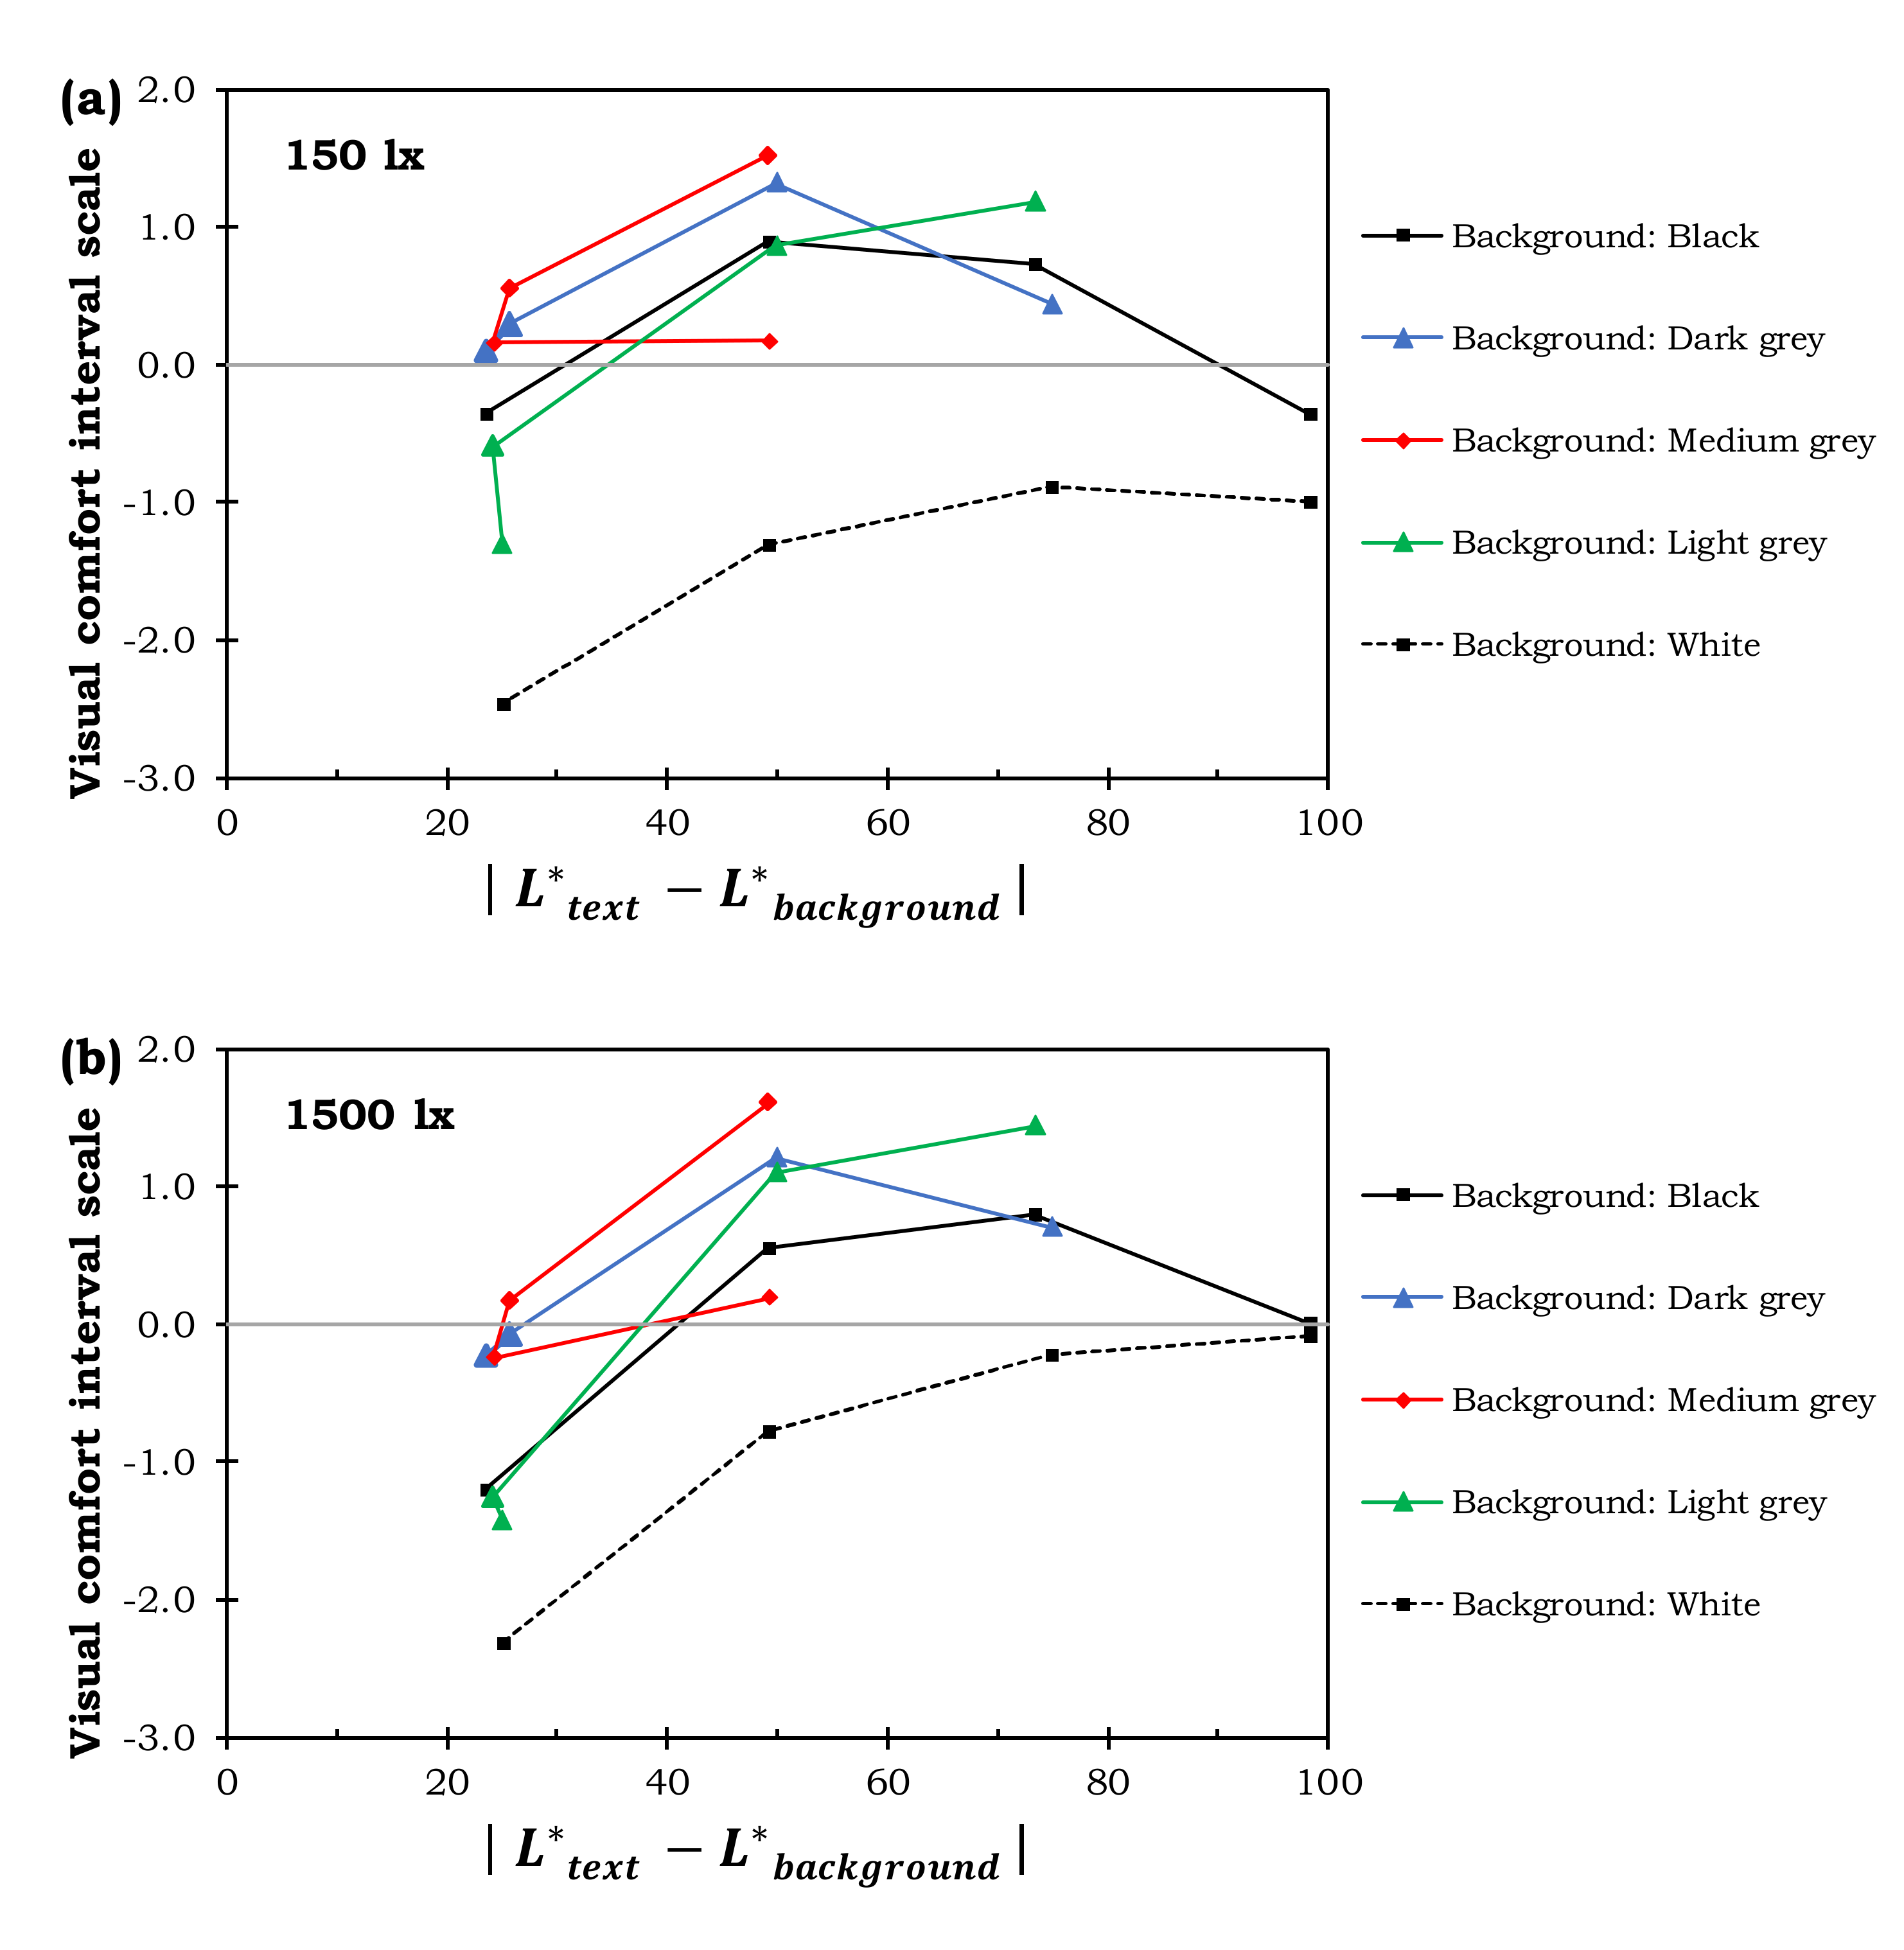
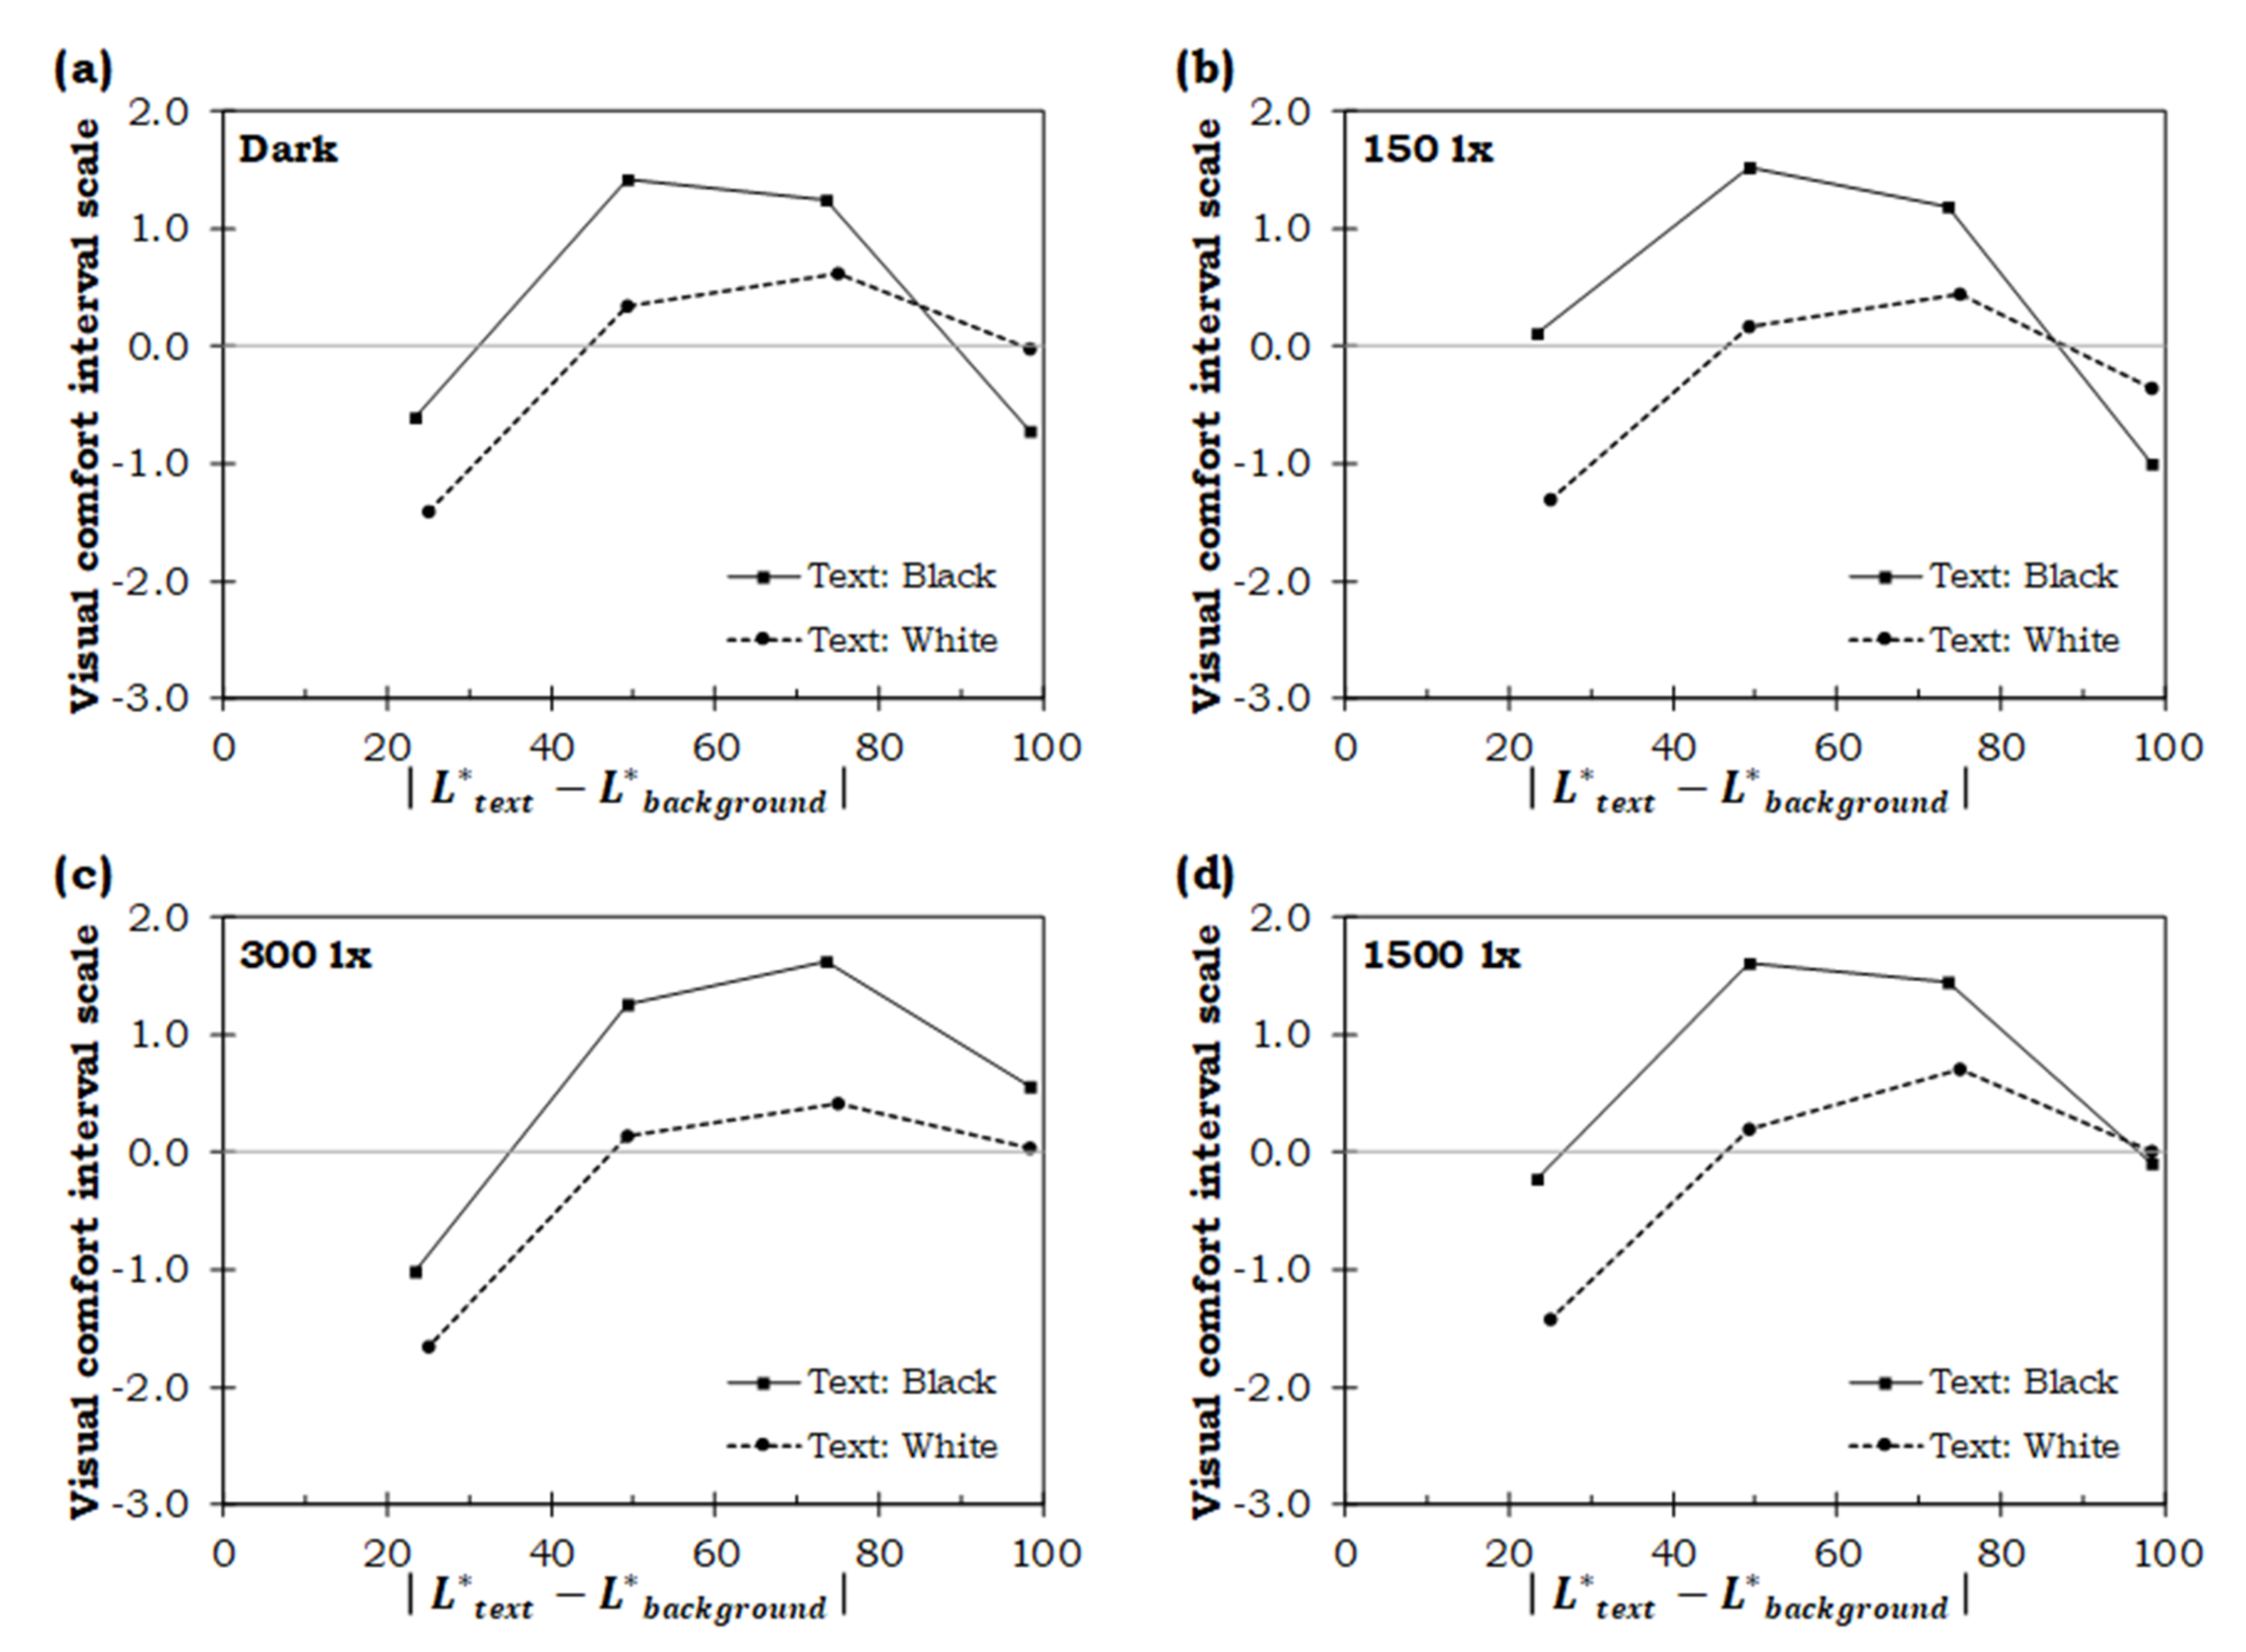
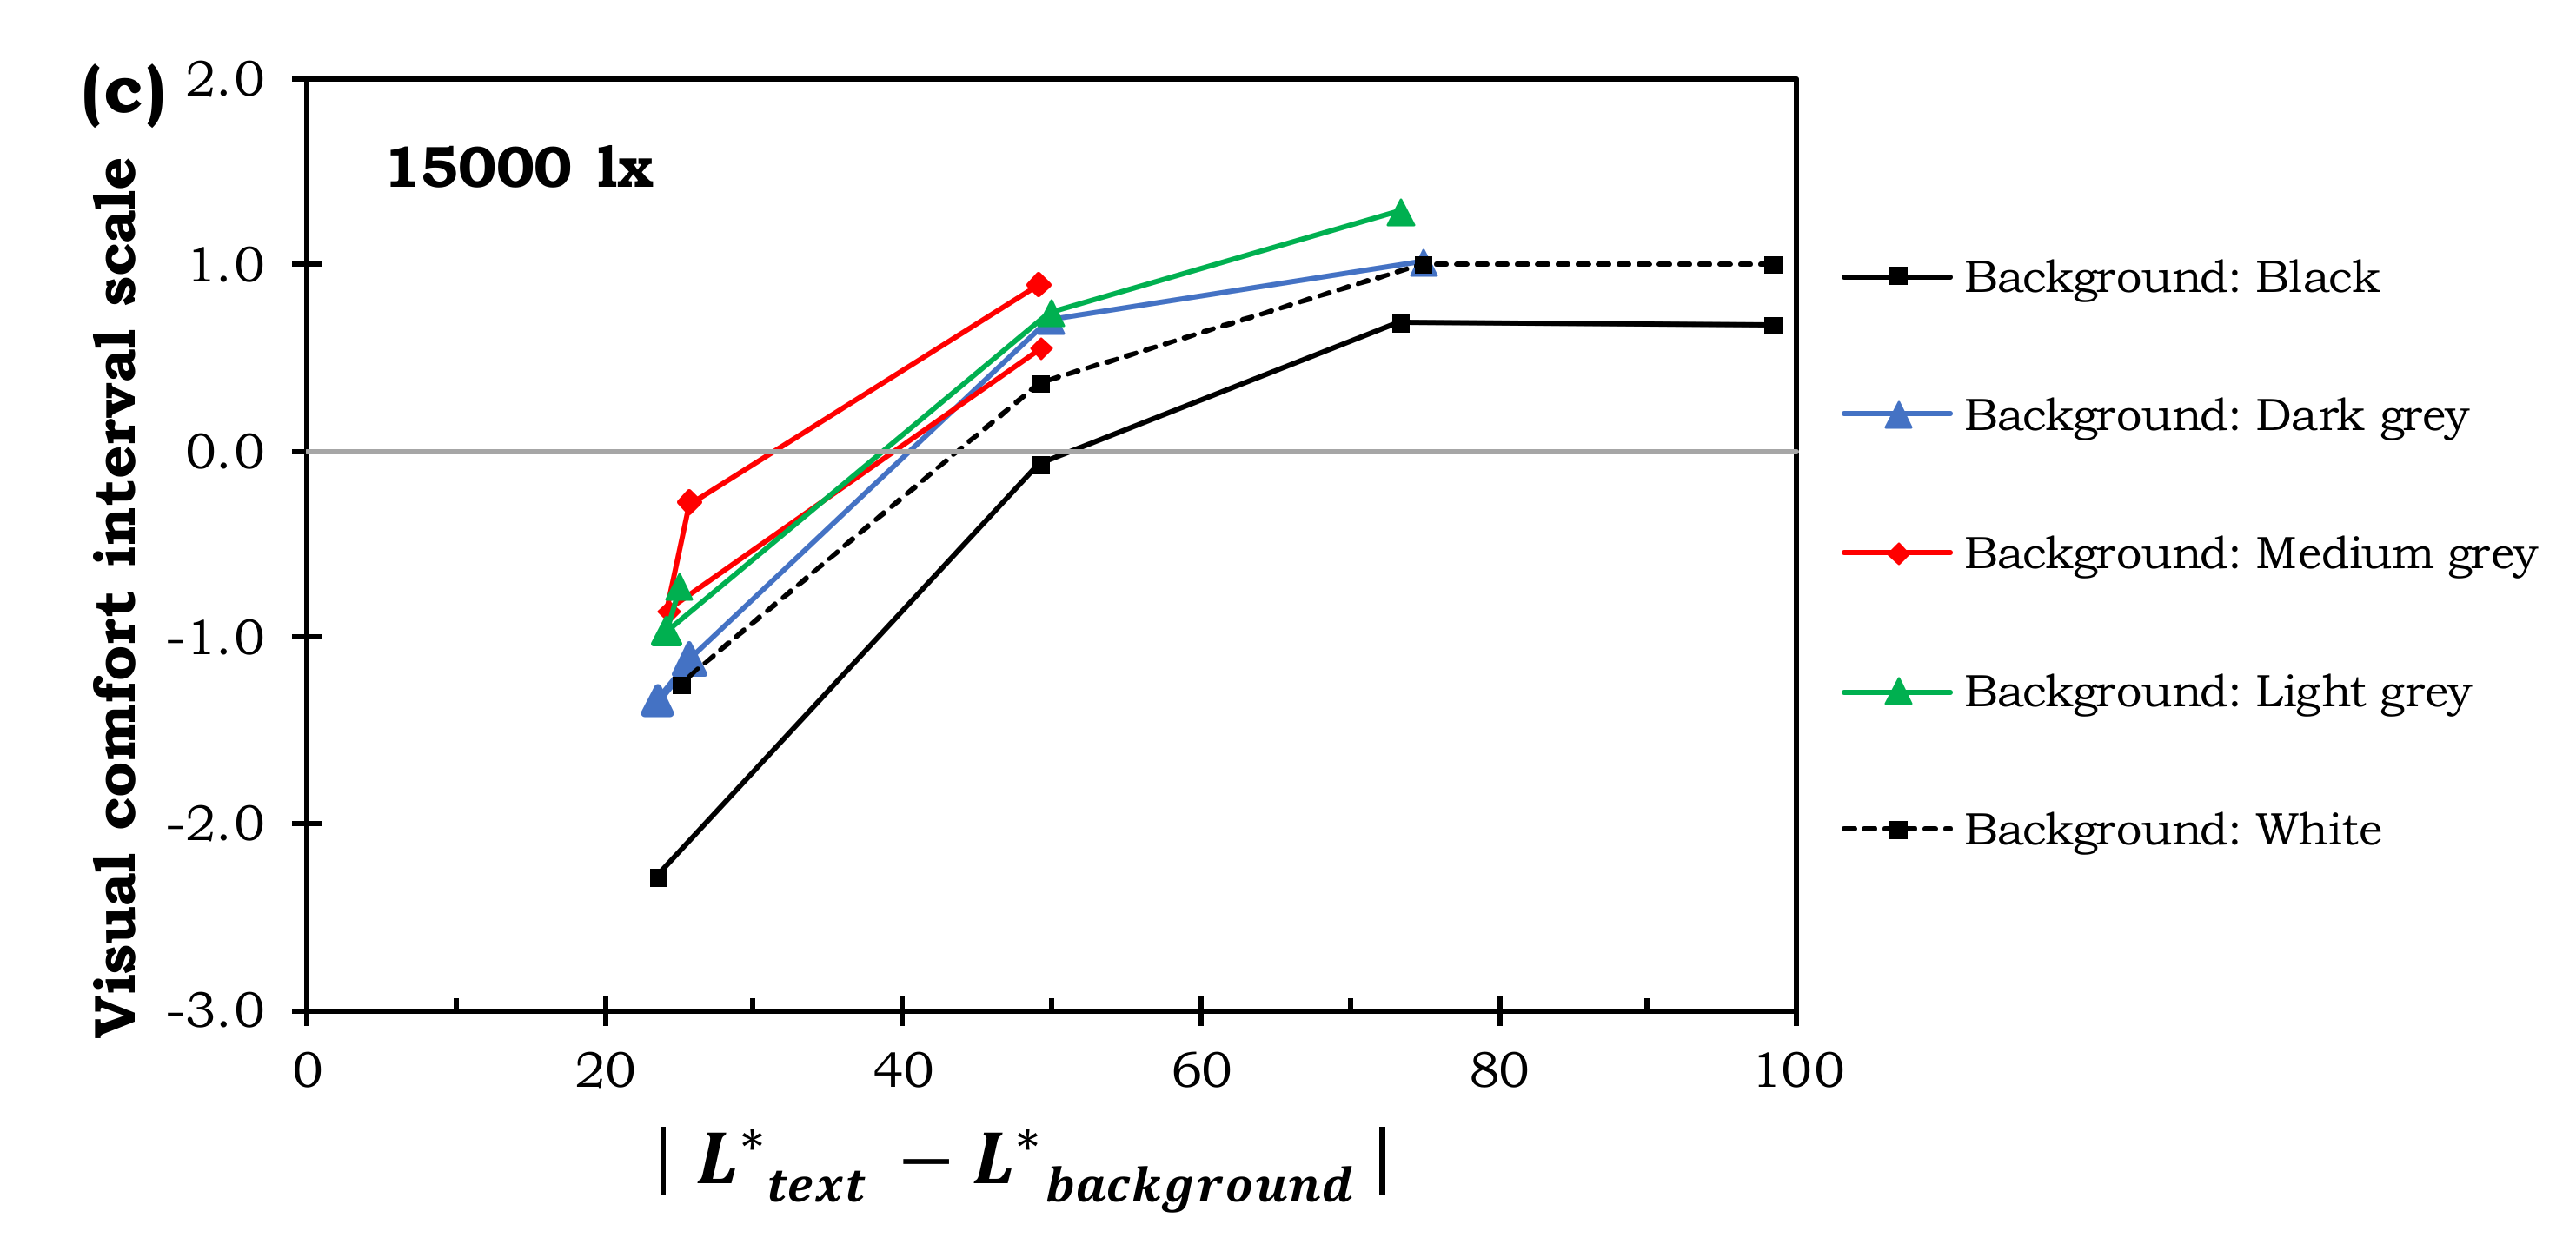
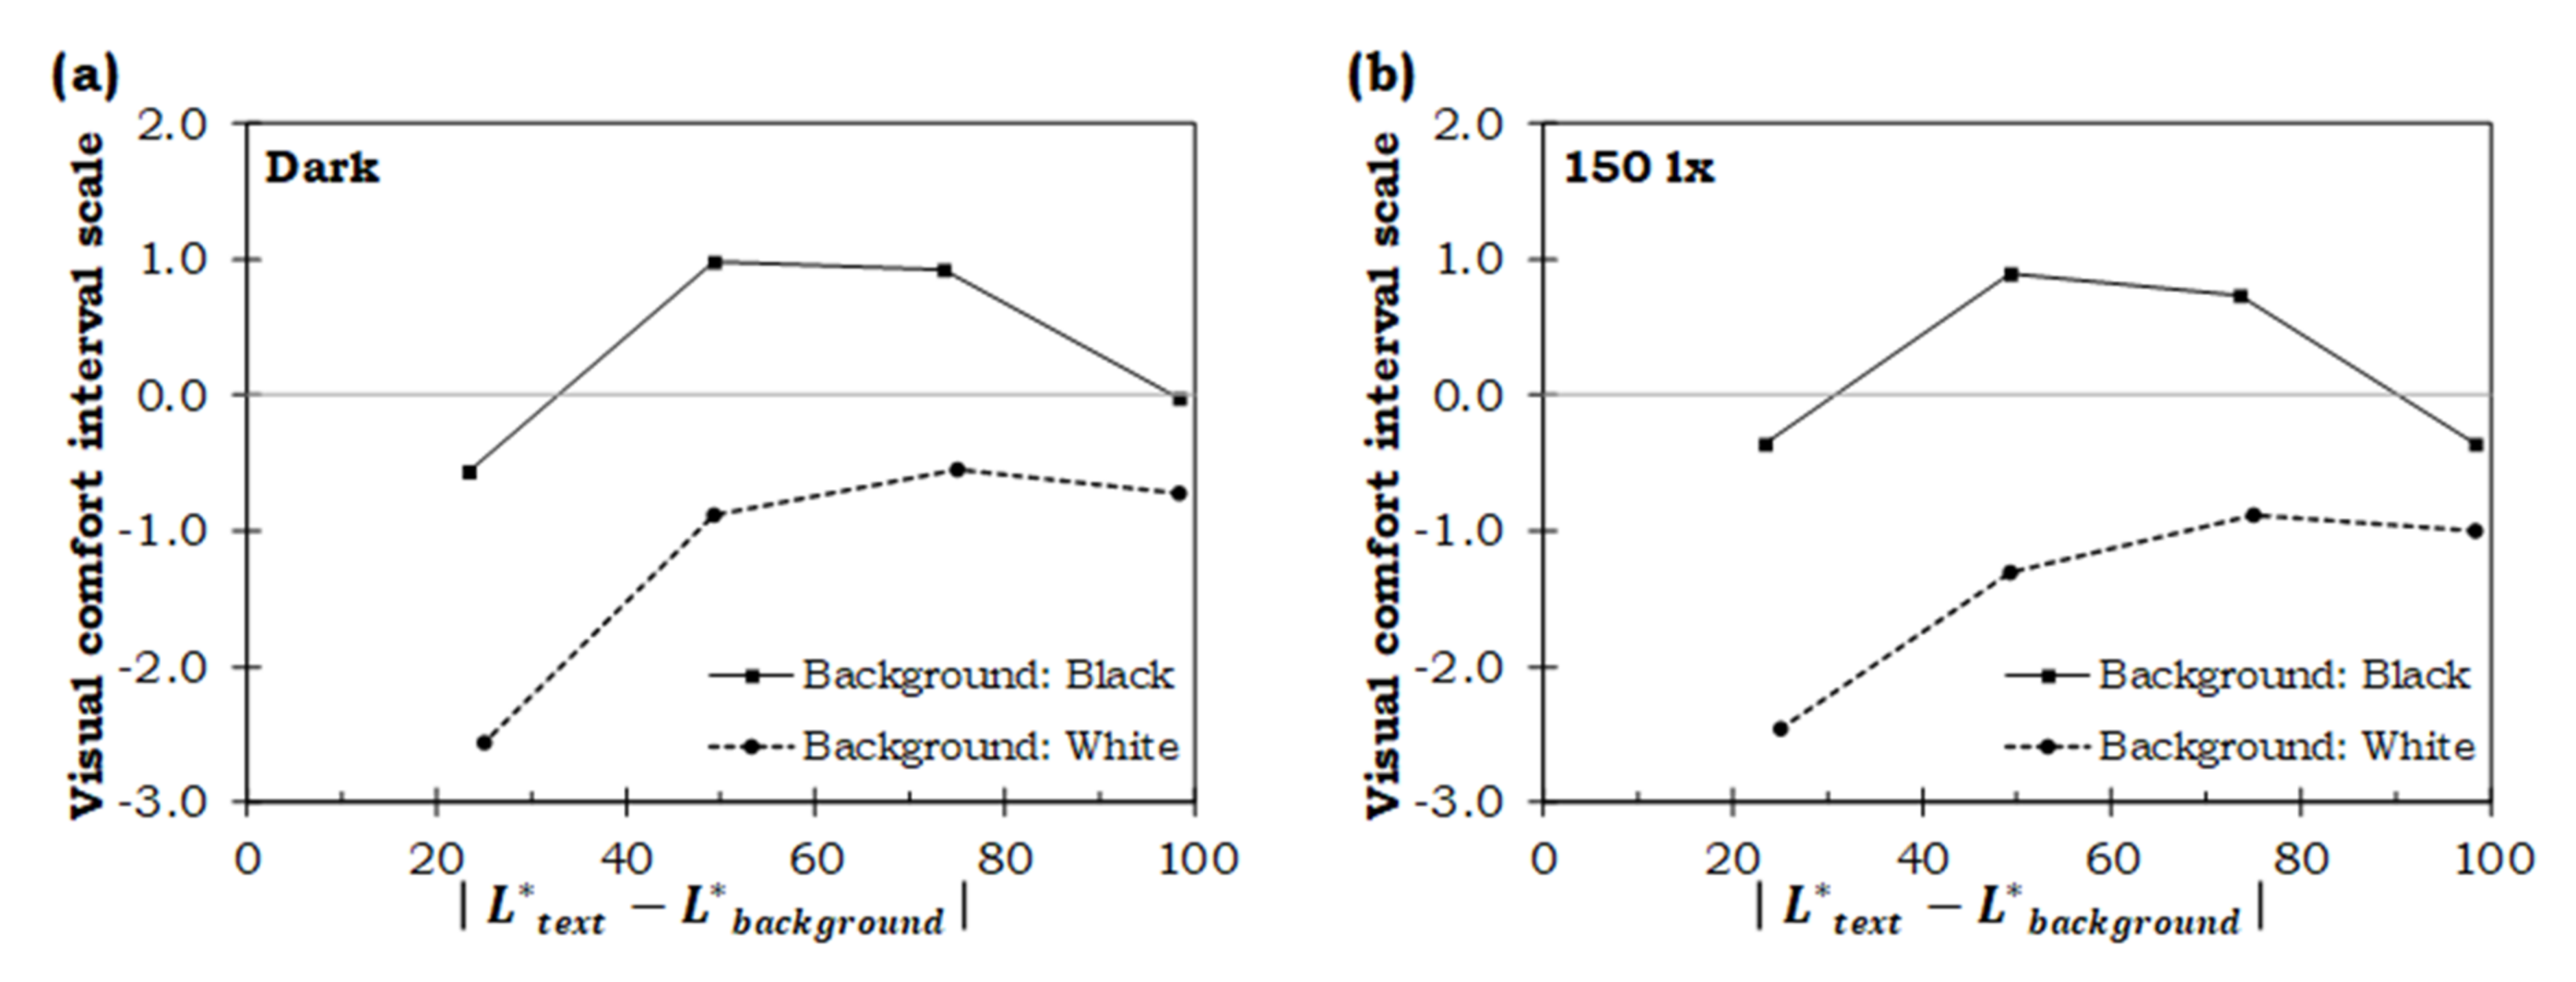
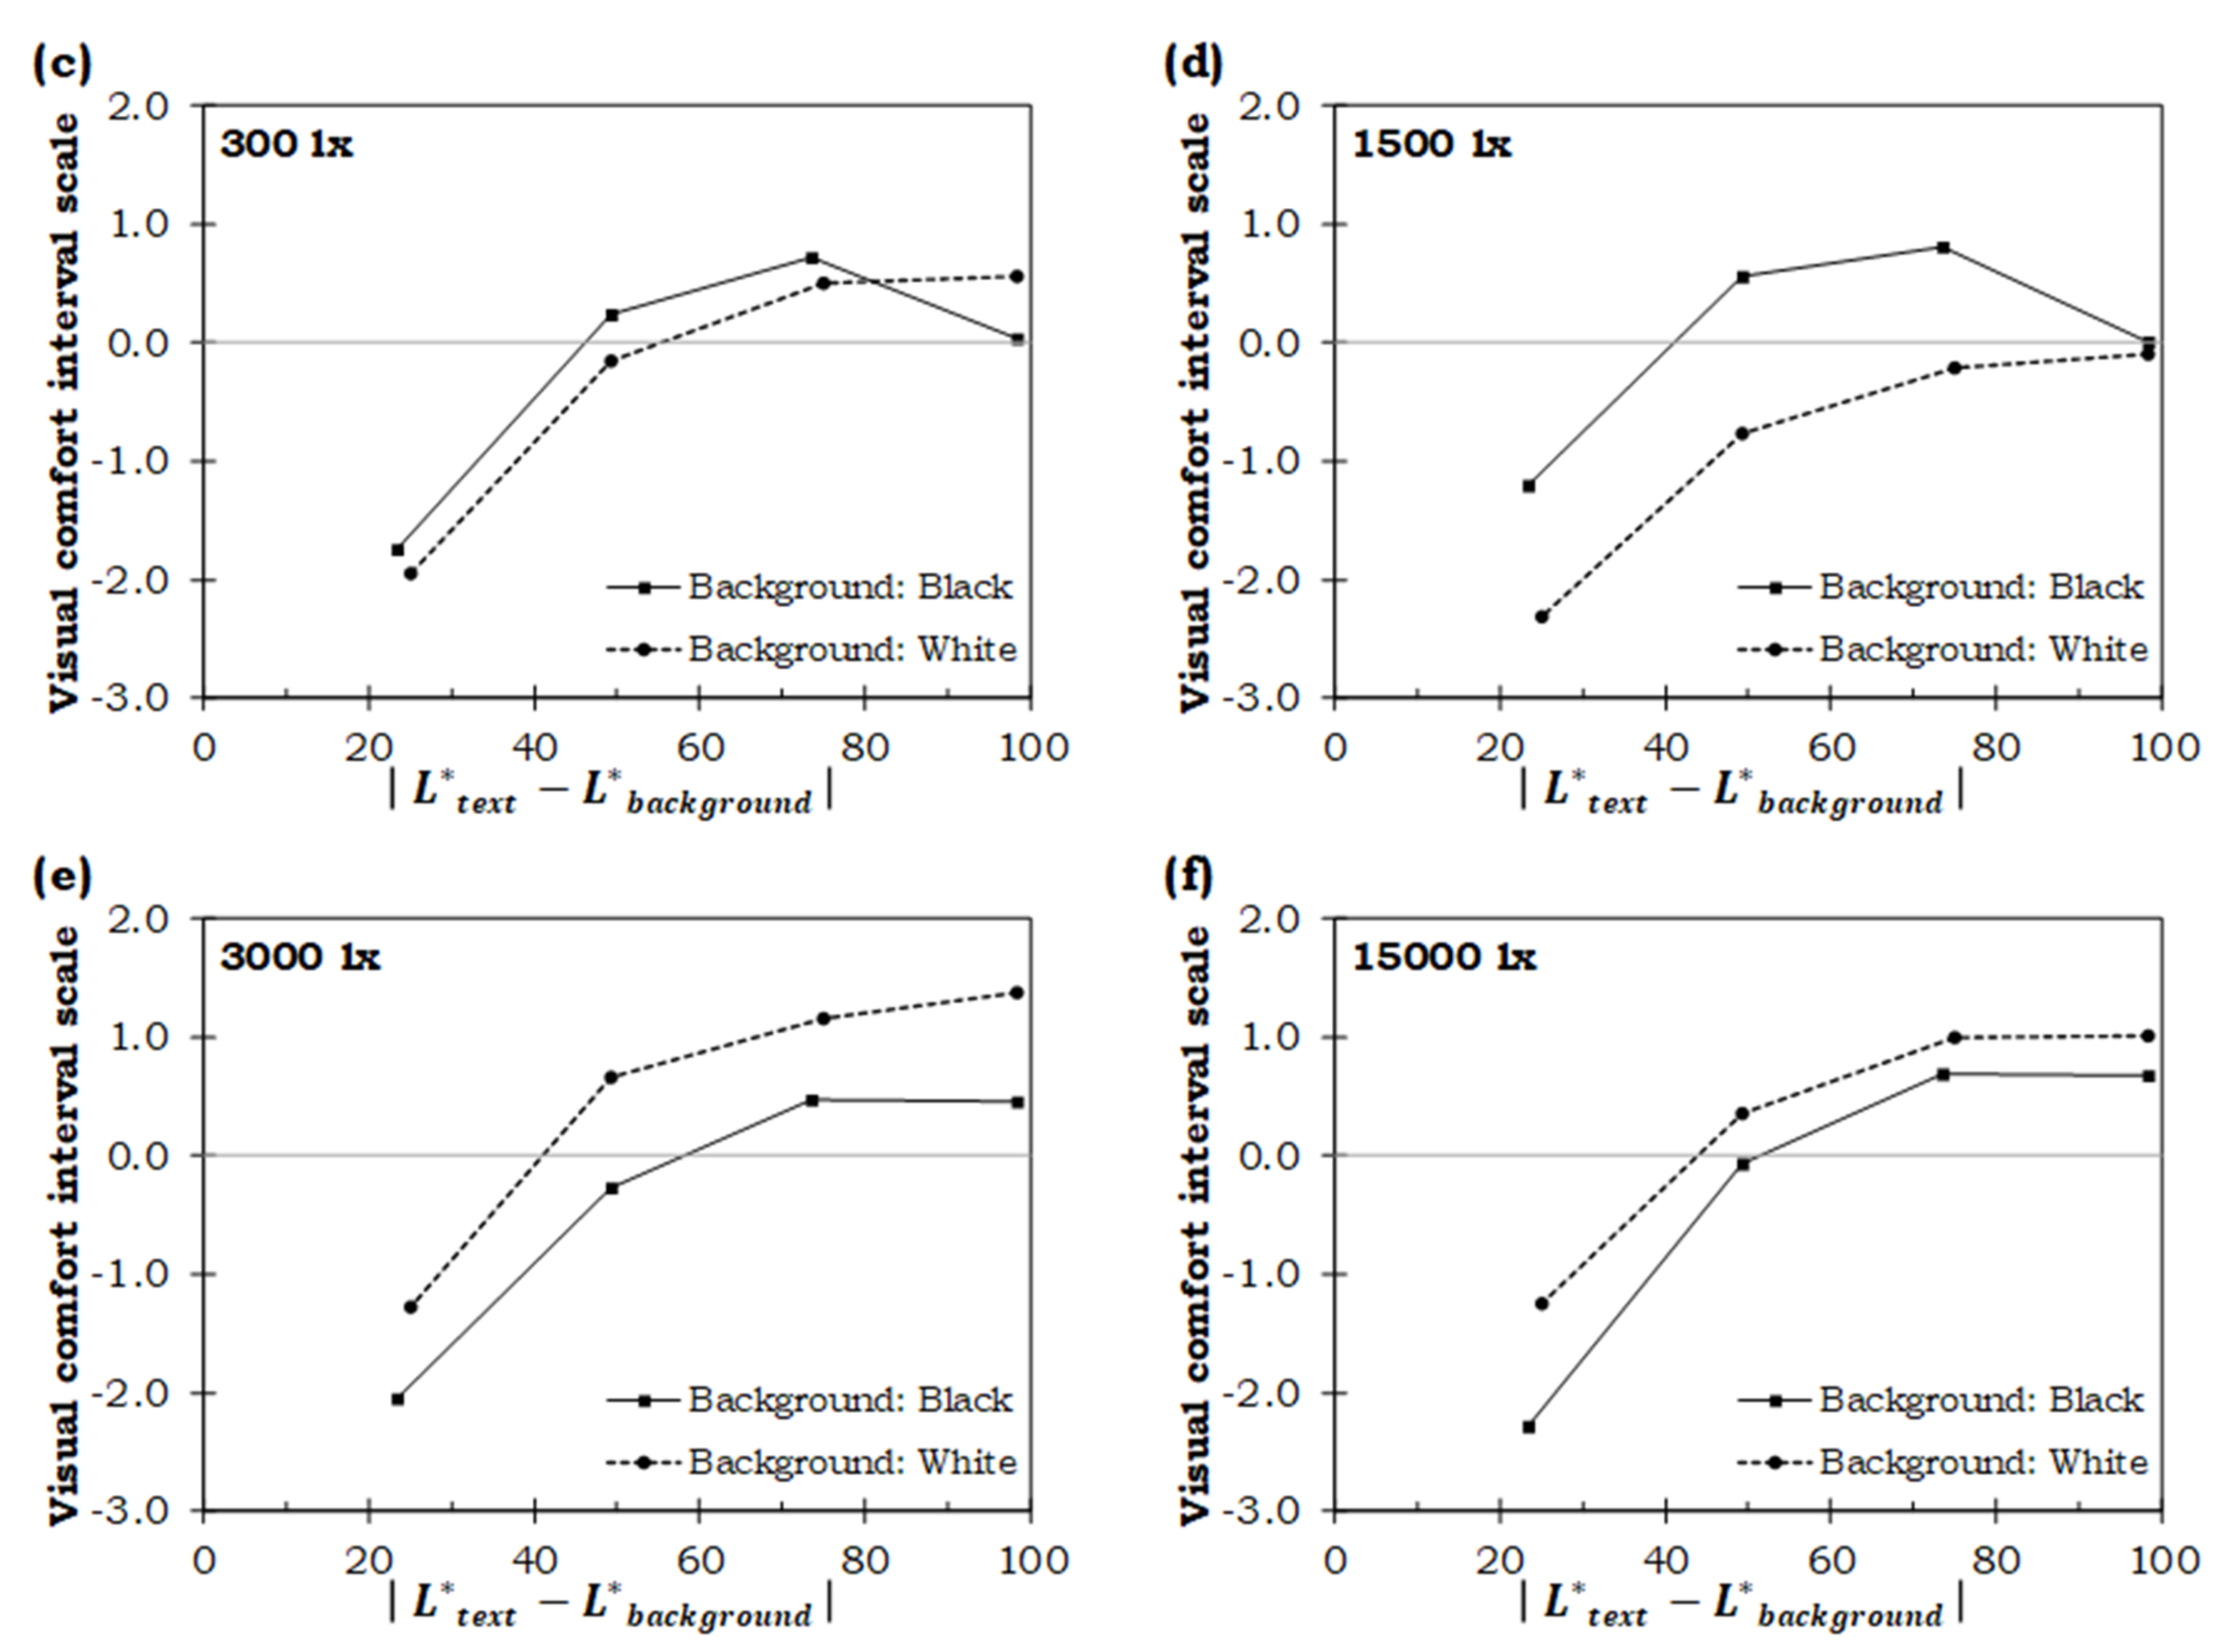
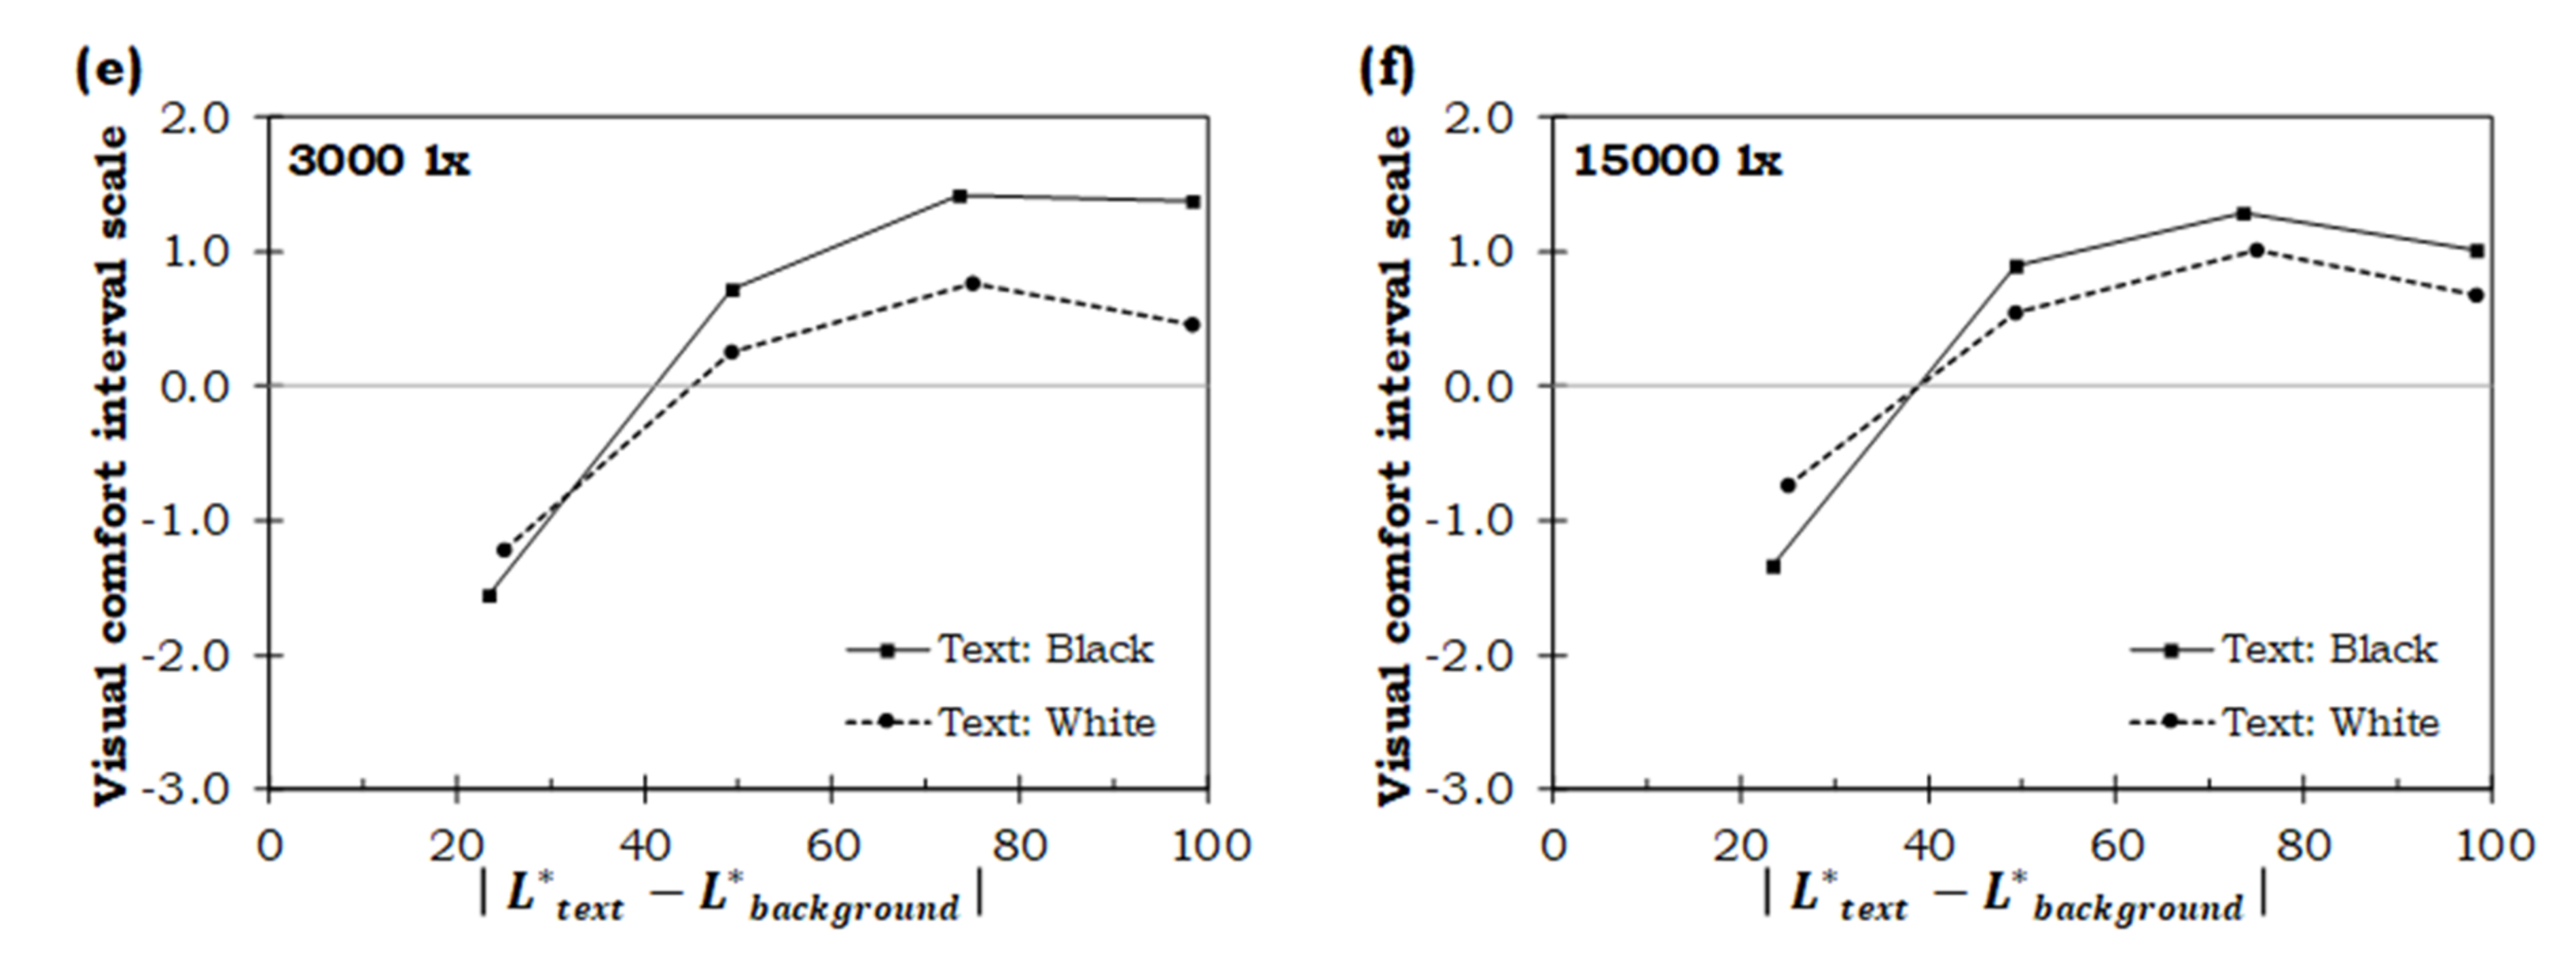
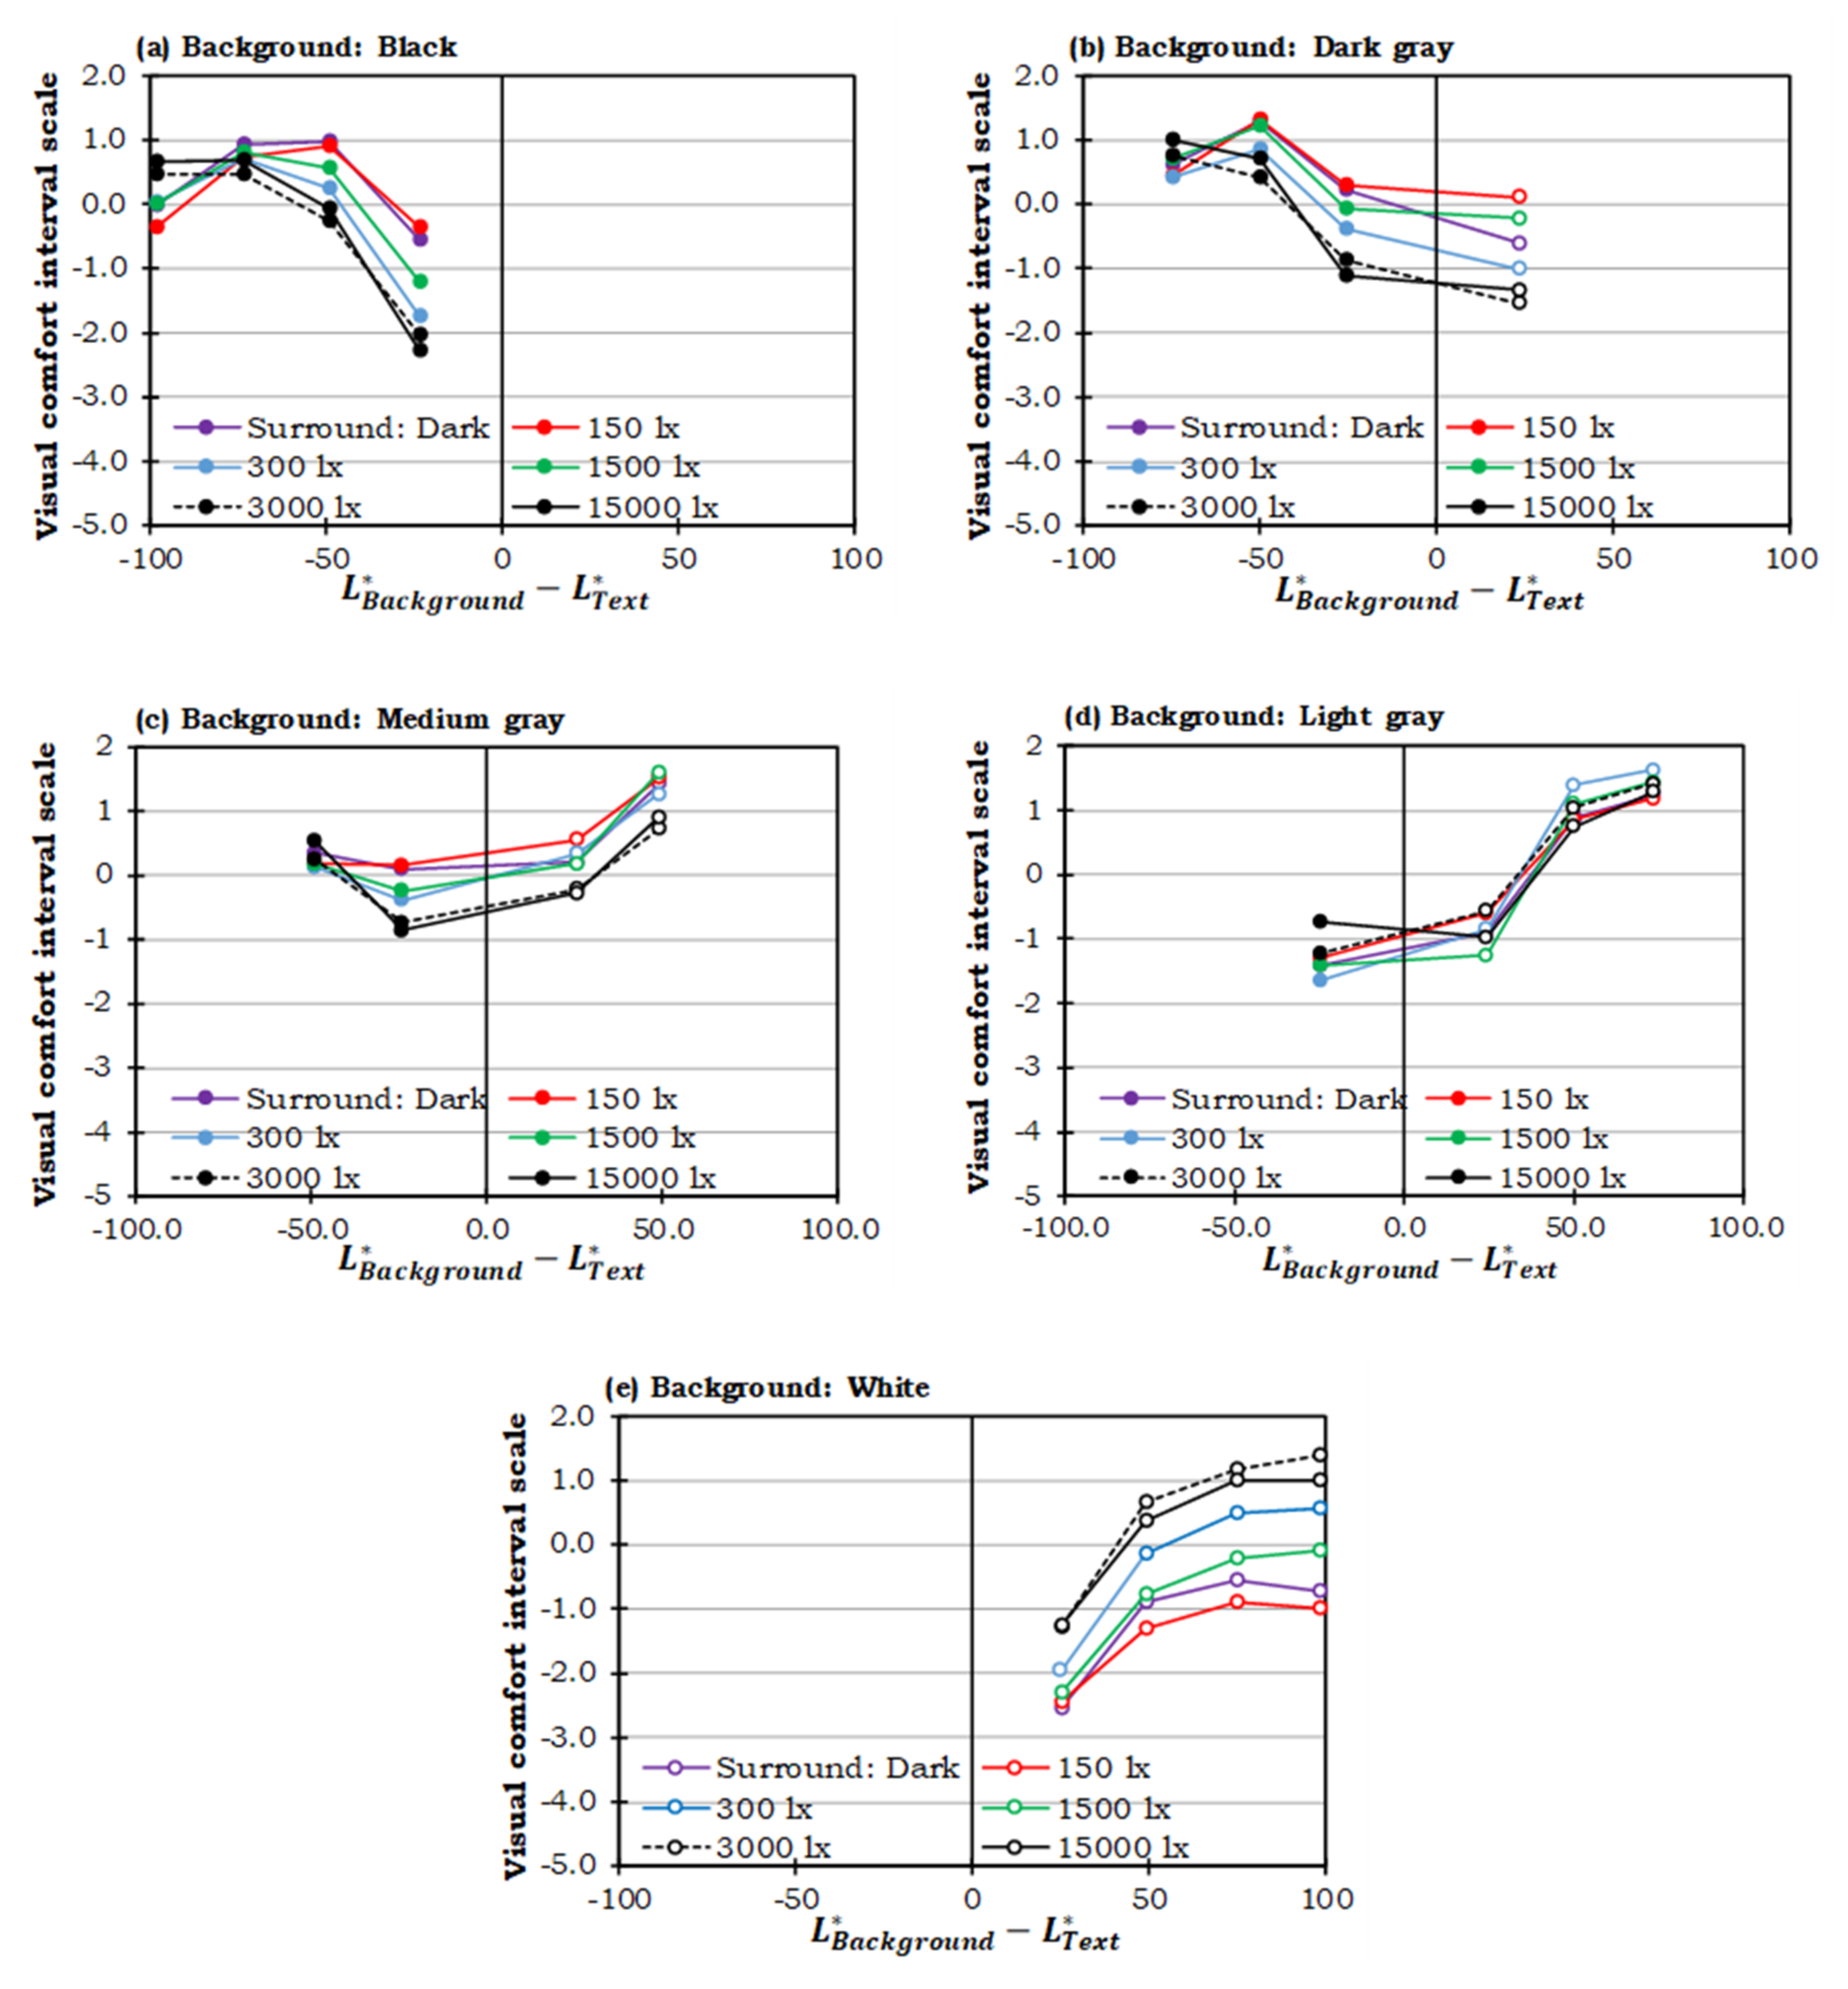
3.2. Visual Comfort
4. Discussion
5. Evaluation Model
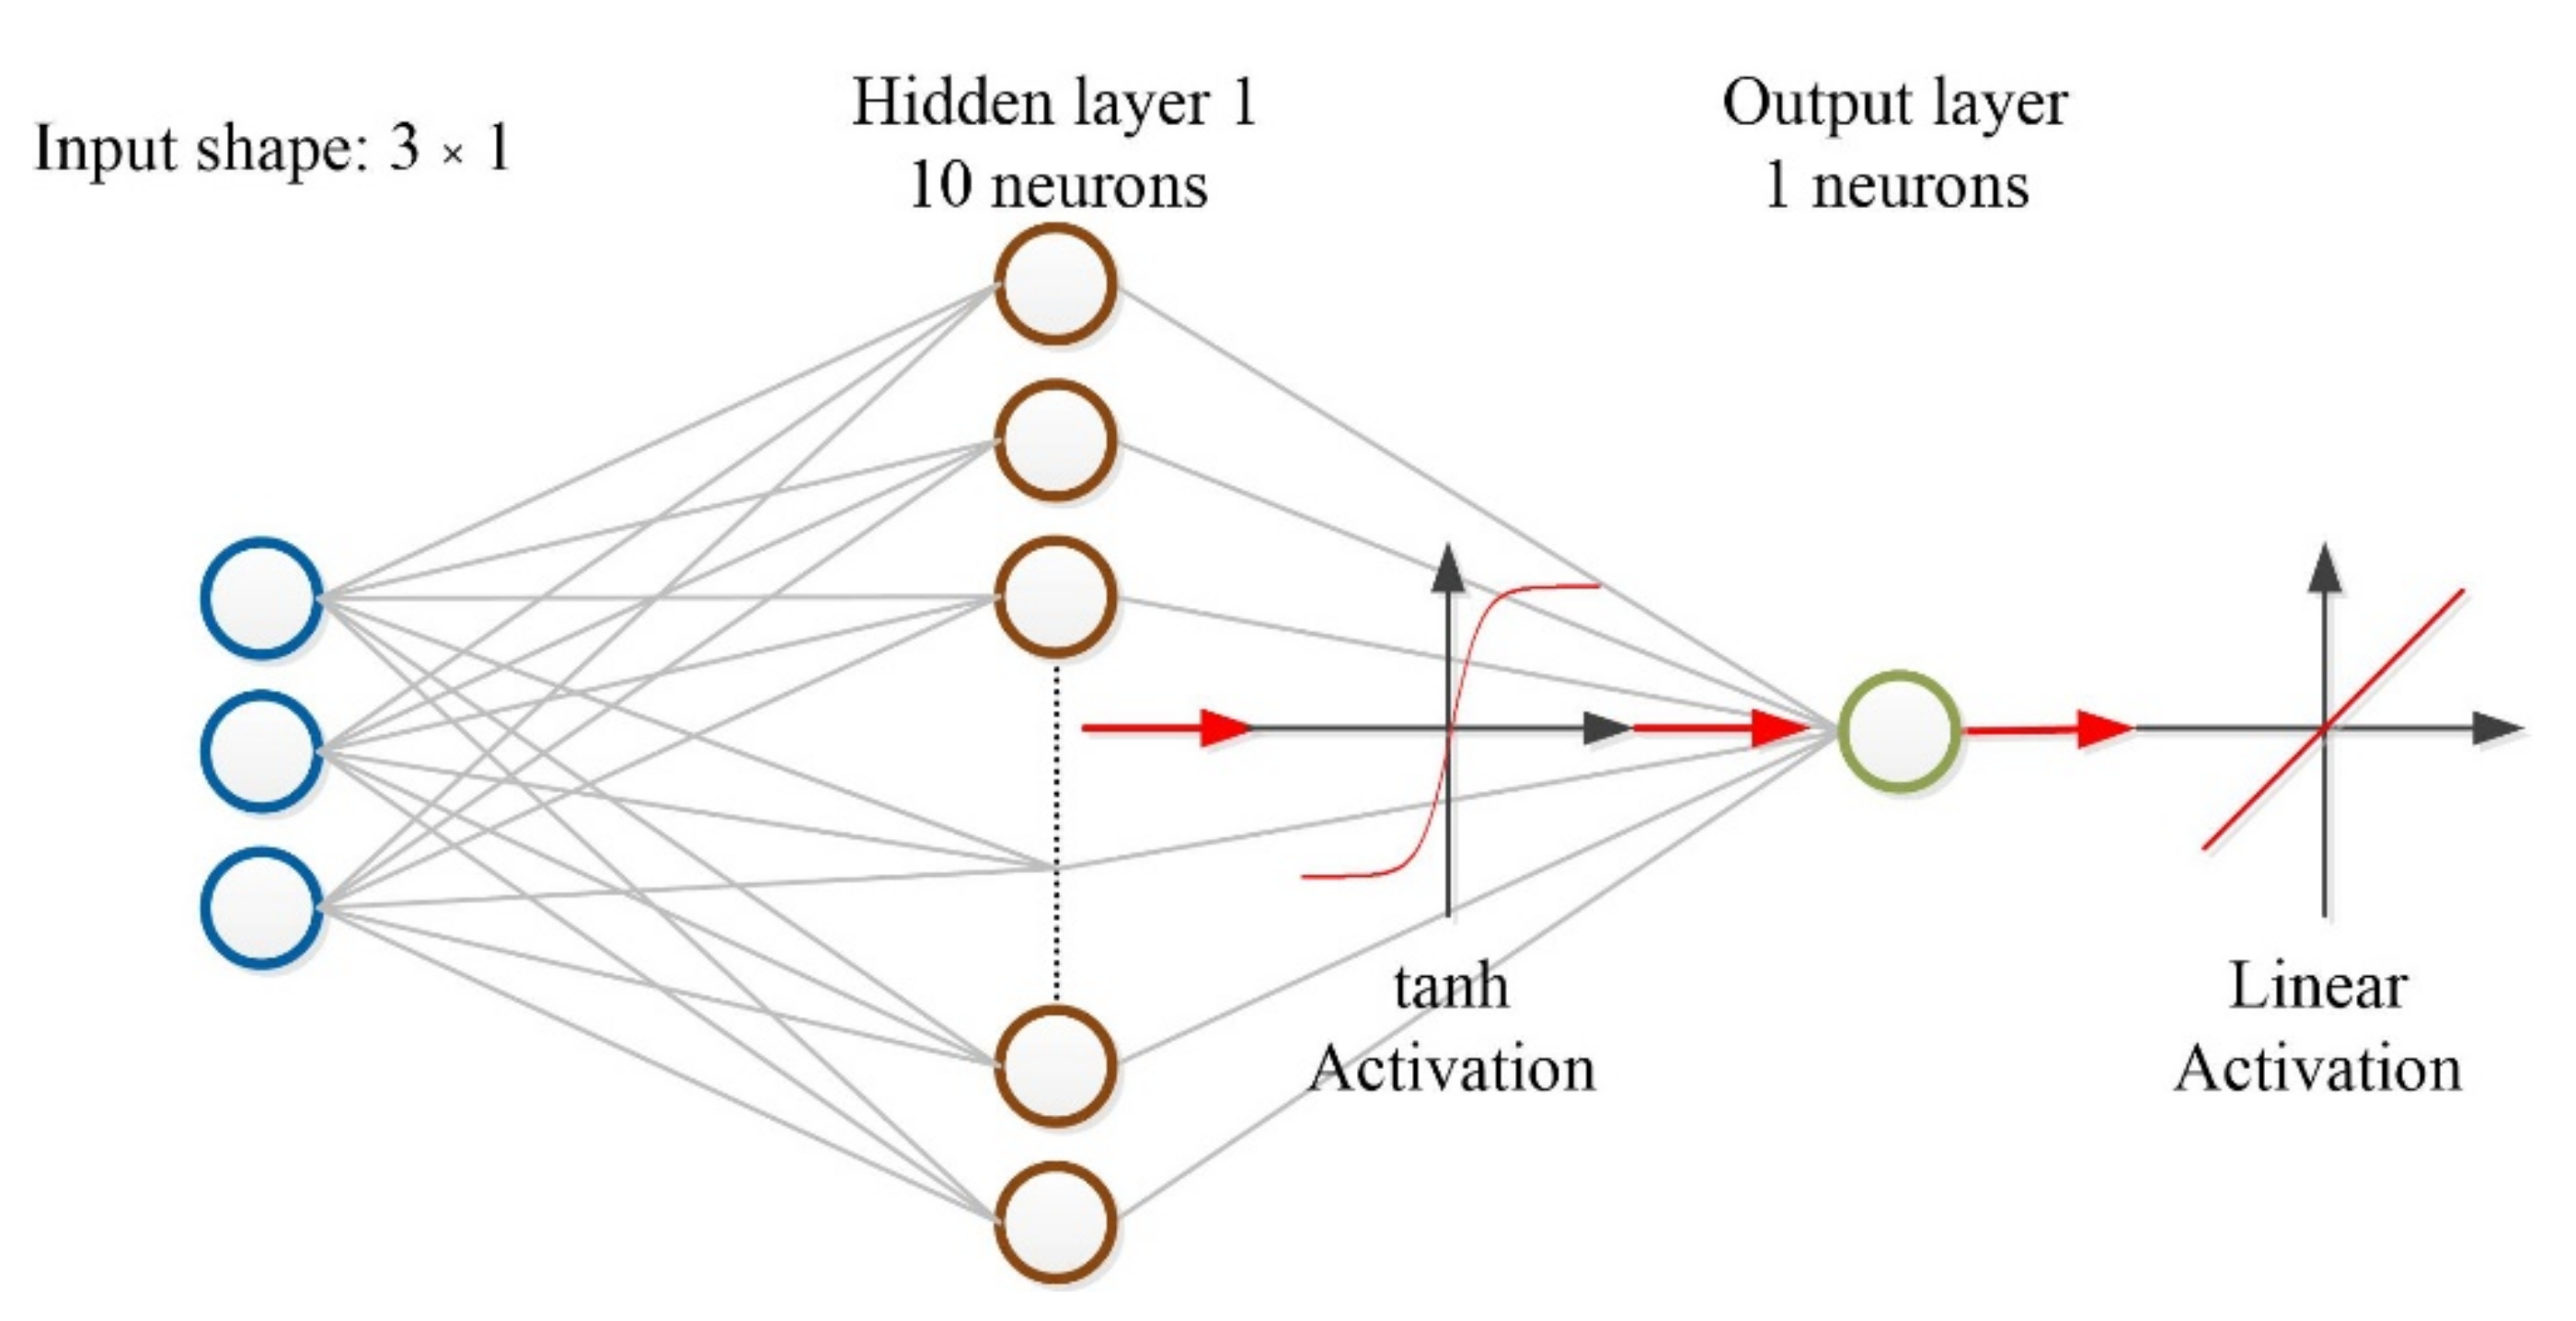
5.1. Modeling
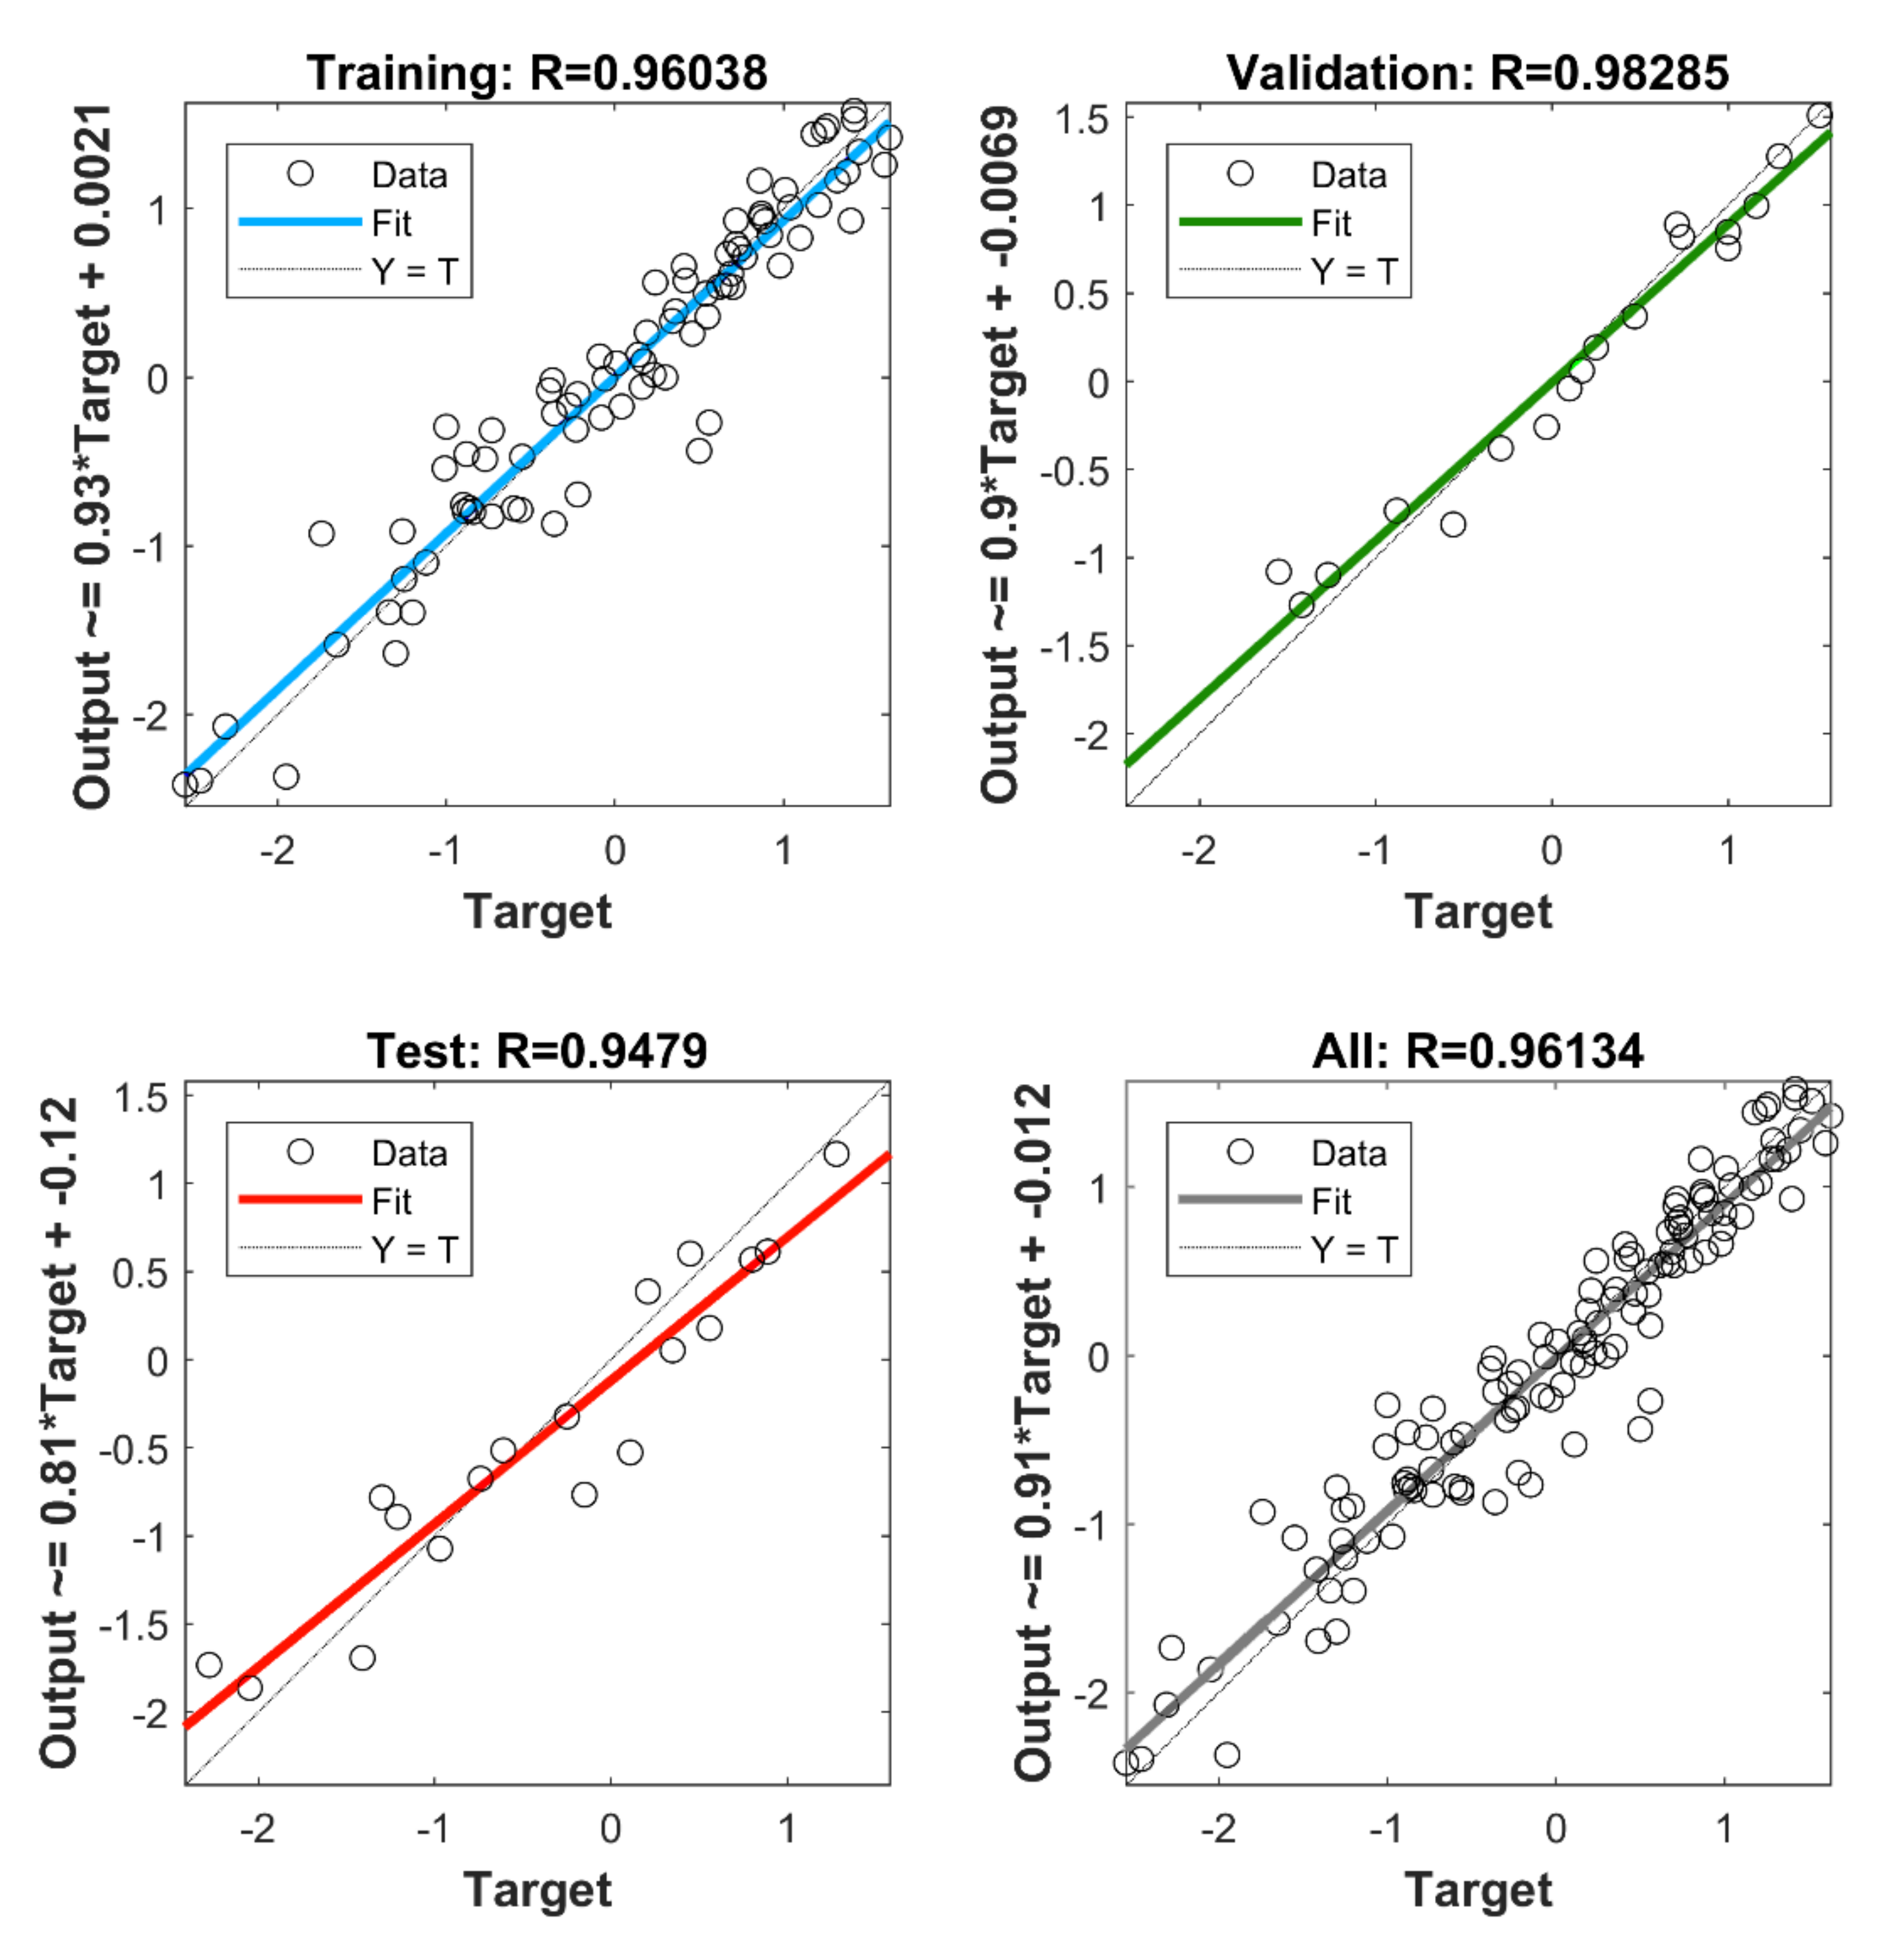
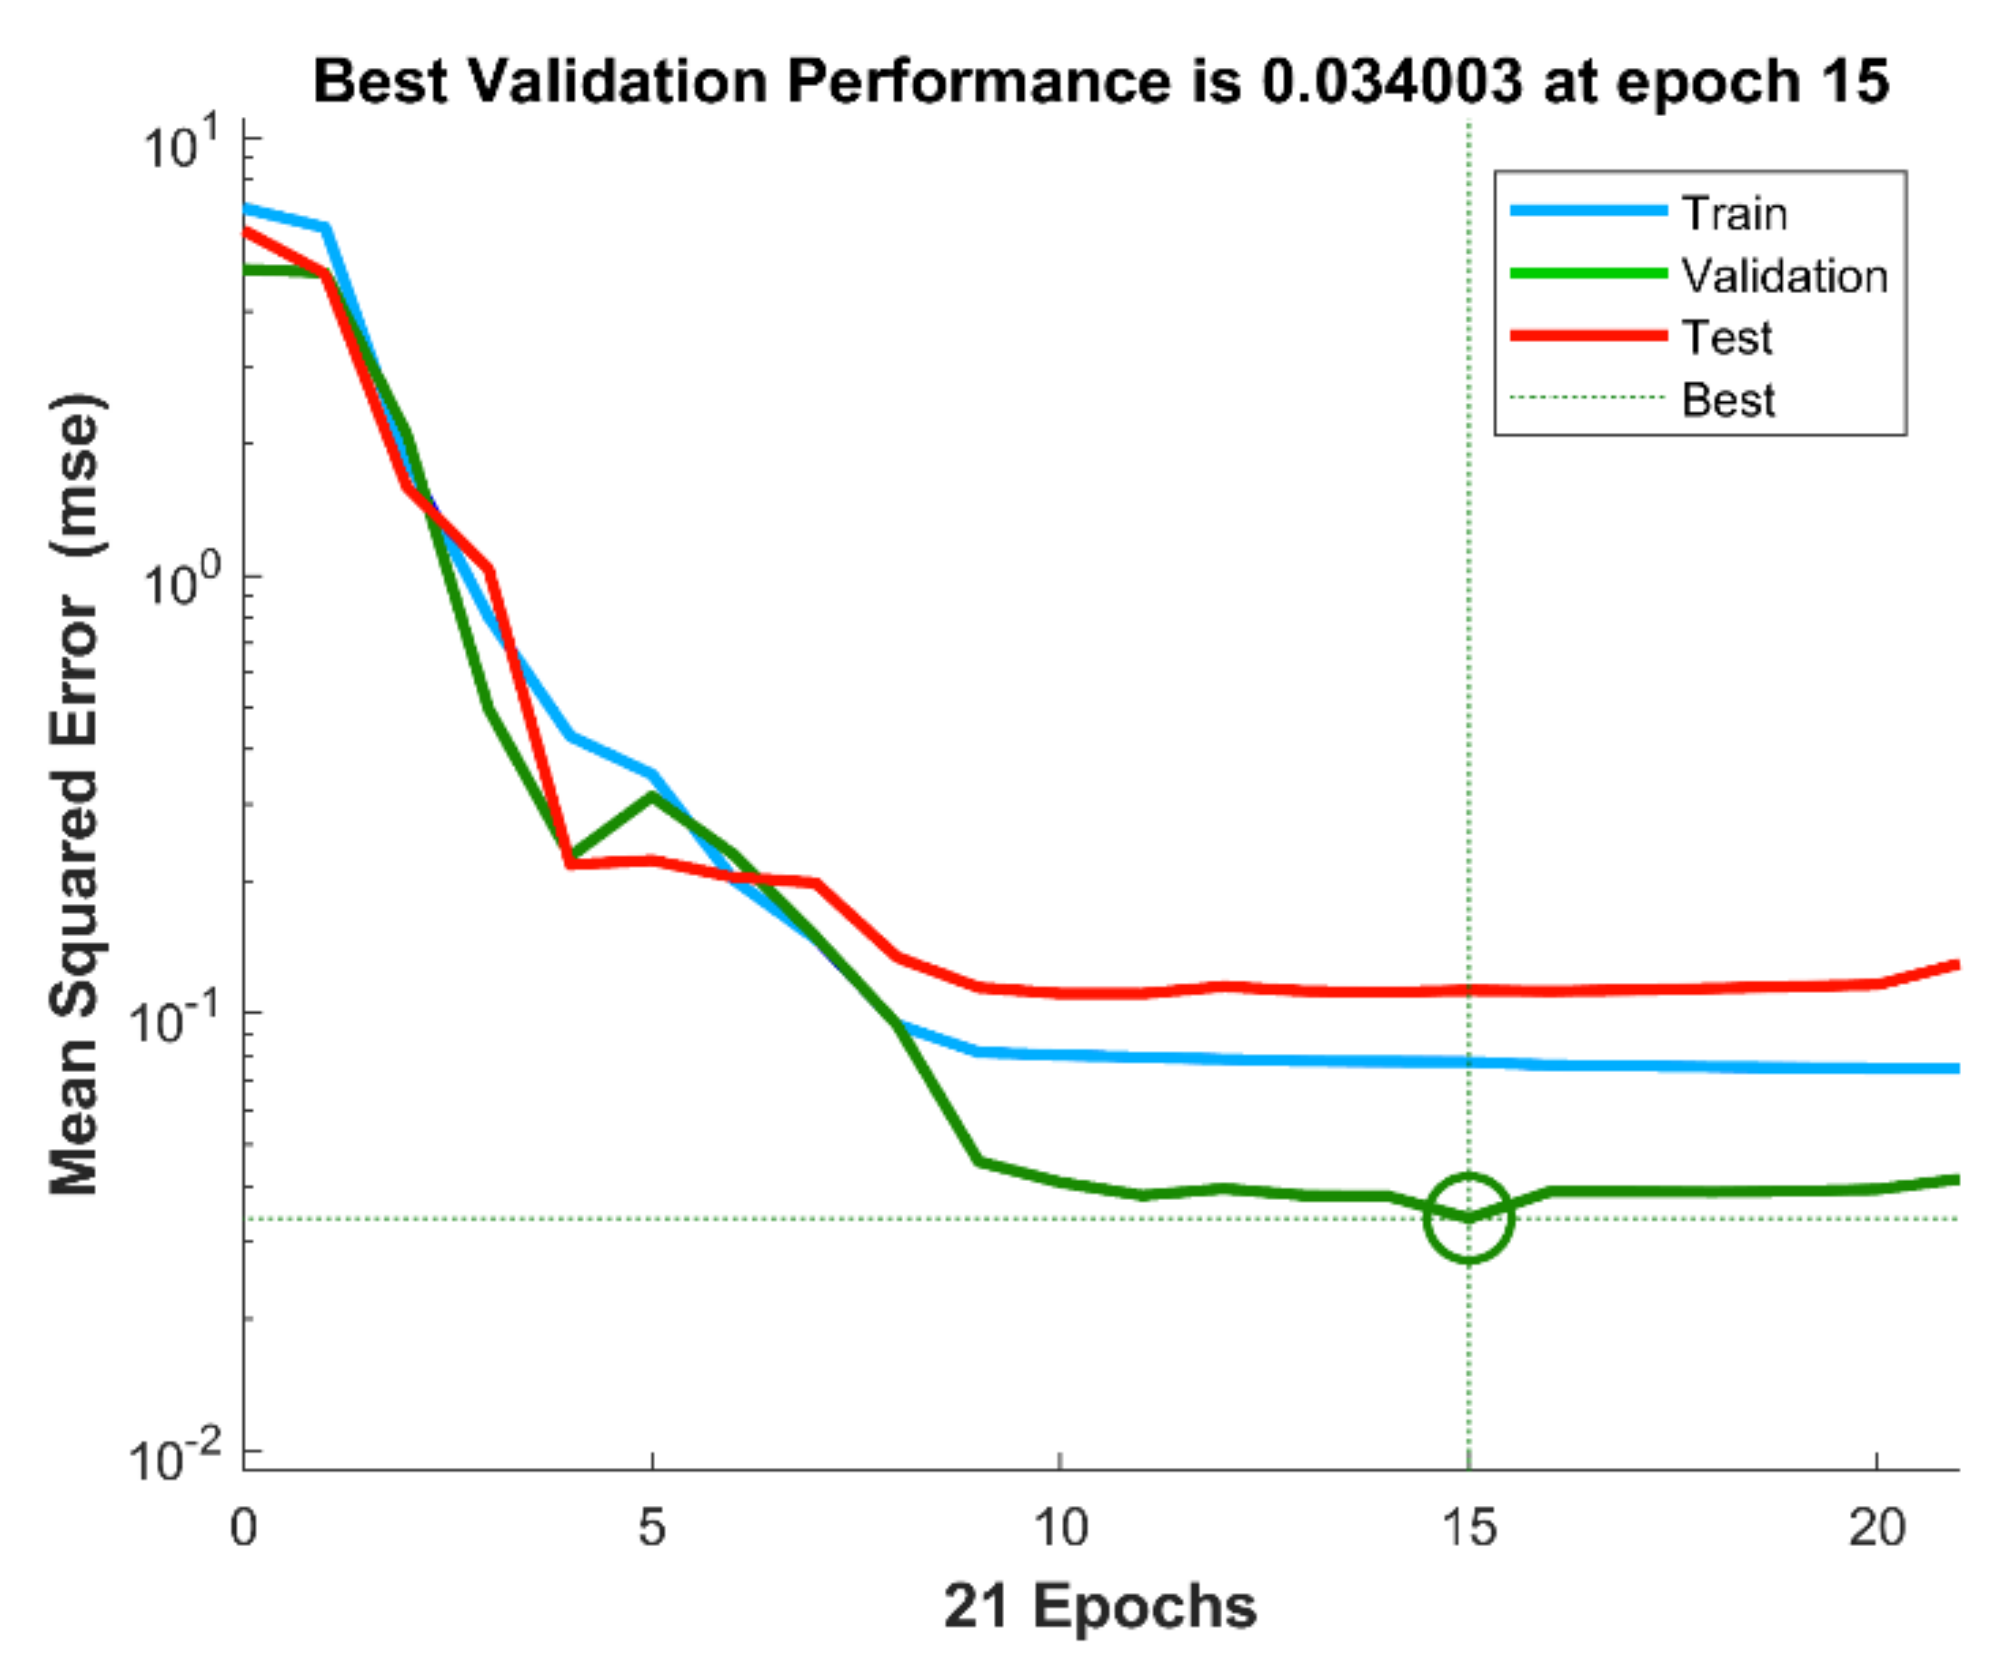
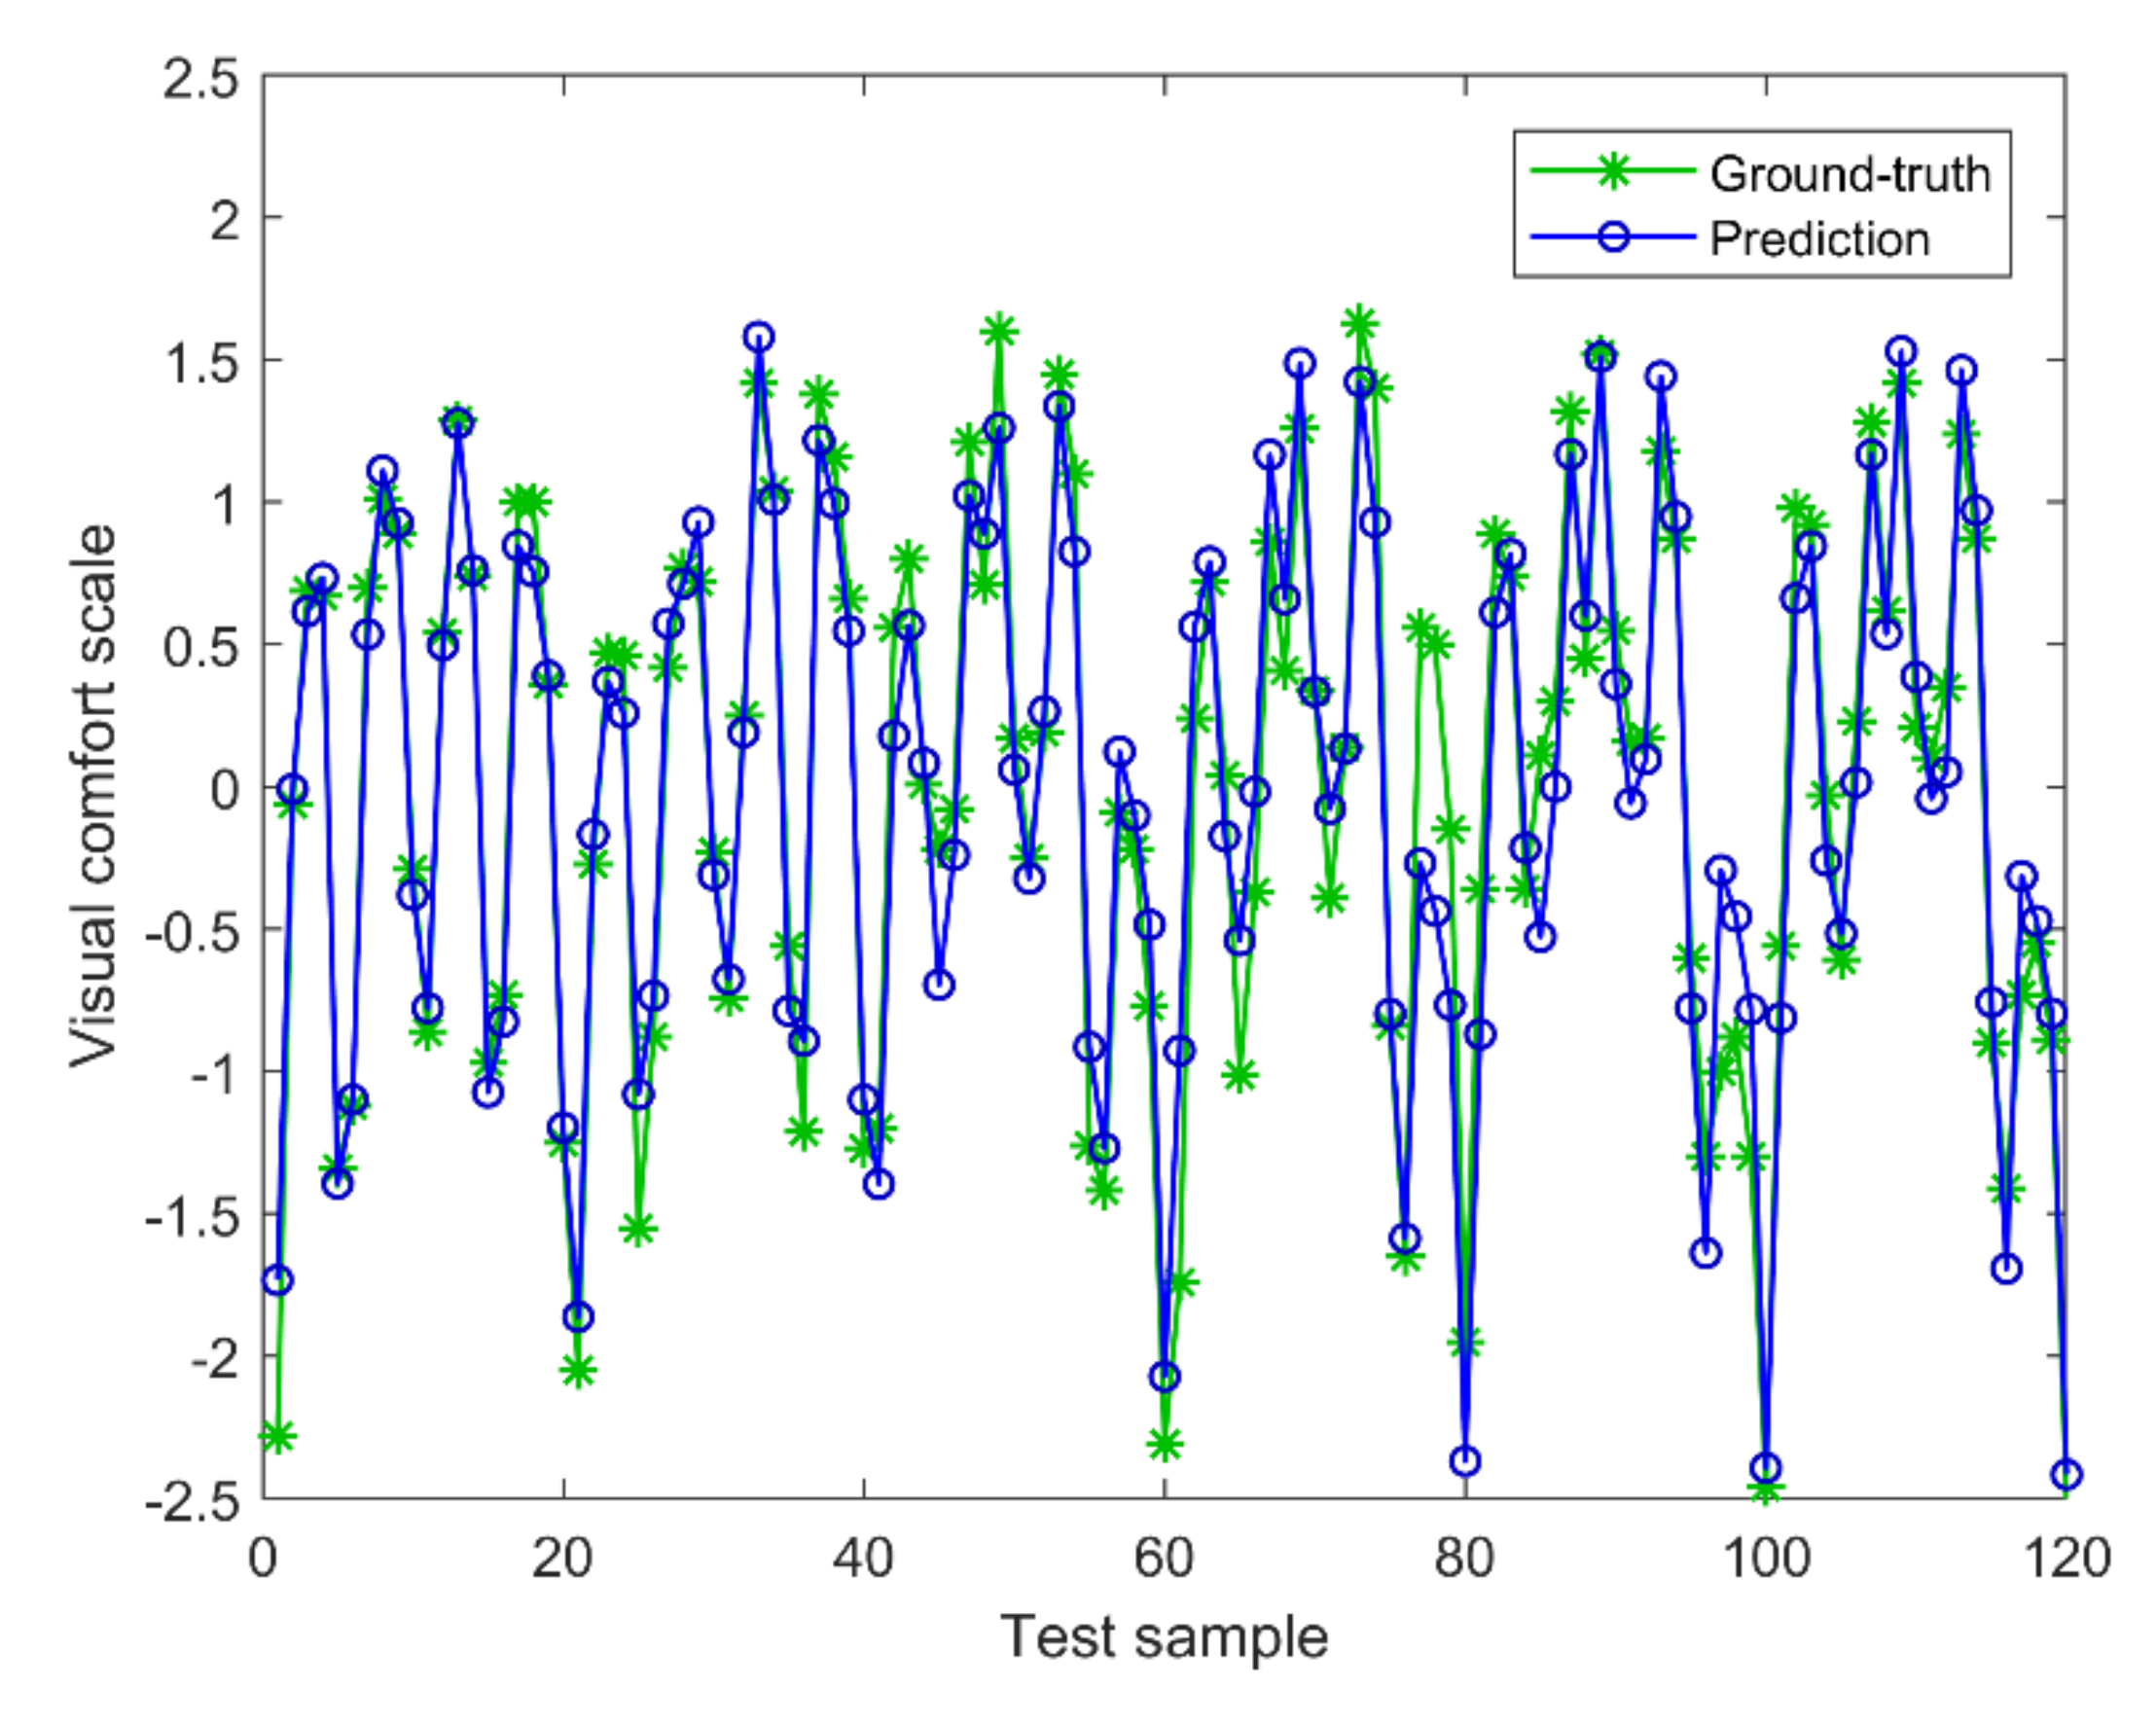
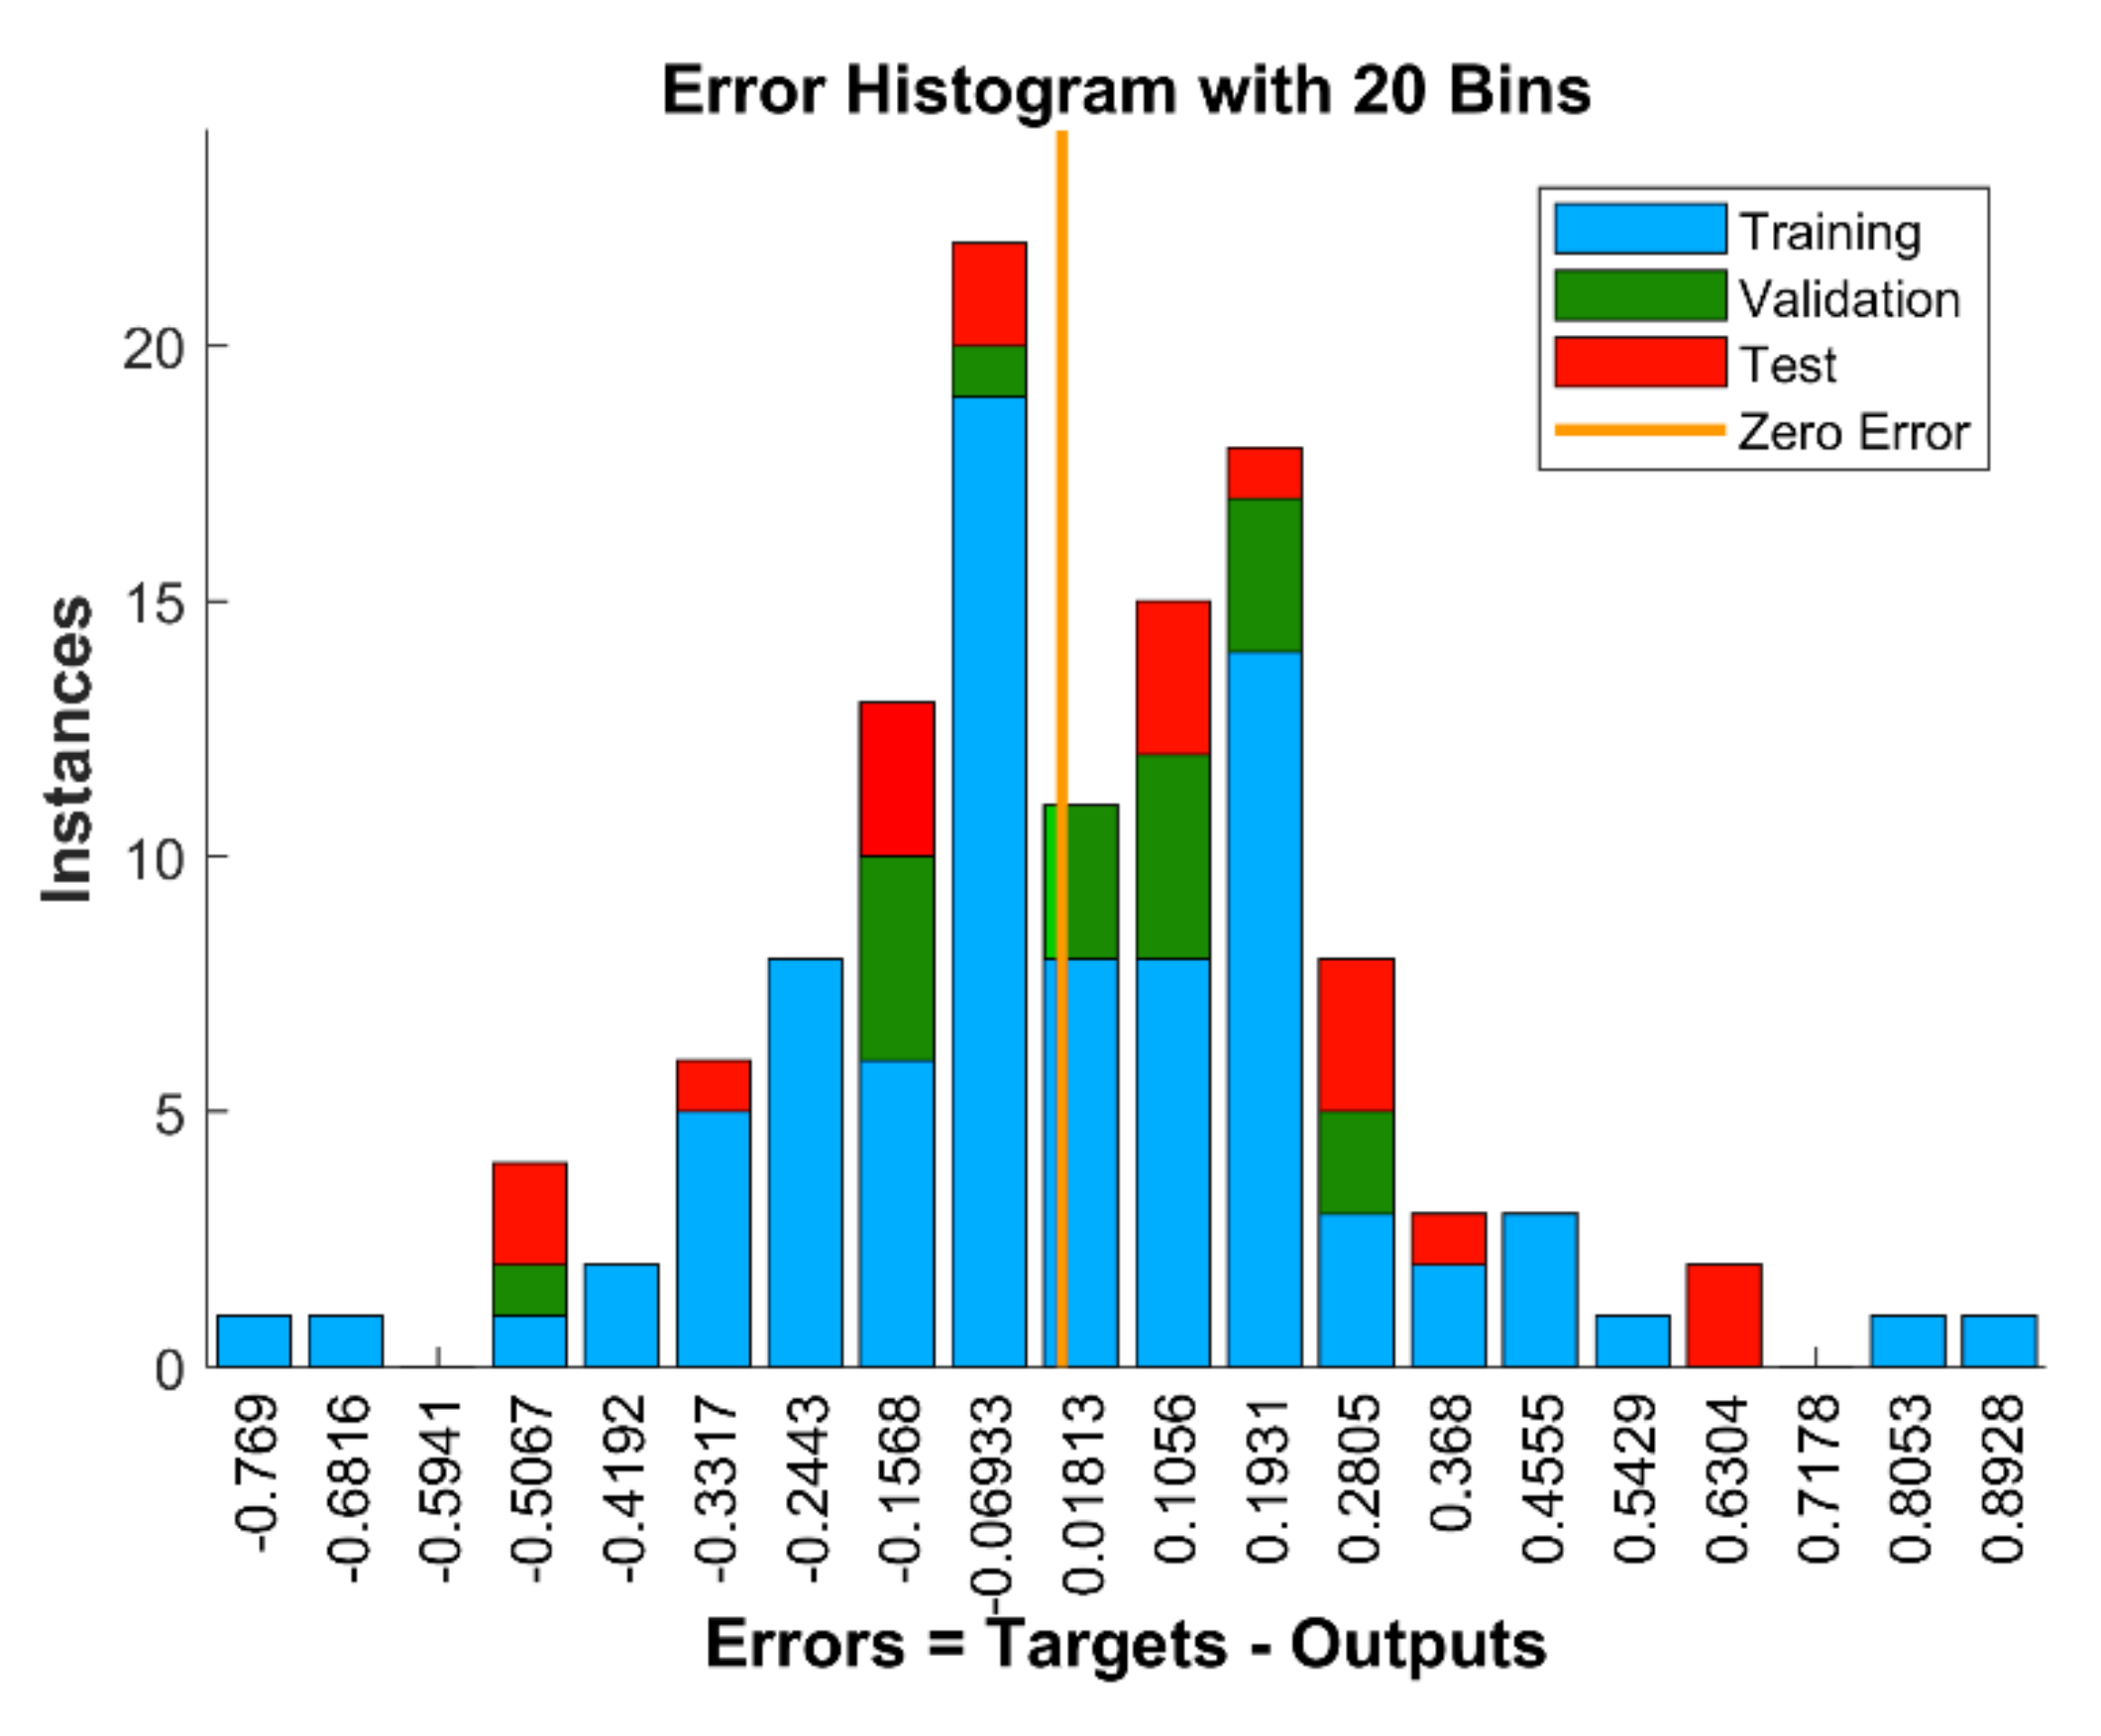
5.2. Model Evaluation
6. Conclusions
Author Contributions
Funding
Institutional Review Board Statement
Informed Consent Statement
Data Availability Statement
Conflicts of Interest
References
- Lin, Y.-T.; Hwang, S.-L.; Jeng, S.-C.; Koubek, R.J. Minimum ambient illumination requirement for legible electronic-paper display. Displays 2011, 32, 8–16. [Google Scholar] [CrossRef]
- Lin, Y.-T.; Lin, P.-H.; Hwang, S.-L.; Jeng, S.-C.; Liao, C.-C. Investigation of legibility and visual fatigue for simulated flexible electronic paper under various surface treatments and ambient illumination conditions. Appl. Ergon. 2009, 40, 922–928. [Google Scholar] [CrossRef]
- Shen, I.-H.; Shieh, K.-K.; Chao, C.-Y.; Lee, D.-S. Lighting, font style, and polarity on visual performance and visual fatigue with electronic paper displays. Displays 2009, 30, 53–58. [Google Scholar] [CrossRef]
- Lin, P.-H.; Lin, Y.-T.; Hwang, S.-L.; Jeng, S.-C.; Liao, C.-C. Effects of anti-glare surface treatment, ambient illumination and bending curvature on legibility and visual fatigue of electronic papers. Displays 2008, 29, 25–32. [Google Scholar] [CrossRef]
- Lin, Y.-T.; Lin, P.-H.; Hwang, S.-L.; Jeng, S.-C.; Lin, Y.-R. Ergonomic evaluation of electronic paper: Influences of anti-reflection surface treatment, illumination, and curvature on legibility and visual fatigue. J. Soc. Inf. Disp. 2008, 16, 91–99. [Google Scholar] [CrossRef]
- Bangor, A.W. Display Technology and Ambient Illumination Influences on Visual Fatigue at VDT Workstations. Ph.D. Thesis, Virginia Polytechnic Institute and State University, Blacksburg, VA, USA, 2000. [Google Scholar]
- Zhong, X.; Tu, Y.; Wang, B.; Jin, K.; Wang, Y.; Teunissen, K. P-142: Influence of Illumination Level on Visual Fatigue and Lighting Preference for Different Age Groups in China. SID Symp. Dig. Tech. Pap. 2017, 48, 1808–1811. [Google Scholar] [CrossRef]
- Lin, C.-C.; Huang, K.-C. Effects of ambient illumination conditions and background color on visual performance with TFT-LCD screens. Displays 2013, 34, 276–282. [Google Scholar] [CrossRef]
- Lin, C.-C.; Kuo-Chen, H. Effects of lighting color, illumination intensity, and text color on visual performance. Appl. Sci. Eng. 2014, 12, 193–202. [Google Scholar]
- Ram, M.S.; Bhardwaj, R. Effect of Different Illumination Sources on Reading and Visual Performance. J. Ophthalmic Vis. Res. 2018, 13, 44–49. [Google Scholar] [CrossRef] [Green Version]
- Lin, C.-C. Effects of contrast ratio and text color on visual performance with TFT-LCD. Int. J. Ind. Ergon. 2003, 31, 65–72. [Google Scholar] [CrossRef]
- Lin, C.-C.; Huang, K.-C. Effects of Color Combination and Ambient Illumination on Visual Perception Time with TFT-LCD. Percept. Mot. Ski. 2009, 109, 607–625. [Google Scholar] [CrossRef] [Green Version]
- Hessling, M.; Koelbl, P.S.; Lingenfelder, C. LED Illumination—A Hazard to the Eye? The increasing application of LEDs for lighting fosters fear of health consequences, which can be well assessed by comparing light sources. Opt. Photonik 2018, 13, 40–44. [Google Scholar] [CrossRef] [Green Version]
- Tsubota, K.; Toda, I.; Nakamori, K. Poor illumination, VDTs, and desiccated eyes. Lancet 1996, 347, 768–769. [Google Scholar] [CrossRef]
- Na, N.; Suk, H.-J. Adaptive display luminance for viewing smartphones under low illuminance. Opt. Express 2015, 23, 16912–16920. [Google Scholar] [CrossRef]
- Na, N.; Suk, H.-J. Adaptive luminance contrast for enhancing reading performance and visual comfort on smartphone displays. Opt. Eng. 2014, 53, 113102. [Google Scholar] [CrossRef] [Green Version]
- Na, N.; Choi, K.; Suk, H.-J. Adaptive luminance difference between text and background for comfortable reading on a smartphone. Int. J. Ind. Ergon. 2016, 51, 68–72. [Google Scholar] [CrossRef]
- Yu, H.; Akita, T.; Koga, T.; Sano, N. Effect of character contrast ratio of tablet PC and ambient device luminance ratio on readability in low ambient illuminance. Displays 2018, 52, 46–54. [Google Scholar] [CrossRef]
- Kojima, T.; Sano, S.; Ishio, N.; Koizuka, T.; Miyao, M. Verification of the Minimum Illuminance for Comfortable Reading of an E-Paper. In Proceedings of the Transactions on Petri Nets and Other Models of Concurrency XV; Springer Science and Business Media LLC: Berlin/Heidelberg, Germany, 2013; Volume 8011, pp. 348–355. [Google Scholar]
- Chen, J.G.; Wu, S.K.; Chiu, H.P.; Tu, C.N.; Liu, C.H. Evaluation of Three Tablet Computers at Two Levels of Ambient Illumination. Int. J. Hum.-Comput. Interact. 2016, 32, 394–401. [Google Scholar] [CrossRef]
- Kim, M.; Jeon, D.-H.; Kim, J.-S.; Yu, B.-C.; Park, Y.; Lee, S.-W. Optimum display luminance depends on white luminance under various ambient illuminance conditions. Opt. Eng. 2018, 57, 024106. [Google Scholar] [CrossRef]
- Lee, D.-S.; Ko, Y.-H.; Shen, I.-H.; Chao, C.-Y. Effect of light source, ambient illumination, character size and interline spacing on visual performance and visual fatigue with electronic paper displays. Displays 2011, 32, 1–7. [Google Scholar] [CrossRef]
- Shieh, K.-K.; Lin, C.-C. Effects of screen type, ambient illumination, and color combination on VDT visual performance and subjective preference. Int. J. Ind. Ergon. 2000, 26, 527–536. [Google Scholar] [CrossRef]
- Lin, C.-C.; Huang, K.-C. Effects of ambient illumination and screen luminance combination on character identification performance of desktop TFT-LCD monitors. Int. J. Ind. Ergon. 2006, 36, 211–218. [Google Scholar] [CrossRef]
- Chen, M.-T.; Lin, C.-C. Comparison of TFT-LCD and CRT on visual recognition and subjective preference. Int. J. Ind. Ergon. 2004, 34, 167–174. [Google Scholar] [CrossRef]
- Dobres, J.; Chahine, N.; Reimer, B. Effects of ambient illumination, contrast polarity, and letter size on text legibility under glance-like reading. Appl. Ergon. 2017, 60, 68–73. [Google Scholar] [CrossRef] [PubMed]
- Buchner, A.; Baumgartner, N. Text-background polarity affects performance irrespective of ambient illumination and colour contrast. Ergonomics 2007, 50, 1036–1063. [Google Scholar] [CrossRef] [PubMed]
- Huang, H.-P.; Wei, M.; Ou, L.-C. Effect of text-background lightness combination on visual comfort for reading on a tablet display under different surrounds. Color Res. Appl. 2019, 44, 54–64. [Google Scholar] [CrossRef] [Green Version]
- Huang, H.-P.; Ou, L.-C.; Yuan, Y. Effects of age and ambient illuminance on visual comfort for reading on a mobile device. Color Res. Appl. 2016, 42, 352–361. [Google Scholar] [CrossRef]
- Ou, L.-C.; Sun, P.-L.; Huang, H.-P.; Luo, M.R. Visual comfort as a function of lightness difference between text and background: A cross-age study using an LCD and a tablet computer. Color Res. Appl. 2015, 40, 125–134. [Google Scholar] [CrossRef]
- Thurstone, L.L. A law of comparative judgment. Psychol. Rev. 1994, 101, 266. [Google Scholar] [CrossRef]


| Illuminance (lx) | CCT (K) | CRI Ra | Duv |
|---|---|---|---|
| 150 | 6475 | 97 | +0.001 |
| 1500 | 6454 | 95 | −0.001 |
| 15000 | 6471 | 98 | −0.002 |
| Color | (R, G, B) | (x, y) | Luminance(cd/m2) | Lightness (L*) |
|---|---|---|---|---|
| Black | (6, 6, 0) | (0.295, 0.285) | 0.744 | 1.65 |
| Dark gray | (64, 64, 63) | (0.317, 0.329) | 18.2 | 25.14 |
| Medium gray | (118, 118, 118) | (0.314, 0.326) | 78 | 50.82 |
| Light gray | (182, 182, 185) | (0.314, 0.324) | 197 | 75.00 |
| White | (255, 255, 255) | (0.315, 0.326) | 408 | 100 |
| Illuminance (lx) | CCT (K) | CRI Ra | Duv |
|---|---|---|---|
| 150 | 6475 | 97 | 0.001 |
| 300 | 6547 | 95 | 0.0039 |
| 1500 | 6454 | 95 | −0.001 |
| 3000 | 6533 | 98 | 0.0041 |
| 15,000 | 6471 | 98 | −0.002 |
| Mean R2 ± SD | Mean RMSE ± SD | Mean MAE ± SD | |
|---|---|---|---|
| Visual Comfort | 0.882 ± 0.024 | 0.320 ± 0.028 | 0.232 ± 0.016 |
Publisher’s Note: MDPI stays neutral with regard to jurisdictional claims in published maps and institutional affiliations. |
© 2021 by the authors. Licensee MDPI, Basel, Switzerland. This article is an open access article distributed under the terms and conditions of the Creative Commons Attribution (CC BY) license (https://creativecommons.org/licenses/by/4.0/).
Share and Cite
Huang, H.-P.; Wei, M.; Li, H.-C.; Ou, L.-C. Visual Comfort of Tablet Devices under a Wide Range of Ambient Light Levels. Appl. Sci. 2021, 11, 8679. https://doi.org/10.3390/app11188679
Huang H-P, Wei M, Li H-C, Ou L-C. Visual Comfort of Tablet Devices under a Wide Range of Ambient Light Levels. Applied Sciences. 2021; 11(18):8679. https://doi.org/10.3390/app11188679
Chicago/Turabian StyleHuang, Hsin-Pou, Minchen Wei, Hung-Chung Li, and Li-Chen Ou. 2021. "Visual Comfort of Tablet Devices under a Wide Range of Ambient Light Levels" Applied Sciences 11, no. 18: 8679. https://doi.org/10.3390/app11188679
APA StyleHuang, H.-P., Wei, M., Li, H.-C., & Ou, L.-C. (2021). Visual Comfort of Tablet Devices under a Wide Range of Ambient Light Levels. Applied Sciences, 11(18), 8679. https://doi.org/10.3390/app11188679