Abstract
Several processing methods have been proposed for estimating the real pattern of the temporal location and spatial map of the lightning strikes. However, due to the complexity of lightning signals, providing accurate lightning maps estimation remains a challenging task. This paper presents a cross-correlation wavelet-domain-based particle swarm optimization (CCWD-PSO) technique for an accurate and robust representation of lightning mapping. The CCWD method provides an initial estimate of the lightning map, while the PSO attempts to optimize the trajectory of the lightning map by finding the optimal sliding window of the cross-correlation. The technique was further enhanced through the introduction of a novel lightning event extraction method that enables faster processing of the lightning mapping. The CCWD-PSO method was validated and verified using three narrow bipolar events (NBEs) flashes. The observed results demonstrate that this technique offers high accuracy in representing the real lightning mapping with low estimation errors.
1. Introduction
Accurate lightning mapping is a key step to real-time detection of lightning strikes. There has been a growing interest in understanding the process in which lightning propagates. Researchers often study lightning over a specific range of frequencies such as very high frequency (VHF). The lightning mapping is then performed using, magnetic direction finder, time of arrival, or interferometer (ITF) []. The ITF has been recognized as superior, compared to the other techniques, due to its capability of scanning more lightning events and performing continuous and quasi-continuous emission mapping from lightning pulses for enhanced 2D visualization [].
Several ITF-based techniques have been proposed to estimate the lightning maps [,,,,]. Some of these techniques implement phase difference of arrival (PDOA) for windowed signals arriving at each pair of ITF sensors, such as the work proposed by []. Others used the time difference of arrival (TDOA) and cross-correlation in both time and frequency domains [,,]. Similar to Stock [], the TDOA was used in [], with the implementation of wavelet-domain cross-correlation. Despite the major progress made in this field, there is still a need for further enhancement, especially in developing more robust techniques that are able to locate the lightning emissions and optimize the process of lightning mapping. These improvements include but are not limited to (1) automatic extraction of the exact lightning events from ITF signals; (2) in the preprocessing phase, particularly the noise filtering, it must be carefully designed so that the relevant lightning information is not destroyed and reserved for the next processing steps; (3) tuning of different parameters involved in the cross-correlation procedure such as the sliding window length. In this context, some optimization techniques have been shown to be successful in hyperparameter tuning.
Among these methods, particle swarm optimization (PSO) is a simple yet powerful optimization algorithm and has been applied to numerous applications in various fields of science and engineering, such as machine learning, image processing, data mining operation research, etc. [,,,,,,,,,,]. However, PSO has some characteristics that, in some sense and to a certain extent, have some similarity to those found in other population-based computational models, such as genetic algorithms (GAs) and other evolutionary computing techniques. A key underlying feature of the PSO algorithm is that it is a simple-to implement, powerful tool that has only a few parameters to be set. Additionally, it is effective in global search, and it is easily parallelized for concurrent processing. In fact, its simplicity and apparent competence in finding optimal solutions in complex search spaces led the PSO algorithm to become well known among the scientific community, which contributed to its study and improvement [].
Several studies have used optimization-based techniques in related lightning research. Hu et al. [] applied the PSO optimization method to find the optimum value of the lightning position and the occurrence time. Guo et al. [] proposed a two-step procedure that uses the PSO algorithm to optimize the lightning positions (i.e., 2D space). Alternatively, Fan et al. [] proposed a PSO-based technique to optimize the reconstruction process of the return stroke current waveform. For the cross-correlation-based methods, the selection of appropriate sliding widow length could influence the performance of the lightning mapping system. However, the optimal window length for lightning has not been explored. In this paper, we proposed a cross-correlation wavelet-domain-based particle swarm optimization (CCWD-PSO) technique to improve the performance of lightning mapping. Additionally, we proposed a lightning-event extraction method, which reduces the overall computational cost of the lightning mapping process. The proposed model was evaluated with a PSO algorithm under three different narrow bipolar event NBEs. The CCWD-PSO technique features high accuracy, high convergence speed, and strong robustness in performance.
The rest of the paper is organized as follows: Section 2 gives a brief overview of the related work. Section 3 discusses the methodology followed for lightning mapping optimization. Section 4 presents the results and discussion of the proposed methods. Finally, the achievements of the proposed method are highlighted in the conclusion.
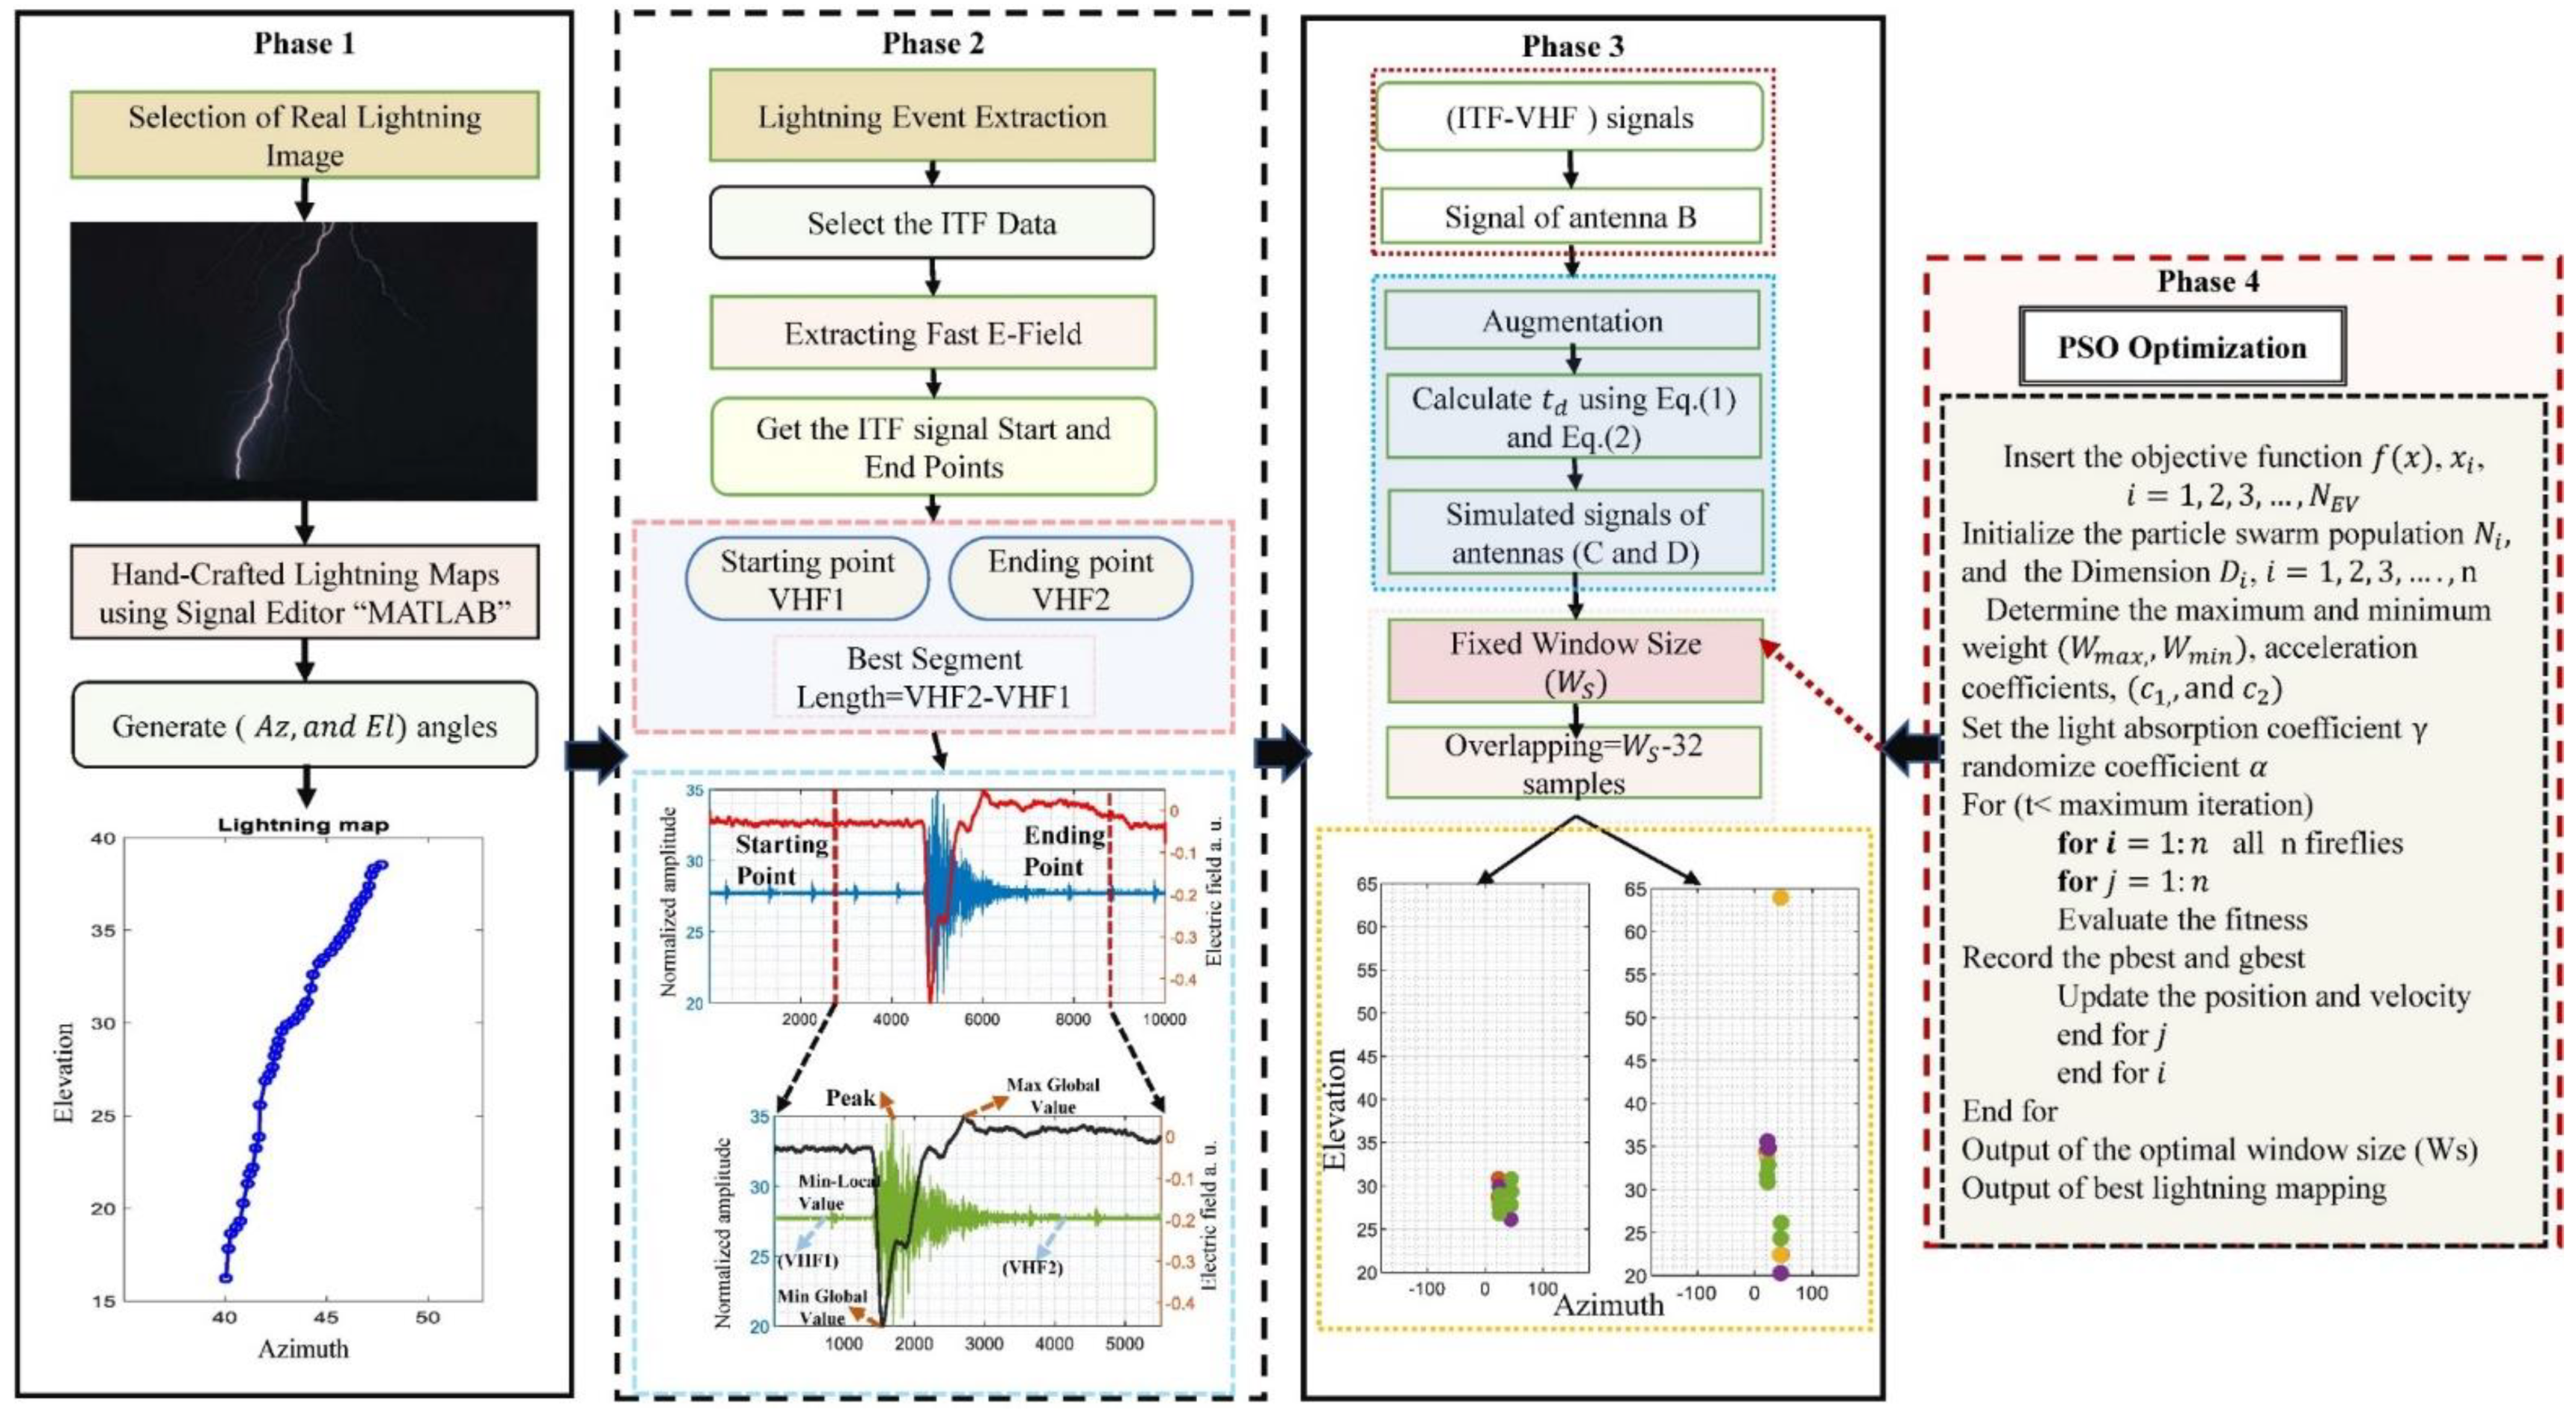
2. Materials and Methods
Figure 1 shows the structure diagram of the proposed lightning mapping optimization using the PSO algorithm. The PSO algorithm was utilized to iteratively find the optimal best combination of lightning mapping hyperparameters. The algorithm was used to give a reliable estimation of lightning mapping with high accuracy of localization and to produce the best fitness values using the corresponding objective function. The general procedure of the proposed lightning mapping is divided into four phases, which are summarized as follows:
Figure 1.
The general structure of the proposed framework for ITF lightning maps optimization, based on PSO algorithm.
Phase 1: This phase began by collecting a real lightning image. Signal editor toolbox (MATLAB 8.0 and Statistics Toolbox 8.1, The MathWorks, Inc., Natick, MA, USA) was used to draw the Cartesian coordinates of a real lightning map (azimuth and elevation) angles. The generated lightning map was used as the reference lightning signal for optimization.
Phase 2: This phase introduced the proposed lightning event extraction approach. The main aim was to automatically extract the fast-electric field of the fast antenna (FA) with respect to the ITF data (VHF signals). The return strokes of the fast-electric field varied depending on the recorded ITF signals. Additionally, the shape of the return strokes in ITF signals could either be in a wide or narrow range. Identifying the starting and ending points of the VHF signal (lightning event) is considered a crucial step in the subsequent lightning event analysis instead of using a conventional human visual inspection. Adopting and applying more ITF signals in any sophisticated algorithm is a challenging task. In this regard, a novel lightning event extraction technique is proposed to ensure the effectiveness level of extracting the fast-electric field and VHF signal. The method uses an iterative windowed procedure, as detailed in Figure 2. We used the fast-electric field signal as a reference to search for the onset and offset of the lightning event.
Figure 2.
The lightning event extraction algorithm.
Phase 3 and Phase 4: These phases involved lightning data simulations and mapping optimization procedures.
2.1. Database
Simulations: The simulation was conducted to assess the performance of the proposed mapping using a simulated (ITF-VHF) signal. The details of lightning maps simulation are provided in our previous study []. An actual measured signal (from antenna B was used as a reference to simulate the other perpendicular antennae (C and D). The antennas C and D were copied of antenna B, with phase shift for each temporal sliding window. However, the handcrafted simulated lightning mapping relied on a fixed window size value, which affected the estimation of real lightning mapping. The PSO optimization was proposed for tuning the window size ().
Real lightning measurements: The data were collected using an ITF system [], consisting of three sets of antennas, with a 15 m spaced two perpendicular baseline. The broadband ITF system was installed in Klebang Beach, Malacca Strait, Melaka, Malaysia (2.216304° N, 102.192288° E). Three samples of NBEs lightning flashes were collected for this study. The first NBE1 discharge occurred as the storm intensified on 4 December 2017, UTC+8 03:01:42. The second NBE2-initiated flash occurred sequentially with the NBE1 as the storm intensified, on 4 December 2017, UTC+8 03:21:13. The third NBE3 discharge occurred on 13 December 2017, UTC+8 05:08:16.
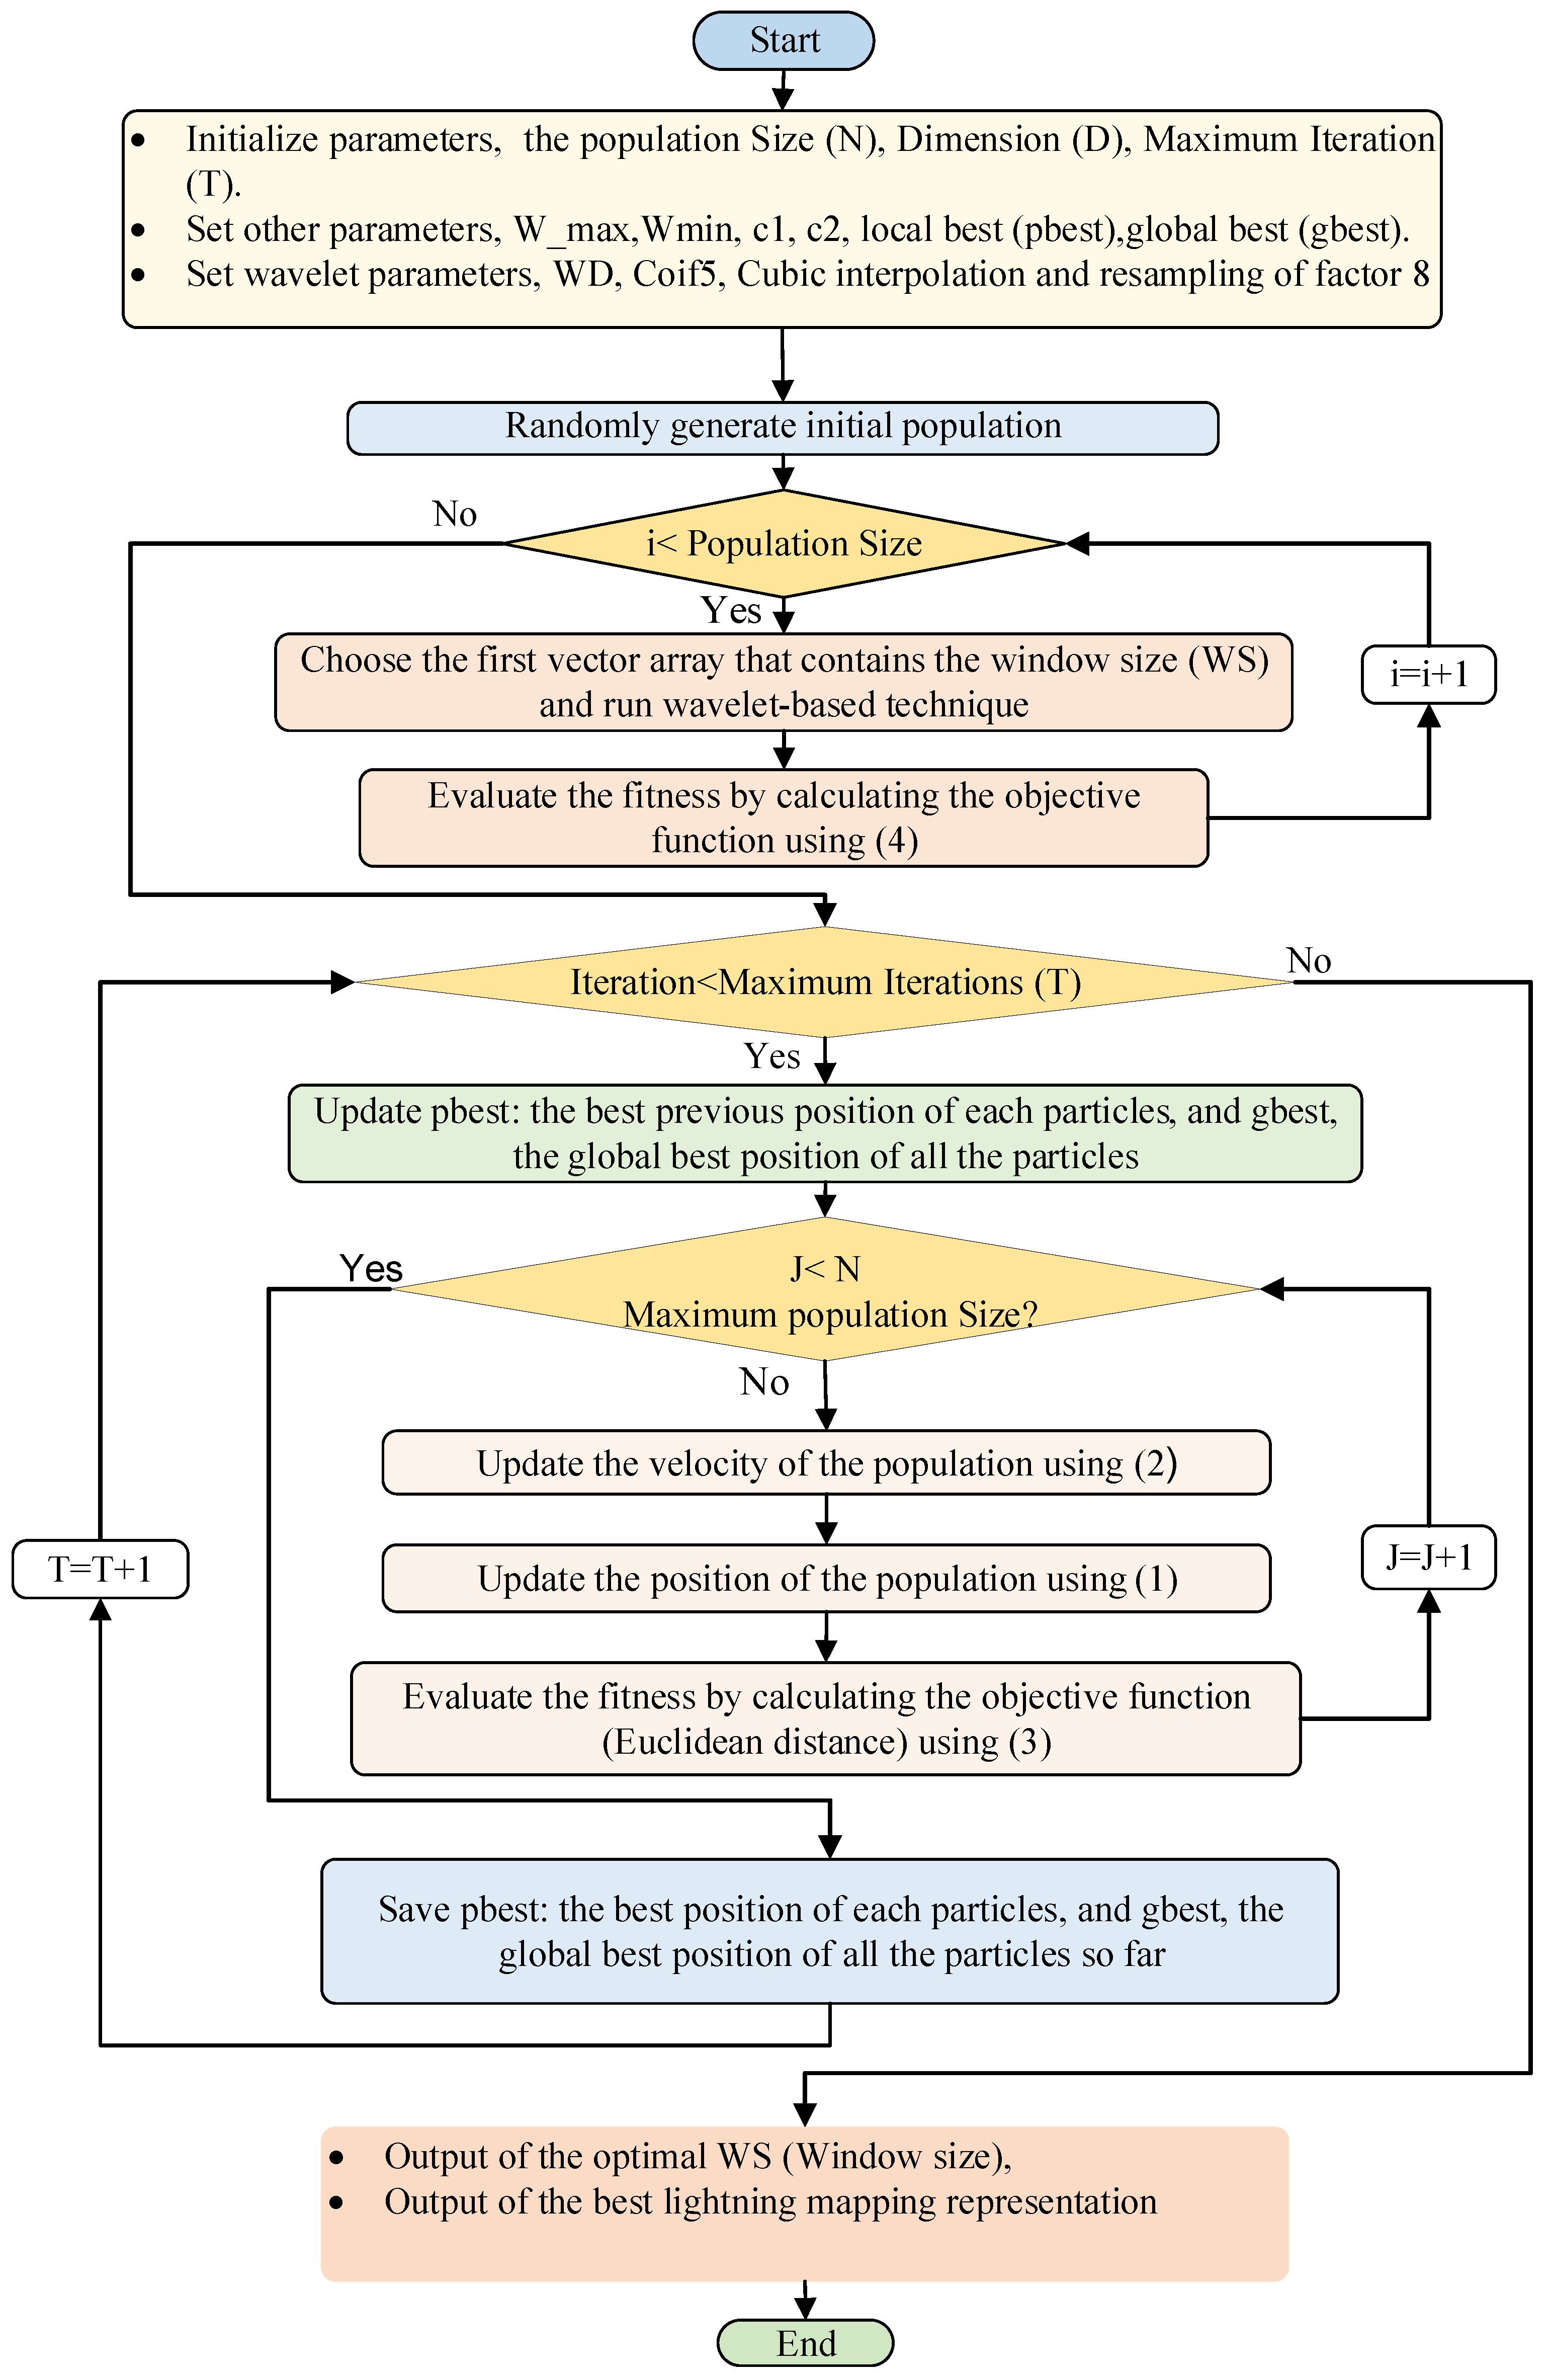
2.2. Lightning Mapping Optimization
The conventional approach to validate a lightning map is through the use of a high-speed camera [,,,]. To mitigate the dependency of the high-speed camera method for authenticating the real pattern of lightning mapping, the initial lightning maps were found by the proposed approach as shown in phase 3 (see Figure 1). The lightning maps were obtained by calculating the time-of-arrival delays using sequential sliding windows and Wavelet cross-correlation techniques. The PSO optimization utilized these initial estimates (referring to the actual lightning maps as produced by the CCWD method) to minimize the estimation errors by tuning some hyperparameters (i.e., sliding window size) that directly alter the estimation of the initial maps. Hence, in order to perform the PSO optimization, the window size () was adopted as a decision variable (refer to Section 3.1: Simulations).
Figure 3 shows the flowchart of the proposed PSO-algorithm-based wavelet technique. The implementation of wavelet technique based on PSO steps are described as follows: (1) PSO initialization: set the PSO initial parameters and the wavelet-based technique; (2) generate initial population: select the first vector array of randomized window size (); (3) fitness evaluation: evaluate the fitness value of each particle using objective function equation (Equation (3)); (4) compute the maximum iteration and update individual and global best data: local best value (Pbest) is calculated and compared with the existing global best value (Gbest); if the fitness value is minimized, then update local best as the new global best value; (5) update velocity and positioning of each population: the velocity and position of each population in the swarm are updated using Equations (1) and (2); (6) repeat steps from (3) to (5).
Figure 3.
Flowchart of lightning mapping procedures using PSO-based algorithm.
In the PSO algorithm, every solution of a given problem is considered as a particle, which is able to move at arbitrary velocity across a dimensional search space to find two locations. In order to update the position of each particle, two factors are considered—the position factor and the velocity factor. The position factor shows the position of the particle in the search space, whereas the velocity indicates the direction and intensity of movement. We followed [] to update the two factors of position and velocity in each iteration using Equations (1) and (2).
where the velocity multiplied by a variable as the first component called inertia weight factor, inertia weight normally decrease linearly from 0.9 to 0.4 to maintain the movement direction. The second component is called the cognitive component because each particle is considered the distance between its personal best and current location. The third component, however, is called the social component because the particle calculates the distance between its current position and the best position found by the entire swarm. It is worth mentioning that for the variable in the social component, there is no subscript because there is only one best solution in the swarm for all particles. and represent the two learning acceleration factors with a limited range of . The impact of the cognitive–social components and the movement of the particle can be changed by tuning these two acceleration factors. Meanwhile, and generates a uniform distribution of two random functions in the interval (0, 1), used to increase the randomness searching for each particle in a single iteration, and is the velocity factor of the agent at iteration .
2.3. Objective Function
The performance of lightning mapping estimation was measured by tuning the window size () of the analyzed ITF lightning signal. As shown in Figure 1 (Phase 1), each pair of the incident angles azimuth and elevation (Az-El) were estimated relative to the ground-truth simulated lightning mapping (as in Figure 1—phase 3). To effectively reduce the estimation error of ITF lightning signal and ground-truth simulated lightning mapping, a suitable objective function of the proposed PSO-based optimization algorithm was formulated by minimizing the Euclidean distance function . This can be achieved by tuning decision variable (windows size ())
where is represented by the Euclidean distance
where is the total number of sliding windows referred to the in the processed lightning data. and are the handcrafted azimuth and elevation incident angles, and and are the optimized incident angles by the PSO algorithm.
2.4. Optimization Constraints and PSO Parameters
The performance of the PSO-based algorithm is affected by how to arrange the searching process. In the optimization process, the determination of the parameters that are used in the objective function should satisfy and meet the problem constraints. The two main constraints include the upper and lower window size values. These constraints are limited to = 100 and = 512, respectively. The inequality constraint is the constraint considered in the PSO optimization problem, which represents the best solution and best fitness of the extracted lightning mapping. Furthermore, PSO-based algorithm usually influenced by a number of control parameters—namely, the dimension of the problem (D), number of particles, acceleration coefficients , inertia weight (, number of iterations (, population size, and random values. The population size is set to ( = 10, the demission is set to D = 1. The lower and upper of the dynamic inertia weight are set as and . The study iteratively executed the PSO algorithm several times and computed the optimal values of the objective functions and window size at each iteration. The performance of the proposed PSO-based algorithm was evaluated using the experimental simulated results of four aspects iterations and the iterative curve.
3. Results and Discussions
3.1. Optimal Selection of PSO Parameters Using Simulated Data
The proposed PSO was applied to four sets of iterations: 100, 200, 300, and 500. To ensure that the comparisons are fair, the population size for all optimization iterations was set to 10. The compared optimization iterations had several parameters settings, as listed in Table 1. To determine the reliability, strength, and efficiency of PSO in obtaining the global minimum value of the four iterations, the objective function was found by averaging the Euclidean distance of the simulated and estimated lightning map. Each iteration set was tested 20 times. The results that represent the best objective function are indicated in Table 2. In each optimization iteration, the window size for each simulated lightning signal was tuned, and the optimal value (fitness value) was calculated. The number of PSO iterations varied from one problem to another depending on the data being processed. In order to observe its influence on the performance of the PSO-based searching algorithm, this study selected a maximum iteration number of 500 since the performance was not improved beyond this number. Selecting a suitable iteration number can help to extend the search behavior to find the best global minimum and search for the best position.
Table 1.
Parameters of the IPSO-WT based techniques.
Table 2.
The performance of CCWD-PSO technique in terms of Euclidean distance. The comparison involves several cross-correlation-related parameters. The sampling parameter indicates the interpolation ratio of the cross-correlation output signal. Two interpolation methods were used, i.e., linear and cubic.
The best result for each iteration set is written in boldface in Table 2. Extending the search behavior by increasing the number of iterations up to 500 showed no significant change in minimizing the fitness value. From Table 2, the PSO reaches the best global minimum value at 100, 300, and 500 iterations with 0.6243, whereas the iteration at 200 reaches a near-global minimum value of 0.6328. The performance of PSO with 300 iterations is comparatively satisfactory in most of the tested optimization iterations. To illustrate this, Figure 4 depicts the PSO-convergence performance curves for lightning mapping estimation. The best optimal fitness value of the proposed algorithm is the one that exists at the lowest convergence time, which is achieved at optimization with 300 iterations. Hence, the optimization with 300 iterations was chosen for accurately estimating the lightning maps.
Figure 4.
PSO performance for estimating lightning maps. (a) The PSO-convergence curves as a function of number of iterations and fitness value. (b) An expanded view of (a).
With a given captured lightning signal of antenna B, the signals of antennas C and D were simulated. The generated incident angles (Az and El) from the handcrafted lightning signals were assumed to be real positive and negative values. Figure 5 shows the simulated constructed lightning map using the PSO optimization algorithm, which occurred at 300 iterations. Figure 5a shows the constructed map of a lightning source location (Az and El angles). Meanwhile, Figure 5b shows the expanded view of the lightning maps. The point source was positioned at azimuth angles in the range of 40° to 50° and elevation angles of between 18° and 40°. Using the PSO algorithm, the elevation shape and the height of the channel of the simulated lightning map, shown in black, presented certain consistency with the handcrafted lightning map, shown in red.
Figure 5.
PSO algorithm: (a) simulated lightning map plotted in elevation vs. azimuth; (b) expanded view of the simulated lightning maps of (a).
Furthermore, the regression coefficient () was used as an indicator of the predictive model’s training process performance of the elevation and azimuth angles. The estimated lightning map is displayed in black circle, while the blue line represents the reference value (actual target). The regression coefficient results of both elevation and azimuth angles are very close to unity, which validates the accuracy of estimated constructed lightning maps based on the proposed PSO algorithm. Figure 6 illustrates the regression values of the elevation and azimuth angles at 300 iterations are limited to and . Through the regression classifications, the accuracy of estimating lightning maps using a PSO algorithm provides a measure of the variable through computing importance scores as a training model. Moreover, Figure 7 shows that the elevation and azimuth angle at 200 iterations having more regression coefficients of and , respectively.
Figure 6.
Regression performance for estimating lightning map at 100 iterations: (a) elevation regression line; (b) azimuth regression line.
Figure 7.
Lightning mapping regression performance at 200 iterations: (a) elevation regression performance; (b) azimuth regression performance.
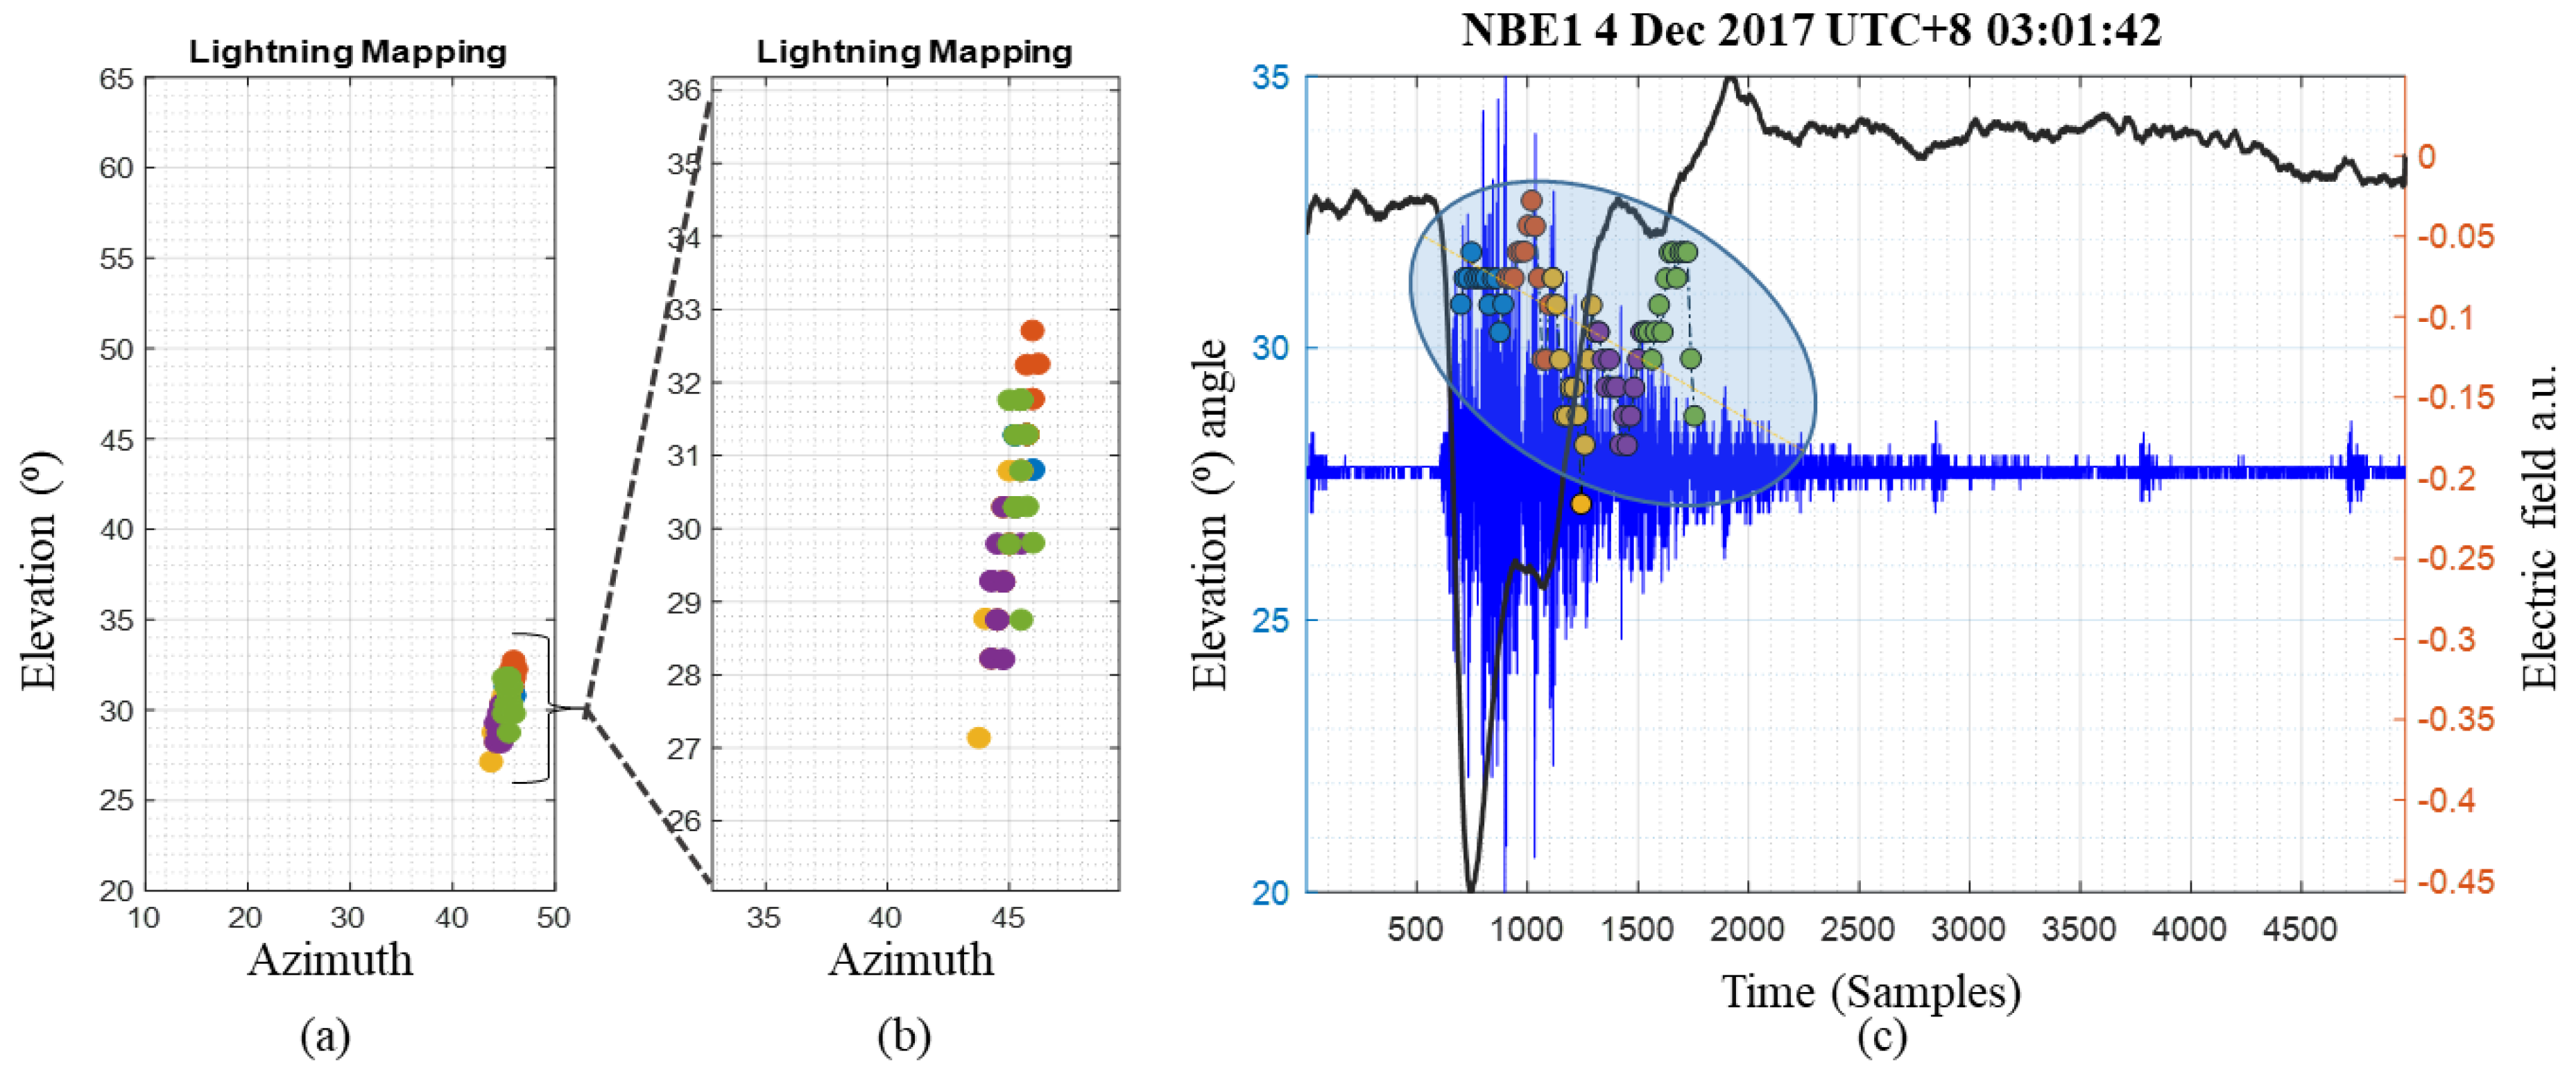
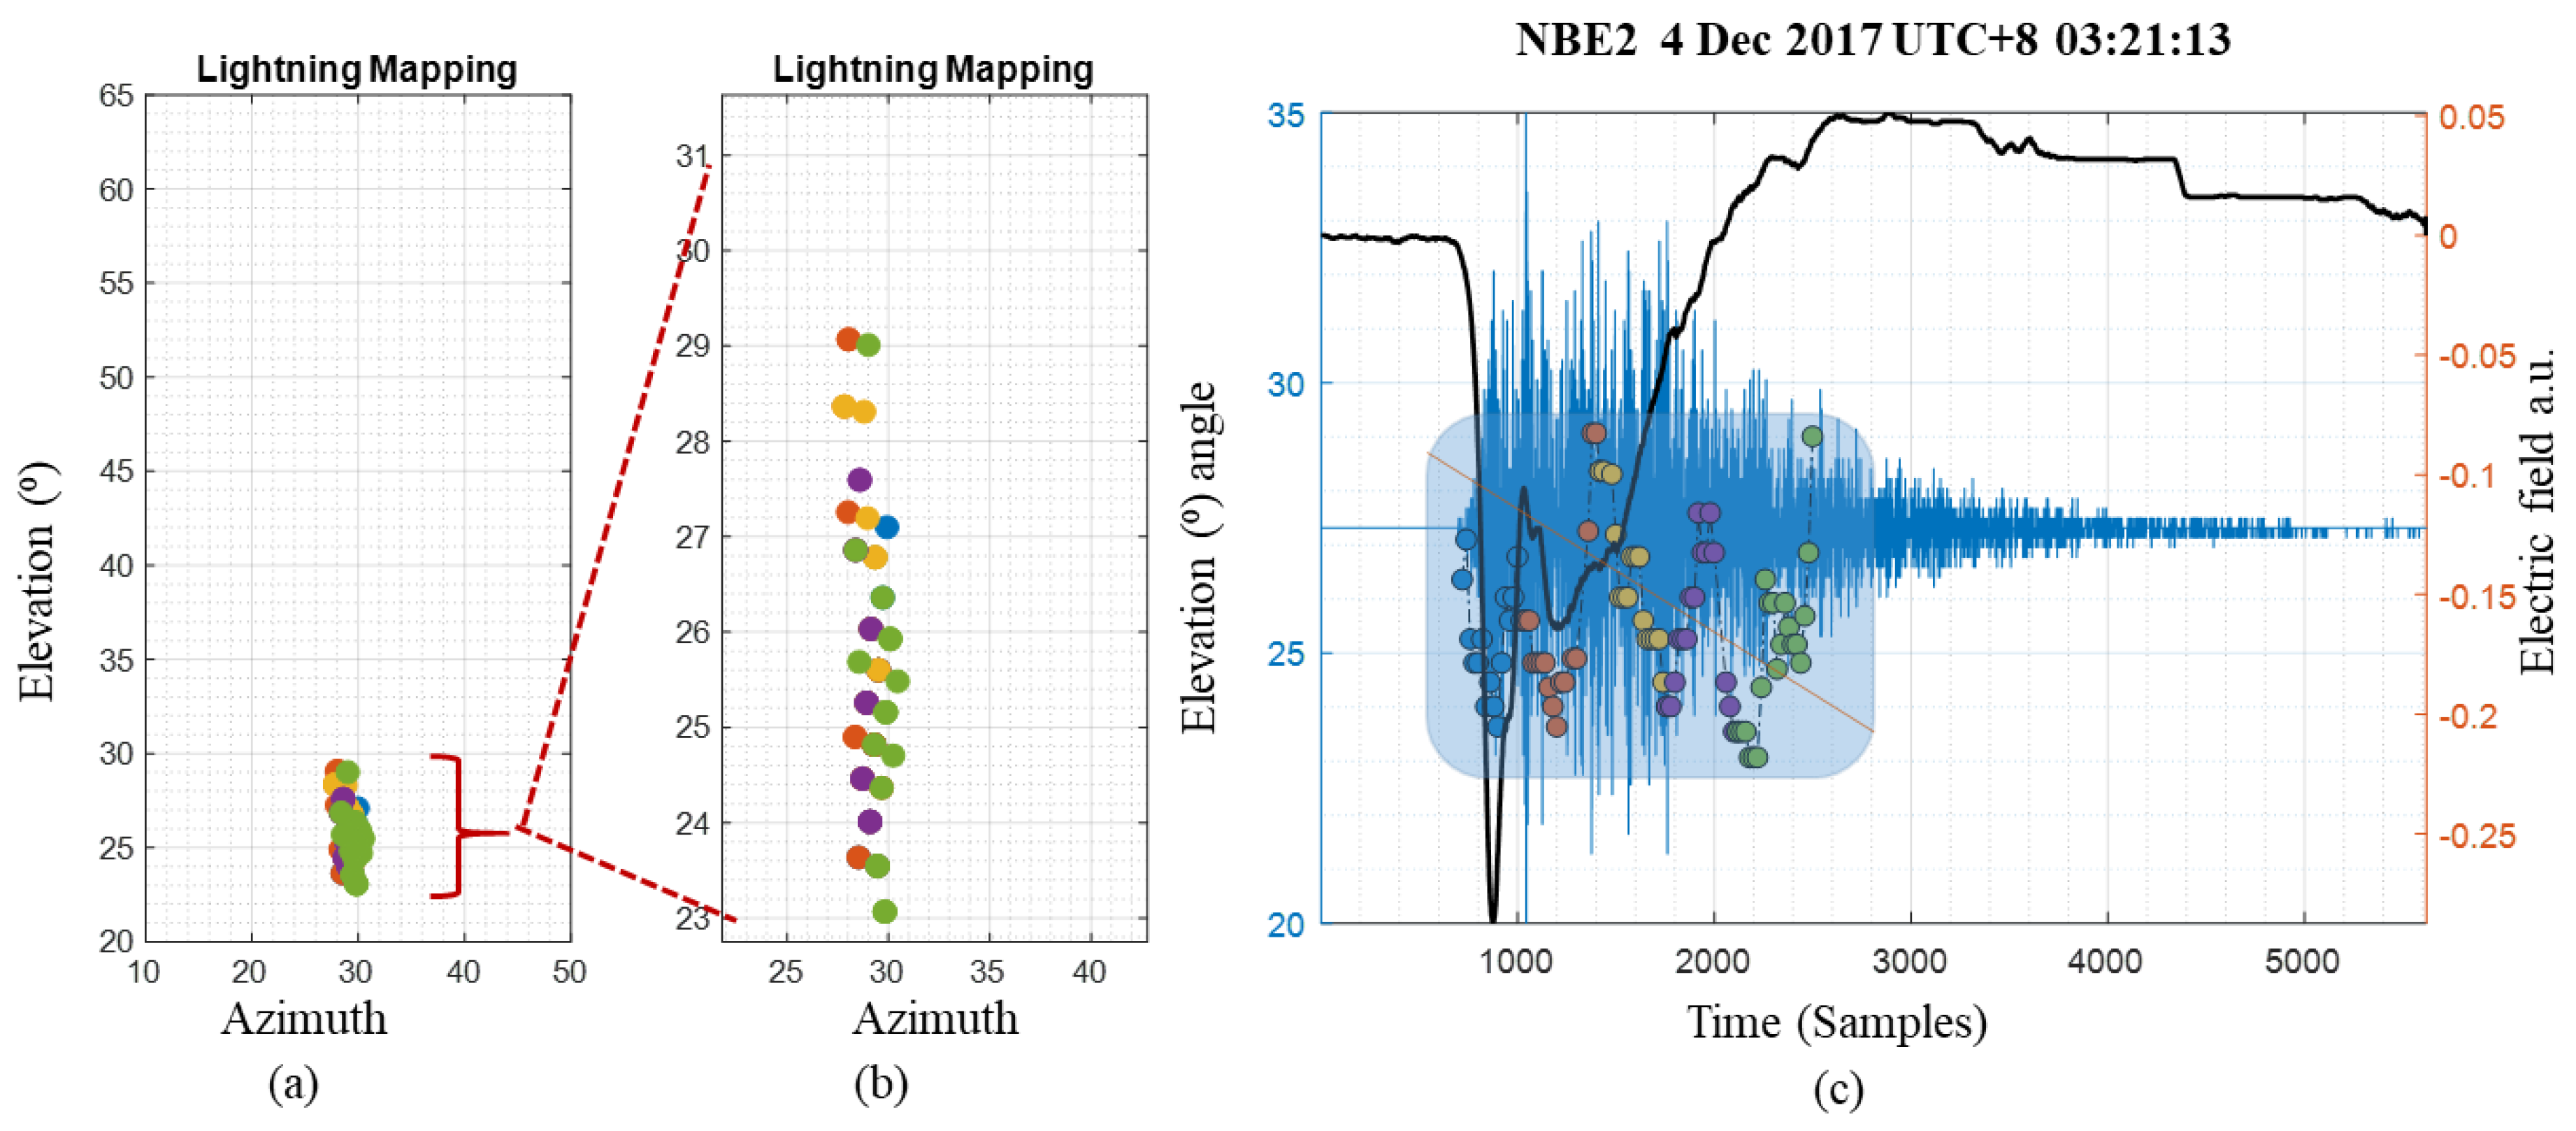
3.2. Evaluations on Real Lightning Data
In this section, we present the experimental evaluation of the proposed CCWD-PSO method for lightning mapping on the real collected lightning data described in Section 2.2.
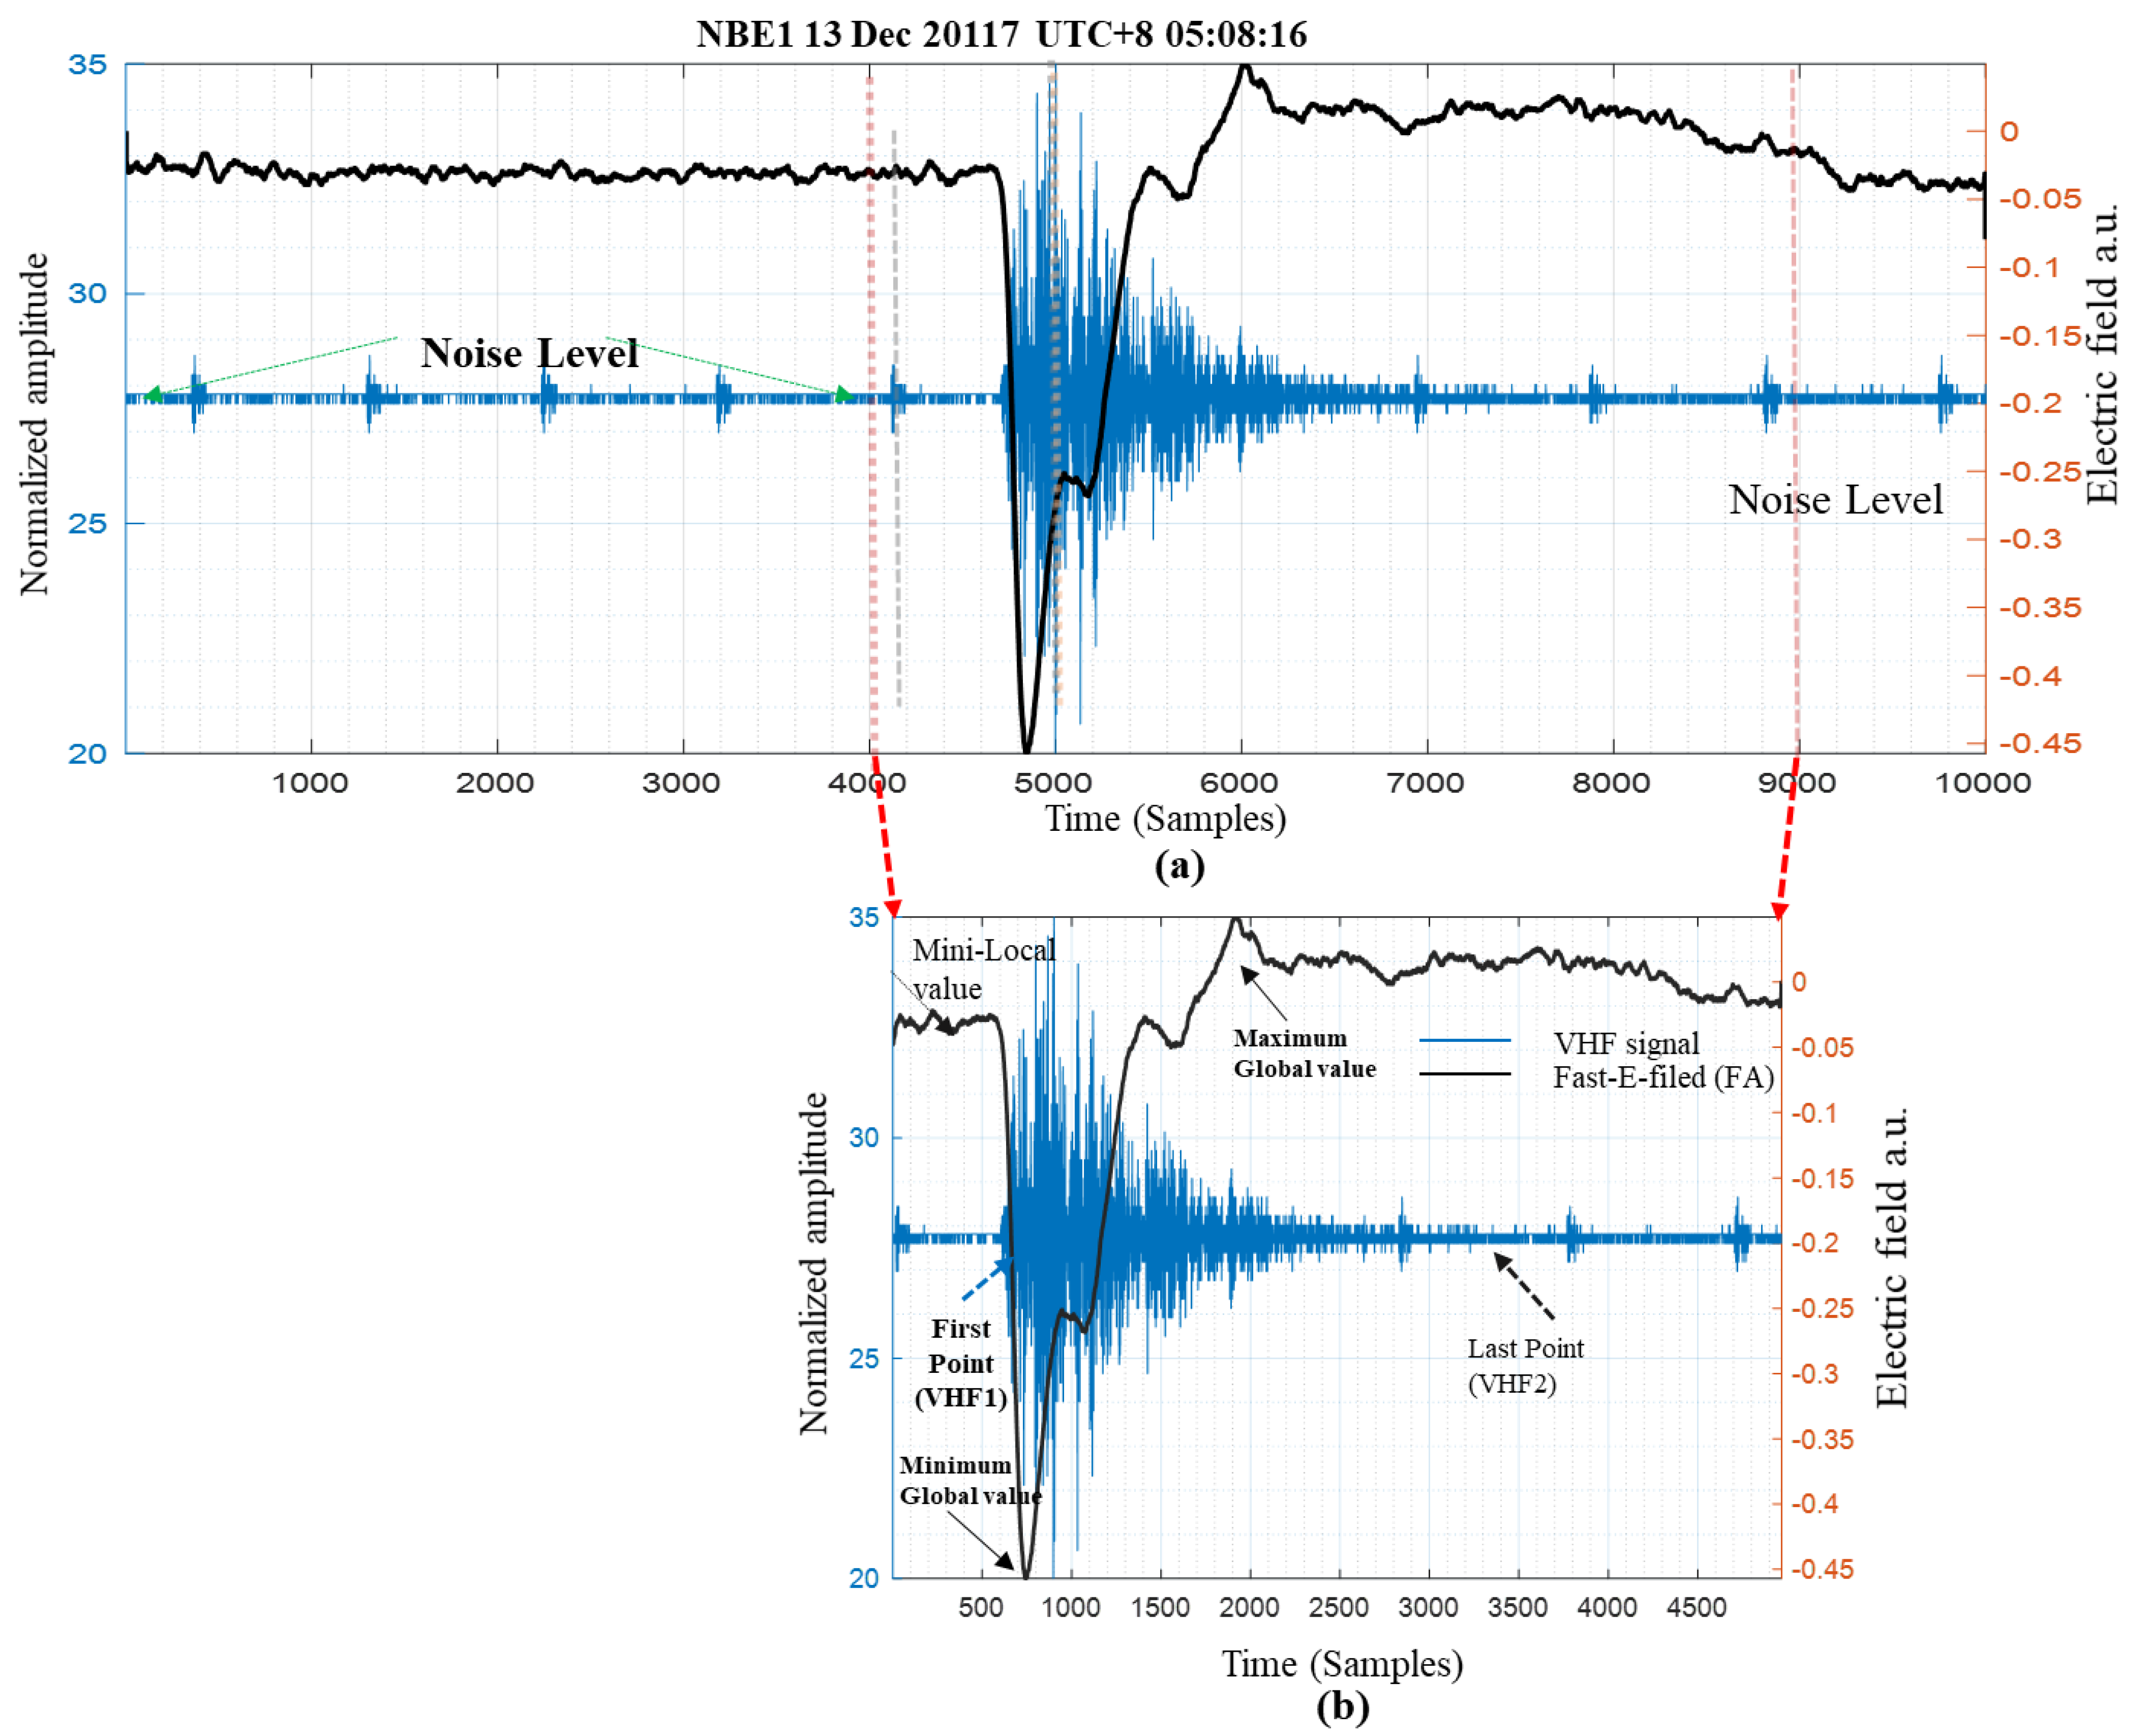
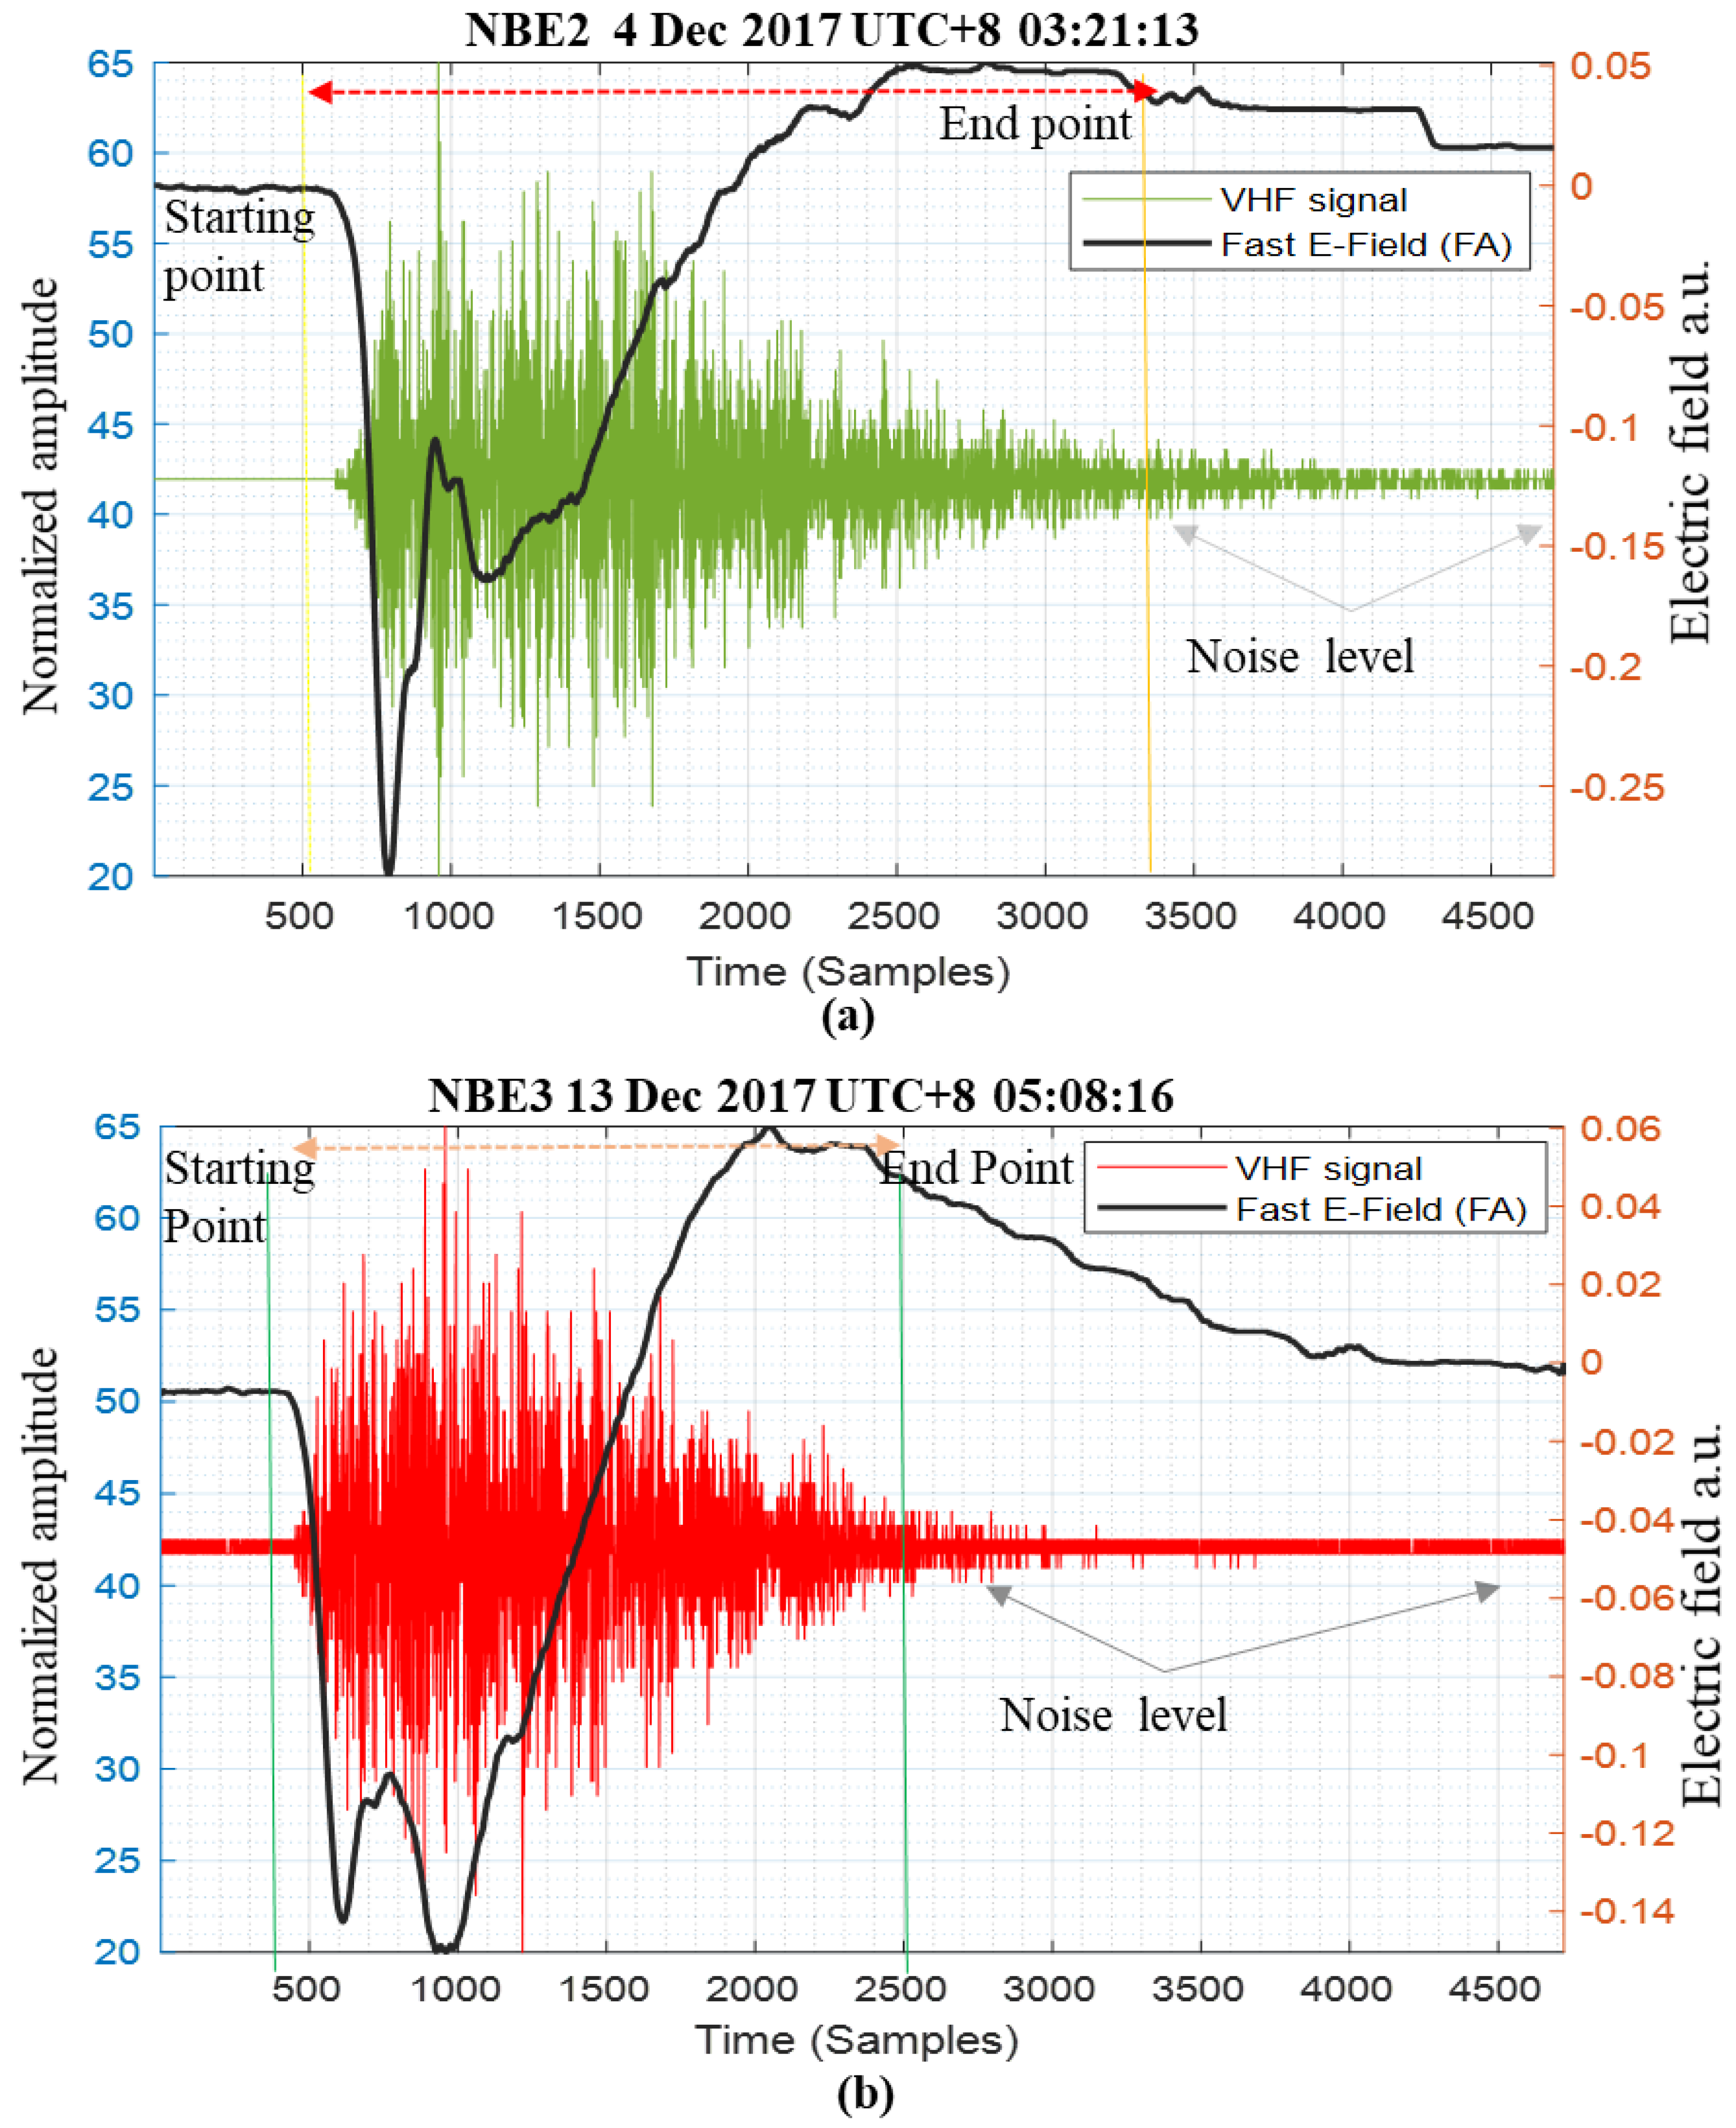
Evaluation of the Lightning Event Extraction Method
A total of three fast-electric fields related to FA and VHF signals are successfully identified by the lightning event extraction method. In this study, the fast-electric field polarity of positive NBEs flashes was identified based on the atmospheric electricity sign convention. Figure 8a shows the interferometer data for NBE1 that consist of VHF and fast-electric field waveforms, including the non-lightning parts. On the other hand, Figure 8b shows the proposed lightning event extraction method that determines the starting and ending points of the extracted fast-electric field (i.e., the first point VHF and the last point VHF signals).
Figure 8.
Interferometer data NBE1: (a) original ITF data; (b) lightning event extraction.
Figure 9 illustrates two other examples of the lightning event extraction method performed on two samples of the lightning (NBE2, and NBE3) flashes. The lightning event extraction method efficiently discards the noisy segments of the fas- electric field and VHF signal. Moreover, this method will potentially reduce the computation time and thus allows for faster signal processing of lightning events; it is also capable of reducing the lightning flash identification.
Figure 9.
Interferometer data: (a) NBE2 and (b) NBE3 using lightning event extraction.
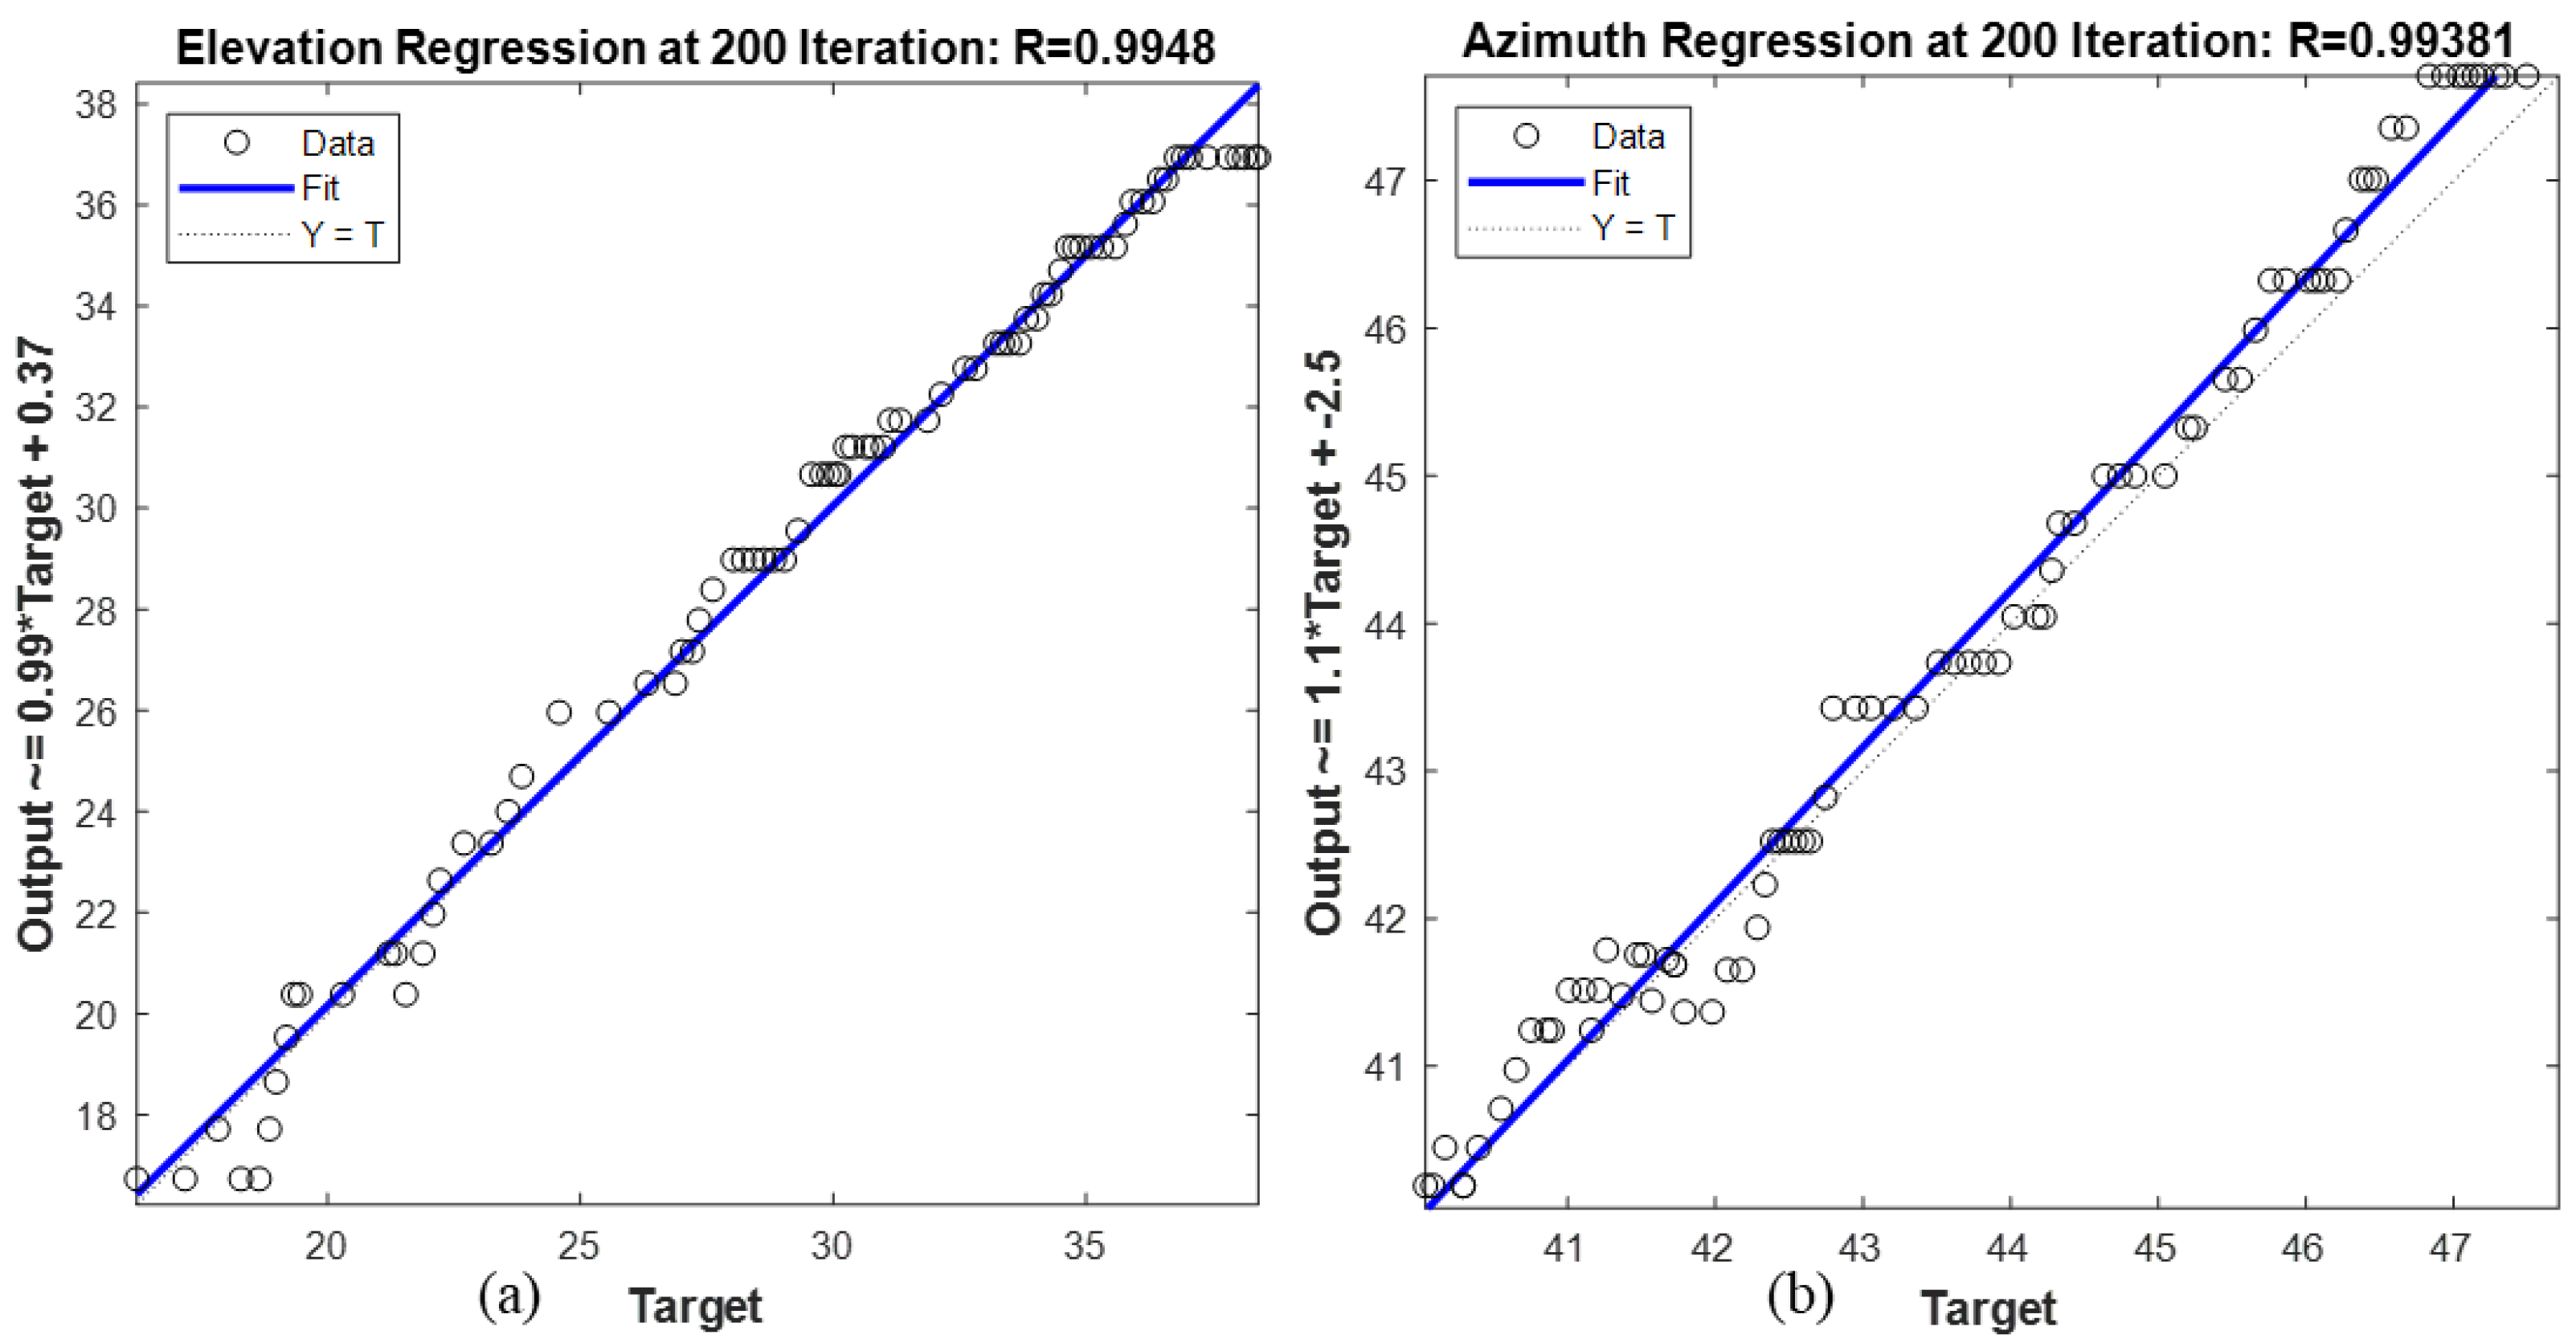
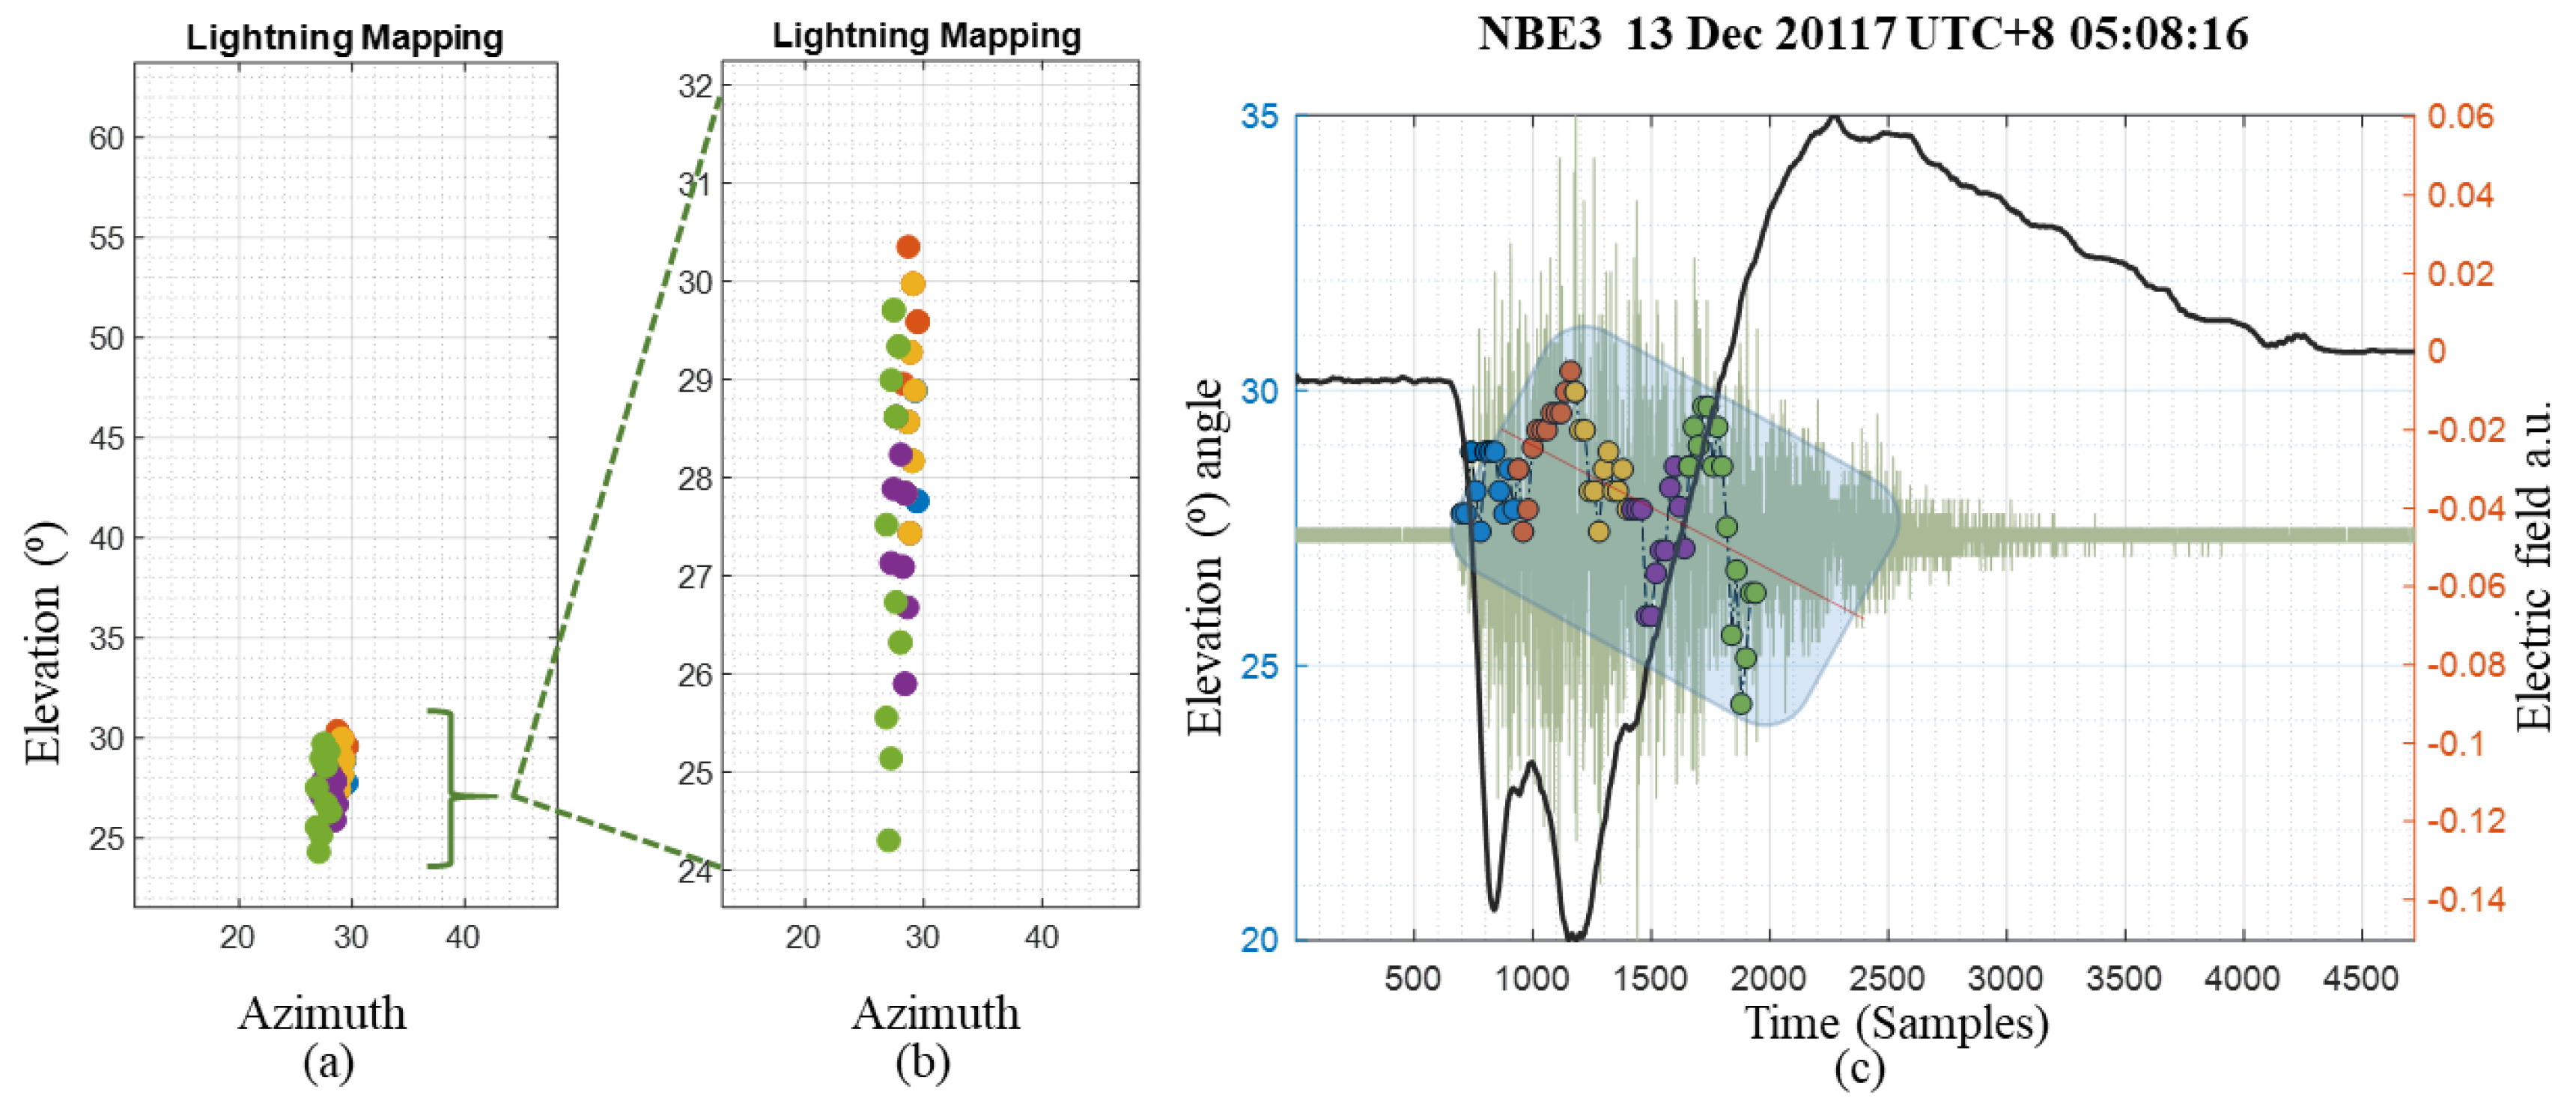
3.3. Lightning Mapping Optimization
In this section, we provide a novel CCWD-PSO-based lightning mapping algorithm processing. The implementation of the wavelet technique was used because of the capability of wavelet transform to further enhance the signals and reduce the noise effects, providing better time-domain resolution and reliable estimation of initial lightning maps (i.e., before optimization). To optimize the initial lightning map, an objective function was defined using window size as the regularization parameter. Tuning window size at best fitness value of the 300 iterations PSO, resulting from the objective function, was found to be . Thus, the localization scheme of the lightning mapping was carried out directly in the wavelet domain using a tuning window size . Here, we analyze three ITF NBEs data.
The first NBE1 discharge occurred as the storm intensified on 4 December 2017, UTC+8 03:01:42. Figure 10 shows the constructed map of the lightning source location for the first positive NBE1, where the constructed map of lightning source location was observed using the CCWD-PSO algorithm. The color changes in Figure 10a, with time from blue to green, correspond to the lightning progression time. In NBE1, the channel from the bottom (27° elevation) to 33° elevation was approximately straight with small changes in azimuth angles range, corresponding to the trajectory of the lightning flash. Figure 10b shows the expanded view of the lightning mapping plotted in azimuth vs. elevations. Figure 10c indicates that the radiation elevation angles and the fast-electric field observations (black waveform) are superimposed on the VHF waveform (blue), showing the downward propagation of the emitted VHF source. This is due to the downward pointing of the electric field (E change).
Figure 10.
Interferometer data for NBE1: (a) lightning map plotted in elevation vs. azimuth; (b) expanded view of lightning map of (a); (c) the breakdown of each colored circle-marker denotes the elevation angles (altitude) vs. time.
The second NBE2-initiated flash occurred sequentially with the NBE1 as the storm intensified on 4 December 2017, UTC+8 03:21:13. Figure 11 shows the estimated map of the lightning source location of the FA and ITF observations for the positive NBE2. The color changes in Figure 11a, with time from blue to green, correspond to the lightning progression time. Figure 11b shows the expanded view of the lightning map of a. The VHF radiation source for the NBE2 decreased in the elevation angle with an approximate range of 22° to 29° with small breakdown changes in the azimuth angles, corresponding to the trajectory of the lightning flash. The elevation angle and the change of fast-electric field (E changes) observations (gray waveform) show a downward propagation of the VHF source. It can be observed that the NBE2 has a narrow input current pulse (fast-electric field) due to the small charge involved in the return stroke sequence. In addition, NBE2 occurred over a time expanded window (time interval) of 20 µs (5000 samples), compared to NBE1 and NBE3, as they occurred over a time interval of 19 µs. Figure 11c indicates the breakdown with each colored circle-marker, denoting the elevation angle (altitude) vs. time.
Figure 11.
Interferometer data for NBE2: (a) lightning map plotted in elevation vs. azimuth; (b) expanded view of lightning map of (a); (c) the breakdown of each colored circle-marker denotes the elevation angles (altitude) vs. time.
A simultaneous observation of the second NBE3 discharge occurred on 13 December 2017, UTC+8 05:08:16. The lightning map was produced for NBE3 discharge using the CCWD-PSO algorithm, as shown in Figure 12. It can be seen that the VHF radiation source for the NBE3 is slightly decreased in elevation angle through time, with the lightning channel propagating from 24° to 30° elevation. This measurement represents a time-expanded window of approximately 19 µs. For NBE2, compared with NBE1, the lightning discharge breakdown orientation appears to be vertical. This indicates that the retrieved azimuth angles at which the breakdown occurred were constant. Further, the NBE3 fast-electric field appears in a wide range, which could be due to the large charge involved in the return stroke sequence.
Figure 12.
Interferometer data for NBE3: (a) lightning map plotted in elevation vs. azimuth; (b) expanded view of lightning map of (a); (c) the breakdown of each colored circle-marker denotes the elevation angles (altitude) vs. time.
Table 3 summarizes the performance comparisons of the three NBEs obtained by the CCWD-PSO algorithm on the ITF signals under study. The total number of NBEs, captured data time, elevation angle ranges, VHF propagation pointing in a downward direction referred to the starting downward pointing of the fast-electric field (E changes), time expanded window, the function of cross-correlation, lightning event extraction of each ITF data, types of interpolation resampling, and filtering methods are summarized.
Table 3.
Breakdown characteristics for all the NBEs (NBE1, NBE2, and NBE3) of a tuning window size .
.
4. Conclusions
This study investigated the feasibility and performance of a PSO-based optimization algorithm for lightning mapping estimation. The proposed CCWD-PSO algorithm requires no prior information on the lightning location. The fitness function (objective function) was derived and used for searching for the optimum solution. Several sets of iterations were investigated and compared. The performance of estimating the lightning mapping was measured based on tuning window size and minimizing the error between the simulated and real lightning mapping over the time course of the analyzed ITF lightning signals. Simulations and real data from three NBEs were conducted to provide sufficient analysis with high performance for estimating lightning maps. In practical application, the CCWD-PSO algorithm can be used to search the lightning source location, with the size population of the swarm being less than 50 and the number of iterations being less than 500. Overall, PSO is an efficient global optimizer for continuous-variable problems, easily implemented, with very few parameters to fine-tune, and it can accommodate constraints by using penalty methods. Therefore, from all the results shown by the CCWD-PSO technique, it can be concluded that PSO is the superior method in solving high-dimensional numerical optimization problems of estimating lightning maps.
Author Contributions
Conceptualization, M.R.A., A.A.A. and A.A. (Ammar Alammari); methodology, A.A. (Ammar Alammari); software, A.A. (Ahmed Aljanad) and F.N.; validation, F.N., M.R.A. and Z.K.; formal analysis, A.A. (Ammar Alammari); investigation, F.N. and A.A. (Ahmed Aljanad); resources, A.A. (Ammar Alammari), A.A. (Ahmed Aljanad) and A.A.A.; data curation, A.A. (Ahmed Aljanad) and A.A. (Ammar Alammari); writing—original draft preparation, A.A. (Ammar Alammari); writing—review and editing, A.A.A., F.N., A.A. (Ahmed Aljanad) and M.R.A.; visualization, F.N.; supervision, M.R.A. and A.A.A.; project administration, A.A.A.; funding acquisition, A.A.A. All authors have read and agreed to the published version of the manuscript.
Funding
This research received no external funding.
Institutional Review Board Statement
Not applicable.
Informed Consent Statement
Not applicable.
Data Availability Statement
Data is available on request to any of the corresponding authors.
Acknowledgments
Authors acknowledge the publication support through J510050002—BOLDREFRESH2025—CENTRE OF EXCELLENCE from the iRMC of Universiti Tenaga Nasional (UNITEN).
Conflicts of Interest
The authors declare no conflict of interest.
References
- Alammari, A.; Alkahtani, A.A.; Ahmad, M.R.; Noman, F.M.; Esa, M.R.M.; Kawasaki, Z.; Tiong, S.K. Lightning Mapping: Techniques, Challenges, and Opportunities. IEEE Access 2020, 8, 190064–190082. [Google Scholar] [CrossRef]
- Rison, W.; Thomas, R.J.; Krehbiel, P.R.; Hamlin, T.; Harlin, J. A GPS-based Three-Dimensional Lightning Mapping System: Initial Observations in Central New Mexico W. Geophys. Res. Lett. 1999, 26, 3573–3576. [Google Scholar] [CrossRef] [Green Version]
- Alammari, A.; Alkahtani, A.A.; Ahmad, M.R.; Noman, F.; Esa, M.R.M.; Sabri, M.H.M.; Mohammad, S.A.; Al-Khaleefa, A.S.; Kawasaki, Z.; Agelidis, V. Kalman Filter and Wavelet Cross-Correlation for VHF Broadband Interferometer Lightning Mapping. Appl. Sci. 2020, 10, 4238. [Google Scholar] [CrossRef]
- Stock, M.G.; Akita, M.; Krehbiel, P.R.; Rison, W.; Edens, H.E.; Kawasaki, Z.; A Stanley, M. Continuous broadband digital interferometry of lightning using a generalized cross-correlation algorithm. J. Geophys. Res. Atmos. 2014, 119, 3134–3165. [Google Scholar] [CrossRef]
- Akita, M.; Stock, M.; Kawasaki, Z.; Krehbiel, P.; Rison, W.; Stanley, M. Data processing procedure using distribution of slopes of phase differences for broadband VHF interferometer. J. Geophys. Res. Atmos. 2014, 119, 6085–6104. [Google Scholar] [CrossRef]
- Sun, Z.; Qie, X.; Liu, M.; Cao, D.; Wang, D. Lightning VHF radiation location system based on short-baseline TDOA—Validation in rocket-triggered lightning. Atmospheric Res. 2013, 129-130, 58–66. [Google Scholar] [CrossRef]
- Kawasaki, Z. Review of the Location of VHF Pulses Associated with Lightning Discharge. AerospaceLab 2012, 1, 1–7. [Google Scholar]
- Stock, M.; Krehbiel, P. Multiple baseline lightning interferometry—Improving the detection of low amplitude VHF sources. In Proceedings of the 2014 International Conference on Lightning Protection (ICLP), Shanghai, China, 11–18 October 2014; pp. 293–300. [Google Scholar]
- Cuturi, M.; Fukumizu, K. Kernels on structured objects through nested histograms. Adv. Neural Inf. Process. Syst. 2007, 336, 329–336. [Google Scholar]
- Shaw, R.; Srivastava, S. Particle swarm optimization: A new tool to invert geophysical data. Geophysics 2007, 72, F75–F83. [Google Scholar] [CrossRef]
- Liang, R.-H.; Tsai, S.-R.; Chen, Y.-T.; Tseng, W.-T. Optimal power flow by a fuzzy based hybrid particle swarm optimization approach. Electr. Power Syst. Res. 2011, 81, 1466–1474. [Google Scholar] [CrossRef]
- Zheng, D.; Zhang, Y.; Lu, W.; Zhang, Y.; Dong, W.; Chen, S.; Dan, J. Optical and electrical observations of an abnormal triggered lightning event with two upward propagations. Acta Meteorol. Sin. 2012, 26, 529–540. [Google Scholar] [CrossRef]
- Song, X.; Tang, L.; Lv, X.; Fang, H.; Gu, H. Application of particle swarm optimization to interpret Rayleigh wave dispersion curves. J. Appl. Geophys. 2012, 84, 1–13. [Google Scholar] [CrossRef]
- Zhang, Y.; Yang, S.; Lu, W.; Zheng, D.; Dong, W.; Li, B.; Chen, S.; Zhang, Y.; Chen, L. Experiments of artificially triggered lightning and its application in Conghua, Guangdong, China. Atmos. Res. 2014, 135–136, 330–343. [Google Scholar] [CrossRef]
- Abido, M. Optimal power flow using particle swarm optimization. Int. J. Electr. Power Energy Syst. 2002, 24, 563–571. [Google Scholar] [CrossRef]
- Zheng, D.; Zhang, Y.; Zhang, Y.; Lu, W.; Yan, X.; Chen, S.; Xu, L.; Huang, Z.; You, J.; Zhang, R.; et al. Characteristics of the initial stage and return stroke currents of rocket-triggered lightning flashes in southern China. J. Geophys. Res. Atmos. 2017, 122, 6431–6452. [Google Scholar] [CrossRef]
- Aydilek, I.B. A hybrid firefly and particle swarm optimization algorithm for computationally expensive numerical problems. Appl. Soft Comput. J. 2018, 66, 232–249. [Google Scholar] [CrossRef]
- Ramarao, G.; Chandrasekaran, K. Use of PSO to determine lightning channelbase-current function parameters for standard severe negative first and subsequent return stroke approximation. IET Sci. Meas. Technol. 2019, 13, 42–52. [Google Scholar] [CrossRef]
- Alyasseri, Z.A.A.; Khader, A.T.; Al-Betar, M.A.; Abasi, A.K.; Makhadmeh, S.N. EEG Signals Denoising Using Optimal Wavelet Transform Hybridized with Efficient Metaheuristic Methods. IEEE Access 2020, 8, 10584–10605. [Google Scholar] [CrossRef]
- Freitas, D.; Lopes, L.G.; Morgado-Dias, F. Particle Swarm Optimisation: A Historical Review Up to the Current Developments. Entropy 2020, 22, 362. [Google Scholar] [CrossRef] [PubMed] [Green Version]
- Hu, Z.; Wen, Y.; Zhao, W.; Zhu, H. Particle swarm optimization-based algorithm for lightning location estimation. In Proceedings of the 2010 Sixth International Conference on Natural Computation, Yantai, China, 10–12 August 2010; Volume 5, pp. 2668–2672. [Google Scholar] [CrossRef]
- Guo, X.; Zhu, Y.; Chen, H.; Zhao, L.; Chen, X.; Gao, Y. Research and Validation of Lightning Location Based on Particle Swarm Optimization Algorithm. In Proceedings of the 2015 International Conference on Intelligent Systems Research and Mechatronics Engineering, Zhengzhou, China, 11–13 April 2015; Volume 121, pp. 815–818. [Google Scholar] [CrossRef] [Green Version]
- Fan, X.; Yao, W.; Zhang, Y.; Xu, L.; Zhang, Y.; Krehbiel, P.R.; Zheng, D.; Liu, H.; Lyu, W.; Chen, S.; et al. Parametric Reconstruction Method for the Long Time-Series Return-Stroke Current of Triggered Lightning Based on the Particle Swarm Optimization Algorithm. IEEE Access 2020, 8, 115133–115147. [Google Scholar] [CrossRef]
- Mohammad, S.A.; Ahmad, M.R.; Alkahtani, A.A.; Esa, M.R.; Sidik, M.A.; Nawawi, Z.; Jambak, M.I.; Baharin, S.A.; Sabri, M.H.; Yusop, N.; et al. The evaluation of parallel plate antenna with variation of air gaps separation and copper plate area. Test Eng. Manag. 2019, 81, 5663–5670. [Google Scholar]
- Abeywardhana, R.; Sonnadara, U.; Abegunawardana, S.; Fernando, M.; Cooray, V. Lightning Localization Based on VHF Broadband Interferometer Developed in Sri Lanka. In Proceedings of the 2018 34th International Conference on Lightning Protection (ICLP), Rzeszow, Poland, 2–7 September 2018; pp. 1–5. [Google Scholar] [CrossRef]
- Zhang, H.; Gu, S.; Chen, J.; Zhao, C.; Wu, M.; Yan, B.; Wang, Y. Single-Station-Based Lightning Mapping System With Electromagnetic and Thunder Signals. IEEE Trans. Plasma Sci. 2019, 47, 1421–1428. [Google Scholar] [CrossRef]
- Ghazvinian, H.; Mousavi, S.-F.; Karami, H.; Farzin, S.; Ehteram, M.; Hossain, S.; Fai, C.M.; Bin Hashim, H.; Singh, V.P.; Ros, F.C.; et al. Integrated support vector regression and an improved particle swarm optimization-based model for solar radiation prediction. PLoS ONE 2019, 14, e0217634. [Google Scholar] [CrossRef] [PubMed]
Publisher’s Note: MDPI stays neutral with regard to jurisdictional claims in published maps and institutional affiliations. |
© 2021 by the authors. Licensee MDPI, Basel, Switzerland. This article is an open access article distributed under the terms and conditions of the Creative Commons Attribution (CC BY) license (https://creativecommons.org/licenses/by/4.0/).