Article

Health Risk Detection and Classification Model Using Multi-Model-Based Image Channel Expansion and Visual Pattern Standardization

1
Division of Computer Information Engineering, Sangji University, Wonju 26339, Korea
2
Division of Software, Yonsei University, Wonju 26493, Korea
3
Division of AI Computer Science and Engineering, Kyonggi University, Suwon 16227, Korea
4
Department of Information Communication Software Engineering, Sangji University, Wonju 26339, Korea
*
Author to whom correspondence should be addressed.
Appl. Sci. 2021, 11(18), 8621; https://doi.org/10.3390/app11188621
Submission received: 29 August 2021 / Revised: 13 September 2021 / Accepted: 13 September 2021 / Published: 16 September 2021
(This article belongs to the Special Issue Recent Advances in Biomedical Image Processing)

Abstract

:
Although mammography is an effective screening method for early detection of breast cancer, it is also difficult for experts to use since it requires a high level of sensitivity and expertise. A computer-aided detection system was introduced to improve the detection accuracy of breast cancer in mammography, which is difficult to read. In addition, research to find lesions in mammography images using artificial intelligence has been actively conducted in recent days. However, the images generally used for breast cancer diagnosis are high-resolution and thus require high-spec equipment and a significant amount of time and money to learn and recognize the images and process calculations. This can lower the accuracy of the diagnosis since it depends on the performance of the equipment. To solve this problem, this paper will propose a health risk detection and classification model using multi-model-based image channel expansion and visual pattern shaping. The proposed method expands the channels of breast ultrasound images and detects tumors quickly and accurately through the YOLO model. In order to reduce the amount of computation to enable rapid diagnosis of the detected tumors, the model reduces the dimensions of the data by normalizing the visual information and use them as an input for the RNN model to diagnose breast cancer. When the channels were expanded through the proposed brightness smoothing and visual pattern shaping, the accuracy was the highest at 94.9%. Based on the images generated, the study evaluated the breast cancer diagnosis performance. The results showed that the accuracy of the proposed model was 97.3%, CRNN 95.2%, VGG 93.6%, AlexNet 62.9%, and GoogleNet 75.3%, confirming that the proposed model had the best performance.

1. Introduction

Cancer occurs as cells constituting the human body function abnormally and invade the surrounding tissues and organs to form a mass. Cancer is classified into various types, depending on where the tumor develops. Breast cancer is one of the most common diseases in American women, and in 2019, 41,760 out of about 268,600 breast cancer patients died [1,2,3]. About 80% of breast cancer patients die within 5 years as the tumor metastasizes to other organs regardless of treatment. However, the 5-year survival rate of breast cancer patients is over 90% in developed countries with the recent advances in medical technology [4,5]. Although there are various causes of breast cancer, Rama Natarajan et al. argued that unhealthy eating habits and contamination with carcinogens during puberty, a period when major tissues and cells of the breast change actively, increase the probability of developing breast cancer in adulthood [6,7]. To support this, the incidence of breast cancer is increasing every year. Early diagnosis of breast cancer shows an excellent treatment prognosis, so quick and early diagnosis of cancer is very important. Ultrasound imaging is the most commonly used medical imaging test for diagnosing breast cancer, due to the advantages that it is safe and can acquire medical images in real time. Recently, a computer aided diagnosis (CAD) system has received great attention because it assists in diagnosis by analyzing the malignant and benign characteristics of breast cancer shown in breast ultrasound images [8,9,10]. Ultrasound images enable treatment according to the situation since they visually confirm the location and shape of the lesion to quickly observe temporal changes for metastasis and shape change. They also have the advantage of a relatively low cost and rapid diagnosis [11]. Breast ultrasonography uses features such as shape, boundary, internal echoes, and posterior echoes to diagnose lesions. Recently, research on breast cancer diagnosis and detection using machine learning and deep learning technology has been actively conducted [12,13,14,15]. Although tumors can be easily detected in machine learning if the shape of the lesion is clearly expressed in the breast ultrasound image, it is difficult to detect them due to the irregular boundary and non-uniform texture of the lesion. Thus, this paper will focus on deep learning. Representative deep learning-based image analysis models include AlexNet, U-Net, GoogleNet, ResNet, and Visual Geometry Group (VGG) [16,17,18]. In particular, the You Only Look Once (YOLO) detection and classifier, one of the deep learning models, is excellent in detecting and classifying various objects in a real-time environment. The YOLO model’s performance has been verified in many preceding studies [19,20]. As such, although many studies are actively in progress, diagnostic systems based on medical images require a large amount of time and calculations to learn and recognize Artificial Intelligence (AI) models since medical images are of high quality [21,22,23,24]. High-performance hardware equipment can be used instead to improve the processing speed, but it can be too expensive. Therefore, it is necessary to research a method that can accurately detects and diagnoses lesions without using high-performance diagnostic equipment.
To solve the issues of high-resolution medical images and provide accurate diagnosis, this paper proposes a health risk detection and classification model that uses multi-model-based brightness smoothing and visual pattern stereotyping. The proposed method is to make the lesion shape clearer by adjusting the brightness of the medical image and minimizing noise, and to carefully observe the images like a human eye. This method mimics how the human eye observes a specific object and transmits a huge amount of information, such as the color and outline of the object, to the brain to describe them in detail. To implement this process, the study used a detection filter that can analyze the lesion image by pixel unit, which would precisely analyze the lesion shape by identifying the line segment type and then counting the lines. The model’s measurement accuracy was improved using the singularity of the lesion as the training data through precise analysis. To combine the fast detection speed of the YOLO model and the high accuracy of the Line-Segment Feature Analysis-Recurrent Neural Network (LFA-RNN) model in classifying breast cancer, as confirmed in previous studies, this study configured the new method as a dimensional reduction and classification model to reduce the amount of computation to quickly detect and diagnose a tumor from a breast ultrasound image. After extending the channel of the breast ultrasound image to improve the performance of the detection model, the study used the YOLO model, which had excellent object detection performance, to detect lesions present in the breast ultrasound. To quickly diagnose the detected tumors, compressed data were formed using LFA, an image dimension reduction algorithm, and was applied as an input to the RNN model to determine whether the detected lesion is benign or malign. The proposed method can detect the lesions fast through the RNN model using the low-dimensional standardized data processed thanks to the YOLO model’s fast and excellent detection performance and by reducing the dimensionality of the image data.
This paper examines the prior studies on medical image analysis using deep learning in Section 2. In Section 3, it demonstrates the method of detecting breast cancer in breast ultrasound images based on the YOLO model and the diagnosis method through the input data generation and model of the RNN model using dimensionality reduction. This study verifies the performance of the proposed method in Section 4 by comparing it with the experimental results of the previous studies, and it finally ends with conclusions and follow-up future research.

2. Related Research

2.1. AI-Based Computer-Aided Diagnosis (CAD) System

Medicine is one of the fields in which AI technology is widely applied. The importance of AI in medicine is increasing as the medical paradigm shifts from standard empirical treatment to disease prediction, prevention, and personalized treatment. Medical AI learns big data through machine learning and recognizes specific patterns to diagnose and predict diseases or suggest customized treatment methods [25,26]. In particular, the development of software medical devices that read images generated by X-ray, Computed Tomography (CT), Magnetic Resonance Imaging (MRI), and endoscopy, thereby assisting doctors in diagnosis, is active. They can help solve the shortage of radiologists and the difficulty in ensuring the consistency of interpreting images because of the shorter diagnosis time and determining the disease using more data [27,28]. The development of CAD systems to assist doctors in diagnosis based on AI and big data using medical images is active [29,30,31,32,33]. Figure 1 shows the image analysis and CAD system using deep learning.
VUNO [34] developed VUNO-med, a CT image-based AI solution for solitary pulmonary nodule detection. The AI-based software learns medical data and helps doctors in diagnosis. The diagnostic and assistive technology has doctor-level accuracy through feature extraction of the CT images related to pulmonary disease and lung cancer. JLK Inspection [35] provides 37 solutions for diagnosis assistance through the 14 body parts and 8 image modalities. Typically, it provides the probability of 16 lung diseases and visualization of abnormal lesions through chest X-ray. Lunit is developing clinical and diagnostic technology with medical imaging through deep learning. Histopathologic examination is important in determining the patient’s surgery and follow-up treatment. It plays a role in helping doctors diagnose chest radiography by detecting lesions, such as lung cancer and lung metastasis, pulmonary emphysema, diffuse interstitial lung disease, tuberculosis, and pneumonia, from chest X-ray images. The company researches mammography technologies to improve breast cancer screening speed, detect and localize lesions, and predict malignancy probability [36]. Samsung SDS and Vintage Lab worked with the Samsung Medical Center to develop Doctor Answer, which analyzes health examination data and Electronic Medical Record (EMR) data using deep learning. Doctor Answer is software for predicting breast cancer occurrence and recurrence. It provides services of predicting the risk of disease recurrence by using the hospitalization and treatment information of breast cancer patients and recommending the appropriate additional precision examination and examination interval according to the individual risk level using the health examination information [37]. Development is also actively ongoing abroad. Google DeepMind is developing AI software that diagnoses more than 50 eye diseases by analyzing Optical Coherence Tomography (OCT). NVIDIA developed a deep learning-based standalone software medical device for cancer diagnosis to help doctors diagnose by providing the function to identify cancer cells in patient images and display them [38]. Moreover, China’s Tencent has developed Miyinga, an AI-based software medical device for medical image analysis and CAD to help predict 700 types of diseases through cooperation with more than 100 major hospitals in China [39]. Although these CAD systems detect various lesions based on AI, there is a performance degradation problem because of unclear boundaries in the image due to the noise characteristics of the medical images. Therefore, deep learning studies on the detection and classification of medical image lesions are actively ongoing.

2.2. Prediction Deep Learning-Based Studies on Medical Image Lesion Detection and Classification

Deep learning-based image analysis is a learning model centered on convolution operation. The leading models include AlexNet, U-Net, DarkNet, ResNet, and VGG. Among them, AlexNet, U-Net, and DarkNet are the most widely used, and additional learning models are sometimes linked to these models. Senan, EM, et al. [40] proposed reducing the computational requirement and improving accuracy using CAD and an AlexNet-based diagnostic model. This method performed basic preprocessing, scaled the data in four ways, and used it as an input for the AlexNet model. It resulted in 95% accuracy, 97% sensitivity, 90% specificity, and 99.36% AUC. Jin, Y. W. et al. [41] conducted a study on the diagnosis of lymph node metastasis in breast cancer patients to improve the performance of an automated CAD system in digital histopathology. By individually training four histopathology data through U-net, it was able to show higher performance than conventional U-net learning. It resulted in an 87–89.5% AUC, 82.0% sensitivity, and 87.8% specificity. Since U-net shows very effective performance in detecting an object and uses a relatively small amount of data, it can effectively detect objects from data such as medical images that are difficult to collect data. Unver, H. M. et al. [42] proposed a pipeline that can effectively segment skin lesions by combining the YOLO and GrabCut algorithms. This method detected lesions in four steps. Step 1 removed hair around the lesion and Step 2 detected the lesion location through YOLOv3. Step 3 combines the lesion image and the detected location, and Step 4 creates a binary image according to the lesion shape through the GrabCut algorithm. The method showed excellent performance of 90.82% sensitivity, 93.39% accuracy, and 92.68% specificity.
However, the AlextNet model requires a large volume of data at the level of big data, and each data point must be labeled and managed. Moreover, it has a disadvantage in that it is difficult to maintain the spatial and structural consistency of the image segmentation result [43,44]. While U-net mainly performs the convolution operation in the contracting path, bottleneck path, and expanding path, the feature map is larger than conventional models because it does not perform padding. Therefore, it causes the more computational problem of processing a large volume at the learning and detection steps. Since the number of channels to be created is doubled according to the layer configured in the contracting path, the computational requirement is higher than that of the reference model. Although the overall processing speed is fast, the system resources (PC specification, energy, etc.) required by each processing are high [45,46,47]. In the case of DarkNet, its performance in detecting and classifying lesion objects in medical images is better than other technologies. However, the processing speed is lowered due to the large volume of input image data, and accurate analysis is difficult due to limited resource use, potentially leading to a disabled processing state. Resolving it requires converting the high-quality original images into low-dimensional data to enable accurate analysis by reducing the processing speed according to data processing and high resolution [48,49]. This study used YOLO, a DarkNet model with high performance in object detection and classification, and developed pre-processing to increase the detection performance of the YOLO model, a dimensionality reduction technique, and a pipeline for the RNN model.

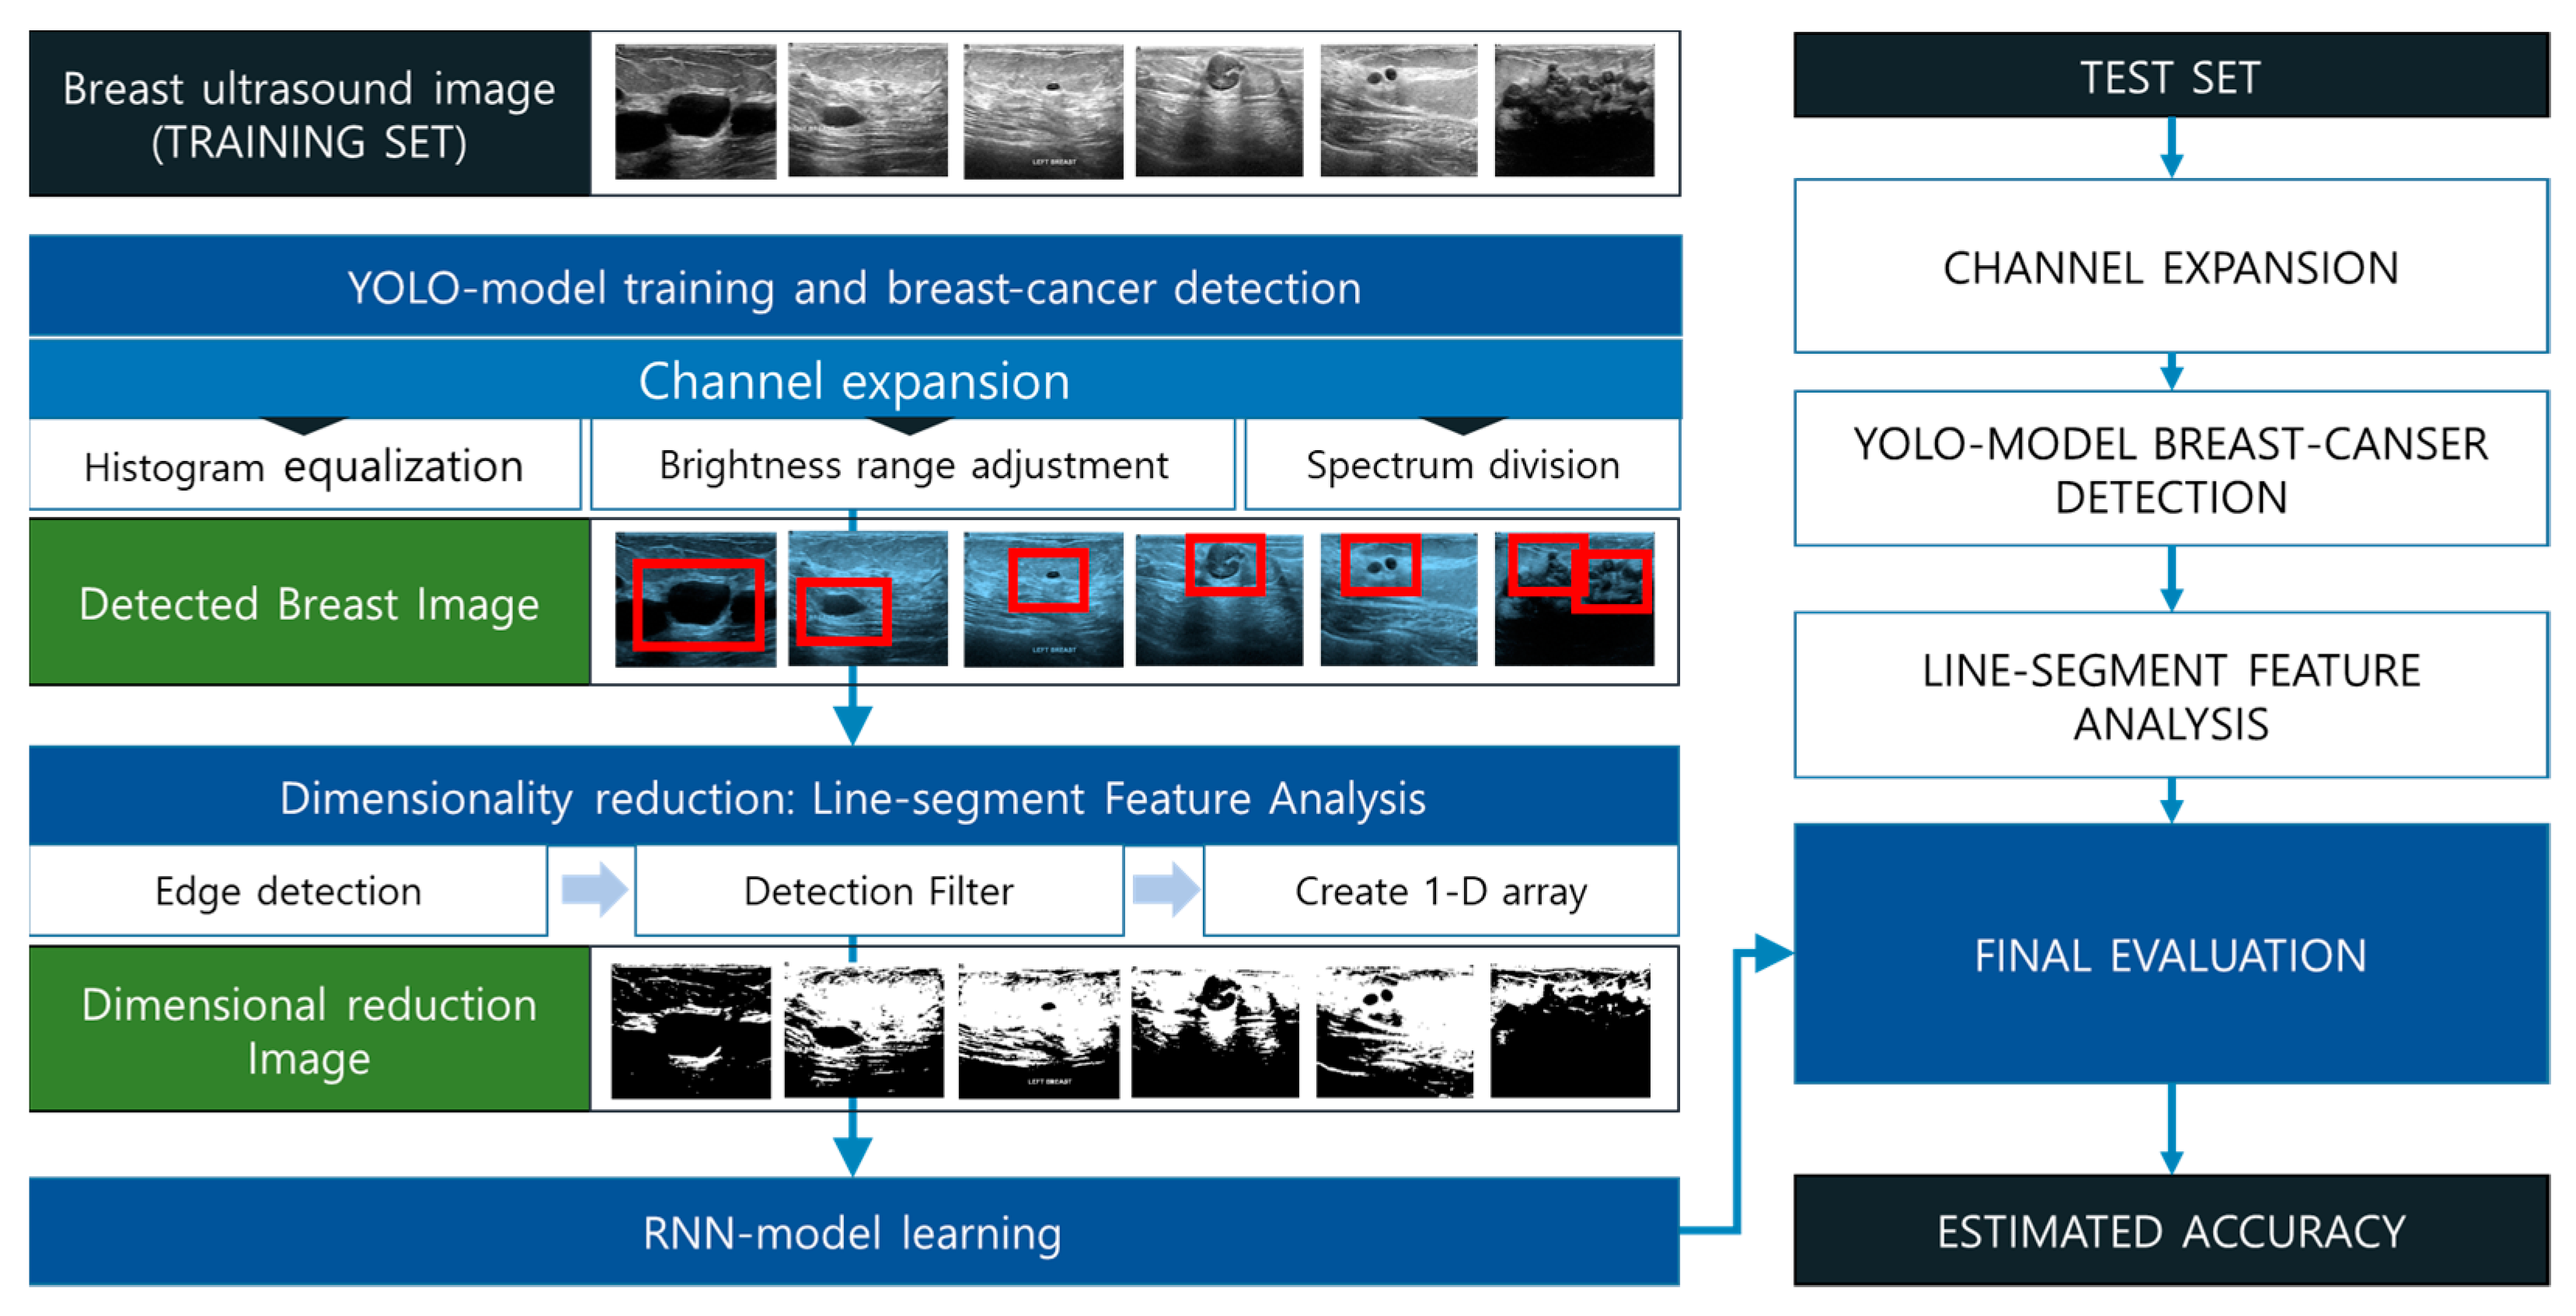
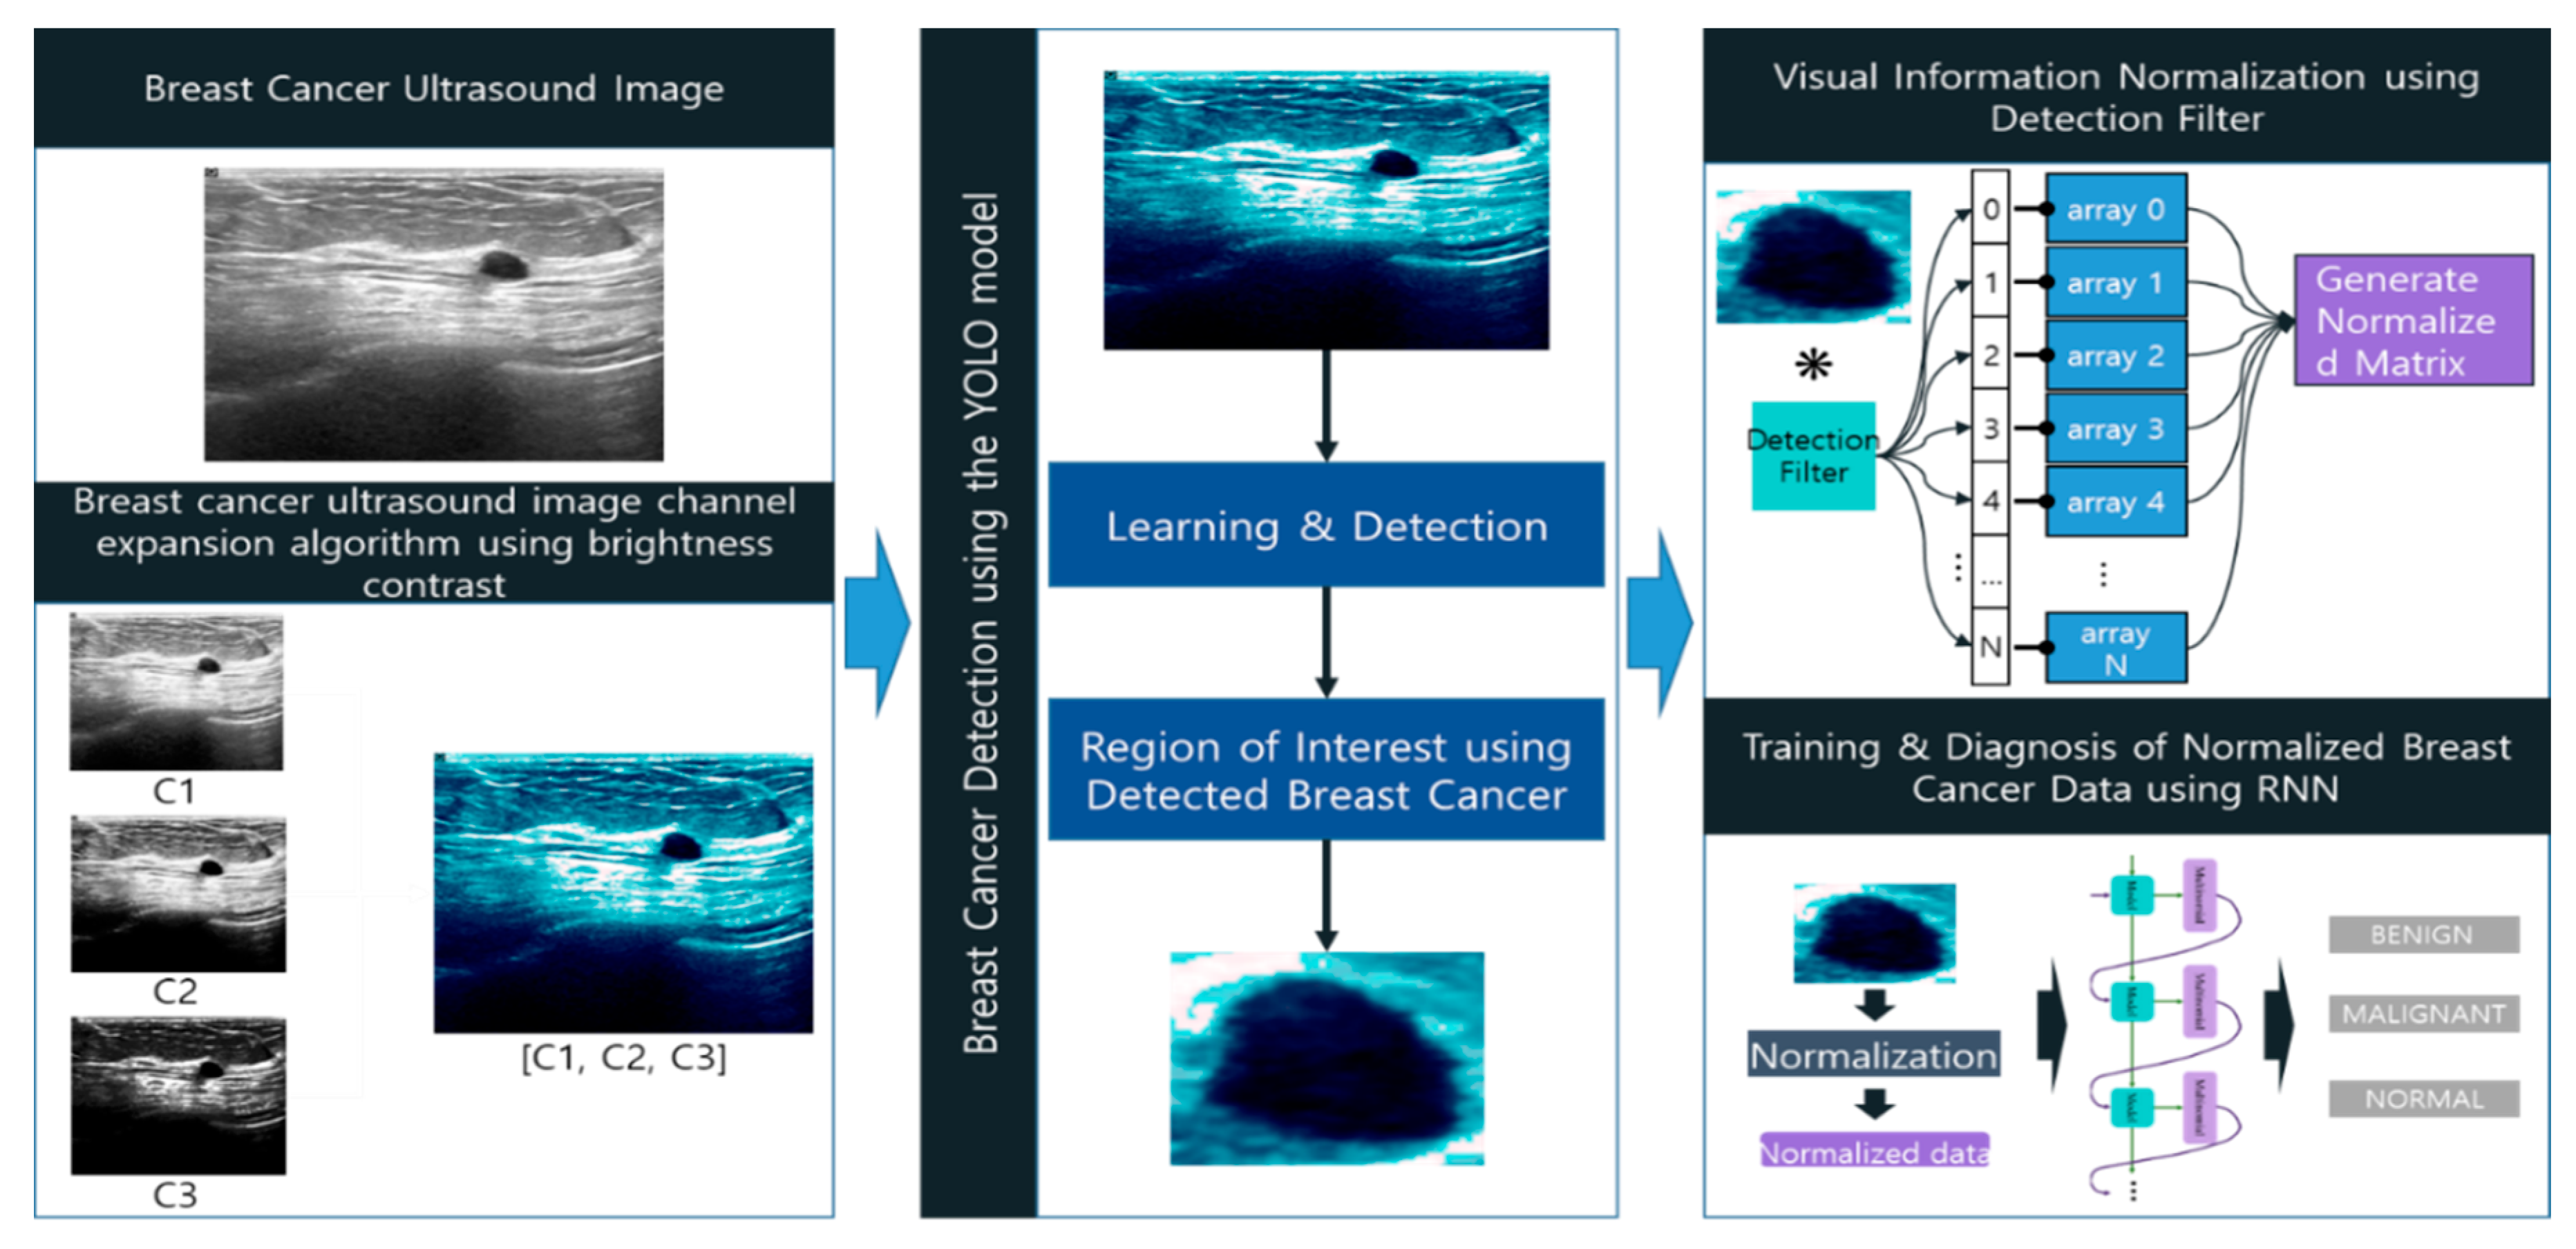
3. Breast Cancer Diagnosis Model Based on Image Channel Expansion and Visual Pattern Standardization Algorithm

Breast ultrasound images are data generated by radiating an ultrasonic signal and converting a reflected and projected signal into a brightness value. It shows strong noise with respect to brightness. Since medical images show a relatively high resolution, the diagnosis process through the learning model requires high-performance hardware. Brightness noises can cause degradation of detection performance, and high resolution causes a high-computational problem that requires high-speed processing of many operations at once, a chronic problem of AI models. Therefore, this paper proposes a multi-model-based image channel expansion and visual pattern standardization algorithm for breast cancer diagnosis to solve the problem. The proposed model strengthens the boundary domains in the breast ultrasound images through channel expansion and makes the ultrasound images clearer by using a number of weak noise removal techniques. It applies the expanded data to the YOLO model to improve the lesion detection performance, and the detected lesion image is processed into reduced data through normalization using visual information. The reduced data has a size of 16 × 16 and directionality. The reduced data is used as an input to the RNN model to diagnose the type of breast cancer. Figure 2 shows the processing of the multi-model-based image visual pattern standardization and dimensionality reduction algorithm proposed in this paper. The processing is divided into the YOLO-based lesion detection process, image dimension reduction process, and learning process. Image channel expansion and preprocessing are performed in the YOLO-based lesion detection process. It effectively removes the noise of the breast ultrasound image and improves the detection performance of YOLO through a preprocess to strengthen the internal boundaries. The channel expansion is performed through histogram normalization, brightness equalization through brightness range adjustment, and brightness area control through a threshold to widen the gap between the brightness domains in the image. The LFA-learn process conducts the breast cancer diagnosis through an RNN model designed to learn LFA data.

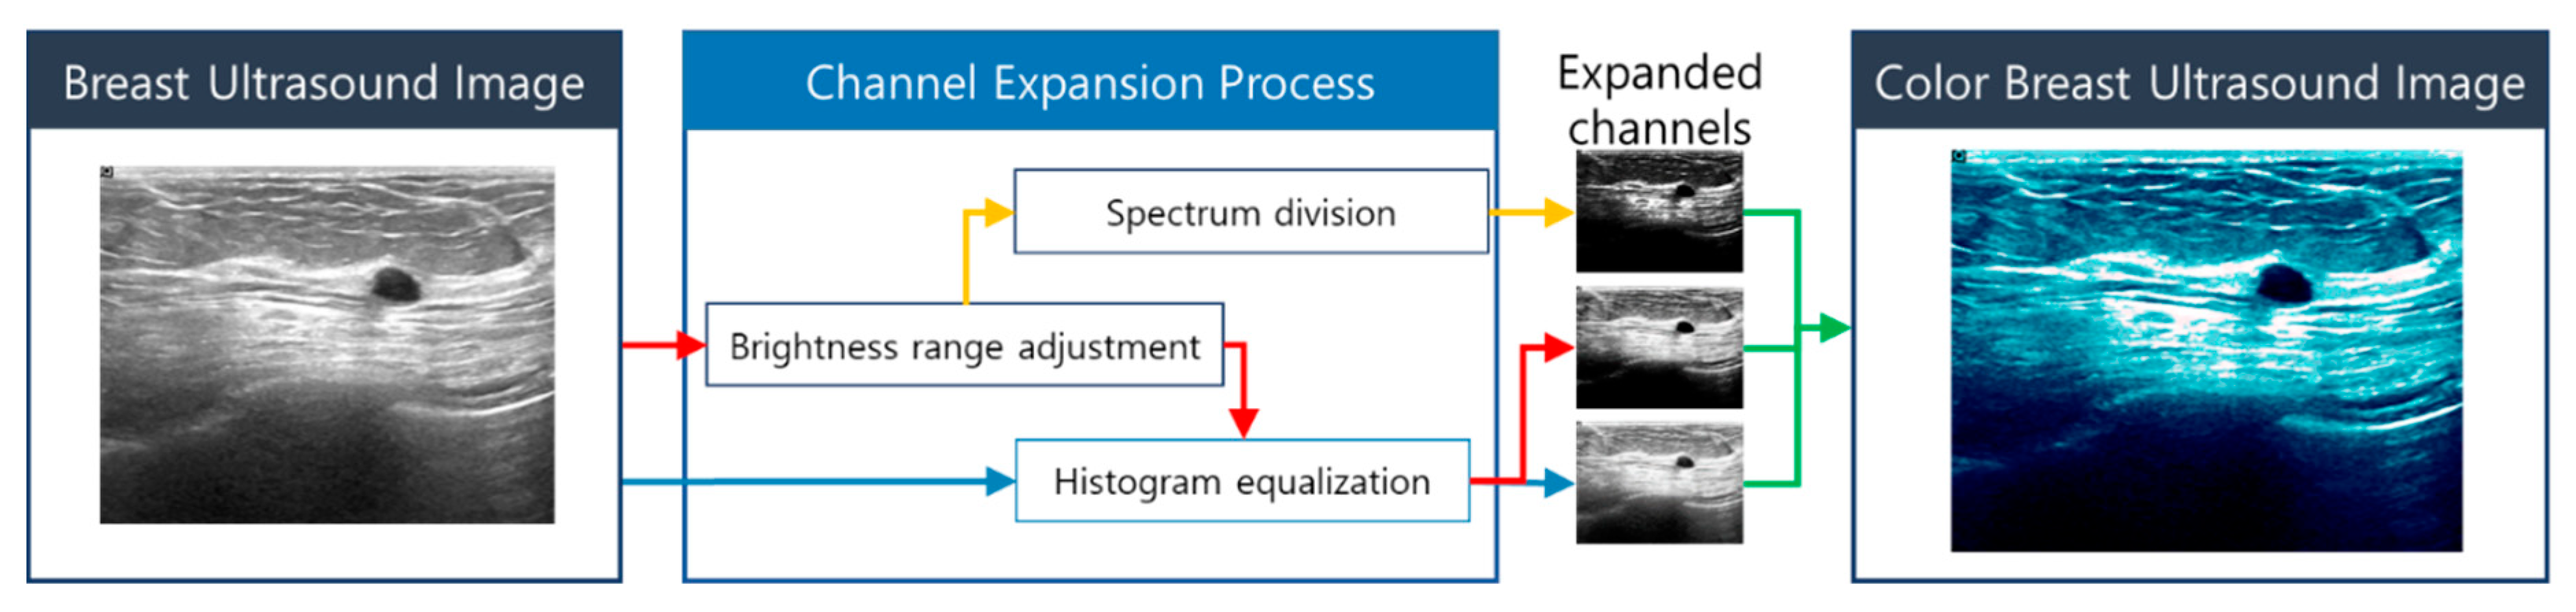
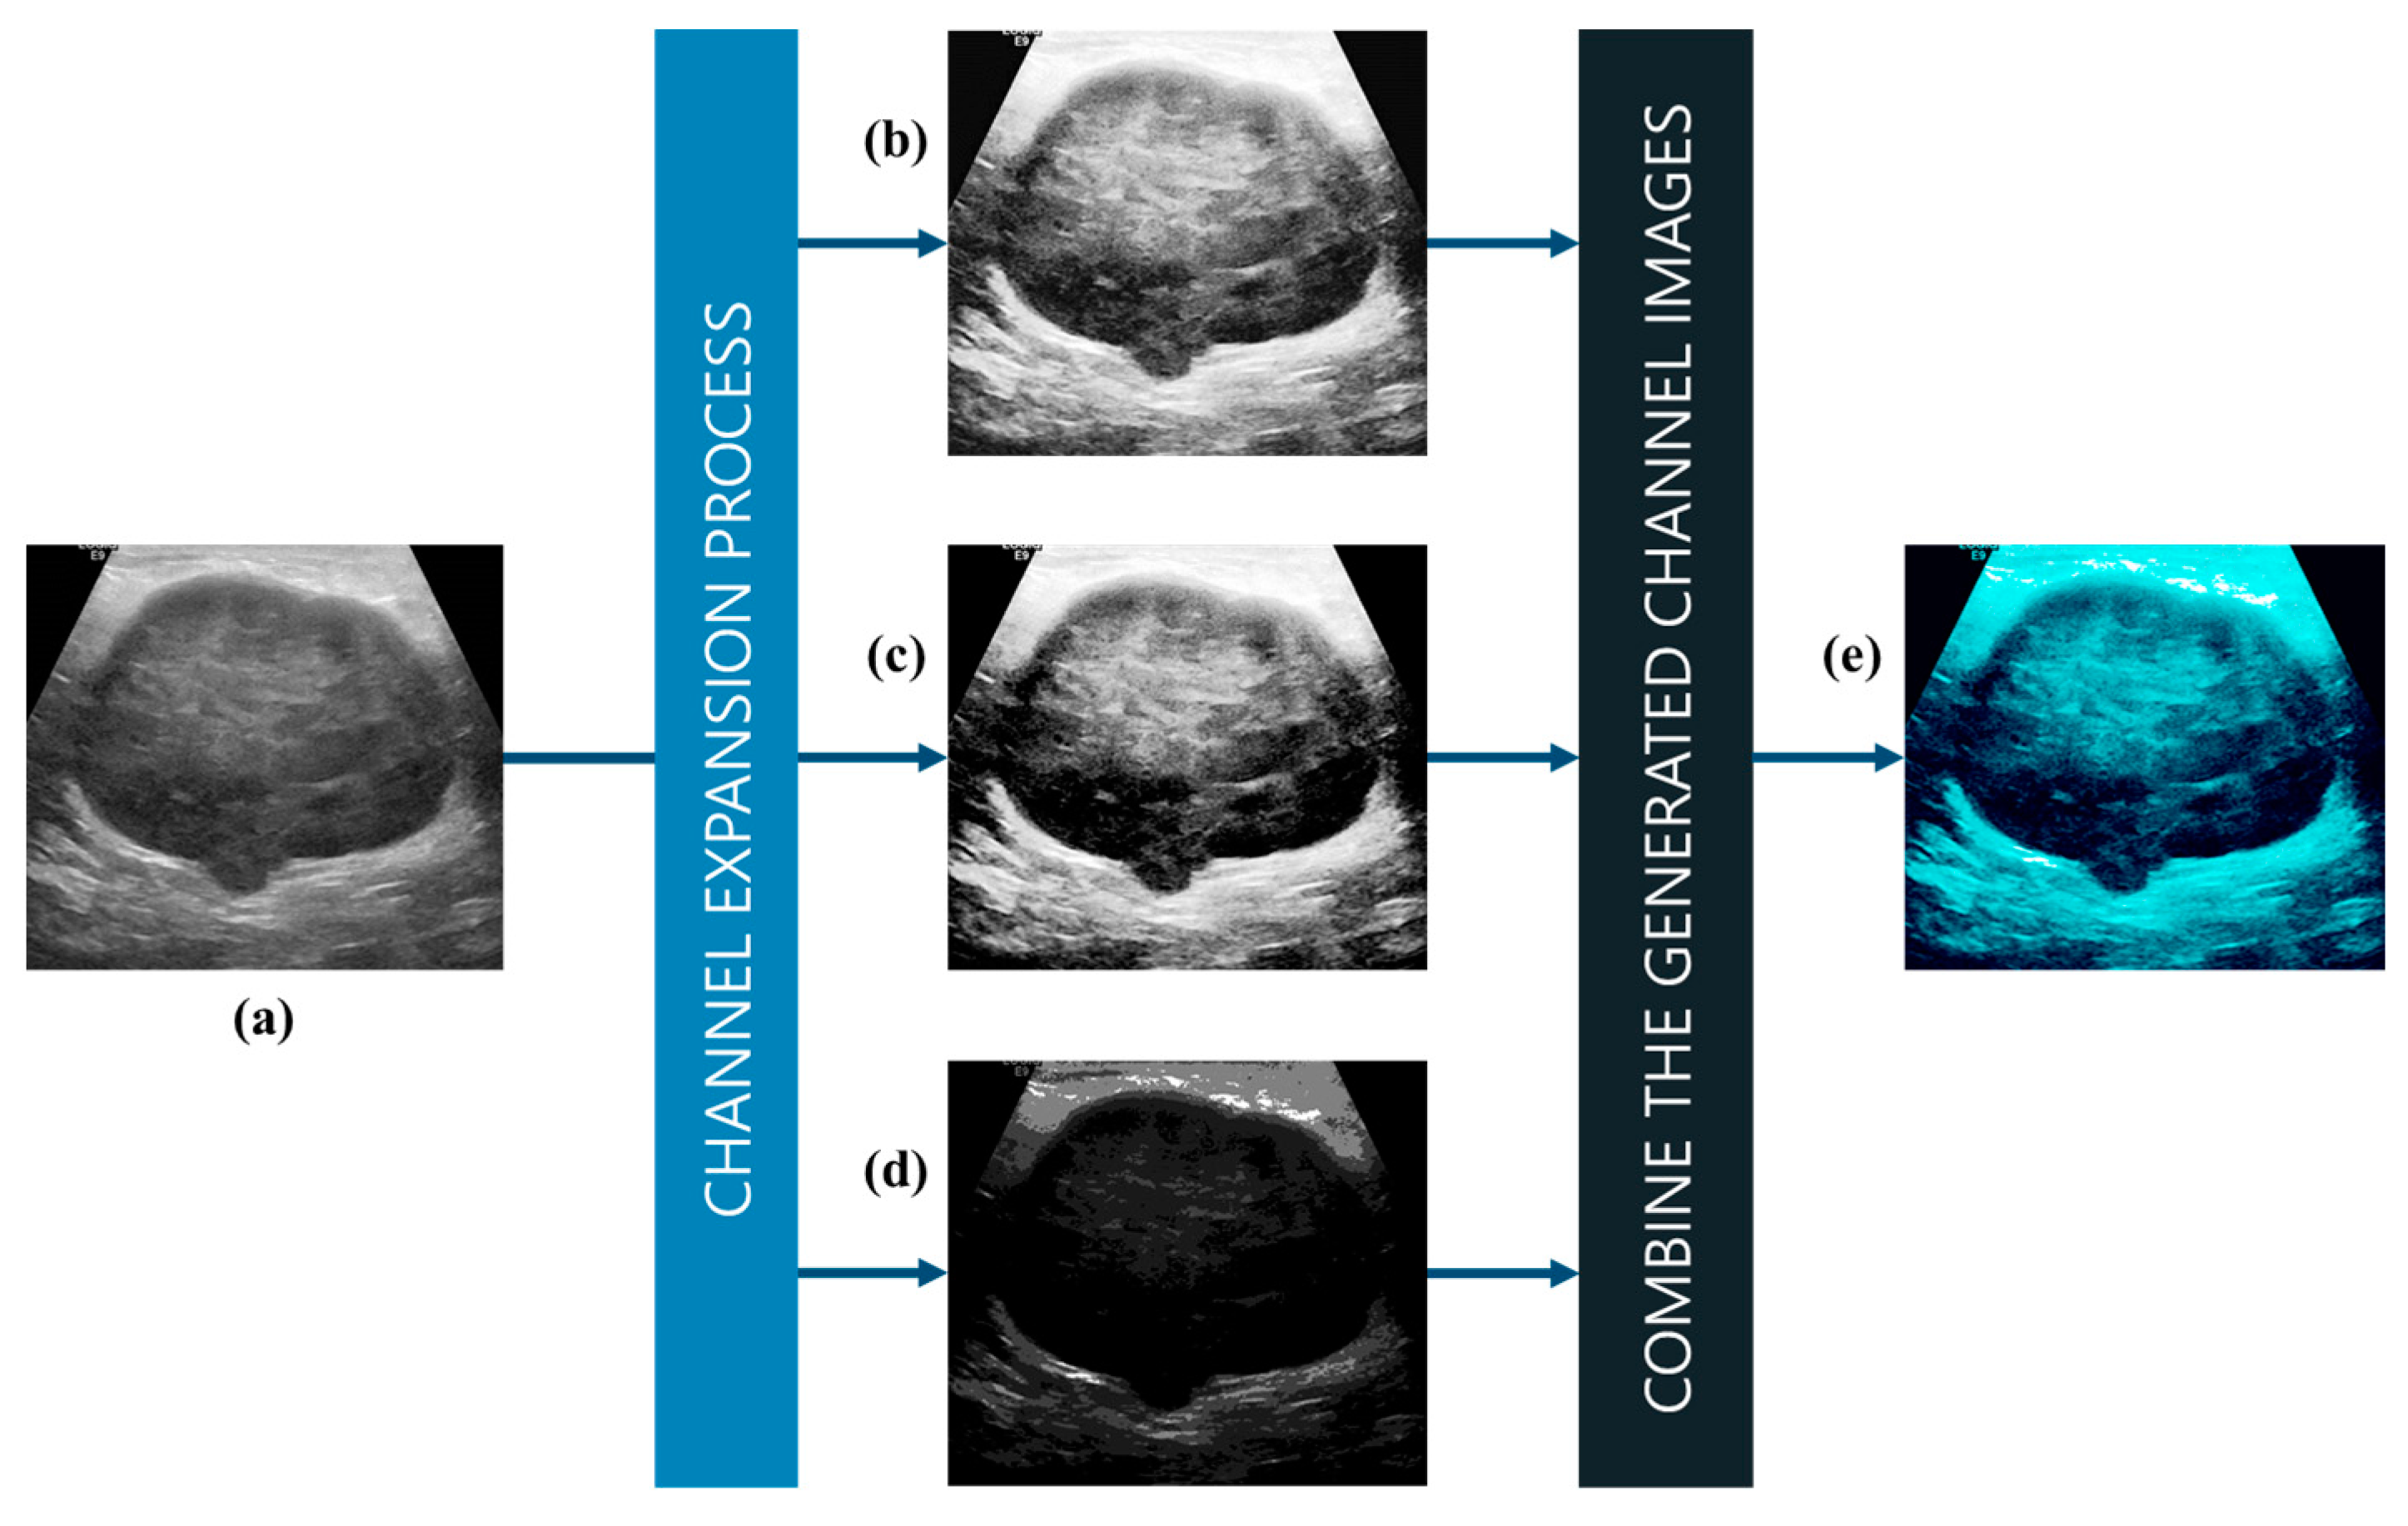
3.1. Multi-Model-Based Breast Cancer Ultrasound Image Channel Expansion

The breast ultrasound image consists of data created by radiating an ultrasonic signal and then converting the reflected signal into a brightness expression range. It is a single channel having only a brightness value. These images have many noises and a high contrast, and the boundary regions are blurry. Figure 3 shows information about benign, malignant, and normal breast ultrasound images. These three images show the overall contrast of the dark areas and the light areas, but the boundaries between the areas are mostly blurry. It can easily detect tumors if the shapes of the lesions are clearly expressed in the breast ultrasound image, but it is generally difficult to detect lesions because their boundaries are blurry, and thus the lesions are indistinguishable from the surrounding area. Moreover, these images generally generate heavy noises, which can degrade the performance of the classifier and detector. Therefore, in this paper, the breast ultrasound images are preprocessed to clarify the boundary of the lesion by removing noises.
Figure 4 shows the channel expansion process to enhance image boundaries. It is a method of enhancing the boundaries of the internal regions by increasing the brightness contrast of the ultrasound image. It creates three channels through the process shown in Figure 4.

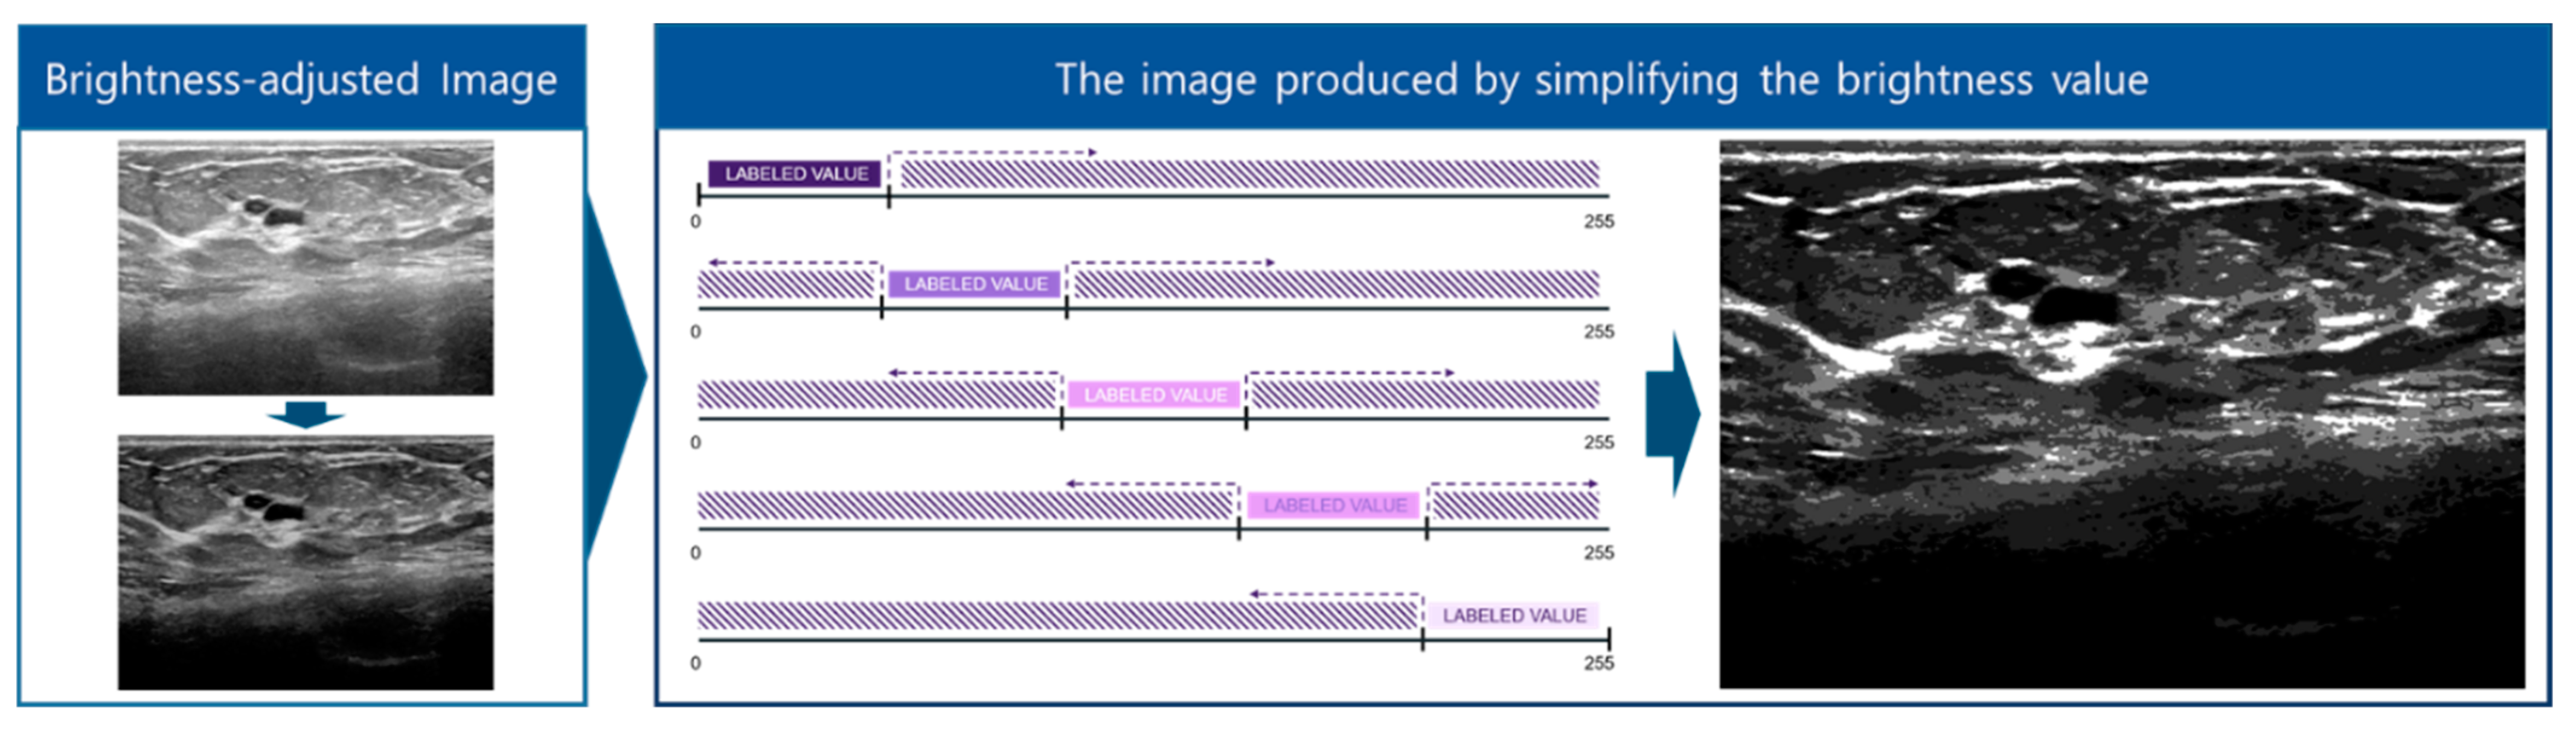
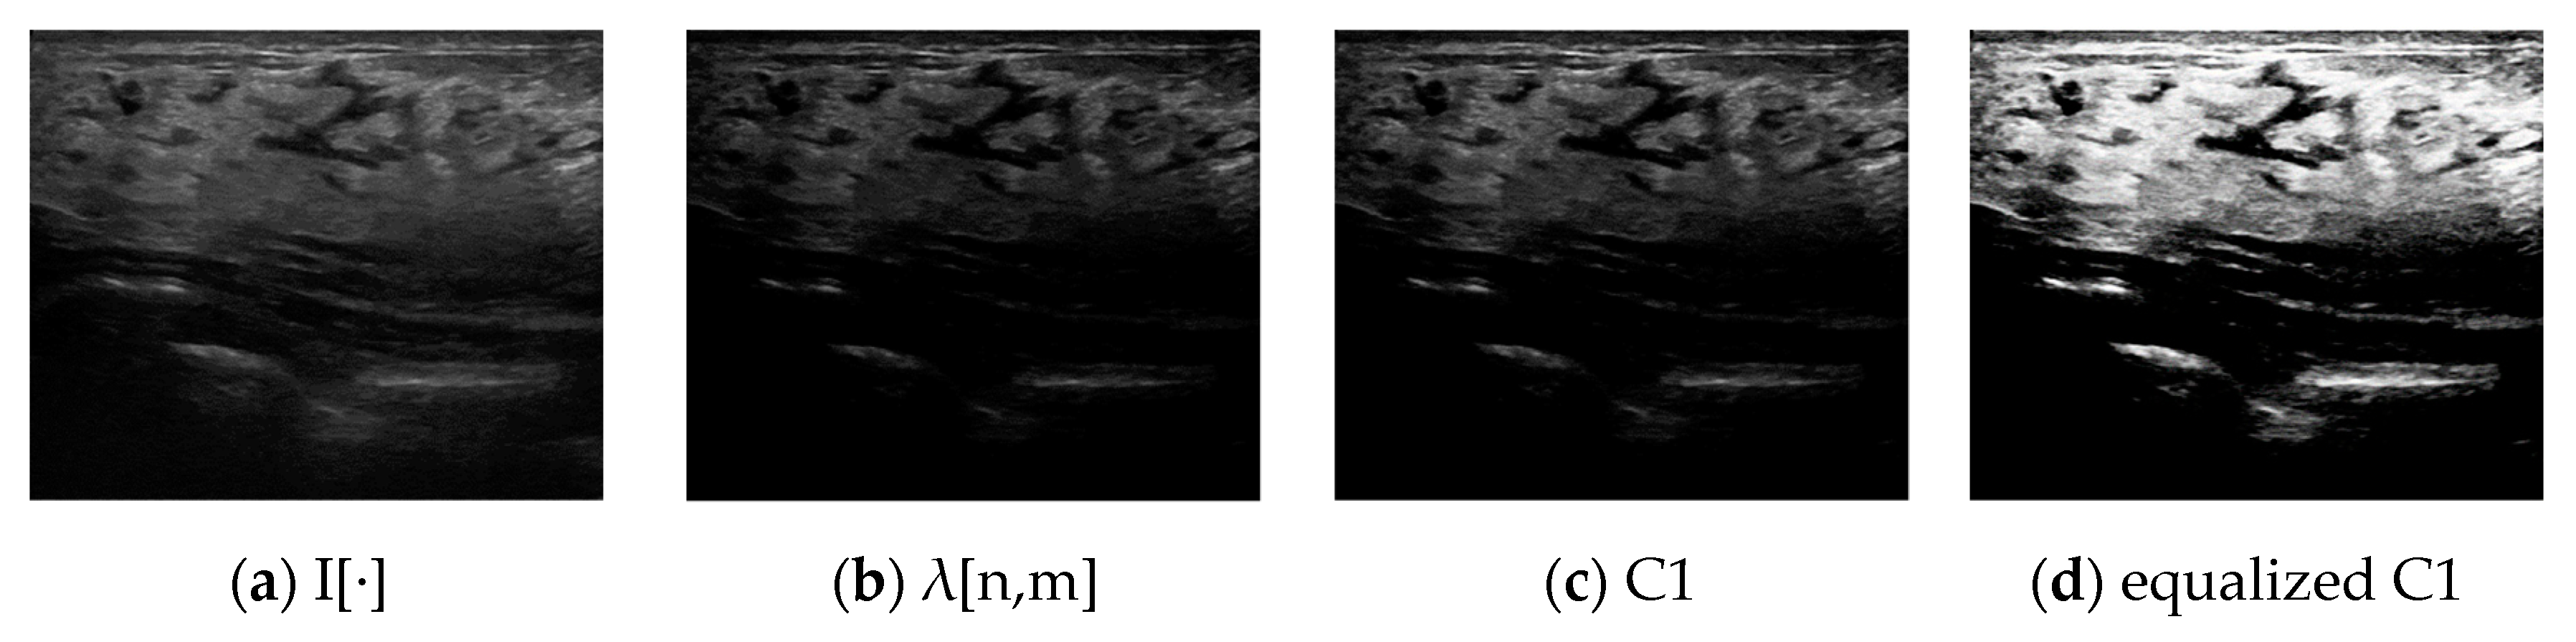
3.1.1. Adjustment of the Brightness Range to Remove Noise in Breast Cancer Images

The breast ultrasound images are created by converting the reflected ultrasound signals into brightness values ranging from 0 to 255. Since a reflected signal has the maximum brightness of 255 only when it is a very strong signal, it contrasts with the ultrasound image with low brightness. Therefore, we adjusted the brightness value of the ultrasound image to reconfigure the image brightness values. Equation (1) is for adjusting the brightness range.
γ = M I N ( I [ · ] ) + S T D ( I [ · ] ) λ [ n , m ] = n = 0 N m = 0 M { I [ · ] γ ,     I [ · ] γ 0           0 ,   I [ · ] γ < 0 C 1 = ( λ [ · ] / M A X ( λ [ · ] ) ) 255
Equation (1) is an adaptive adjustment of the brightness range in the breast ultrasound image and calculates the minimum value and standard deviation of the input image, I[∙], to calculate γ. γ is a variable for removing the weak brightness region in the image. The range of the weak brightness area is calculated by adding the standard deviation to the minimum value. The standard deviation is a value that can identify the distribution of all the brightnesses. The brightness difference is high if the standard deviation is large and insignificant if the standard deviation is small. We adjusted the threshold value for the weak brightness area according to the brightness difference of the image. If the difference between γ and I [ n , m ] was positive, we applied I [ n , m ] -γ to lower the brightness value and applied 0 if the difference was negative. Figure 5 shows the images calculated in the brightness range processing: (a) is the original image I [ · ] ; (b) is λ[∙] removed from a weak brightness area through γ; (c) is C1, which converted the reduced brightness range of λ[∙] with the general brightness range (0–255); and (d) is the image of the histogram equalization applied to C1.
The original image in Figure 5a shows blurry pixels, including noises, in the low-brightness area, and they also occur in the middle of the bright area. Image (b) shows the bright areas obtained by removing noises and blurry pixels in the dark area through γ . The maximum brightness of the image in (b) has the value reduced by γ . The image in (c) is produced by raising it back to the normal brightness range. In that case, only the area of a similar brightness as I [ · ] is emphasized. The image in (d) is obtained if the entire brightness area is normalized through the histogram equalization.

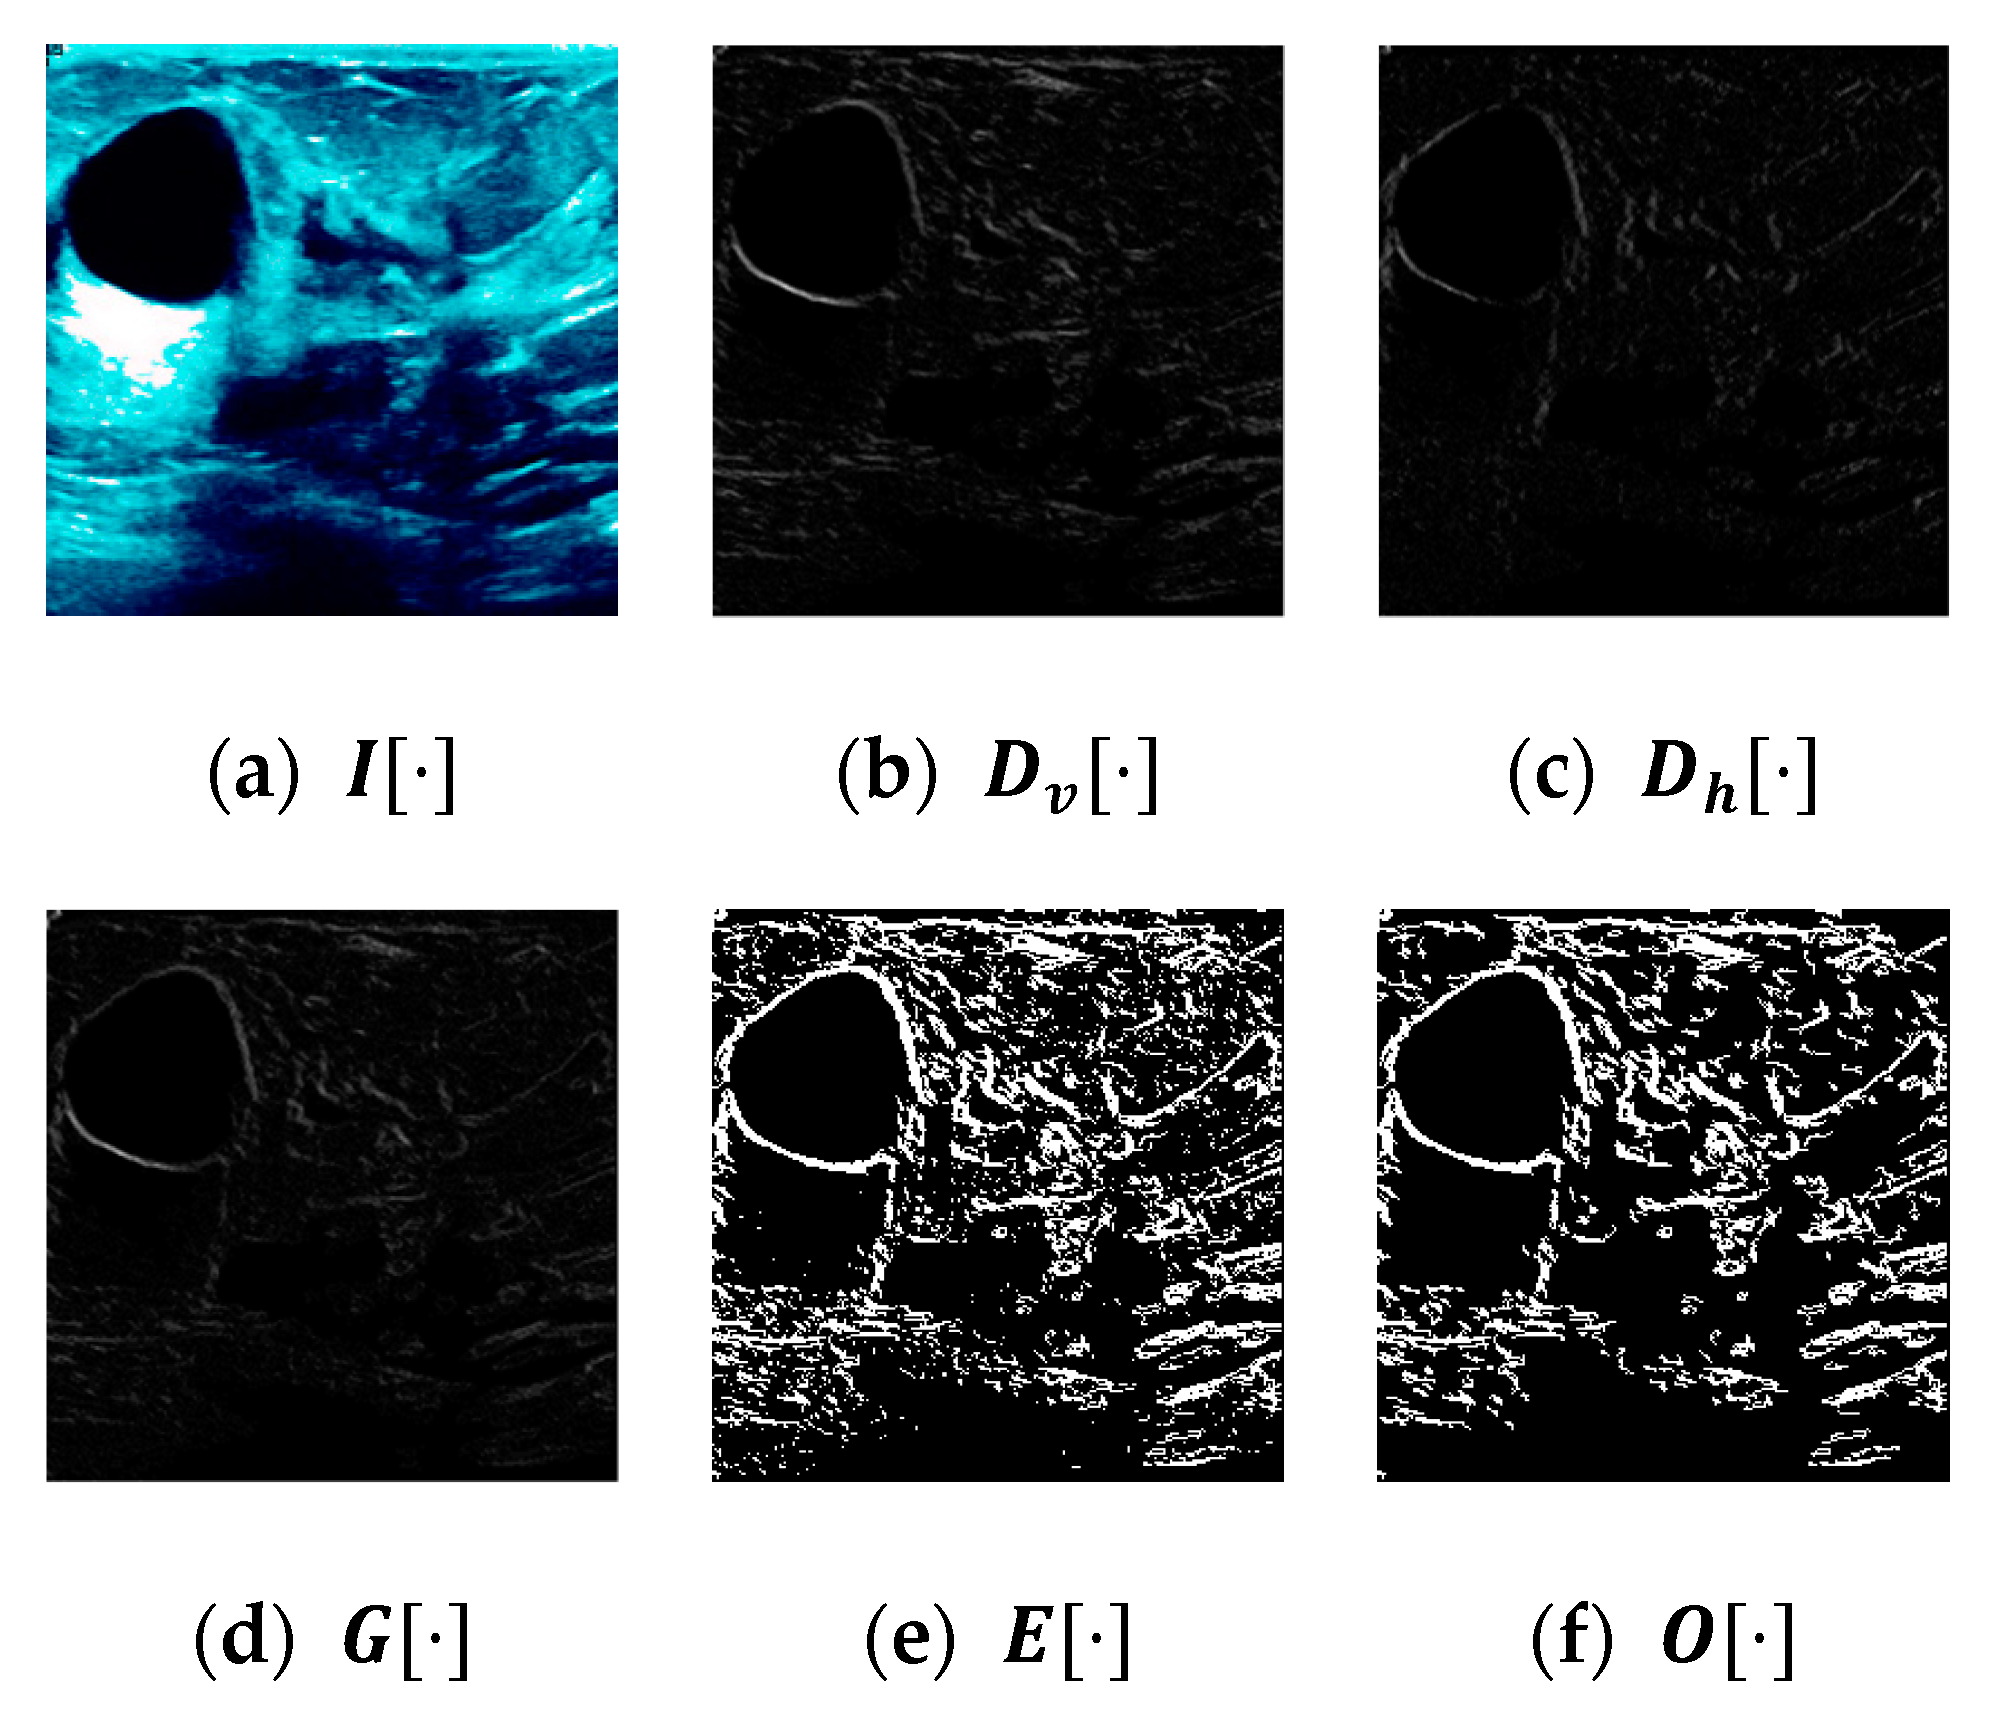
3.1.2. Spectrum Division to Enhance the Border Regions of Breast Cancer Images

Figure 5c is used to simplify the brightness range of C 1 through Equation (1). This process simplifies the brightness range of 0 to 255 to 5 levels, clarifying the boundaries between areas. Algorithm 1 shows the process of simplifying the brightness range. SPECTRUMAREA of Algorithm 1 is a variable that sets the threshold value to be separated in the range of 0–255. In this algorithm, it is divided into N levels, and N = 5 is set. It is because of the brightness range of each level. In general, in an image composed of unit type, the number of cases calculating the maximum brightness of 255 without any remaining value is 8, and we set it to 5 to have the most appropriate size through experiments. The brightness values distributed in the input are compared using the calculated SPECTRUMAREA.
Algorithm 1 Brightness Spectrum Division Algorithm
Input: x
def Extraction of Feature:
 LABEL = [0,2,4,8,16]
 SPECTRUMAREA = 255//N
 fori from 0 to LEN(LABEL) do
  S = copy(x)
  S[SPECTRUMAREA xi > S] = 0
  S[SPECTRUMAREA x(i+1) < S] = 0
  S[S != 0] = LABEL[i]
  S = ((S/MAX(LABEL)x255)
  Y += S
Output: Y
Figure 6 shows the image produced by simplifying the brightness value. It is the LABELING by classifying the image produced through brightness adjustment into SPECTRUMAREA. Each label consists of 0, 2, 4, 8, and 16, and they are the values set by the following processing. Labeled data should be converted to values ranging from 0 to 255, which is a typical brightness range, to emphasize the brightness region. At this time, the values marked by each label using the values configured with 2 n to increase the gap of the labeled values generally show a high gap when they are converted to a brightness range. The process can obtain the boundary region more segmented than the boundary region emphasized in (a) by brightness range adjustment and removing the fine noises in the inner region.

3.1.3. Noise Reduction and Channel Expansion through Histogram Equalization

In the next process, the brightness standardization is performed through histogram equalization. Histogram equalization redefines the brightness values distributed in the image, as shown in Equation (2). x and y in Equation (2) refer to coordinates of I [ · ] , and I [ x , y ] denotes a brightness value located at an arbitrary coordinate. i refers to the frequency at which the feature brightness value can appear and has a range of ( 0 l L 1 ). G m a x refers the maximum frequency. N and M are the sizes of I [ · ] . H ( · ) is the histogram before normalization and h ( · ) is a normalized histogram. Equation (2) equalizes I [ · ] and C 1 . The color image of the expanded channel is created by combining the images generated in the above steps into one.
H ( i ) = | { ( x , y ) | I [ x , y ] } = i | h ( i ) = ( G m a x N × M ) × H ( i )
Figure 7 shows the process of generating an expanded channel image through the method proposed in this paper. Figure 7a is the original image, (b) is the original image after histogram equalization, (c) is the image calculated through histogram equalization after adjusting the brightness range, and (d) is the image with the simplified brightness range. The image in (e) is the images of (b), (c), and (d) combined into one. The images with the expanded channel show stronger boundaries than the original image, and the weak and strong brightness areas are clearly distinguishable. The images produced through the process are used as training data for the YOLO model. It detects lesions in the breast ultrasound image, and the detected lesion area can be used in the RNN model through the dimensionality reduction technique.

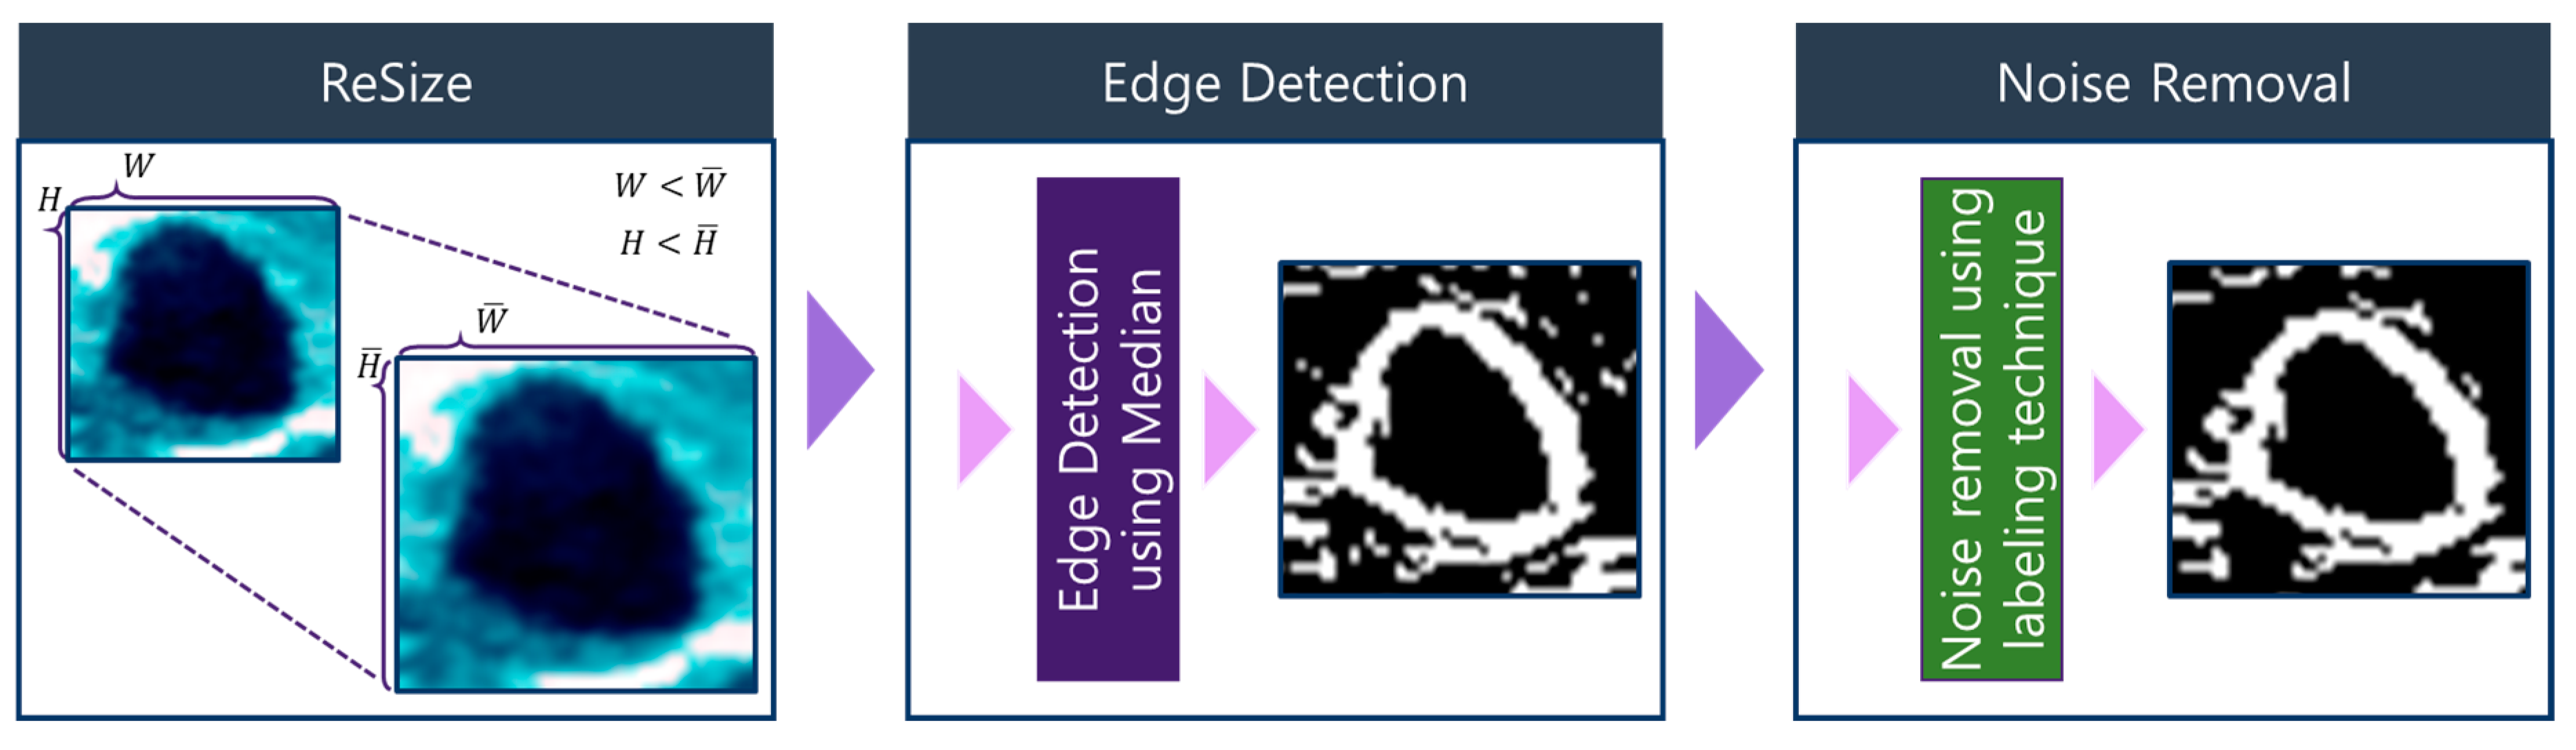
3.2. Visual Pattern Standardization Using Dimensionality Reduction

Even if an expanded channel image with clearer boundaries than the original image is created through the process described in Section 3.1, there may be cases in which accurate analysis may be difficult or even impossible due to resource usage limitations that may occur because of the difference in the capacity of the input image. Moreover, improving the YOLO model’s detection performance requires the image dimensionality reduction [7] and an RNN model to learn it. Figure 8 shows a breast cancer diagnosis model through normalized pattern transformation using RNN-based visual information. It detects the position of the breast tumor through the YOLO model and sets the position as the region of interest (ROI) to extract only the lesion. It uses the predefined detection filter to convert the visual information of the image into a series of normalized patterns. Data normalized through this filter is defined into an N × M matrix used as the input to the RNN model to classify the breast cancer type.

3.2.1. Contour Image Denoising and Image Segmentation

The contour of the breast cancer image identified through YOLO is detected. The contour detection method used in this paper is contour detection through median values using windows. Figure 9 shows the contour detection process. As shown in Figure 9, contour detection and noise removal are performed after changing the size of the detected image. In this paper, the image size is adjusted to be divided into 16 equal parts when the image size is partitioned with N × N . For example, an image sized 256 × 256 is divided into the size 64 × 64 to create 16 partitioned images.
Its purpose is to facilitate calculation in the subsequent process, and after this process, the contour of the detected image is detected through Equation (3).
M [ x , y ] = m e d i a n { I [ x + n , y + m ] ; ( n , m ) A } ( x , y ) Z 2
Equation (3) calculates the median value of the detected image I [ · ] using a window of size n × m . m e d i a n ( ) is a function that calculates the median, and ( x , y ) is an arbitrary coordinate. ( n , m ) and ( x + n , y + m ) have the range of ( n , m ) A and 1 x + n N ,   1 y + m M . The calculated median values generate the contour image G [ · ] after calculating the inclination values for the vertical and horizontal directions through Equation (4). The vertical inclination image D v [ ] and the horizontal inclination image D h [ ] are created through ( x , y + 1 ) present on the vertical line and ( x + 1 , y ) present on the horizontal line based on the arbitrary coordinates ( x , y ) of M [ · ] . | | is an absolute value function, and the two generated inclination images do not represent negative numbers. The grayscale image G [ ] is created by calculating the average of these two inclination images. E [ ] is created through the OTSU binarization algorithm [50] to convert G [ ] into a binary contour image.
G [ x , y ] = D h [ x , y ] + D v [ x , y ] 2 E [ · ] = OTSU ( G [ · ] ) where , D h [ x , y ] = | M [ x , y ] M [ x + 1 , y ] | D v [ x , y ] = | M [ x , y ] M [ x , y + 1 ] |
Figure 10 shows the sequence of the images generated during the contour detection process of the original image without the ROI of the preprocessed image to help understand the noise removal of the inner region.
Figure 10e is an image calculated through the contour detection and binarization process shown above and shows small dot-like noises. We remove the internal small dot-like noises through the labeling algorithm, as shown in Algorithm 2.
Algorithm 2 Labeling Algorithm
Input: X
defLabeling:
 A = X.copy()
 H, W = X.shape[]
 pPut, labelNum, LABEL, CHECK = [], {},0, False
for h from 0 to H do
  for w from 0 to W do
   if A[h, w] is 255:
    pPut.put((h, w))
    while LEN(pPut) > 0 do
     CHECK = True
     n, m = pPut.pop()
     A[n, m] = 0
     if LABEL in labelNum:
      labelNum[LABEL] = labelNum[LABEL].put((n, m))
     for i from 0 to 3 do
      for j from 0 to 3 do
       if A[n+i, m+j] is 255:
        pPut.put((n+i, m+j))
   if CHECK:
    CHECK = False
    LABEL += 1
Output: labelNum

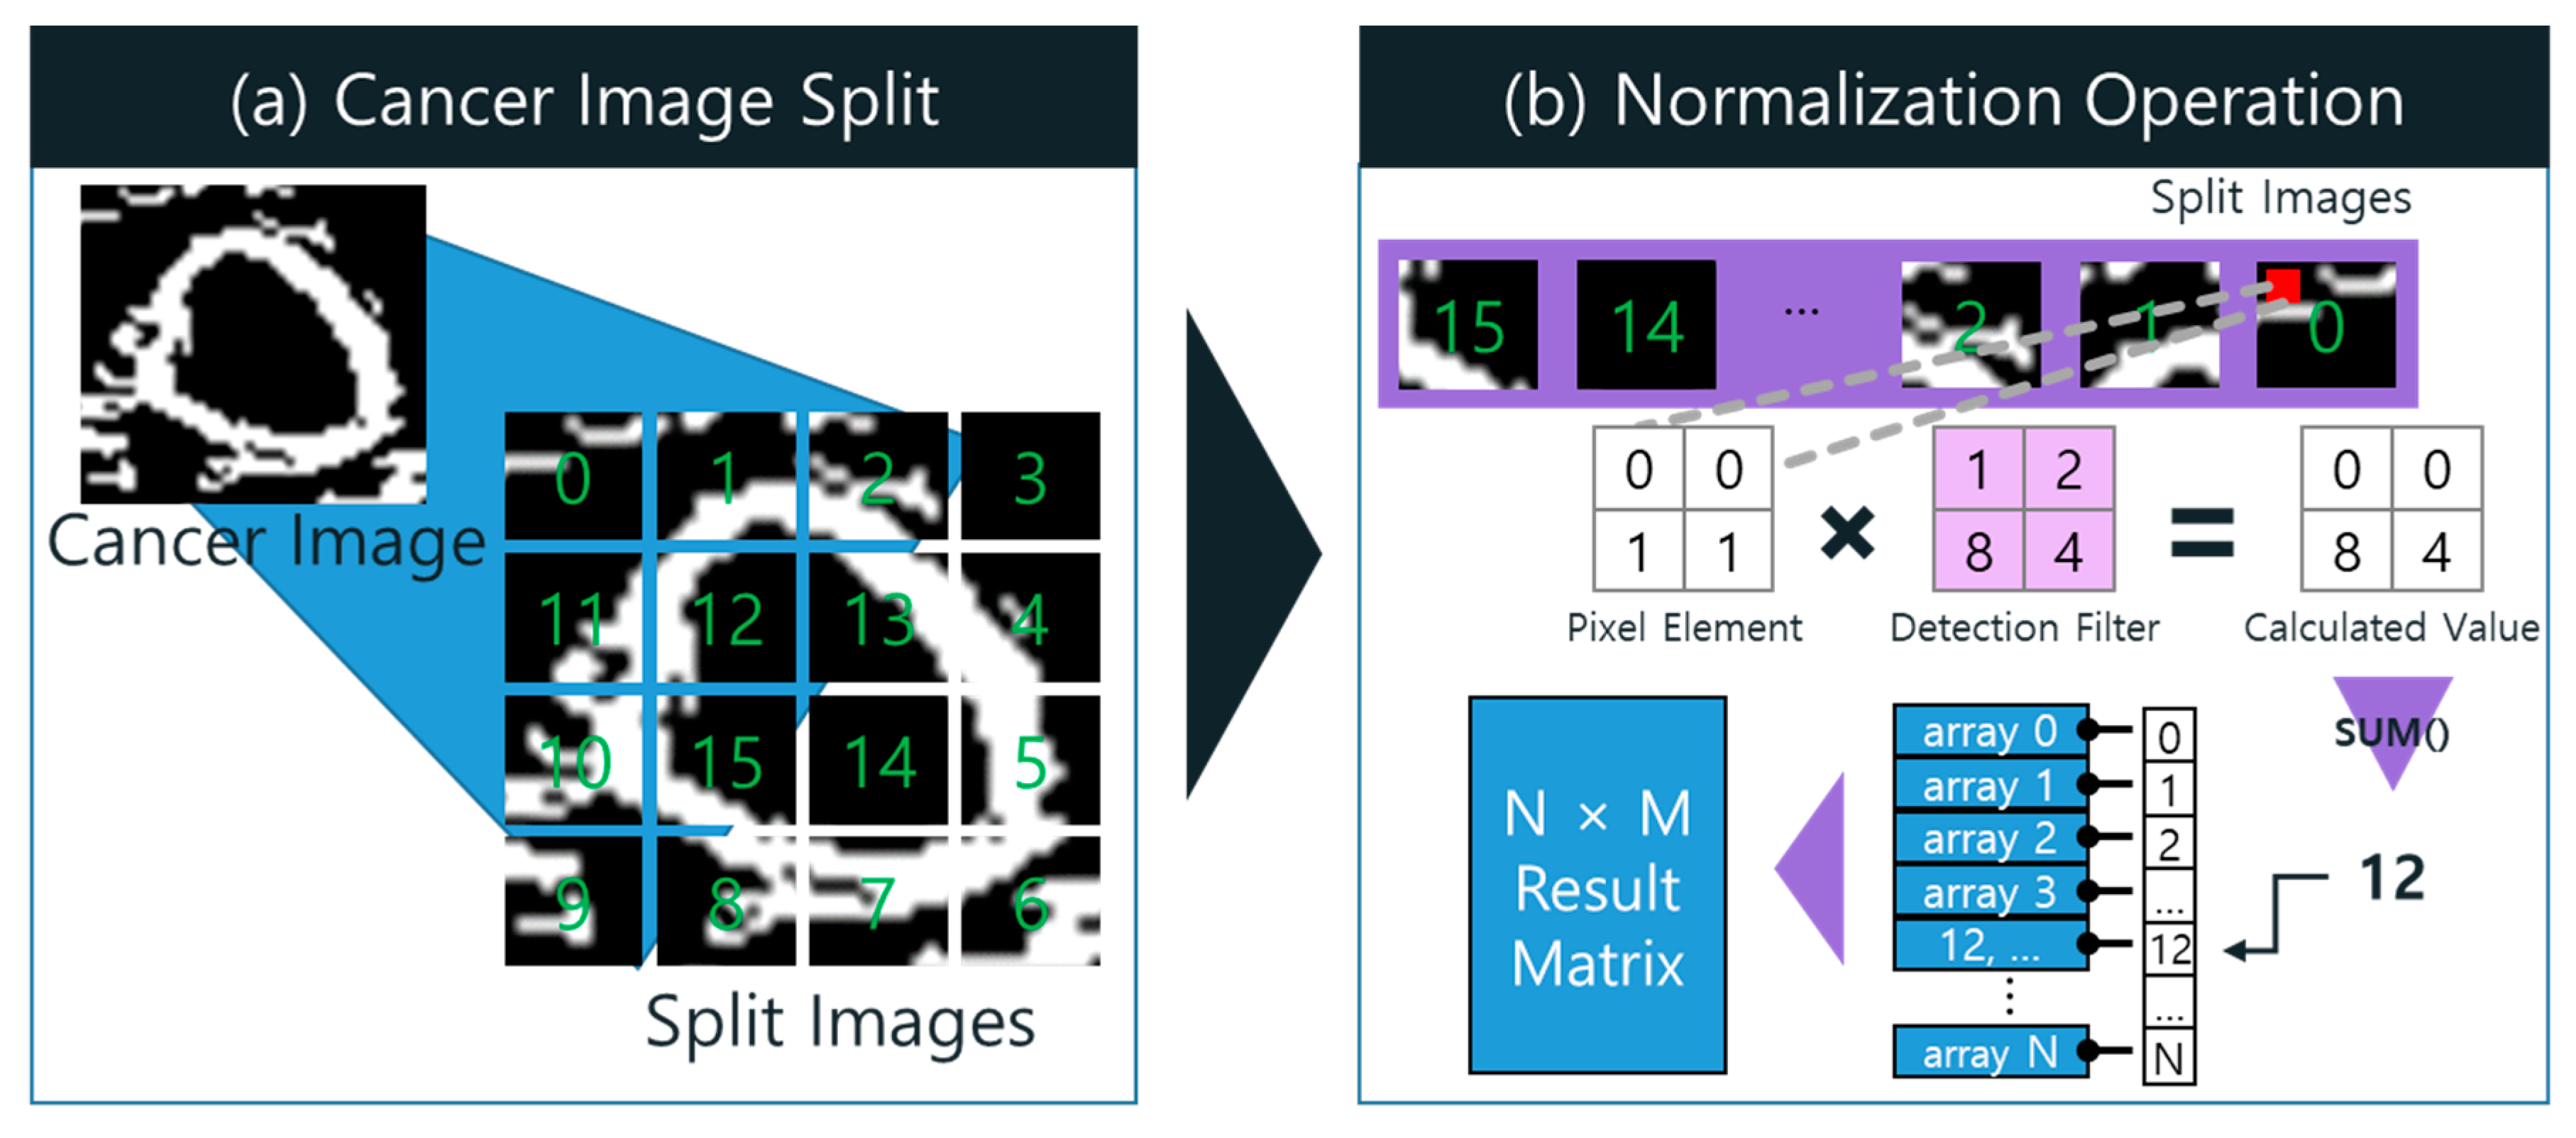
3.2.2. Dimensionality Reduction through Normalization of Visual Information Using Detection Filter

The binary contour detection was performed through noise removal by the ROI of only the area where the lesion was detected in the breast ultrasound image. The calculated binary contour image expresses the lesion shape with a white line. For dimensionality reduction, the type and number of line segments required to express the shape of a specific lesion are aggregated by cumulatively counting information showing the same pattern by normalizing the shape of these lesions into a series of numerical patterns. Figure 11 shows the process of converting visual information into a series of numeric patterns. Figure 11a shows the partition of the lesion image into the size of N × N and 16 ordered small pieces of images. This order becomes the reference for sorting detailed data to calculate the final result. The image sequence is arranged from the outermost to the inner region of the image. It utilizes the fact that human eyes recognize an internal object by recognizing its external (outer) shape. Figure 11b shows the process of converting visual information into a series of numeric patterns for normalization using a detection filter. The detection filter is a filter with the value of 2 N as a coefficient, and the total sum cannot exceed 15. This method obtains a numeric pattern corresponding to the actual pixel count of the image, and when these are summed, different values can be calculated for each visual information. This method applies the engineering method of converting binary numbers to decimal numbers, and the calculated values have the values of 0 x 15 .
Table 1 shows the conversion using a detection filter. Table 1 shows the types and unique numbers of visual information according to the response coefficient of the filter. We used these filters to scan all 16 partitioned images and create a one-dimensional array for each image. This array creates a 16-size 1-D array by counting the visual information expressed in each image using the unique numbers in Table 1. The process creates a small matrix that scales down an image sized N × M into an image sized 16 × 16 . Each row of this matrix is the same as the sequence of the partitioned images in Figure 11. The data reduced in the process is used as an input for the RNN model.

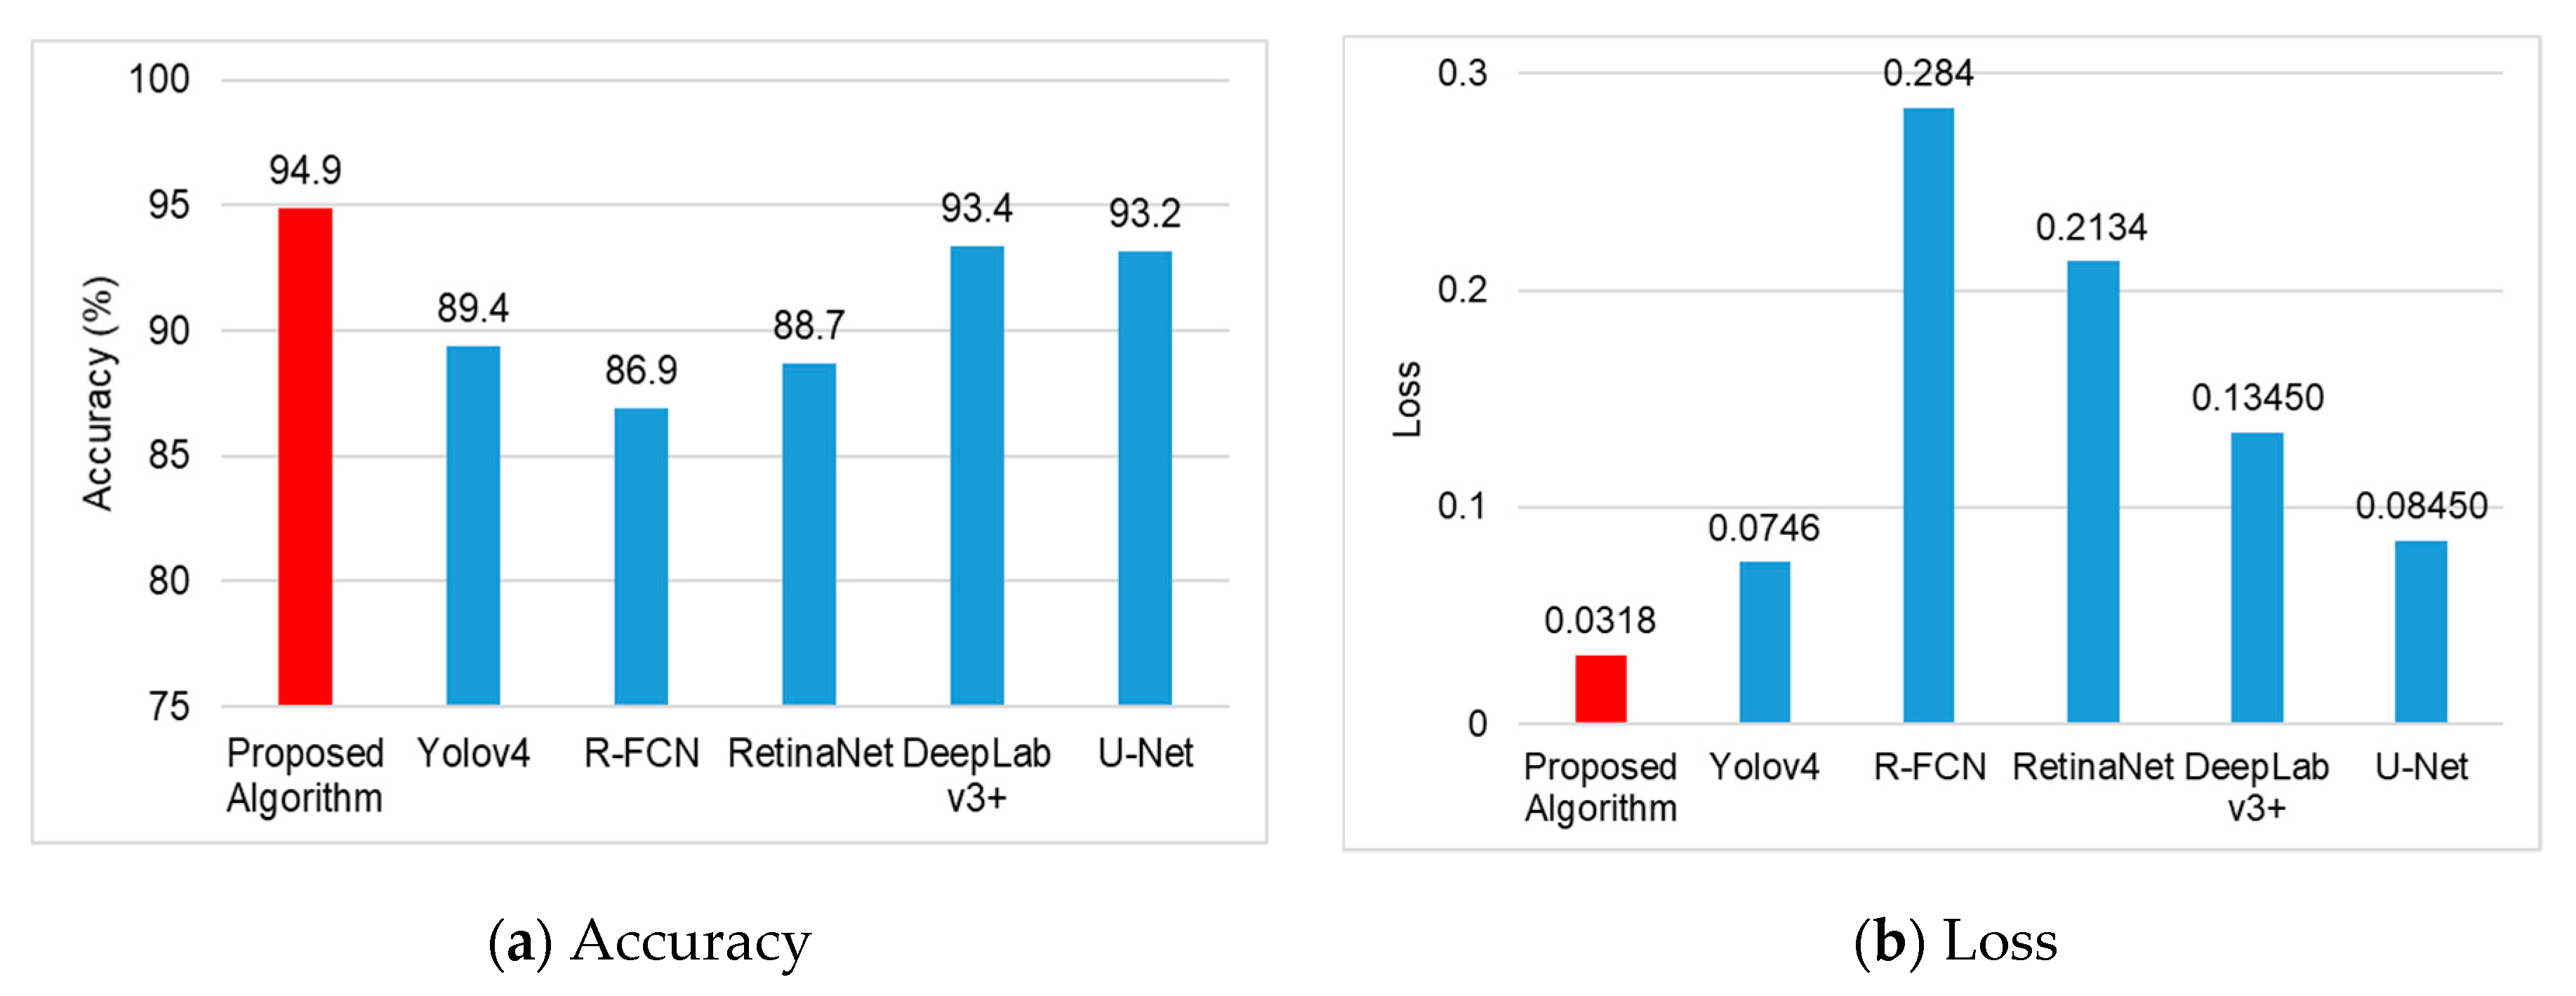
4. Breast Cancer Diagnosis Model Based on Image Channel Expansion and Visual Pattern Standardization Algorithm

This section designs an RNN-based learning model using the images generated through the above process and performs performance evaluation. Table 2 shows the RNN structure proposed in this study.
The structure of the RNN model used in this paper to identify the types of breast tumors is composed of five layers. The input layer is a time series N × N matrix processed through dimensionality reduction that normalizes the visual information of the image into a series of patterns. Such normalized data are classified through two recursive layers, LSTM and Bidirectional-LSTM. The number of nodes in each of the two recursive layers is 512. The reason for using the recursive layer in this paper is that the normalized matrix has a fixed image sequence, as shown in Figure 11 above. The first row corresponds to the outermost part of the partitioned image, and as it moves down, it moves to the inner region of the image. It is because when the human eyes carefully observe an object for the first time, the eyes unconsciously examine the appearance of the object first and then examine the inner area. Accordingly, we set a virtual direction through image partition and sequentially processed the images corresponding to the direction. It is normally performed by the convolution layer also and extracts the image outline, direction, and colors through a filter. This paper creates a reduced matrix that can record directionality and contour information in a single image, as previously performed through the dimensionality reduction method. The first LSTM layer is deployed in the forward direction, and the second LSTM bidirectionally processes data. When the recursive layer is finished, it prevents overfitting through dropout and removes nodes not needed by the calculation. Finally, the breast ultrasound data are classified into benign and malignant using the sigmoid activation function. The algorithm proposed in this study is mainly composed of two methods to ensure accuracy and reliability. The first experiment verifies the breast tumor detection performance, and the second experiment verifies the breast tumor diagnosis performance. The tests were conducted in an MS Windows 10 environment with an Intel Core i7-6700 CPU, RAM 32 GB, and GeForce RTX 2080 Ti. For pre-processing and the production of a learning model, Python 3.6, Keras 2.1, and Tensorflow 2.4 libraries were used, and as auxiliary libraries, Numpy 1.18 and OpenCV 4.1 were used.

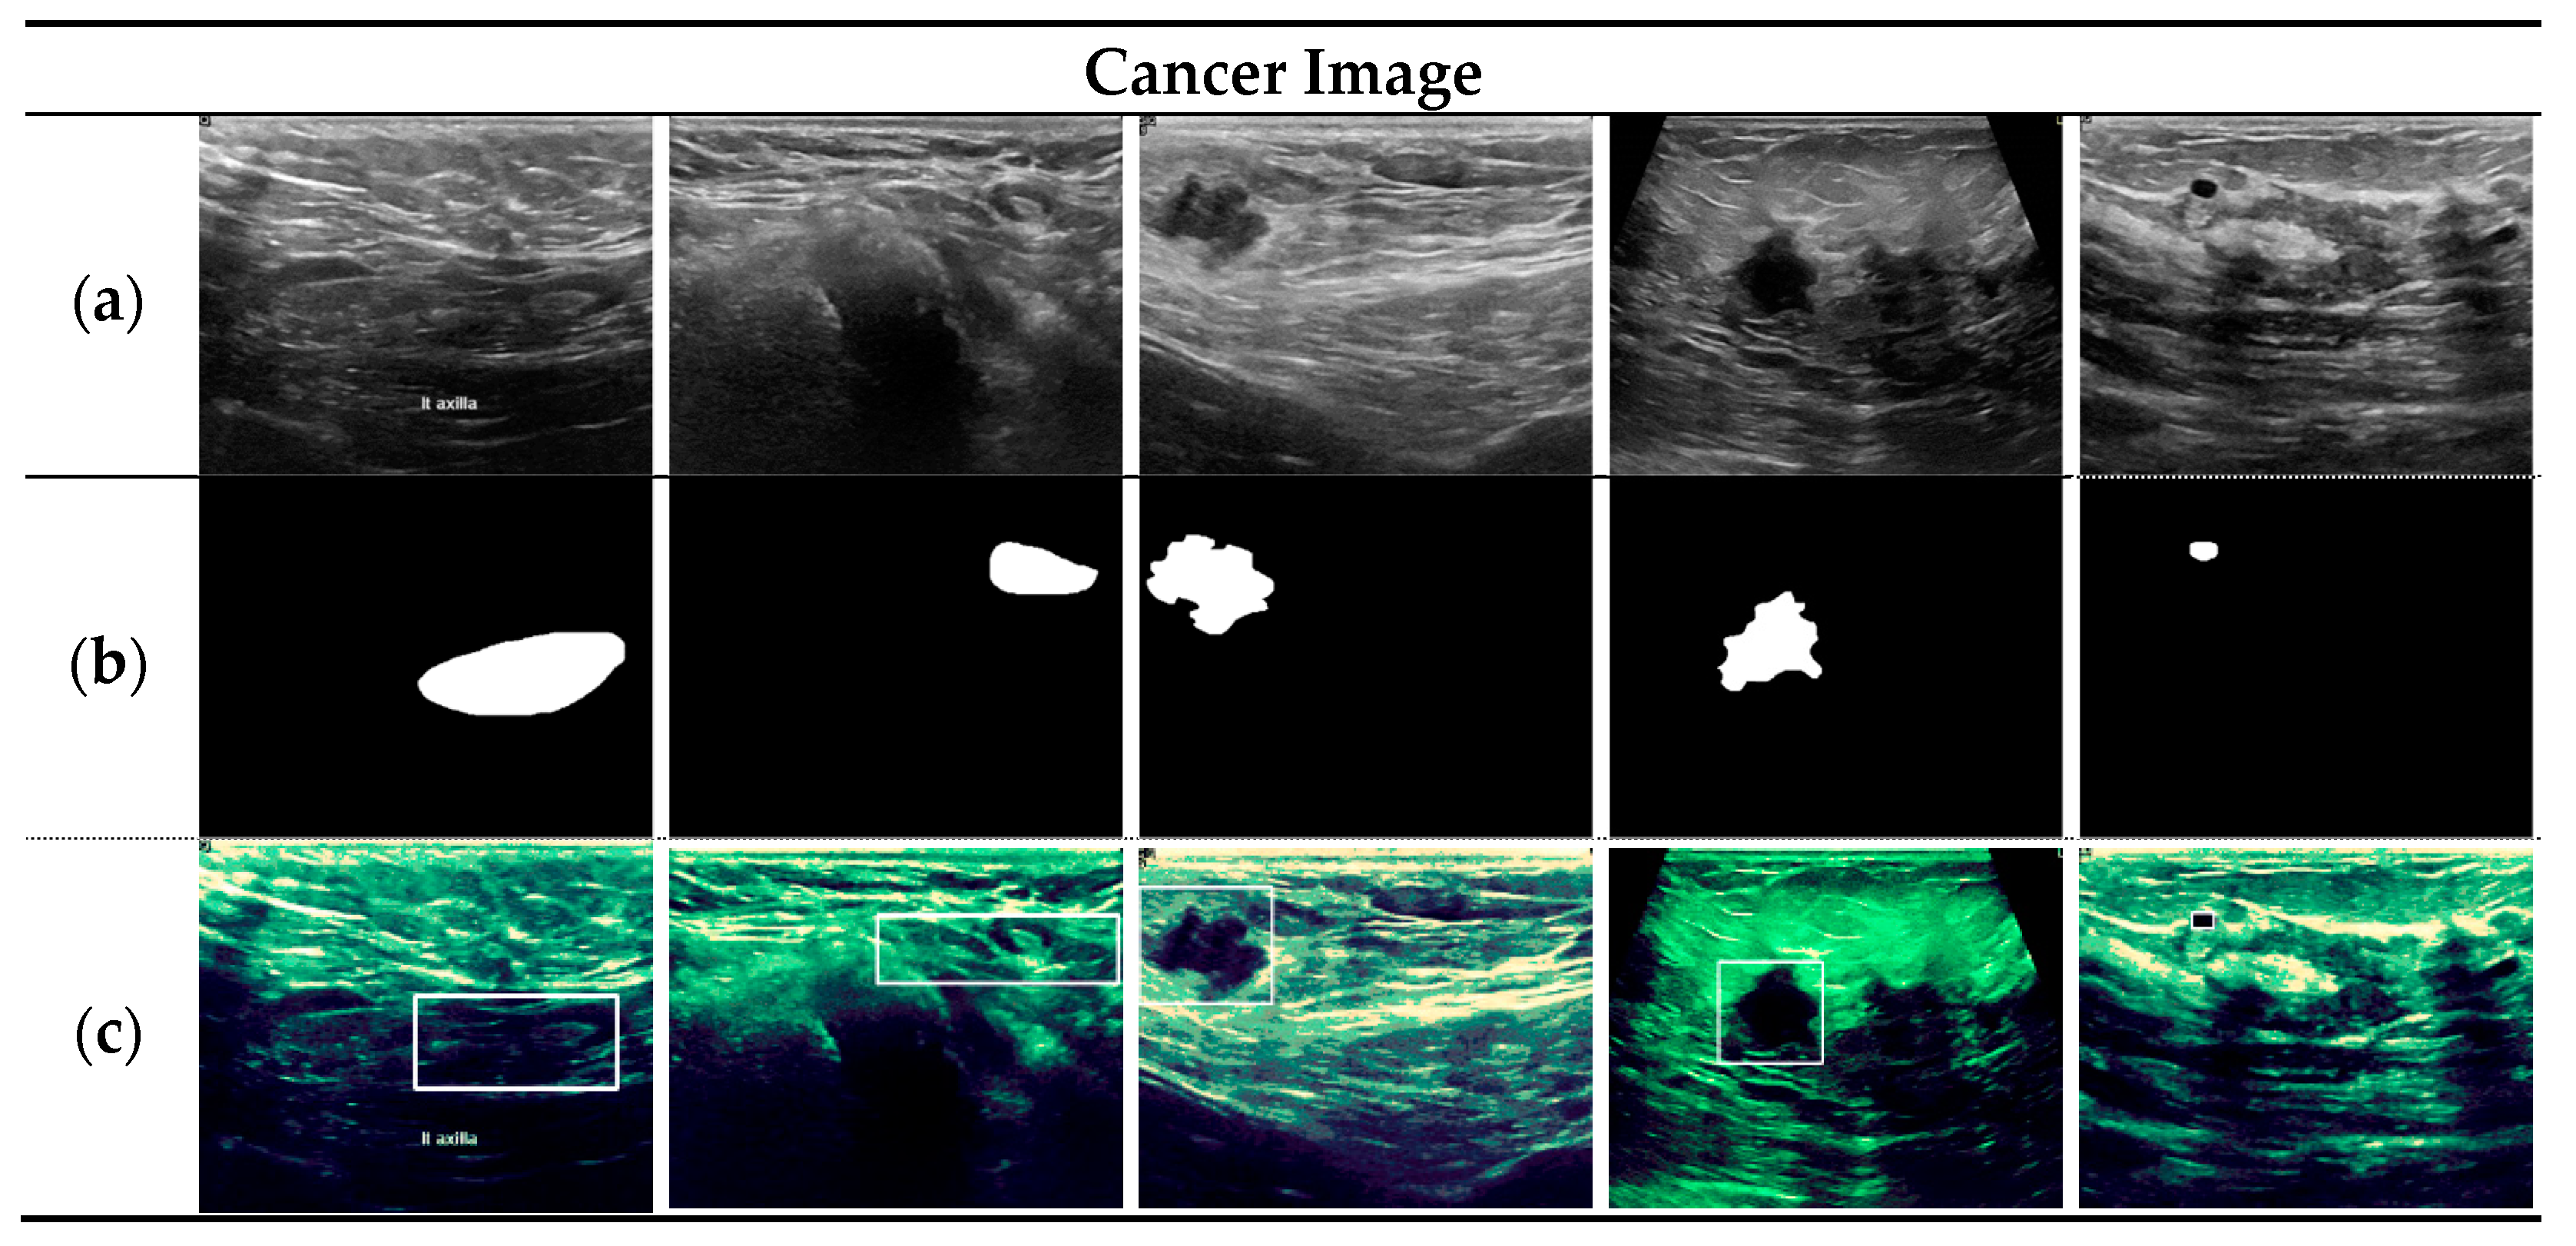
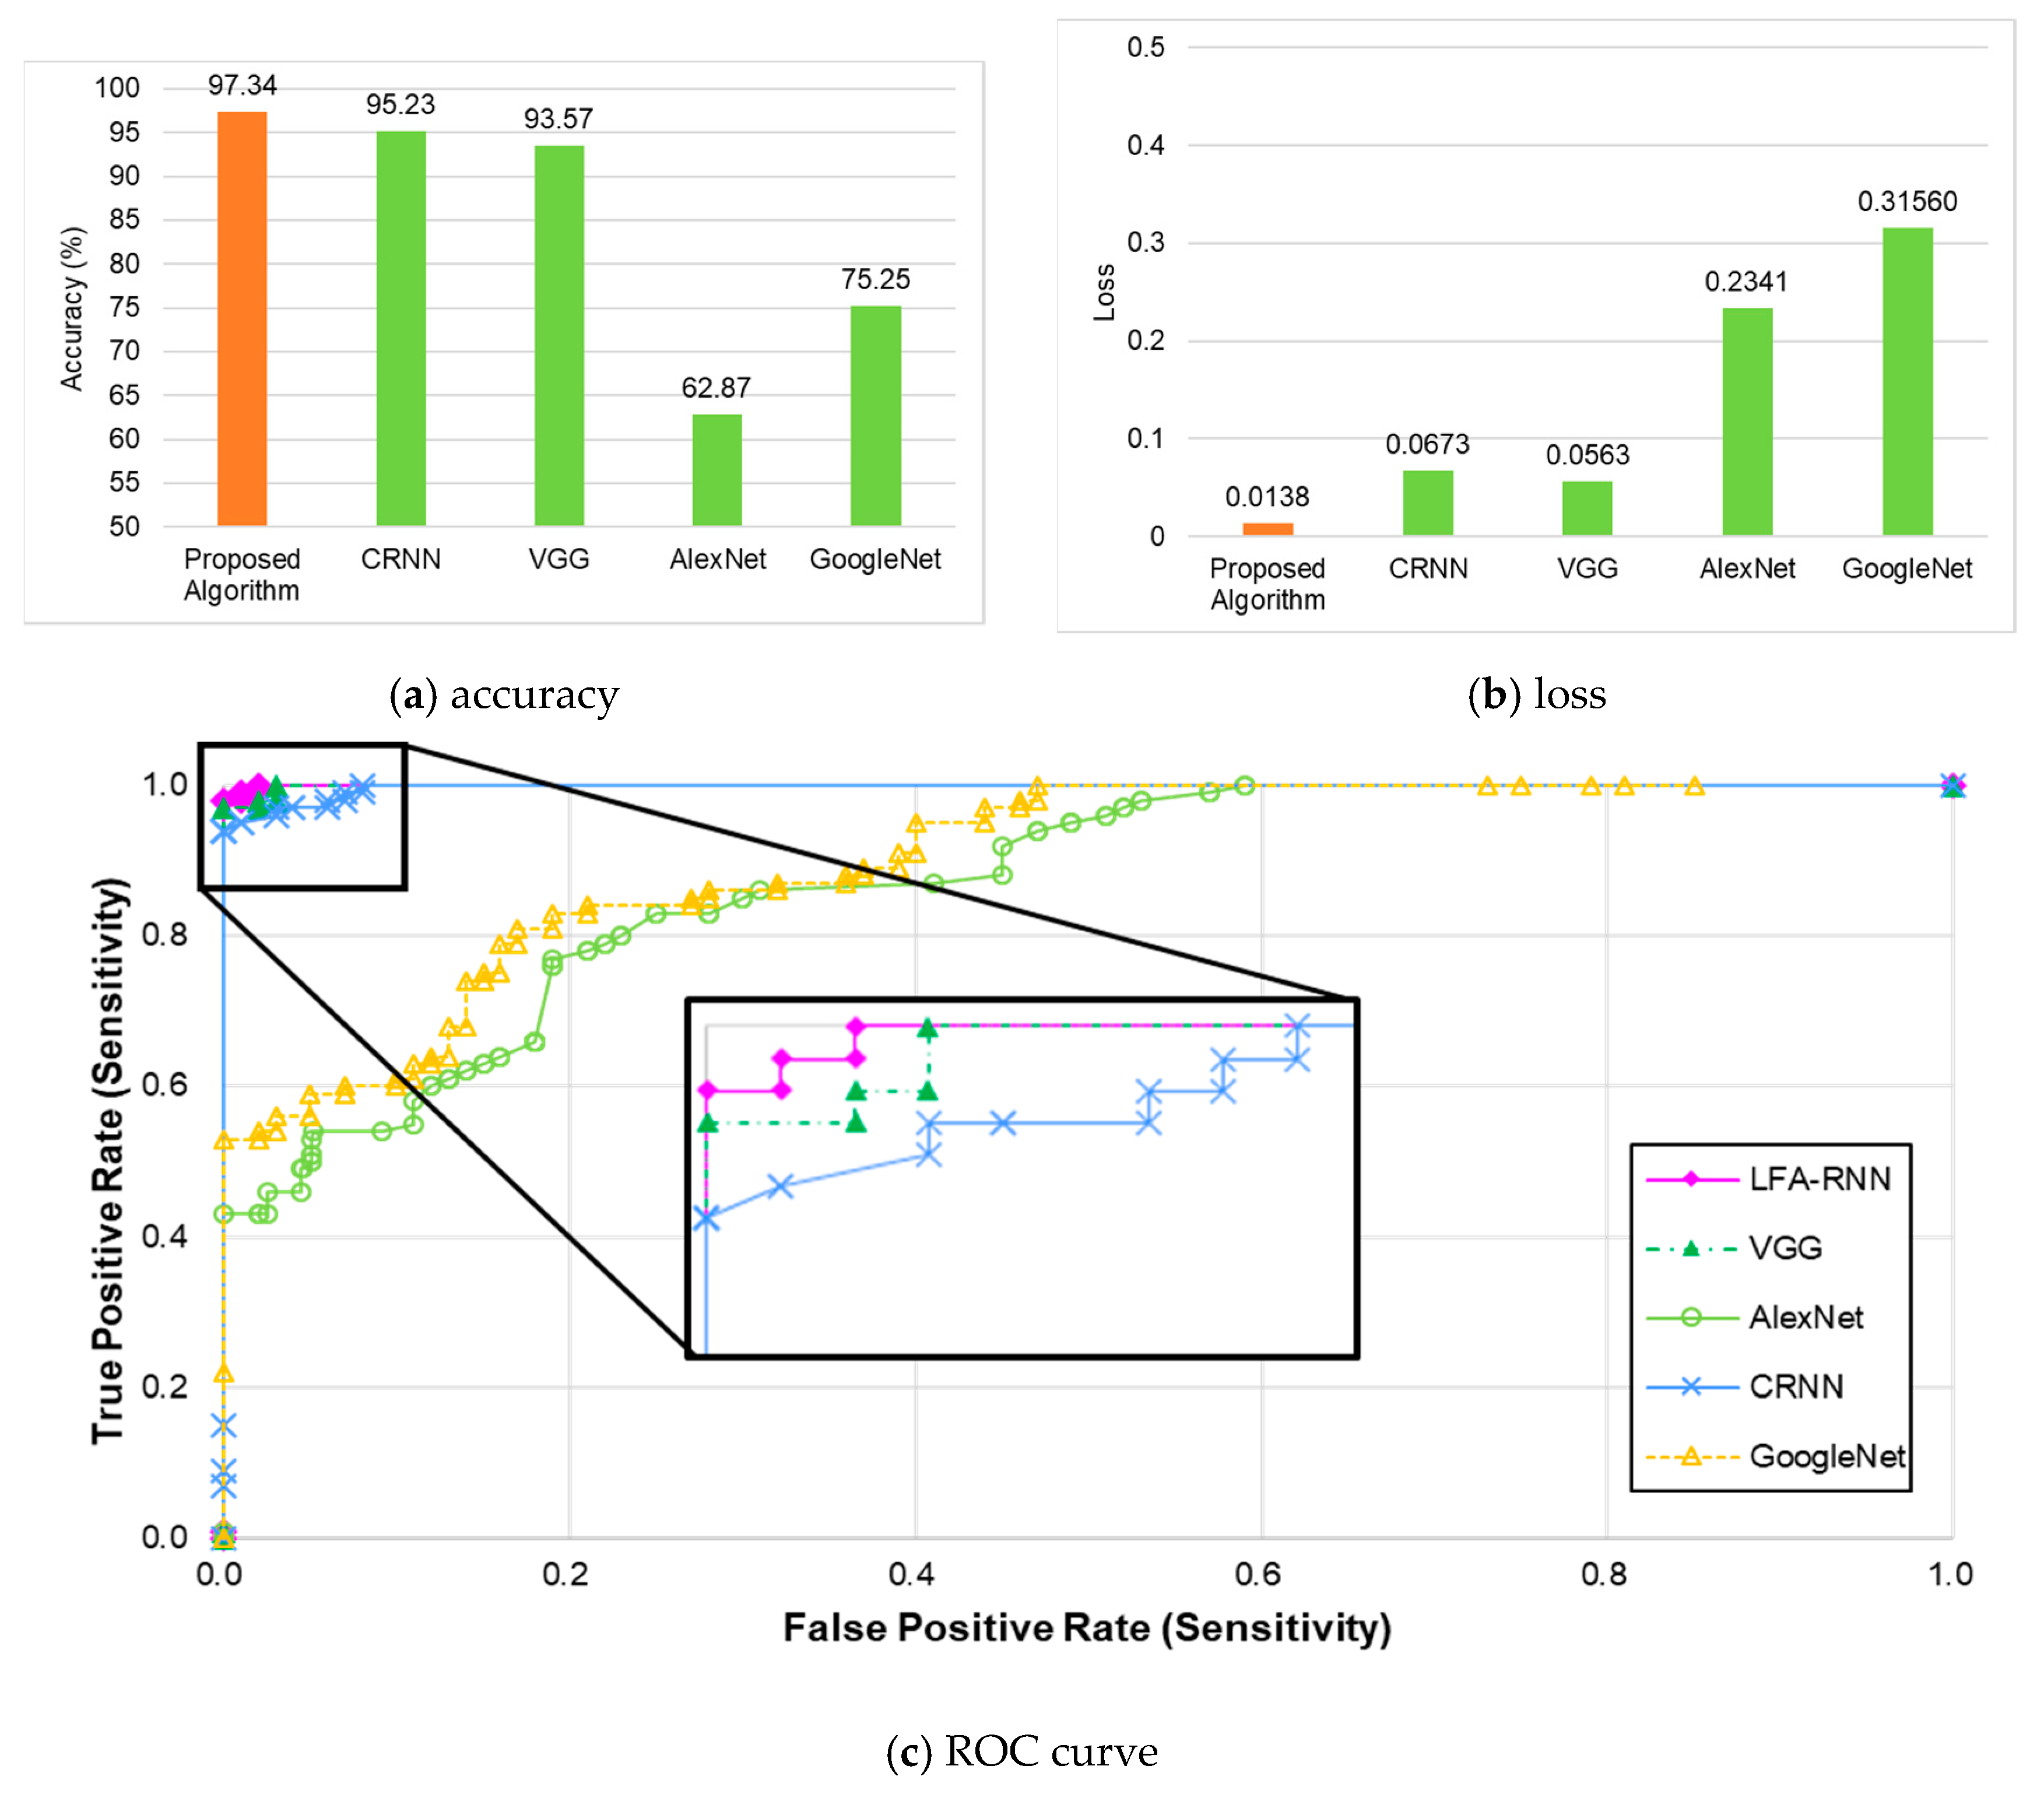
Evaluation of Breast Tumor Detection Performance Using YOLO Detector-Based Preprocessed Data

In this section, an experiment to measure the accuracy of breast tumor detection was performed. This test checks the proposed LFA algorithm’s accuracy in detecting lesion objects. The YOLO model used in this test is YOLOv4. The v4 model learning and verification data using the original image are expressed to increase the test reliability. The datasets include the actual breast ultrasound image database provided by AI-Dhabyani, W. et al. [51] and the database provided by Mendeley [52]. Al-Dhabyani’s database consists of 830 images, divided into 133 normal images, 487 benign images, and 210 malignant images. Mendeley’s database consists of 250 images, divided into 100 benign images and 150 malignant images. By combining the two databases, the experiment is conducted with 1080 images (normal: 133; benign: 587; and malignant: 360). The learning dataset of each model used 758, which was 80% of 947 (the number of benign and malignant data), and the test dataset used 322 (the remaining 20% (189) and 133 normal images). Figure 12 shows the results of detecting breast tumor information from breast ultrasound images using the object detection algorithm proposed in this paper.
Figure 12a is the accurate measurement result, and (b) shows the loss for each algorithm. The results in Figure 12a show that the proposed algorithm shows the highest accuracy with 94.9%, followed by Yolov4 (89.4%), R-FCN (86.9%), RetinaNet (88.7%), DeepLab v3+ (93.4%), and U-Net (93.2%). It indicates that the brightness equalization and visual pattern standardization of the original image algorithm proposed in this paper shows a close relationship with the lesion object detection result because they generate a new feature map using line segments. In other words, the learning model using the technique proposed in this paper shows high accuracy when the algorithm proposed in this paper show high similarity to the original data. Figure 12b shows the result of the loss measurement. The proposed algorithm showed the lowest loss of 0.067, followed by Yolov4 0.0856, R-FCN 0.219, RetinaNet 0.1974, DeepLab v3+ 0.10320, and U-Net 0.09234. The results confirm that the proposed algorithm shows the best performance in detecting lesion objects. Moreover, the five algorithms used for comparison in the lesion object detection test require setting the best parameters through preliminary tests. On the other hand, the proposed algorithm can be used without a separate parameter setting since it estimates threshold values internally in the lesion object detection process, making it more effective.
The channel expansion technique corrects the boundary of the image to be sharper and emphasizes the characteristics of the object to be learned by the YOLO model given the clear lesions in the image. In addition, by removing the noise in the image, the new method could prevent the deterioration of the detection performance, thereby having a better performance than the experiment using the original image.
Figure 13 shows the image extracted through the preprocessing of the YOLO detector proposed in this paper. It indicates the mask set provided by the dataset and the lesion location detected through the proposed detection method. The white boxes in Figure 13c mark the detected lesions. The figure confirms that slightly wider areas than the position of the provided mask are detected. The detailed boundaries, becoming visible as the image boundaries, which were not visible because of the low brightness in the original image, become clear through the proposed channel expansion. The lesion imaged detected through this method are processed into reduced data through the dimensionality reduction technique, and then breast cancer is diagnosed through the RNN model.
The test evaluated the proposed RNN model’s performance by comparing it with CRNN, AlexNet, VGG, and GoogleNet as comparative models. It also verified the learning capability of the proposed RNN model by gradually reducing the learning data for accuracy comparison. The data used in this test were 947 images, including 587 benign images and 360 malignant images, of the data used for extracting lesion objects. In total, 80% (758 images) of the data were used for learning and 20% (188 images) were used for the test. Figure 14 shows the accuracy and loss measurement results and the ROC curve for performance evaluation.
As shown in the Figure 14, the model proposed in this paper had the highest accuracy at 97.34% and the lowest loss at 0.0138. It was followed by CRNN (95.23%), VGG (93.57%), AlexNet (62.87%), and GoogleNet (75.25%). Figure 14c confirms that the eLFA-CRNN proposed as the ROC curve for the test shows higher performance than the comparative models. The LFA technique creates new data by compressing the original image and reducing the size of the data by using only some strong features. Removing detailed features enables clear extraction for each class. It is likely to be the reason for good results. Recall also showed similar results as precision. The accuracy of AlexNet and GoogleNet was low because they had a large gap in the validation data, and the temporary overfitting during learning reduced the accuracy. The proposed LFA-RNN model showed stable graphs in training and validation when all tests were aggregated and showed the highest performance at 99.7% in performance evaluation using test data. It also showed the lowest loss at about 0.0357. Likewise, the results of precision and recall also showed high performance.
In the experiments, the LFA-RNN model showed excellent accuracy and less loss in breast lesion classification as the LFA algorithm classified the characteristics of breast lesions correctly. Since benign and malign tumors are distinguished according to the lesion shape in breast cancer, it depends highly on the contours. The overall outline is smooth in a benign tumor but irregularly spread out in a malign tumor. Due to these characteristics, benign cases have a high ratio of curved or diagonal line segments among the visual information shown in Table 1, while malign cases have a higher ratio of other visual information, such as vertical and horizontal lines due to irregularities. In other words, the LFA algorithm can clearly derive the contour features of the lesion and highlights the classification characteristics, which increases the performance of the model to obtain higher-quality results.

5. Conclusions

In this paper, a study on a health risk diagnosis model based on multi-model image channel expansion and visual pattern standardization algorithm was performed. The proposed method improves the detection model’s performance by standardizing the breast ultrasound image’s brightness range and diagnosing breast cancer by reducing the lesion image data extracted by the detection model through dimensionality reduction and using it as the input to the RNN model. In breast ultrasound images, the lesion boundaries are not clear due to high brightness noise. We use a channel expansion to reduce such noises and enhance the image. An ultrasound image is an image composed only of brightness values, and removing strong noises can have an adverse effect by breaking down the boundaries of the lesion. Therefore, we introduce removing noise while enhancing the boundaries by repeating noise removal through three normalization processes and combining the three calculated images to expand the channel. The image with the expanded channel improved the detection performance through the YOLOv4 model. The detection model proposed in this paper showed the highest accuracy at 97.34% and showed stable performance with a precision of 97.2%, recall of 97.4%, and F1 score of 94.9%. This paper uses the RNN model to diagnose the lesion image extracted through this detection model. The RNN model creates an ordered matrix format from the data processed through the dimensionality reduction algorithm. The dimensionality reduction algorithm shown in this paper uses a detection filter having a 2 n coefficient to convert visual information into a series of numeric patterns and creates a unique number corresponding to the visual information. It facilitates easy aggregation of visual information and normalization of visual information in a numeric format by identifying the number of the same visual information. This process can transform an image into a 16 × 16 ordered matrix. The transformed data determine what type of cancer the detected lesion is through the RNN model. The RNN model’s performance in diagnosing breast cancer was higher than comparative models, with an accuracy of 97.34% and sensitivity of 97.1%. Although the preprocessing method proposed in this paper can strengthen the boundaries inside the image, it did not find a feature that can flawlessly classify “benign” and “malignant”. The pre-processing method proposed in this study can improve the borderline in the image; however, no features that could be used to classify “benign” and “malignant” were discovered. In the future, a study on pre-processing will be conducted to discover the above characteristics through other studies. Furthermore, by improving the process of normalizing visual information more precisely, the model will be investigated, which can also demonstrate high performance as a model.
In addition, this study will further enhance the performance through the optimization task for the algorithm proposed in this study and the weight lightening of the model and improve the model, allowing it to detect tumors instead of the classification of tumors for the diagnosis of breast cancer. In addition, this study will develop a comprehensive diagnostic system that will make use of medical data on diseases, such as skin diseases and vascular diseases, for which it is necessary to analyze the shapes in the diagnosis.

Author Contributions

C.-M.K. and E.J.H. conceived and designed the framework; K.C. and R.C.P. performed the experiments and analyzed the results. All authors contributed to writing and proofreading the paper. All authors have read and agreed to the published version of the manuscript.

Funding

This work is supported by the Korea Agency for Infrastructure Technology Advancement (KAIA) grant funded by the Ministry of Land, Infrastructure and Transport (Grant 21CTAP-C157011-02).

Institutional Review Board Statement

Not applicable. We didn’t do clinical trials, we used open data.

Informed Consent Statement

Not applicable. We didn’t do clinical trials, we used open data.

Data Availability Statement

We do not provide research materials.

Conflicts of Interest

The authors declare no conflict of interest.

References

  1. Hyeon, Y.H.; Moon, K.J. Cancer care facilities nurses experience of infection control. J. Korean Acad. Fundam. Nurs. 2020, 27, 12–28. [Google Scholar] [CrossRef]
  2. Do, E.-H.; Choi, E.J. The effect of self-efficacy and depression on sense of family coherence in cancer patients undergoing chemotherapy and primary caregivers in day care wards: Using the method actor-partner interdependence model. Asian Oncol. Nurs. 2019, 19, 214–223. [Google Scholar] [CrossRef]
  3. Kwon, S.Y.; Kim, Y.J.; Kim, G.G. An automatic breast mass segmentation based on deep learning on mammogram. J. Korea Multimed. Soc. 2018, 21, 1363–1369. [Google Scholar]
  4. Manohar, S.; Dantuma, M. Current and future trends in photoacoustic breast imaging. Photoacoustics 2019, 16, 100134. [Google Scholar] [CrossRef] [PubMed]
  5. Lee, J.; Vicil, F. Effects of an evidence-based exercise intervention on clinical outcomes in breast cancer survivors: A randomized controlled trial. Asian J. Kinesiol. 2020, 22, 1–8. [Google Scholar] [CrossRef]
  6. Cho, Y.-H. A study of deep learning-based tumor discrimination using texture features of breast ultrasound image. J. Korean Inst. Intell. Syst. 2020, 30, 54–59. [Google Scholar] [CrossRef]
  7. Kim, C.-M.; Park, R.C.; Hong, E.J. Breast mass classification using eLFA algorithm based on CRNN deep learning model. IEEE Access 2020, 8, 1. [Google Scholar] [CrossRef]
  8. Acharya, U.R.; Meiburger, K.M.; Koh, J.E.W.; Ciaccio, E.J.; Arunkumar, N.; See, M.H.; Taib, N.A.M.; Vijayananthan, A.; Rahmat, K.; Fadzli, F.; et al. A novel algorithm for breast lesion detection using textons and local configuration pattern features with ultrasound imagery. IEEE Access 2019, 7, 22829–22842. [Google Scholar] [CrossRef]
  9. Feng, X.; Song, L.; Wang, S.; Song, H.; Chen, H.; Liu, Y.; Lou, C.; Zhao, J.; Liu, Q.; Liu, Y.; et al. Accurate prediction of neoadjuvant chemotherapy pathological complete remission (pCR) for the four sub-types of breast cancer. IEEE Access 2019, 7, 134697–134706. [Google Scholar] [CrossRef]
  10. Li, Y.; Wu, J.; Wu, Q. Classification of breast cancer histology images using multi-size and discriminative patches based on deep learning. IEEE Access 2019, 7, 21400–21408. [Google Scholar] [CrossRef]
  11. Sun, L.; Wang, J.; Hu, Z.; Xu, Y.; Cui, Z. Multi-view convolutional neural networks for mammographic image classification. IEEE Access 2019, 7, 126273–126282. [Google Scholar] [CrossRef]
  12. Mayro, E.L.; Wang, M.; Elze, T.; Pasquale, L.R. The impact of artificial intelligence in the diagnosis and management of glaucoma. Eye 2020, 34, 1–11. [Google Scholar] [CrossRef]
  13. Ferrari, R.; Mancini-Terracciano, C.; Voena, C.; Rengo, M.; Zerunian, M.; Ciardiello, A.; Grasso, S.; Mare’, V.; Paramatti, R.; Russomando, A.; et al. MR-based artificial intelligence model to assess response to therapy in locally advanced rectal cancer. Eur. J. Radiol. 2019, 118, 1–9. [Google Scholar] [CrossRef]
  14. Park, S.; Chu, L.; Fishman, E.; Yuille, A.; Vogelstein, B.; Kinzler, K.; Horton, K.; Hruban, R.; Zinreich, E.; Fouladi, D.F.; et al. Annotated normal CT data of the abdomen for deep learning: Challenges and strategies for implementation. Diagn. Interv. Imaging 2020, 101, 35–44. [Google Scholar] [CrossRef]
  15. Gonzalez-Luna, F.A.; Hermandez-Lopez, J.; Gomes-Flores, W. A performance evaluation of machine learning techniques for breast ultrasound classification. In Proceedings of the 16th International Conference on Electrical Engineering, Computing Science and Automatic Control (CCE), Mexico City, Mexico, 11–13 September 2019; pp. 1–5. [Google Scholar]
  16. Çallı, E.; Sogancioglu, E.; van Ginneken, B.; van Leeuwen, K.G.; Murphy, K. Deep learning for chest X-ray analysis: A survey. Med. Image Anal. 2021, 72, 102125. [Google Scholar] [CrossRef]
  17. Ma, J.; Song, Y.; Tian, X.; Hua, Y.; Zhang, R.; Wu, J. Survey on deep learning for pulmonary medical imaging. Front. Med. 2019, 14, 450–469. [Google Scholar] [CrossRef] [PubMed] [Green Version]
  18. Haskins, G.; Kruger, U.; Yan, P. Deep learning in medical image registration: A survey. Mach. Vis. Appl. 2020, 31, 1–18. [Google Scholar] [CrossRef] [Green Version]
  19. Aly, G.H.; Marey, M.; El-Sayed, S.A.; Tolba, M.F. YOLO based breast masses detection and classification in full-field digital mammograms. Comput. Methods Programs Biomed. 2020, 200, 105823. [Google Scholar] [CrossRef]
  20. Piccialli, F.; Somma, V.D.; Giampaolo, F.; Cuomo, S.; Fortino, G. A survey on deep learning in medicine: Why, how and when? Inf. Fusion 2021, 66, 111–137. [Google Scholar] [CrossRef]
  21. Kim, C.-M.; Hong, E.J.; Chung, K.; Park, R.C. Line-segment feature analysis algorithm using input dimensionality reduction for handwritten text recognition. Appl. Sci. 2020, 10, 6904. [Google Scholar] [CrossRef]
  22. Kim, C.-M.; Kim, K.-H.; Lee, Y.S.; Chung, K.; Park, R.C. Real-time streaming image based PP2LFA-CRNN model for facial sentiment analysis. IEEE Access 2020, 8, 199586–199602. [Google Scholar] [CrossRef]
  23. Kim, C.-M.; Hong, E.J.; Chung, K.; Park, R.C. Driver facial expression analysis using LFA-CRNN-based feature extraction for health-risk decisions. Appl. Sci. 2020, 10, 2956. [Google Scholar] [CrossRef]
  24. Gustavo, O. Evolutionary Computer Vision. The First Footprints; Springer: Berlin/Heidelberg, Germany, 2016. [Google Scholar]
  25. Habuza, T.; Navaz, A.N.; Hashim, F.; Alnajjar, F.; Zaki, N.; Serhani, M.A.; Statsenko, Y. AI applications in robotics, diagnostic image analysis and precision medicine: Current limitations, future trends, guidelines on CAD systems for medicine. Inform. Med. Unlocked 2021, 24, 100596. [Google Scholar] [CrossRef]
  26. Straw, I. The automation of bias in medical Artificial Intelligence (AI): Decoding the past to create a better future. Artif. Intell. Med. 2020, 110, 101965. [Google Scholar] [CrossRef]
  27. Sait, U.; KV, G.L.; Shivakumar, S.; Kumar, T.; Bhaumik, R.; Prajapati, S.; Bhalla, K.; Chakrapani, A. A deep-learning based multimodal system for Covid-19 diagnosis using breathing sounds and chest X-ray images. Appl. Soft Comput. 2021, 109, 107522. [Google Scholar] [CrossRef] [PubMed]
  28. Yan, Q.; Wang, B.; Gong, D.; Luo, C.; Zhao, W.; Shen, J.; Ai, J.; Shi, Q.; Zhang, Y.; Jin, S.; et al. COVID-19 chest CT image segmentation network by multi-scale fusion and enhancement operations. IEEE Trans. Big Data 2021, 7, 13–24. [Google Scholar] [CrossRef]
  29. Bang, C.S.; Lee, J.J.; Baik, G.H. Computer-aided diagnosis of esophageal cancer and neoplasms in endoscopic images: A systematic review and meta-analysis of diagnostic test accuracy. Gastrointest. Endosc. 2021, 93, 1006–1015. [Google Scholar] [CrossRef]
  30. Calisto, F.M.; Santiago, C.; Nunes, N.; Nascimento, J.C. Introduction of human-centric AI assistant to aid radiologists for multimodal breast image classification. Int. J. Hum. Comput. Stud. 2021, 150, 102607. [Google Scholar] [CrossRef]
  31. Prabhakar, B.; Singh, R.K.; Yadav, K.S. Artificial intelligence (AI) impacting diagnosis of glaucoma and understanding the regulatory aspects of AI-based software as medical device. Comput. Med Imaging Graph. 2020, 87, 101818. [Google Scholar] [CrossRef]
  32. Chen, C.H.; Lee, Y.W.; Huang, Y.S.; Lan, W.R.; Chang, R.F.; Tuaef, C.Y.; Chenaei, C.Y.; Lia, W.C. Computer-aided diagnosis of breast ultrasound images using ensemble learning from convolutional neural networks. Comput. Methods Programs Biomed. 2019, 177, 175–182. [Google Scholar] [CrossRef] [PubMed]
  33. Shi, F.; Wang, J.; Shi, J.; Wu, Z.; Wang, Q.; Tang, Z.; He, K.; Shi, Y.; Shen, D. Review of Artificial Intelligence techniques in imaging data acquisition, segmentation, and diagnosis for COVID-19. IEEE Rev. Biomed. Eng. 2020, 14, 4–15. [Google Scholar] [CrossRef] [Green Version]
  34. VUNO Med-Chest X-ray System. Available online: https://www.vuno.co/ (accessed on 26 May 2021).
  35. JLK Inspection. Available online: http://jlkgroup.com/ (accessed on 26 May 2021).
  36. Lunit INSIGHT. Available online: http://lunit.io/ (accessed on 26 May 2021).
  37. Dr. Answer. Available online: http://dranswer.kr/ (accessed on 26 May 2021).
  38. DeepMind-Health. Available online: http://deepmind.com/ (accessed on 26 May 2021).
  39. Tencent Miying. Available online: https://www.tencent.com/ (accessed on 26 May 2021).
  40. Senan, E.M.; Alsaade, F.W.; Al-mashhadani, M.I.A.; Haldhyani, T.H.; Al-Adhaileh, M.H. Classification of histopathological images for early detection of breast cancer using deep learning. Comput. Sci. Inf. Eng. 2021, 24, 323–329. [Google Scholar]
  41. Jin, Y.W.; Jia, S.; Ashraf, A.B.; Hu, P. Integrative data augmentation with U-Net segmentation masks improves detection of lymph node metastases in breast cancer patients. Cancers 2020, 12, 2934. [Google Scholar] [CrossRef]
  42. Unver, H.M.; Ayan, E. Skin lesion segmentation in dermoscopic images with combination of YOLO and GrabCut algorithm. Diagnostics 2019, 9, 72. [Google Scholar] [CrossRef] [Green Version]
  43. Igarashi, S.; Sasaki, Y.; Mikami, T.; Sakuraba, H.; Fukuda, S. Anatomical classification of upper gastrointestinal organs under various image capture conditions using AlexNet. Comput. Biol. Med. 2020, 124, 103950. [Google Scholar] [CrossRef] [PubMed]
  44. Kuwada, C.; Ariji, Y.; Fukuda, M.; Kise, Y.; Fujita, H.; Katsumata, A.; Ariji, E. Deep learning systems for detecting and classifying the presence of impacted supernumerary teeth in the maxillary incisor region on panoramic radiographs. Oral Surg. Oral Med. Oral Pathol. Oral Radiol. 2020, 130, 464–469. [Google Scholar] [CrossRef] [PubMed]
  45. Tong, Y.; Liu, Y.; Zhao, M.; Meng, L.; Zhang, J. Improved U-net MALF model for lesion segmentation in breast ultrasound images. Biomed. Signal Process. Control 2021, 68, 102721. [Google Scholar] [CrossRef]
  46. Wang, Z.; Zou, Y.; Liu, P.X. Hybrid dilation and attention residual U-Net for medical image segmentation. Comput. Biol. Med. 2021, 134, 104449. [Google Scholar] [CrossRef]
  47. Suzuki, K.; Otsuka, Y.; Nomura, Y.; Kumamaru, K.K.; Kuwatsuru, R.; Aoki, S. Development and validation of a modified three-dimensional U-Net deep-learning model for automated detection of lung nodules on chest CT images from the lung image database consortium and Japanese datasets. Acad. Radiol. 2020. [Google Scholar] [CrossRef] [PubMed]
  48. Negri, A.; Townshend, H.; McSweeney, T.; Angelopoulou, O.; Banayoti, H.; Prilutskaya, M.; Bowden-Jones, O.; Corazza, O. Carfentanil on the darknet: Potential scam or alarming public health threat? Int. J. Drug Policy 2021, 91, 103118. [Google Scholar] [CrossRef]
  49. Ozturk, T.; Talo, M.; Yildirim, E.A.; Baloglu, U.B.; Yildirim, O.; Acharya, U.R. Automated detection of COVID-19 cases using deep neural networks with X-ray images. Comput. Biol. Med. 2020, 121, 103792. [Google Scholar] [CrossRef] [PubMed]
  50. Huang, C.; Li, X.; Wen, Y. AN OTSU image segmentation based on fruitfly optimization algorithm. Alex. Eng. J. 2020, 60, 183–188. [Google Scholar] [CrossRef]
  51. Al-Dhabyani, W.; Gomaa, M.; Khaled, H.; Fahmy, A. Dataset of breast ultrasound images. Data Brief 2019, 28, 104863. [Google Scholar] [CrossRef] [PubMed]
  52. Breast Ultrasound Image. Available online: https://data.mendeley.com/datasets/wmy84gzngw/ (accessed on 26 May 2021).
Figure 1. Image analysis and CAD system using deep learning.
Applsci 11 08621 g001
Figure 2. Processing of the multi-model-based image visual pattern standardization and dimensionality reduction algorithm.
Applsci 11 08621 g002
Figure 3. Breast ultrasound image.
Applsci 11 08621 g003
Figure 4. Channel expansion process to enhance image boundaries.
Applsci 11 08621 g004
Figure 5. Image after the brightness range processing.
Applsci 11 08621 g005
Figure 6. The image produced by simplifying the brightness value.
Applsci 11 08621 g006
Figure 7. Expanded channel image creation process. (a) original image, (b) histogram equalization, (c) adjusting the brightness range, (d) simplified brightness rang, (e) result image.
Applsci 11 08621 g007
Figure 8. Breast cancer diagnosis model through normalized pattern transformation using RNN-based visual information.
Applsci 11 08621 g008
Figure 9. Image resize and edge detection.
Applsci 11 08621 g009
Figure 10. Breast ultrasound image edge detection and noise removal.
Applsci 11 08621 g010
Figure 11. Normalization operation using detection filter.
Applsci 11 08621 g011
Figure 12. The accuracy measurement result of the lesion object detection algorithm.
Applsci 11 08621 g012
Figure 13. The results detected in the proposed method and mask set: (a) original image; (b) mask set provided by AI-Dhabyani, W.; (c) image extracted through preprocessing.
Applsci 11 08621 g013
Figure 14. Accuracy and loss measurement results.
Applsci 11 08621 g014
Table 1. Types and values of the line segments for the 3 × 3 filter.
Visual InformationFilter Response CoefficientNumberVisual InformationFilter Response CoefficientNumber
Non-activity00Point88
Point11Vertically1, 89
Point22Diagonally2, 810
Horizontally1, 23Curve1, 2, 811
Point44Horizontally4, 812
Diagonally1, 45Curve1, 4, 813
Vertically2, 46Curve2, 4, 814
Curve1, 2, 47Face1, 2, 4, 815
Table 2. Structure of the proposed RNN model.
LayerLayer Name
1Input Layer ( 16 × 16 )
2LSTM (512,return_sequences = True)
3Bidirectional-LSTM (512)
4Dropout (0.2)
5Output Layer (act = “sigmoid”)
Publisher’s Note: MDPI stays neutral with regard to jurisdictional claims in published maps and institutional affiliations.

