2. Subjects and Methods
Research subjects were eight elite swimmers—4 females and 4 males—(age, body mass and height are presented in captions of
Figure 1 and
Figure 2), specialized in different swimming techniques and ranked among the world’s top 10 swimmers in the respective 100 m competitive event. During testing, maximal individual performances ranged between 5.5% and 7% lower than in the following competition. Participation in this study occurred during the preparation process for the World Swimming Championships 2017, in Budapest. Since all the considered variables—Equation (1)—are possibly affected by the training period [
7], all tests were carried out at the end of the specific training period (20–30 days before competing at the World Championship). This period allowed for subjectively accommodating individual adaptations to tapering, aiming to test all the subjects in a similar conditioning state.
Each subject performed two intermittent step-tests with progressively increasing swimming velocity (from low to maximum): the first test was conducted in a swimming flume and the second test was carried out 72 h later in a 50 m pool. The test in the swimming flume consisted of repeated efforts of 8 × 1 min. In the pool, swimmers performed a set of 8 × 100 m swims. Rest intervals in both tests (regardless of the testing site) were: 3 min after the laps 1, 2, 3 and 4, 5 min after the lap 5, 7 min after lap 6 and 9 min after lap 7. Swimming velocities for each subject were previously calculated for the stages 1–7 of both flume and pool testing (except for the last stage, which was performed at maximal intensity) using the “SwimPlanyzer“ (
http://www.softconst.ru/sp; accessed on January 2017) software, which allows calculating individual swimming velocity in all training categories (intensity zones) provided for by the international classification [
8]. The calculated velocity gradually increased from stage 1 (category “Endurance 1” minimal aerobic metabolism) to stage 7 (category “Speed 1” anaerobic metabolism in the zone of tolerable lactate). These calculations are based on the results of preliminary testing in the flume and pool and are performed by one of two computing units: “USS Standard” and “RUS Standard”. The calculation method was individually chosen, taking into account the predominant type of energy supply—anaerobic or aerobic. During swimming pool tests, a visual light pacer was used for velocity control (“Virtual Trainer 2”, Aqvaspeed, Italy). At the swimming flume, the flow velocity was controlled with a dedicated gauge.
When designing the study, three important assumptions were made: (1) With the same
Pai values, swimmers demonstrate a significantly lower swimming velocity in the swimming flume (by 8–14%) compared to the pool [
7,
9,
10]. (2) The duration of the rest intervals allowed for attaining maximum values of metabolic power at the last steps of the test [
11,
12,
13]. (3) Seventy-two hours is the optimal period for restoring energy systems after testing in the swimming flume, where the physical load performed on the last steps was characterized as extremely hard repeated training intensities [
14].
During the flume tests, metabolic gas exchanges were continuously measured using the “MetaSwim” testing system (“Cortex”, Leipzig, Germany). However, when testing in the pool, metabolic gas exchanges were measured during the first 2 min of each rest interval using a “MetaMax” mobile system (“Cortex”, Leipzig, Germany). Basal values were obtained after 5 min of resting in an upright position immersed up to the neck in the pool in both tests, using the same instruments as for exercise measurements. Before each test stage and after performing in both conditions, blood samples were taken from swimmers’ finger for peak capillary blood lactate concentrations’ assessment using a biochemical analyzer “Stat Fax 4500” (“Awareness Technology”, Palm City, FL, USA).
To determine the total energy expenditure (
Eai) in both tests, the method of indirect calorimetry was used [
5,
13,
15,
16,
17,
18]. The experimental-theoretical approach was based on the results of a previous study using direct calorimetry of physical activity performed at various intensities by subjects on a bicycle ergometer using a bio calorimeter [
19]. This approach is formalized as an equation for determining
Eai, consisting of the sum of three components: aerobic (
Eai(Aer)), anaerobic alactic (
Eai(AnAl)) and anaerobic lactic components (
Eai(Anl)):
where,
Eai is the metabolic energy input (kJ),
VO
2tot is the total amount of oxygen intake during the exercise (L),
V’O
2res is the rest oxygen intake (L·min
−1),
VO
2bor is the amount of net oxygen intake above the rest level during the first 2 min of recovery (L),
t is the exercise duration (min), 0.6 is the coefficient of the “phosphagen cycle efficiency”, α is the energy equivalent for O
2, equal to 20.9 (kJ·(L·min
−1)
−1), Δ
La is the net lactate concentration after exercise (mmol·L
−1), β is the energy equivalent of the accumulation of lactate in the blood, equal to 0.0689 (kJ·(kg·mmol
−1)
−1),
m0 is the body mass of the subject (kg) and 0.55 is the coefficient of «oxygen store of the body» for a person with a body mass of 70 kg [
19].
When testing in the swimming flume, at each stage of the test, all three components of
Eai were determined based on direct measurements. In the pool test, on the other hand,
Eai(AnAl) and
Eai(Anl) were also determined based on direct measurements from capillary blood lactate concentrations and recovery
VO
2 values, but
Eai(Aer) was calculated taking into account the individual values of
Eai(AnAl) and
Eai(Anl) obtained in the pool and the individual partial contributions of the main energy systems to
Eai obtained earlier in the flume for the corresponding intensity step of the swimming pool test. It should be noted here that the use of Equation (2) allows for determining
Eai over the entire range of swimming velocities attained by the swimmer in the step-test. The magnitude of metabolic power for each stage of the pool test was determined using the following equation:
where,
Pai is metabolic power (W) and
t is the swimming time of the 100 m lap in test s.
To verify the
Eai values obtained using the above-described approach at the last stage of the test, as well as to compare them with published data, a second approach was used, which is most often used in studies of the energy cost of human swimming at maximum or near maximum velocity [
1,
20,
21,
22]. This approach, commonly referred as the Wilkie’s approach [
23], allows determining the amount of the total metabolic energy input (
Eti) (
Eti =
Eai +
Ebi;
Ebi—energy of basal metabolism, for supramaximal efforts). The total metabolic rate for the last step of the test was also calculated based on Equation (3):
Pti = Eti × t−1.
To experimentally determine the total external mechanical power (
Pto), active hydrodynamic resistance force (
Fr(ad)), or active drag force, and the dimensionless coefficient of active drag force (
Cx(ad)) were assessed using the method of small perturbations, usually known as the velocity perturbation method—VPM (for more methodological details, see [
24,
25]). A 30 m swimming test was performed twice at maximum velocity (
v0max) by each swimmer using the swimming technique of his/her specialty. The first trial was performed in free swimming and, in the second trial, the swimmer towed a hydrodynamic body of known drag. The key point of the VPM (affecting the measurement accuracy) is the optimal value of the perturbation factor. Therefore, in all cases, the magnitude of the resistance of the hydrodynamic body was selected individually, so that the differences in
v0max between the first and second trials were in the required range: Δ
v0max = 4–6%. VPM is usually considered limited by the possibility of each subject not being able to produce the same power in both consecutive repetitions, as assumed as a precondition, but this seems to be controlled in these velocity reduction conditions. The VPM, or its modifications, are often used in similar studies [
26,
27,
28,
29,
30], since it allows to obtain, in all swimming techniques, quantitative values of
Fr(ad) and
Pto and calculating
Cx(ad), taking into consideration the characteristic hydrodynamic size of the subject’s body. Further, for each experimental velocity of the step-test (
v0exp), the
Pto value was calculated using the equation:
Pto =
Ptomax/v0max3 ×
v0exp3. The basis for this approach are the results of a special study in which the relationship between the swimming velocity and the main hydrodynamic characteristics was studied [
31]. In a special research pool with a length of 500 m filled with seawater, five elite male swimmers who specialized in front crawl performed repeated swimming trials of various lengths (30, 75, 120, 200, 350 m). The VPM was used to determine the main hydrodynamic characteristics of each swim for each swimmer. It was found that with an increased test distance and, accordingly, the duration of the swim, the
v0exp of the subjects naturally decreases. The analysis of the results, carried out based on the general fluid force equation, showed that there is a quadratic dependence between
v0exp and
Fr(ad), a cubic dependence between
v0exp and
Pto and that the values of
Cx(ad) remained constant.
The mechanical efficiency was also determined for each
v0exp, based on the equation:
Here, it is necessary to clarify the physical meaning of
Pto during human active swimming, that is, the mechanism of further transformation of
Pto, which is formalized by the following equation [
25,
32,
33]:
where,
Puo is the useful external mechanical power, or useful propulsive power, applied to overcome only the frontal component of active drag (
Fr(fd)).
P1 is the mechanical power spent on the impulse transferred to a certain mass of water, directed backwards and necessary to create thrust in the direction of swimming locomotion.
P2 is the mechanical power wasted on the formation of turbulent eddies when propulsive segments (arms and legs of a swimmer) interact with the flow, as well as on the inductive resistance of the propulsive segments.
For the experimental determination of the instantaneous values of
Fr(fd)(
t), under the conditions of steady-state non-stationary motion of the subject who swam using a particular swimming technique, a hydrodynamic method was used [
32,
33] in these works, the theory, technology and verification of the hydrodynamic method are presented in detail. A key characteristic of swimming locomotion is the intra-cyclic fluctuations of the instantaneous values of the swimmer’s body velocity, which are included in the mathematical model of the method:
where:
Cx(n)(
t) is the instantaneous value of the dimensionless coefficient of the frontal component of the active drag force, corresponding to the unsteady mode of motion of the body,
ρ is the density of water (kg·m
−3),
S(bs)(t) is the instantaneous value of the characteristic hydrodynamic size of the subject’s body (m
2) and
v(pb)(t) stands for the instantaneous value of the velocity of a point on the surface of the human body (trunk) when swimming (m·s
–1).
Based on previously described methods, all the mathematical model variables were quantified experimentally in one biomechanical cycle of the subject’s movements: to determine
v(pb)(t), an acoustic method based on the Doppler effect was used [
32,
33], and to determine
S(bs)(t), a three-dimensional kinematic analysis of the movement of all the main segments of the human body was used, based on underwater and surface video recording.
S(bs)(
t) was defined as 2/3 of the immersed volume of the subject’s body at a given time instant (m
2). The specified volume does not include the volumes of the body segments, which, at a given moment of the biomechanical cycle, are the movers and have a negative velocity vector with respect to the direction of translational motion of the center of mass of the subject’s body [
8]. To determine
Cx(n)(t), a method of full-scale hydrodynamic tests of a swimmer and respective special models in conditions of stationary and non-stationary movement was implemented [
32,
33]. Then, on the basis of Equation (6), with a discreteness of 0.06 s, the instantaneous values of
Fr(fd)(t) were calculated (from 16 to 25 values depending on the cycle duration).
On the basis of the obtained
Fr(fd)(t) values, the average
Fr(fd),
Cx(fd) and
S(bs) values were calculated for a complete cycle in each swimming technique. Since there were strict time limits for the study, related to the preparation of athletes for the World Championships, this characteristic was estimated only for
v0exp at the last stage of the test. Correspondingly, only for this
v0exp were values of useful external mechanical power:
Puo =
Fr(fd) ×
v0exp and propelling efficiency:
ep =
Puo ×
Pto−1 determined. The generally accepted mathematical definition of propelling efficiency [
34,
35,
36,
37,
38] was used.
The degree of non-stationarity of the complete biomechanical cycle of swimmers’ movements in the various swimming techniques (according to the elongated-body theory in a liquid) is most accurately characterized by the dimensionless Strouhal number (Sh
v), which was determined on the basis of the experimental data. Sh
v is the ratio of local and convective forces of inertia of a liquid and, in relation to human swimming, is determined by the expression Sh
v =
L·
v0exp−2·2
dv·
Tc−1, where:
L is the subject’s body length (m), 2
dv is the doubled difference between the maximum velocity (
vmax(cm)) and the minimum velocity (
vmin(cm)) of the center of mass of the human body in the cycle of movements using the butterfly and breaststroke, and for the front crawl and the backstroke, 2
dv of the full cycle =
2dv half cycle of movements with the right hand +
2dv half cycle of movements with the left hand (m·s
−1), and
Tc is the time of one swimming cycle of a regularly repeating process (period) (s) [
26,
33,
34,
35].
All experimental measurements and data collection were conducted in accordance with the CIOMS (Council for International Organizations of Medical Sciences, Geneva, Switzerland, 2016. ISBN 978-929036094-0) ethical guidance and standards, and all subjects signed an informed consent form.
4. Discussion and Implications
Results in
Table 1 show that subjects fulfilled the main condition of the test: swimming speed consistently increased from the minimum at the first stage (F1—
v0exp = 1.38 m·s
−1, M3—
v0exp = 1.34 m·s
−1) to the maximum at the last stage (F1—
v0exp = 1.70 m·s
−1, M3—
v0exp = 1.69 m·s
−1). The calculation of the average swimming speed on the test segment was carried out according to the formula
v0exp = 100 m × (
t + 0.75 s)
−1, where 0.75 s is the standard empirical value at a distance of 100 m, used by coaches and specialists in order to exclude the positive effect of turning on this indicator [
7,
14]. Such an increase was naturally accompanied by a progressive increase in oxygen consumption during work (
VO
2tot) and during the first two minutes of recovery (
VO
2bor). The net capillary blood lactate concentrations in each one of the consecutive test stages (Δ
La) also escalates with swimming speed. The metabolic energy input increased as well as the metabolic power. With increasing swimming intensity (
v0exp), the absolute contribution of each metabolic pathway (
Eai(Aer),
Eai(AnAl) and
Eai(Anl)) to the total energy production also increased, but the partial contributions of the three energy sources changed differently. As
v0exp increases, the total external mechanical power also increases (F1—from 69 to 128 W, M3—from 103 to 208 W). Meanwhile,
eg was inversely related to
v0exp. Indeed,
eg decreased from 0.098 (F1) and 0.119 (M3) at the minimum
v0exp to 0.050 (F1) and 0.065 (M3) at the maximum
v0exp.
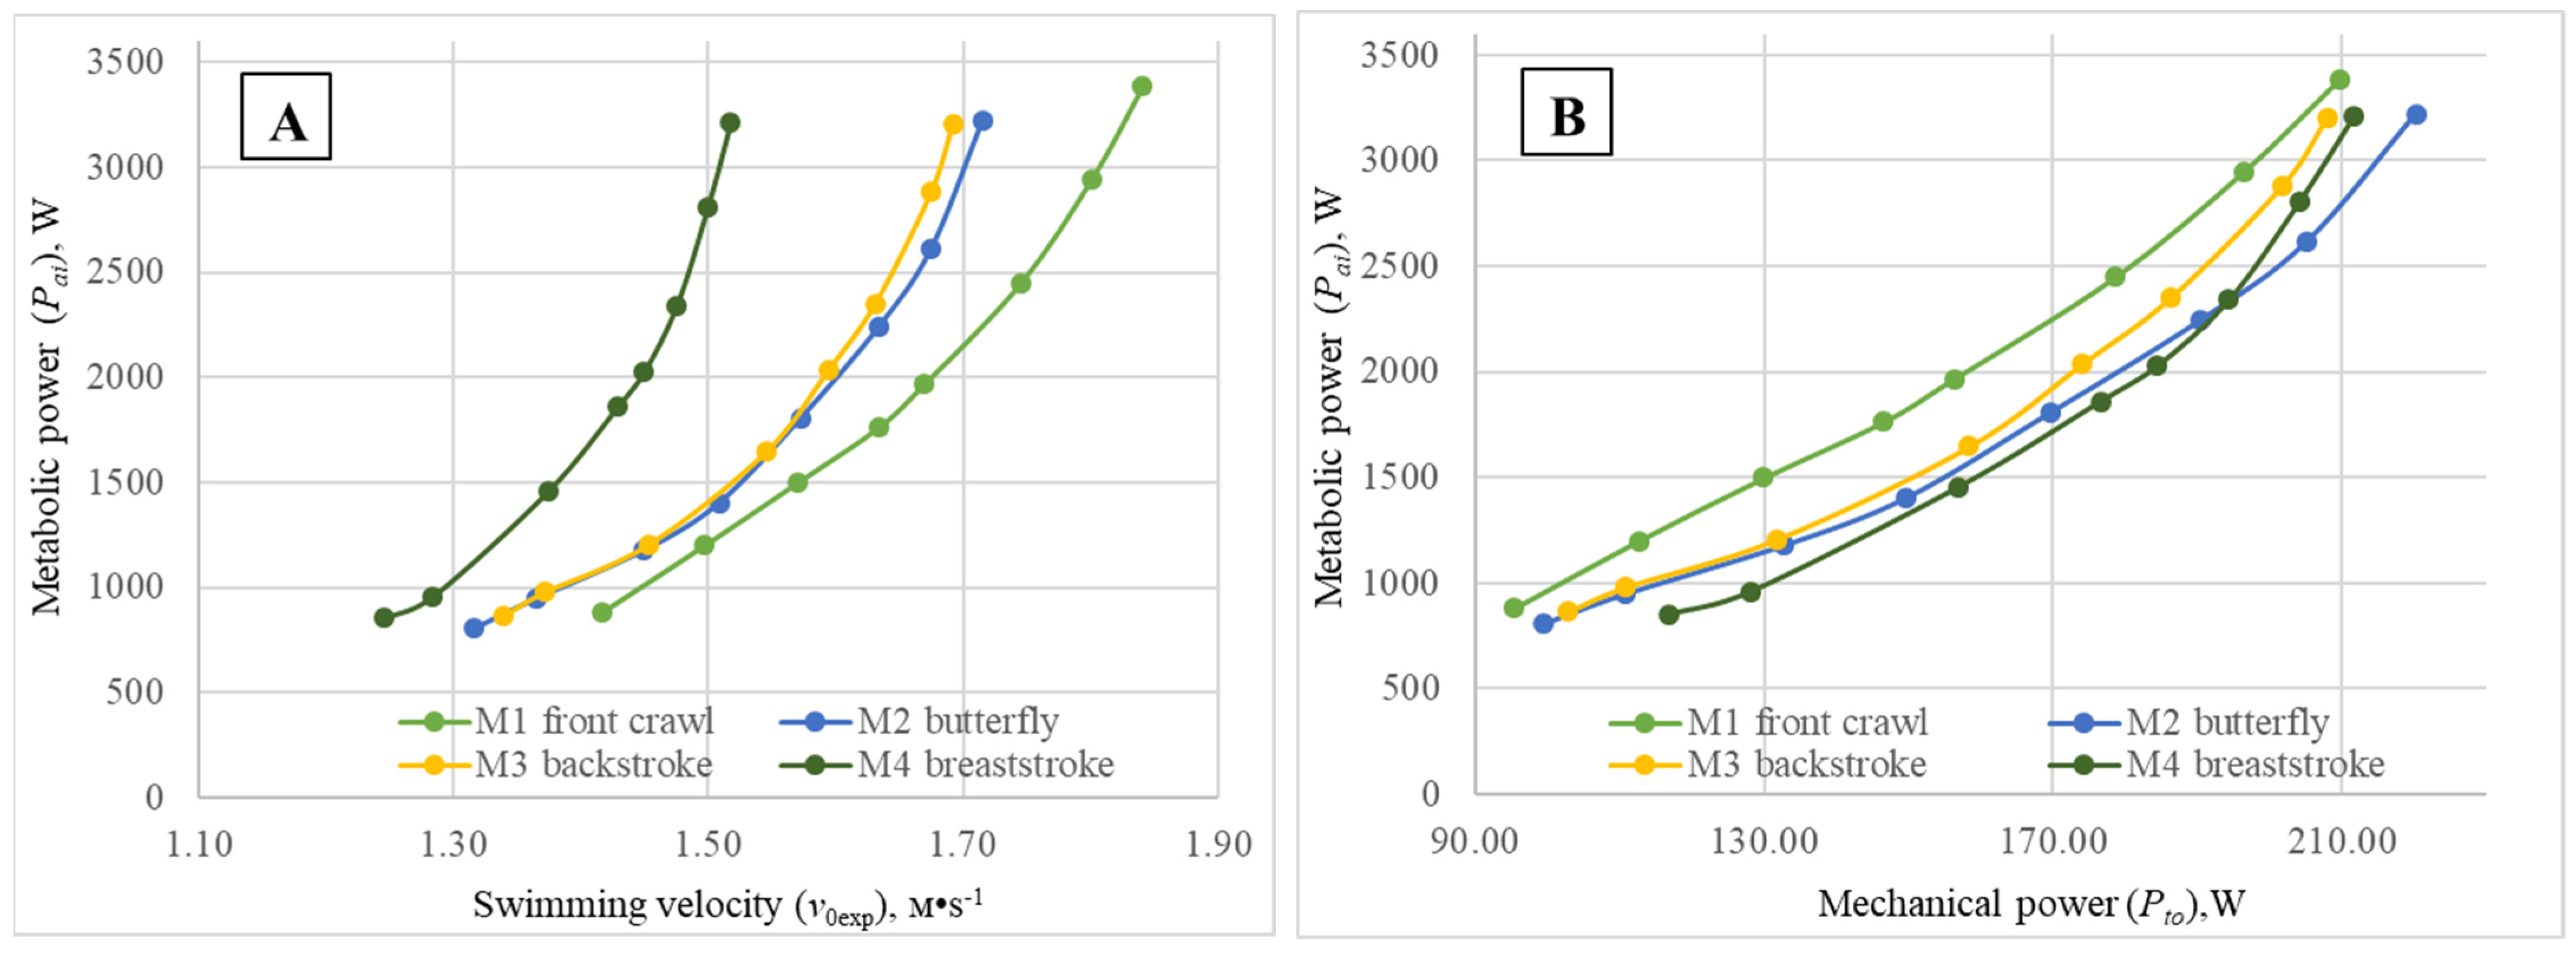
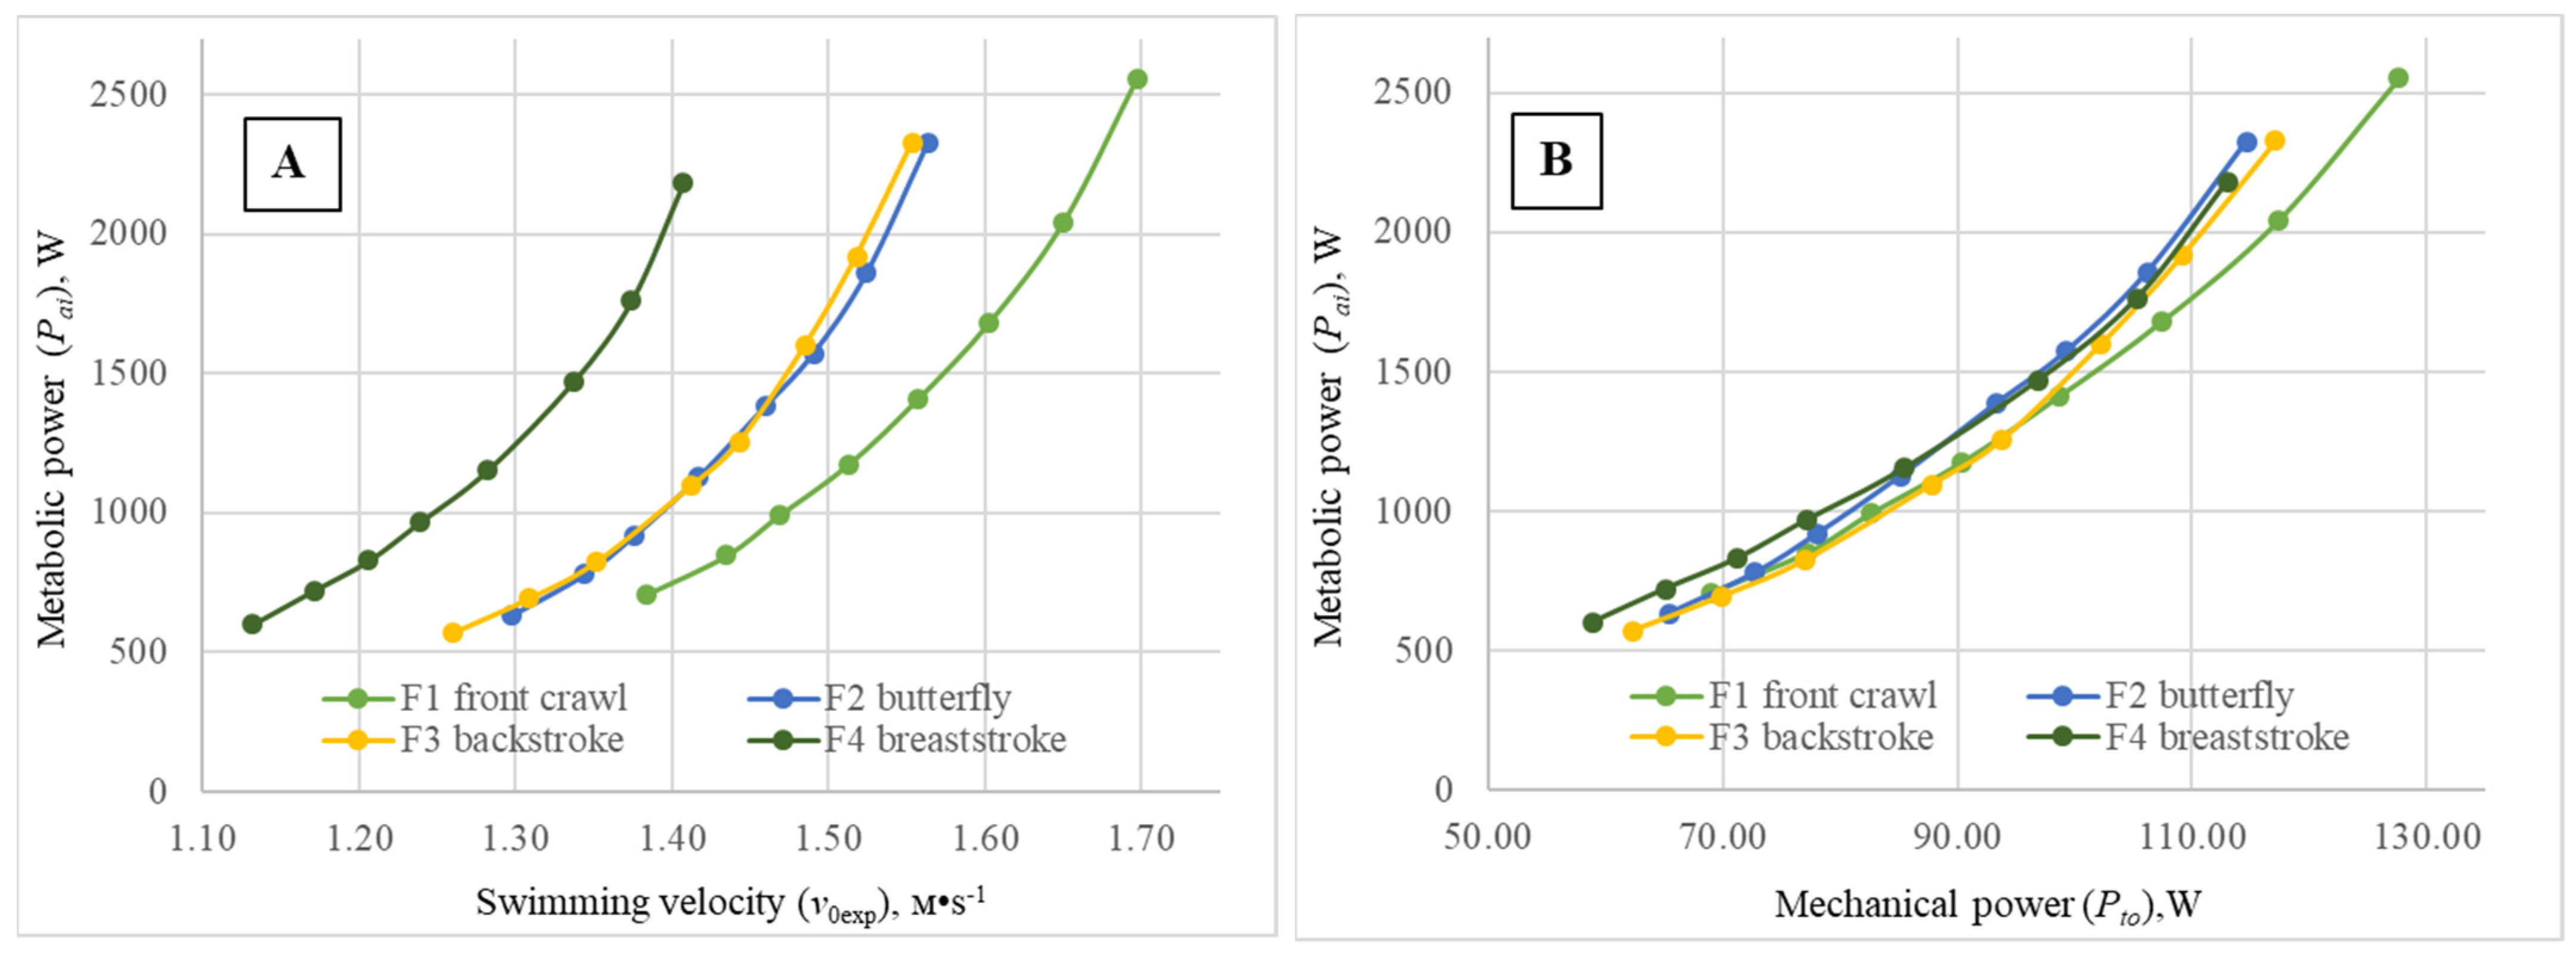
The functional relationship (metabolic curves) between the metabolic power (
Pai) and swimming speed (
v0exp) of female (
Figure 1A) and male (
Figure 2A) subjects in each of the four swimming techniques during the step-test have a similar aspect, but markedly differ in location along the abscissa axis, with the exception of the curves obtained for backstroke and butterfly. A simple analysis of the metabolic curves clearly shows that, at the same level of
Pai, the highest
v0exp values were achieved for the front crawl swimmers, while the lowest were observed for the breaststrokers. Elite subjects specialized in butterfly and backstroke displayed very similar energy cost profiles: for the same
Pai value, practically the same values of
v0exp were obtained. Meanwhile, corresponding curves for the four techniques are located at a higher range of velocities for males compared to female subjects. These results, compared with the previously published ones of a similar nature by Holmér in 1974 [
2] and some years later by Barbosa et al. in 2006 [
1], demonstrate a clear relative evolution of the butterfly technique’s biomechanical quality over the years. Indeed, in the beginning of the 1970s (just after its “independency” from breaststroke), butterfly was shown as the least economic swimming technique. Then, more than 30 years afterwards, it evolved towards a hierarchical position between breaststroke and backstroke. Now, 15 years later, it assumes a similar position as backstroke, inclusively showing some tendency to overtake. The technical hierarchy now unveiled is of extreme importance, as it shows a tendency for the economy profiles to align with the relative velocity of each technique, defined by the world records over the official competitive distances for females and males (especially if taking into account differences in performance imposed by the specific effect of the starts used). Despite the fact that butterfly showed, compared to backstroke, only a slight tendency toward higher unsteadiness (Sh
v) during the 8th step of the test—converging to the previously shown [
3] tendency toward higher intra-cyclic velocity variations—the similar economy profiles of both techniques suggest that some compensatory specific biomechanical and motor control factors may empower the biomechanical quality of butterfly relative to backstroke. This may be related to
Fr(fd), slightly lower for female butterfly, despite being similar for both techniques performed by males. Therefore, the mechanisms might be further searched among the constraints determined by the dorsal position, imposing possible special orientation problems, but mostly, determining difficulties exploring propulsive actions below the trunk due to shoulder amplitude limits. These considerations stress the importance of nonlinear, complex and integrated analysis of multifactorial swimming performance-determining factors, eventually using artificial intelligence, in future swimming biomechanics.
For an objective assessment of the established functional dependencies in all swimming techniques, a traditional approach based on the principle of multiplicity (proportionality) between the power of basal metabolism (
Pbi) and exercise metabolic power (
Pai) [
34,
35]—Brodies’ principle—was utilized. In general terms, this approach assumes that
Pai depends on body mass (
m0), velocity (
v0exp) and movement mode, i.e., the used biomechanical system of cyclic locomotion (walking, running, swimming, flying). This approach is a decisive tool for comparing different modes of locomotion and locomotion of humans and other animals. It should be noted here that
Pbi also depends on
m0 (
Pbi = 3.7 ×
m00.74) and that it is a constant value that can be verified when the human body moves one meter. The main factor of the basal metabolism of warm-blooded (homoeothermic) animals is body weight (
m0). For animals of different species (including bottlenose dolphin weighing 50–250 kg) and humans (on land), the following relationship was obtained:
Pbi = 3.4·
m00.74, 20·10
–3 <
m0 < 3.7·10
3 [
34]. The factor responsible for a slight increase in
Pbi for swimmers is the water temperature (27–28 °C), which is not a thermoneutral zone for humans. As a result of the research, a dependence that takes into account an impact of the temperature factor of the aquatic environment upon basal metabolism was obtained:
Pbi = 3.7·
m00.74, 55 kg <
m0 < 95 kg [
39]. For the conditions of human swimming, we formalized this approach as follows:
where
Pai,
m0,
v0exp,
Cx(ad) and
eg are the same variables as previously identified. Analysis of the calculated metabolic curves obtained on the basis of Equation (7) in all swimming techniques showed that relationships between
v0exp and
Pai obtained during swimming in humans are similar to those for warm-blooded animals, including for bottlenose dolphin [
34,
35]. Regardless of the swimming technique, the value of maximum deviation of the experimental metabolic curve regarding the calculated dependence over the entire range of
v0exp does not exceed ±2% for females and 4% for male swimmers.
Pto values obtained for the four swimming techniques (
Figure 1B and
Figure 2B) just slightly differed between swimming modes over the entire estimated range of
Pai values. Thus, for all swimming modes performed by females, at an energy input of
Pai = 1000 W, the difference between minimal and maximal values of
Pto is less than 7 W, and at
Pai = 2000 W, the difference between swimming techniques is Δ
Pto < 8 W. With comparable values of
Pai = 1500 W, for all swimming techniques performed by males, the difference between minimal and maximal values of
Pto is less than 25 W, and for
Pai values of 3000 W,
Pto < 16 W. In addition, the
Pto values over the entire studied range of
Pai values were markedly higher than the comparable values obtained for the female subjects, expressing expected gender differences. Consequently, total mechanical power should not be considered a relevant discriminant factor among the four swimming techniques.
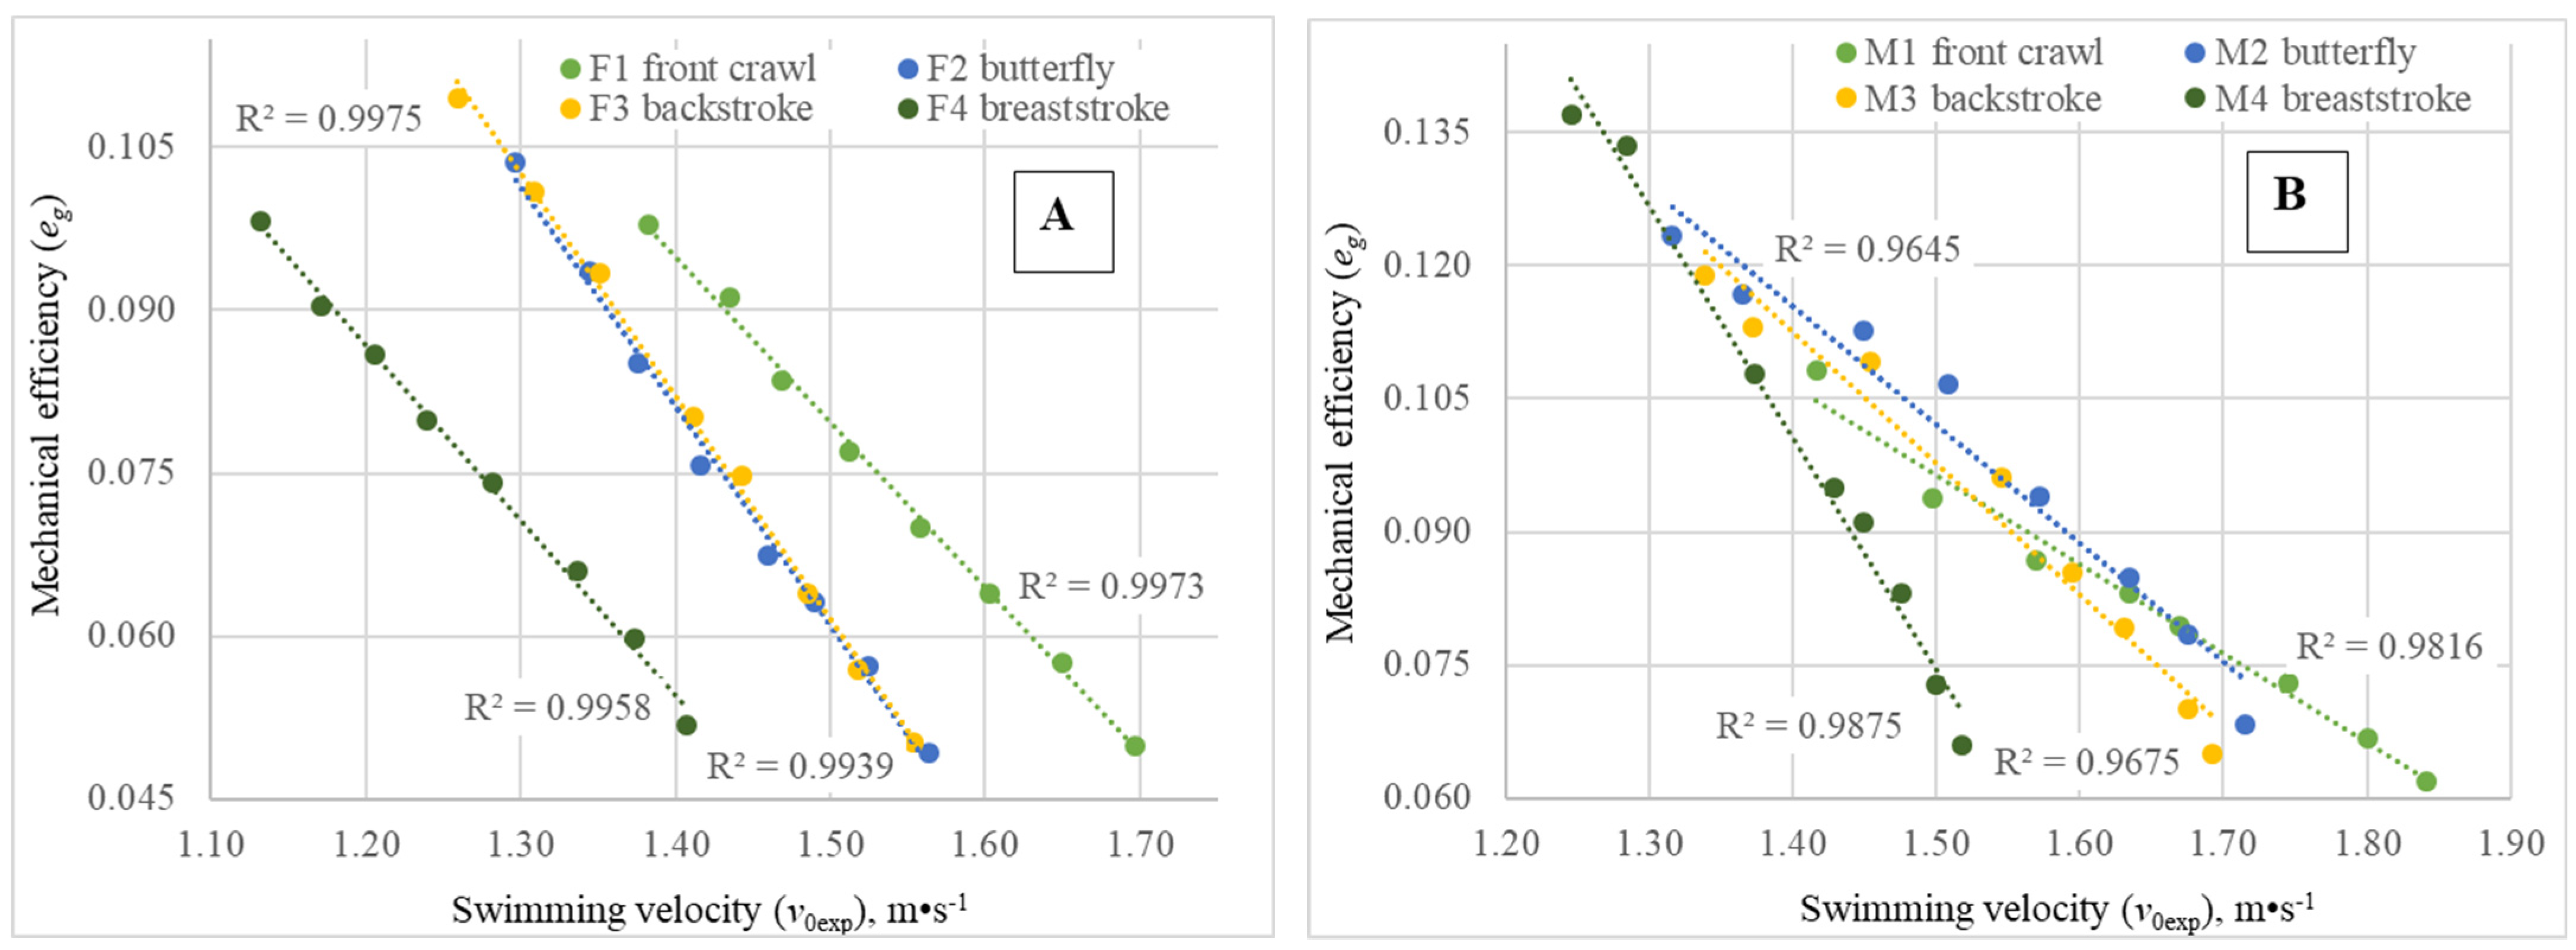
In all four swimming techniques, the mechanical efficiency (
eg) was in inverse linear dependence of
v0exp, both for males and for females (
Figure 3A,B), at least for the range of tested velocities. For aquatic locomotion, such a dependence may be easily understood from Equation (5) and in association with the conditions of the swimmers’ propulsive segments’ (arms, legs and, in some swimming strokes, the trunk) interaction with the aquatic medium. In contrast to terrestrial cyclic locomotion (walking, running), where the distal part of the propulsive segment interacts with a stationary surrounding, in swimming locomotion, a fluid medium is involved, which moves relative to the mover as a consequence of any action of the latter. Consequently, with increased swimming velocity, it is expected to obtain a higher value of P2—Equation (5)—expressing a higher amount of energy wasted to increase the kinetic energy of the water mass surrounding propulsive segments. The
eg values obtained in our study for the female swimmers at
Pai = 1000 W were in accordance with those observed during front crawl swimming at similar
Pai values by another experimental method: the MAD system [
38].
A comprehensive quantitative and interrelated analysis of the studied variables’ influence on
v0exp in various swimming techniques in female (
Table 2) and male (
Table 3) swimmers was performed for the last stage of the step-test, utilizing the model described in Equation (1). It was found that the swimming velocities attained differ from technique to technique and are in the same hierarchical sequence shown by the metabolic curves (females: max
v0exp = 1.70 m·s
−1 in front crawl, min
v0exp = 1.41 m·s
−1 in breaststroke; males: max
v0exp = 1.84 m·s
−1 in front crawl, min
v0exp = 1.52 m·s
−1 in breaststroke). Simultaneously, the metabolic power range between
Pai values was between a maximum of 2575 W (front crawl) and a minimum of 2248 W (breaststroke) for females, and between a maximum of 3560 W (front crawl) and a minimum of 3400 W (backstroke) for males. Male values were higher, as expected, than those obtained for female subjects. The referred differences are primarily related to the swimming time of the last 100 m lap of the step-test (for females,
t = 58.1 s in front crawl and
t = 70.3 s in breaststroke, and for males,
t = 53.5 s in front crawl and
t = 65.1 s in breaststroke).
Values of
Pai(sa) were quite acceptable when comparing results from the Wilkie’s approach (second approach described in the Methods Section) to determine the metabolic power at the last stage of the test (as
Pai(sa) =
Pti −
Pbi). Only slightly higher individual values (as Δ =
Pai(sa) −
Pai) than those obtained through Equation (2) and presented in
Table 2 for females: minΔ = 21 W front crawl, maxΔ = 171 W backstroke, and
Table 3 for males: minΔ = 146 W for backstroke, maxΔ = 270 W for breaststroke, were observed.
In all swimming strokes,
Pto and
eg values were within a relatively narrow range of values, both for females and males (
Pto: females: max = 128 W in front crawl, min = 113 W in breaststroke, males: max = 220 W in butterfly, min = 208 W in backstroke;
eg: females: max = 0.052 for breaststroke, min = 0.049 for butterfly, males: max = 0.068 for butterfly, min = 0.062 for front crawl). It is important to note that maximum and minimum values of
Pto and
eg were observed in different swimming techniques for both genders. According to these values (
Pto and
eg), male swimmers have an obvious advantage over females. The indicated range of
eg values at maximum swimming speed is expressively lower than
eg values previously obtained for female and male subjects during land locomotion at maximum intensity (females:
eg = 0.17–0.19, males:
eg = 0.20–0.23) [
19].
Meanwhile, in a large analytical review [
18] devoted to the analysis of
eg obtained using various experimental methods, the authors indicated a significantly wider range of values of this variable than those obtained in our study—from 0.03 to 0.23, though the maximum
eg values obtained when determining
Pto in on-land activity using a simulator (a whole-body “swimming ergometer” [
40]) coincide with the magnitudes of
eg established in tests on a bicycle ergometer. It should be noted here that methods which simulate swimming movements using dry-land ergometers violate such important criteria as Re
l and Sh
v, which contradicts the theory of mechanical similarity and the dimensions of nonstationary processes [
34,
35,
36] and makes it difficult to correctly compare such data with the results that are obtained in real aquatic locomotion (such as swimming).
In all swimming strokes,
ep values for male swimmers were within a range of values between 0.71 (in breaststroke) and 0.65 (in butterfly), which does not differ from analogous indicators for female subjects: max 0.71 in breaststroke, min 0.67 in front crawl and butterfly. Male and female subjects do not differ from each other in this variable, which is in accordance with earlier experimental data [
16,
38]. According to this characteristic, elite swimmers are inferior not only to dolphins, but also to elite mono-fin swimmers. Data obtained using various experimental and analytical methods [
34,
35,
37] show that dolphins and the best mono-fin swimmers demonstrate
ep values > 0.90, while
ep for elite swimmers was within the range 0.65–0.71. In human aquatic locomotion, the mechanical efficiency (
eg) is almost an order of magnitude lower than the propelling efficiency (
ep), which is associated with the laws governing the transformation of metabolic energy into mechanical energy in the first stage.
The
Fr(fd) values of male and female subjects at the maximum swimming velocity depend on the swimming technique, since each competitive mode has a different degree of non-stationarity of the complete biomechanical cycle of movements. The Strouhal number (Sh
v) accurately assesses this non-stationarity. Consequently, intra-cycle velocity variations, which are due to various biomechanical factors in each particular swimming stroke, affect the efficiency of humans’ aquatic locomotion. Values of
Fr(fd) obtained for the different swimming techniques demonstrate a tendency for an inverse relationship with maximal
v0exp allowed for swimmers of both genders, and are within the range of min = 79 N (for front crawl) and max = 99 N (for breaststroke) in male swimmers. For females, a maximal value of 57 N was found in breaststroke and a minimal value of 49 N in butterfly. The analysis of the obtained
Fr(fd) values based on Equation (6) made it possible to identify the main reason for the observed tendency, which is a significant increase in the biomechanical cycle mean values of the dimensionless coefficient of the frontal component of the active drag force in the unsteady mode of body motion (
Cx(n)). For the last stage of the step-test, this increase occurred, among all competitive swimming strokes, in the following sequence: front crawl, backstroke, butterfly and breaststroke, and similarly for males and females (
Table 2 and
Table 3). This hierarchic order of
Cx(n) is associated with the various biomechanical systems of inter-segments’ motion (determining the mechanism of interaction of the propulsive segments with the water for each swimming technique), which leads to an increase in the non-stationarity of the locomotion process and to the difference between the minimum and maximum values of
v(pb)(t) achieved in different swimming techniques. This conclusion for swimmers of both genders was confirmed by similar changes in the Strouhal number (
Table 2 and
Table 3), which was determined based on experimental data (for females: min Sh
v = 0.201 in front crawl, max Sh
v = 0.933 in breaststroke, for males: min Sh
v = 0.225 in front crawl, max Sh
v = 0.991 in breaststroke). Therefore, values of
Fr(fd) are the main reason, both for female and male swimmers, for the observed difference in swimming velocity between the competitive swimming techniques.
5. Conclusions
The frontal component of the active hydrodynamic drag force that swimmers need to overcome is the main reason for the existing differences in maximal swimming velocity attainable in the four different swimming techniques used in competition.
In all swimming techniques and for both genders, as expected, metabolic power values and mechanical power increased with exercise intensity, but gross mechanical efficiency decreased. Furthermore, the variation in metabolic power with swimming velocity, taking into account body weight, dimensionless coefficient of active hydrodynamic drag force and mechanical efficiency, was formalized by the standard mathematical model used in the analysis of aquatic locomotion of animals, which is the same for the various swimming techniques. Nevertheless, for the first relationship, curves were distributed across the abscissas axis as a function of energy cost of locomotion, with higher values for breaststroke and lower values for front crawl, with intermediate and very similar functions for backstroke and butterfly. Regarding the second relationship, expressing the inverse of mechanical efficiency, the different swimming techniques were almost grouped, especially for females. This last finding pointed out very similar mechanical efficiency values for females swimming the four swimming techniques and quite close inter-technique comparative values for males, despite an observable tendency for slightly lower values in front crawl.
In all swimming competitive modes, males surpass females in terms of metabolic power, total external mechanical power and mechanical efficiency, which are the main reasons for their advantage in terms of maximum swimming velocity. The functional relationships between v0exp and Pai, obtained in this study through the step-test in elite male and female swimmers, correspond to the main metabolic, biomechanical and hydrodynamic patterns previously obtained in swimming animals.
At maximum swimming velocity, male subjects developed higher
Pai values than female subjects. The dimensionless coefficient
Cm =
Pai ×
Pbi−1, estimated for the last stage of the step-test, allowed us to compare the values of the active metabolic power of human swimmers with those of animals (
Table 2 and
Table 3). Elite female swimmers at a distance of 100 m are able to develop
Pai values that exceed basal metabolism by 27–32 times, and male swimmers by 33–37 times, which exceeds the amount of the metabolic power of warm-blooded aquatic animals. Therefore, it becomes clear that the potential for significant progress in increasing the maximum energy metabolism of elite athletes is limited. These factors stress the relevance of optimizing human swimming biomechanics as the best and most profitable strategy to empower performance progressions.


