
Design Considerations for the Liquid Air Energy Storage System Integrated to Nuclear Steam Cycle


Abstract
:1. Introduction
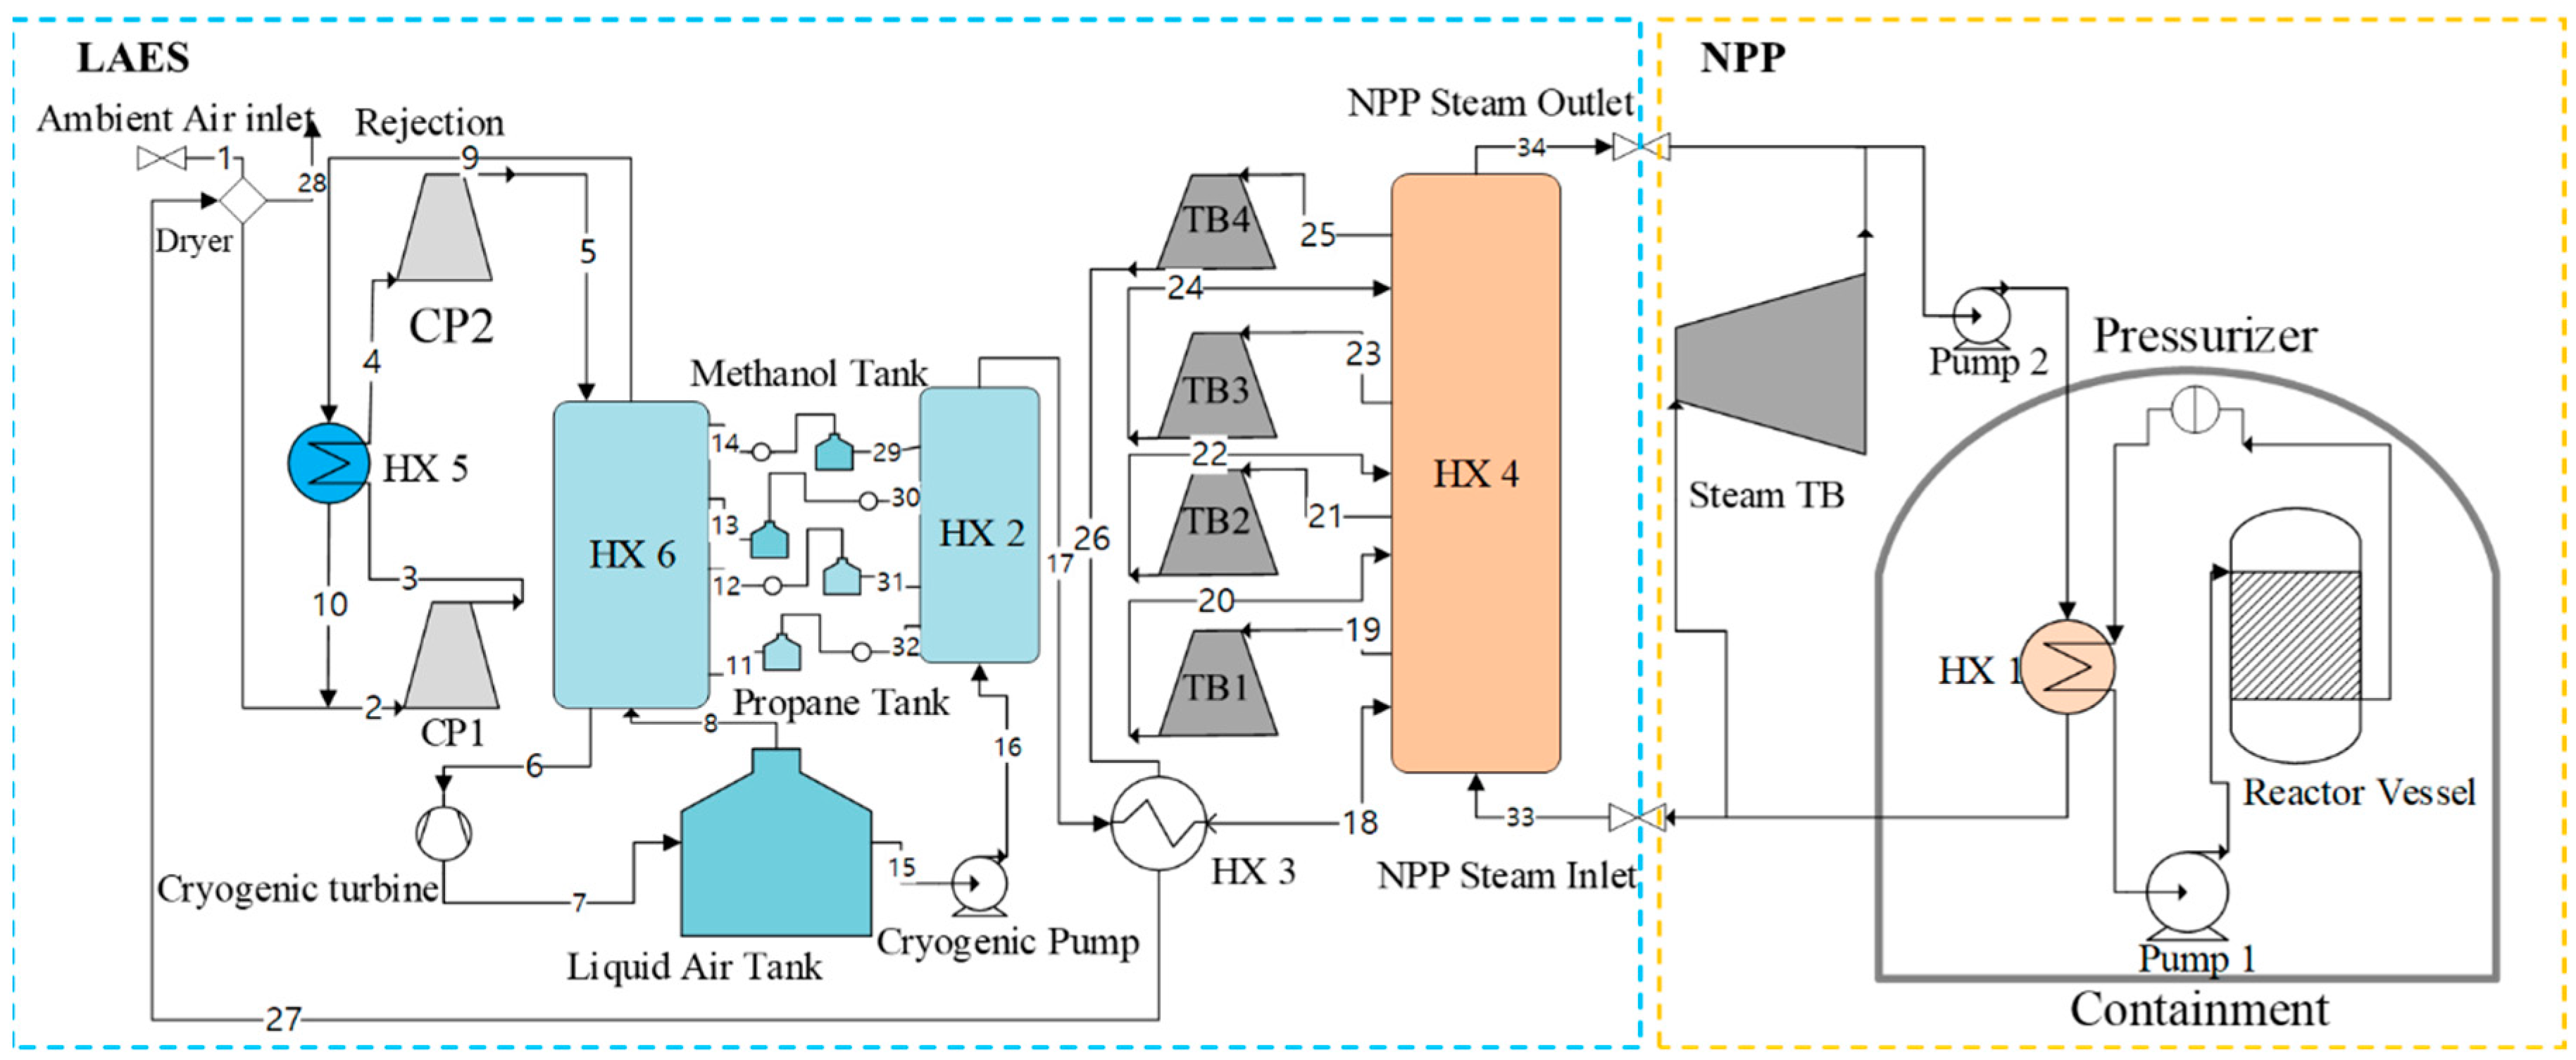
2. Analysis Methodology
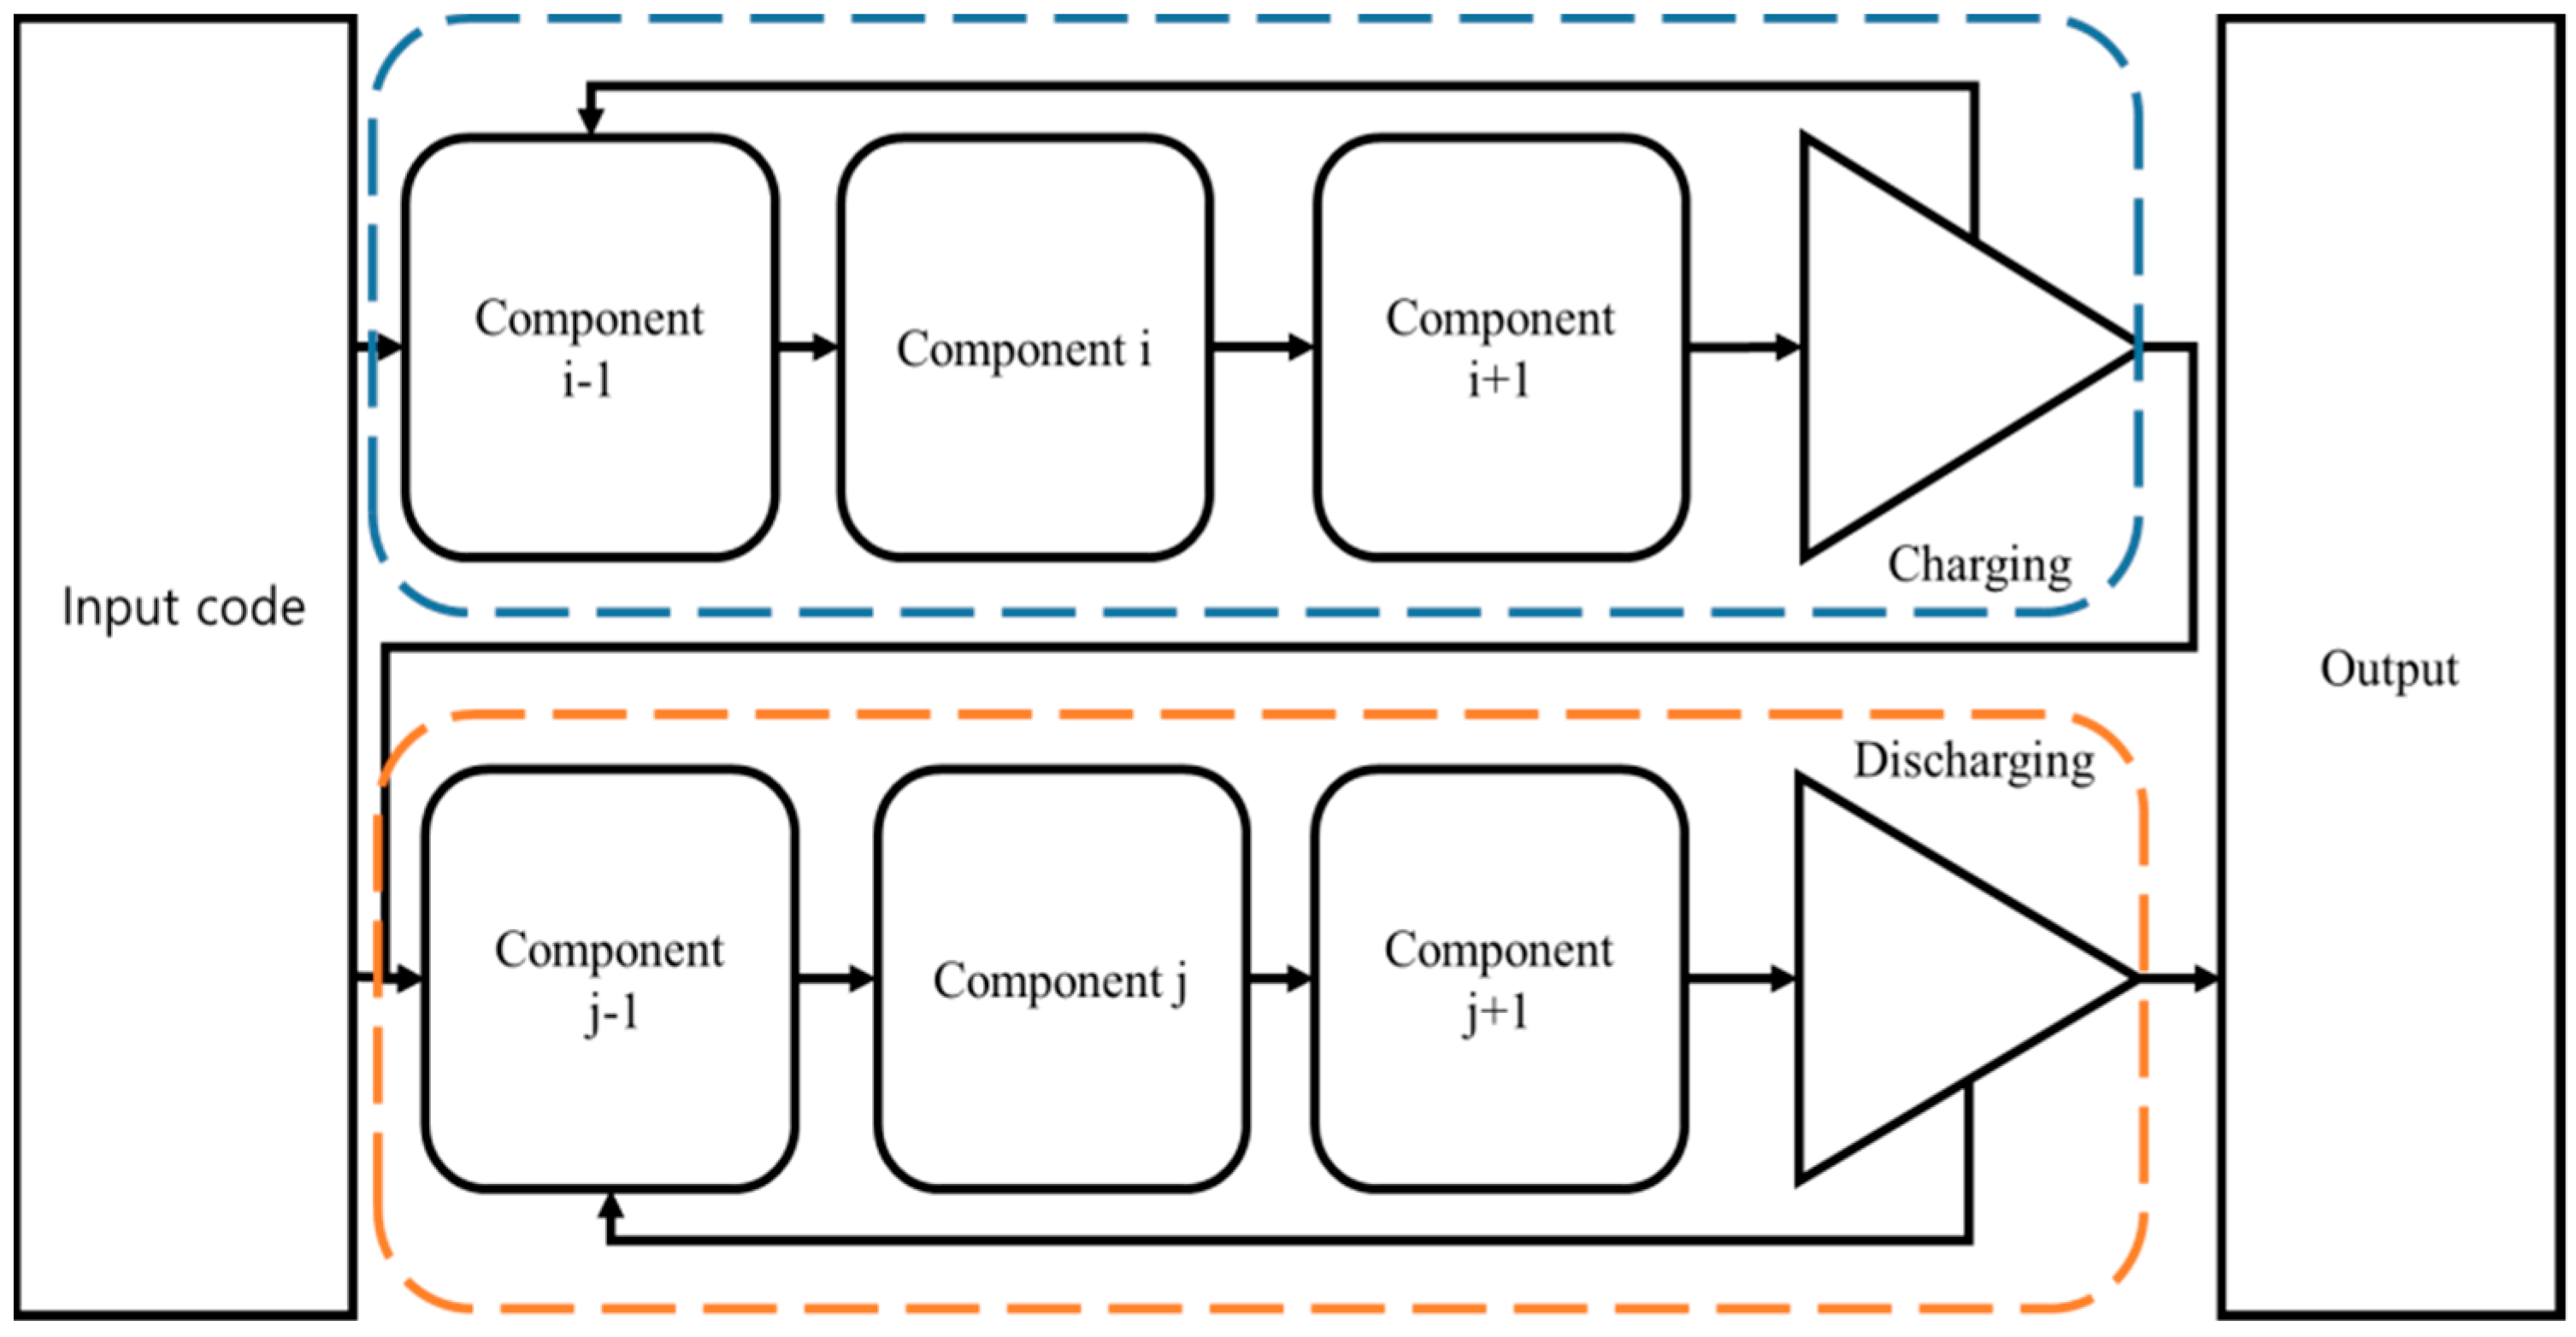
2.1. General Code
- (1)
- Pinch temperature of heat exchanger: The pinch temperature for heat exchangers in the reference [15] is 2K pinch. However, when designing a heat exchanger, typically 5K or larger values are assumed for the pinch due to economic reason and increased pressure drop for excessively low pinch design condition. Therefore, in this paper, the pinch temperature in the heat exchangers is changed to 5K.
- (2)
- Pressure drop: Pressure drop in components and piping always occurs. Due to this pressure drop, the pressure of fluid decreases while flowing through the system. This generally influences the overall performance of the system.
- (3)
- Ambient temperature: In the realistic system, the ambient temperature is always changing. As an LAES system is an open system that takes in air from the atmosphere, the temperature of ambient air affects the performance of the system.
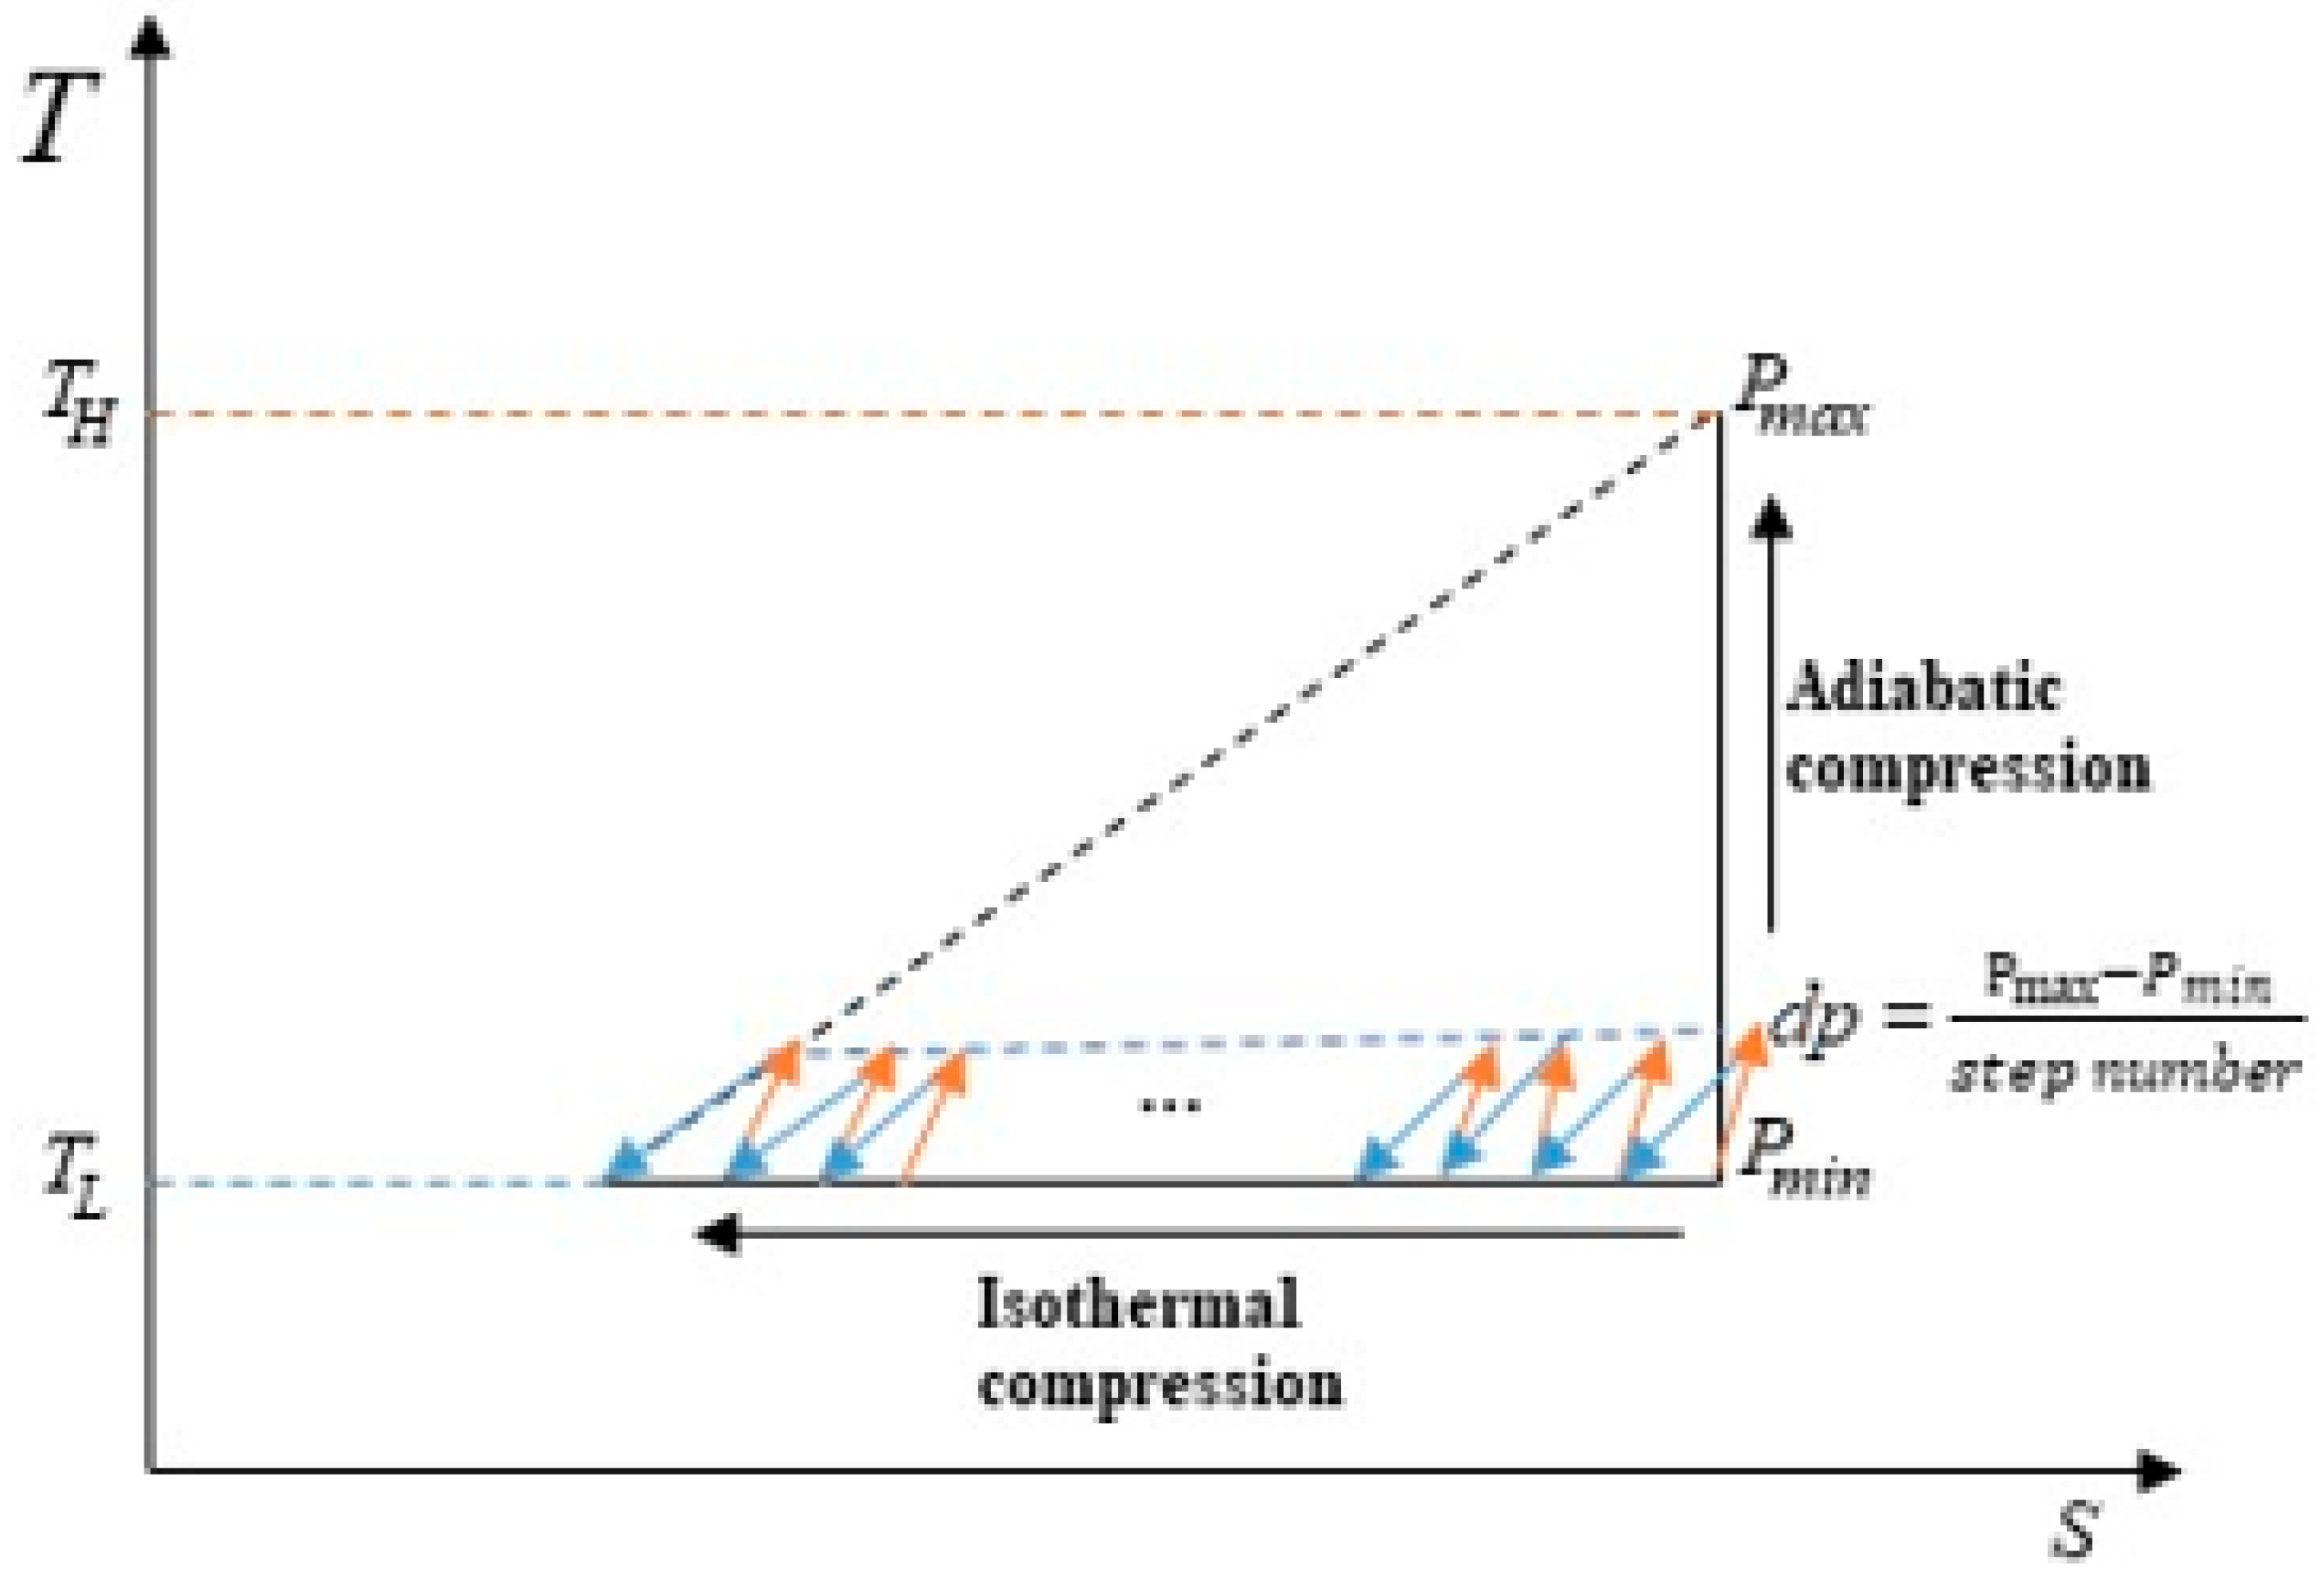
2.2. Compressor (Isothermal)
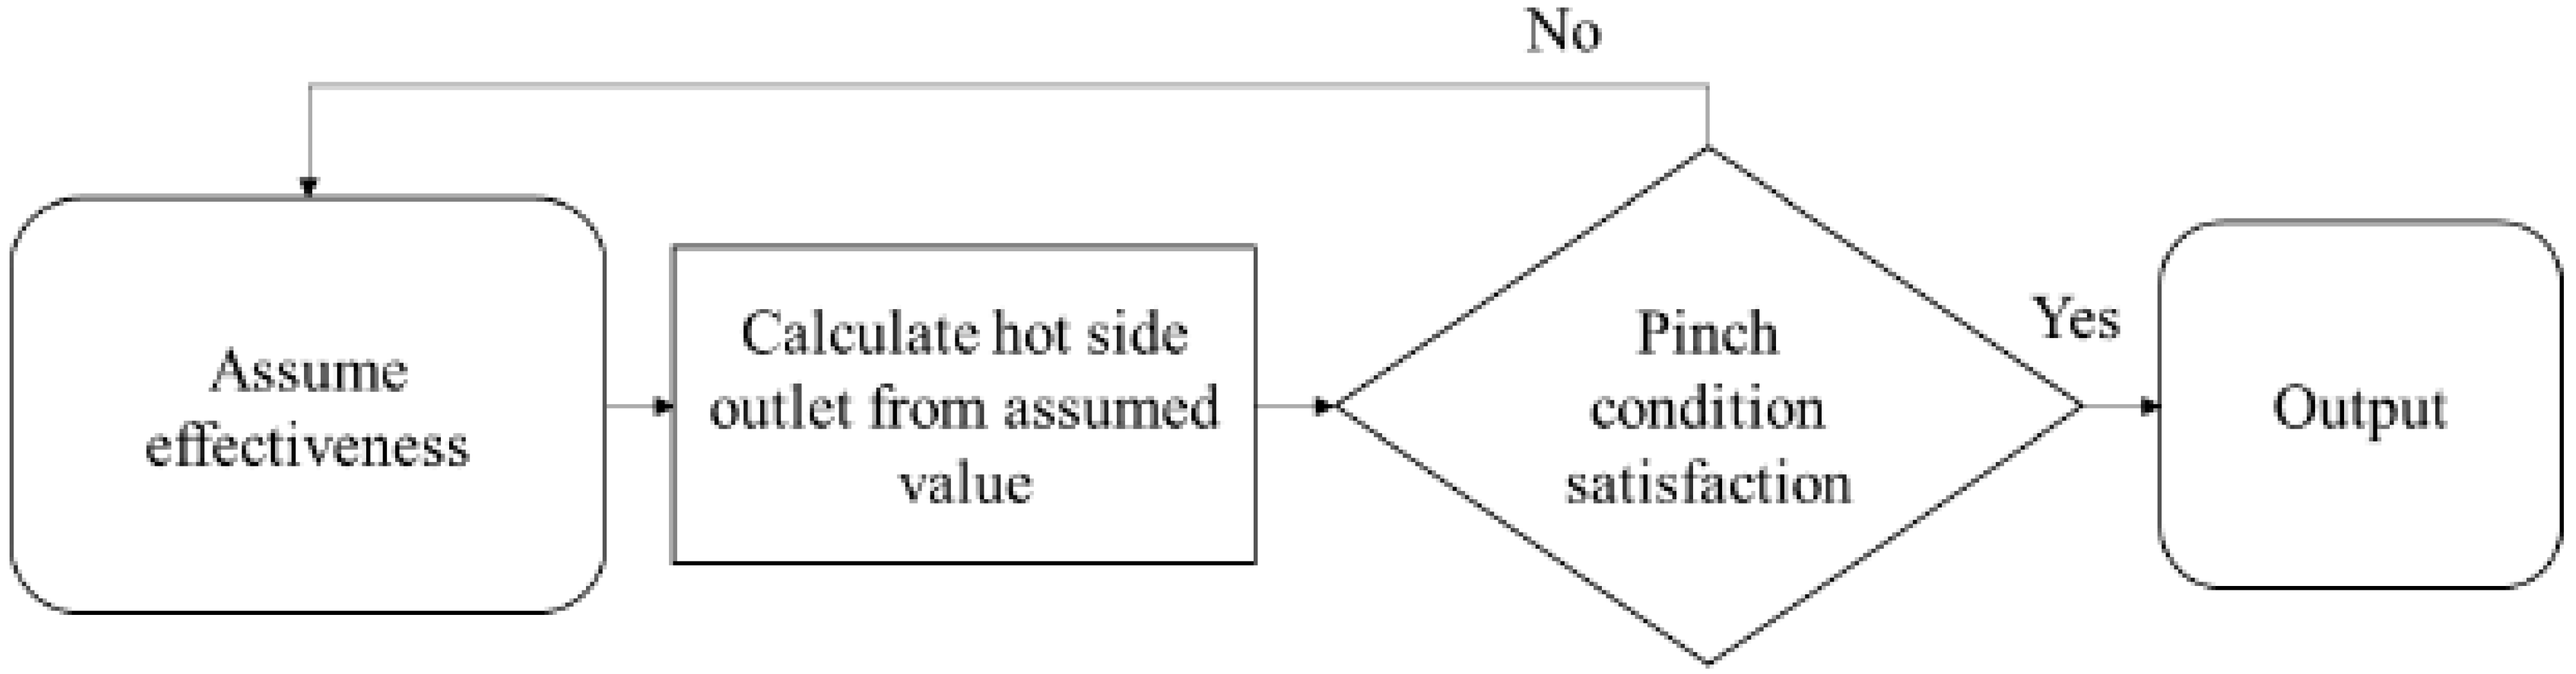
2.3. Heat Exchanger
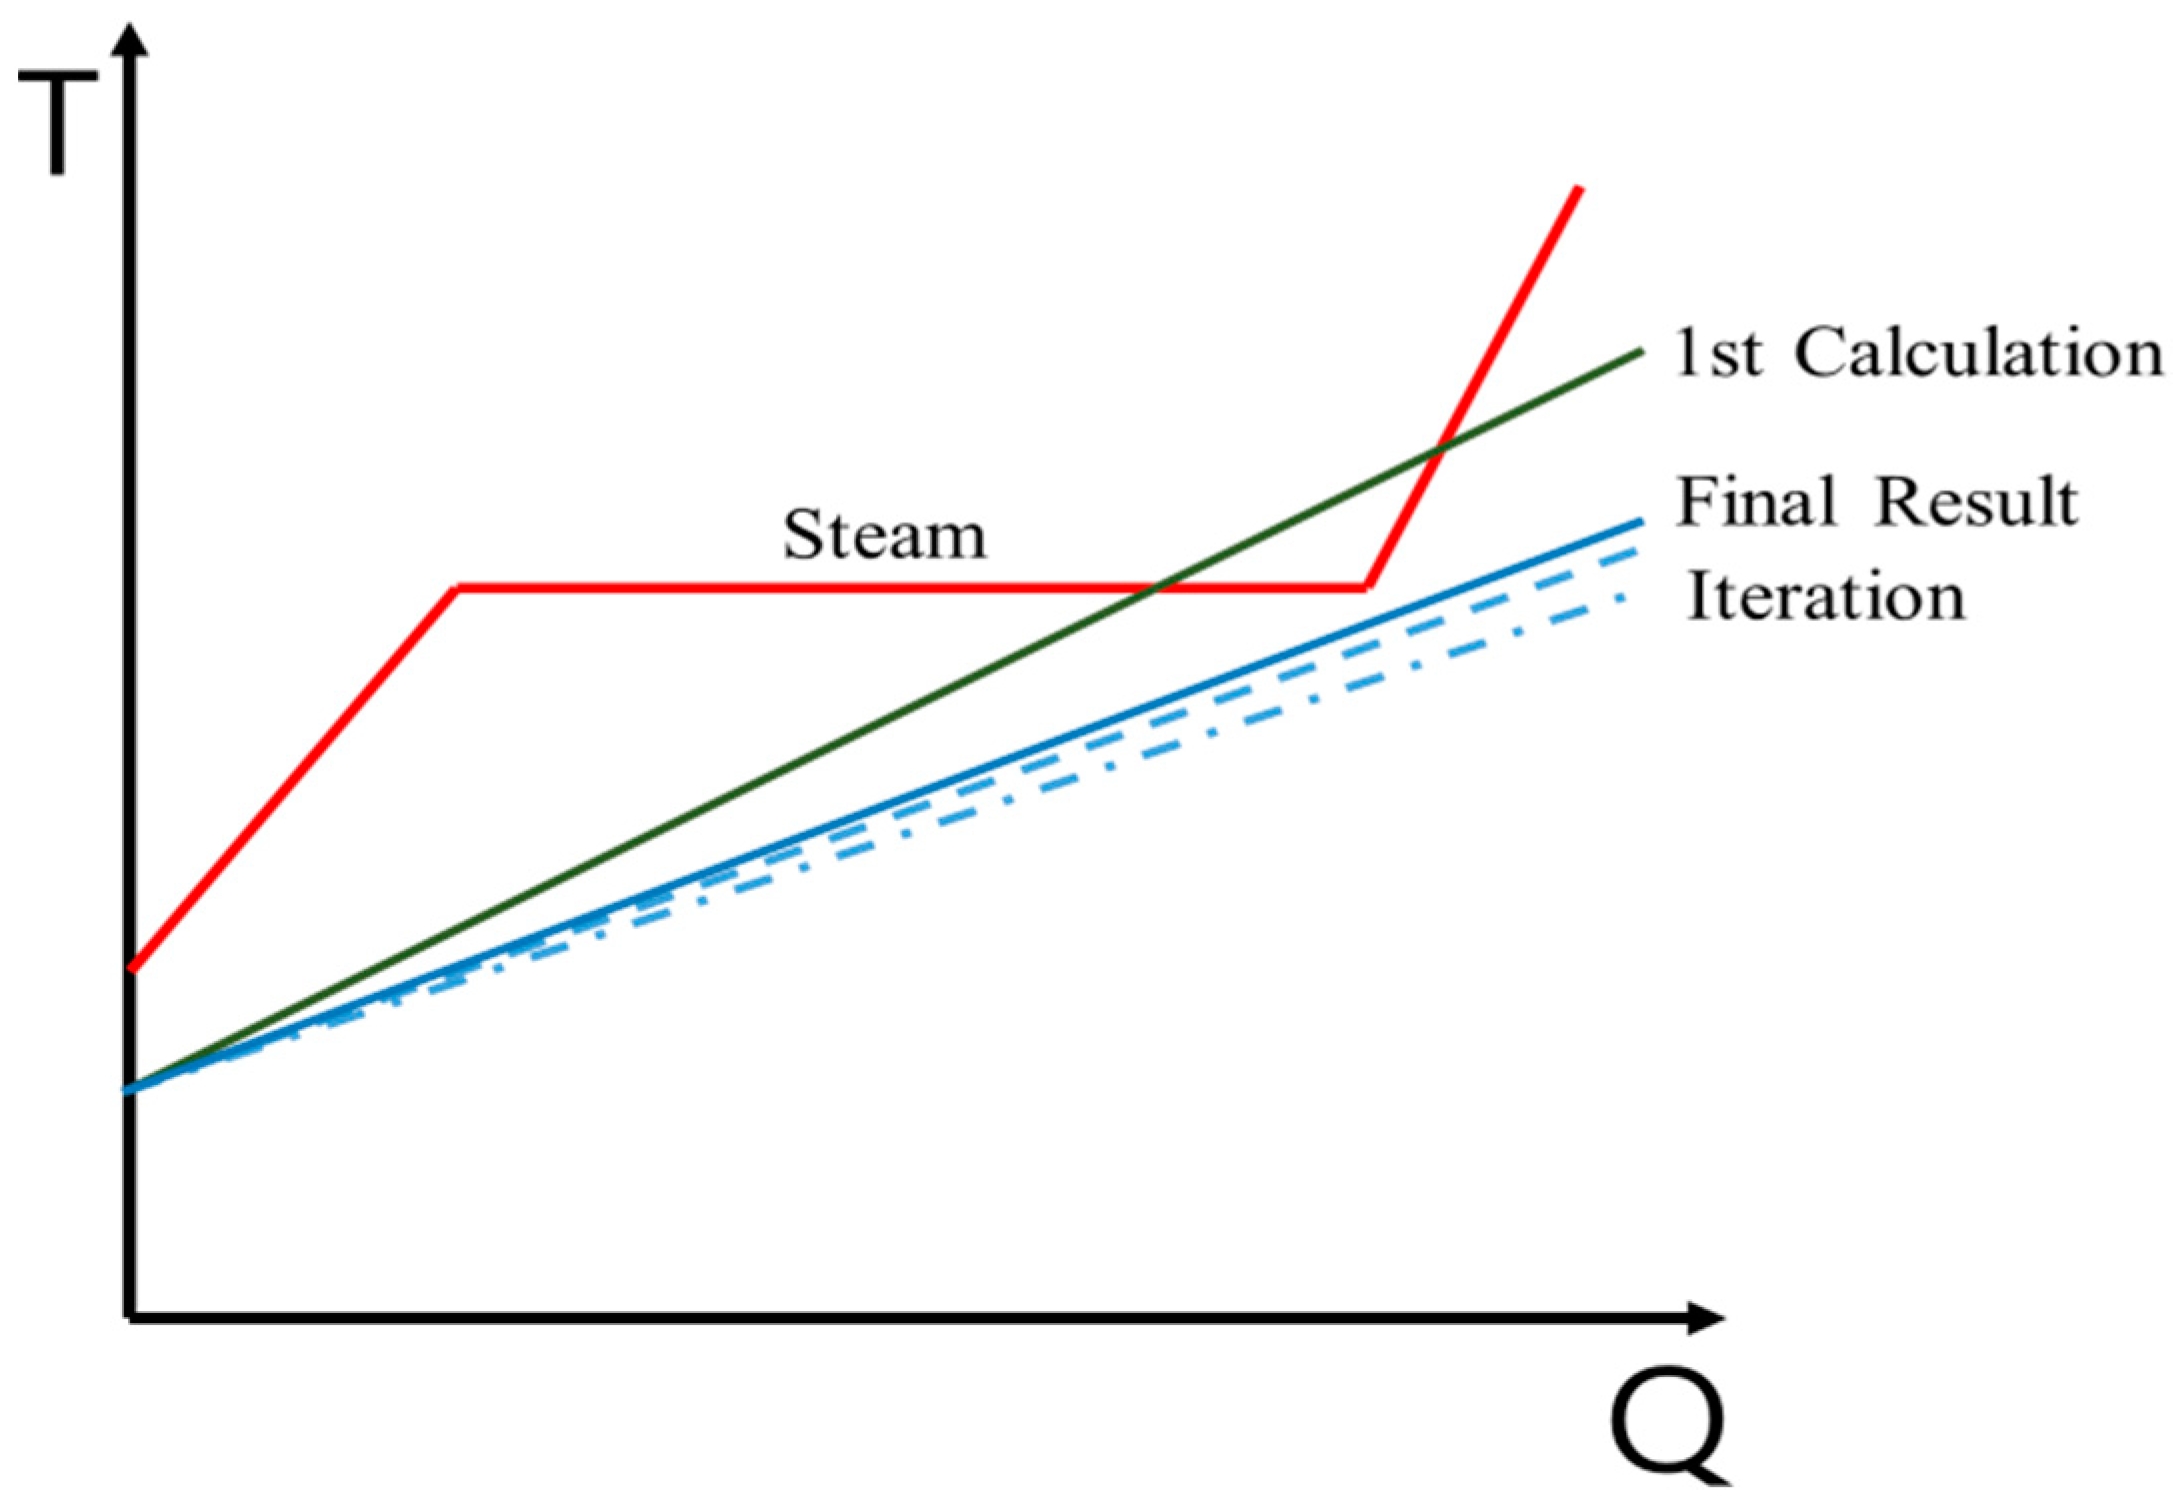
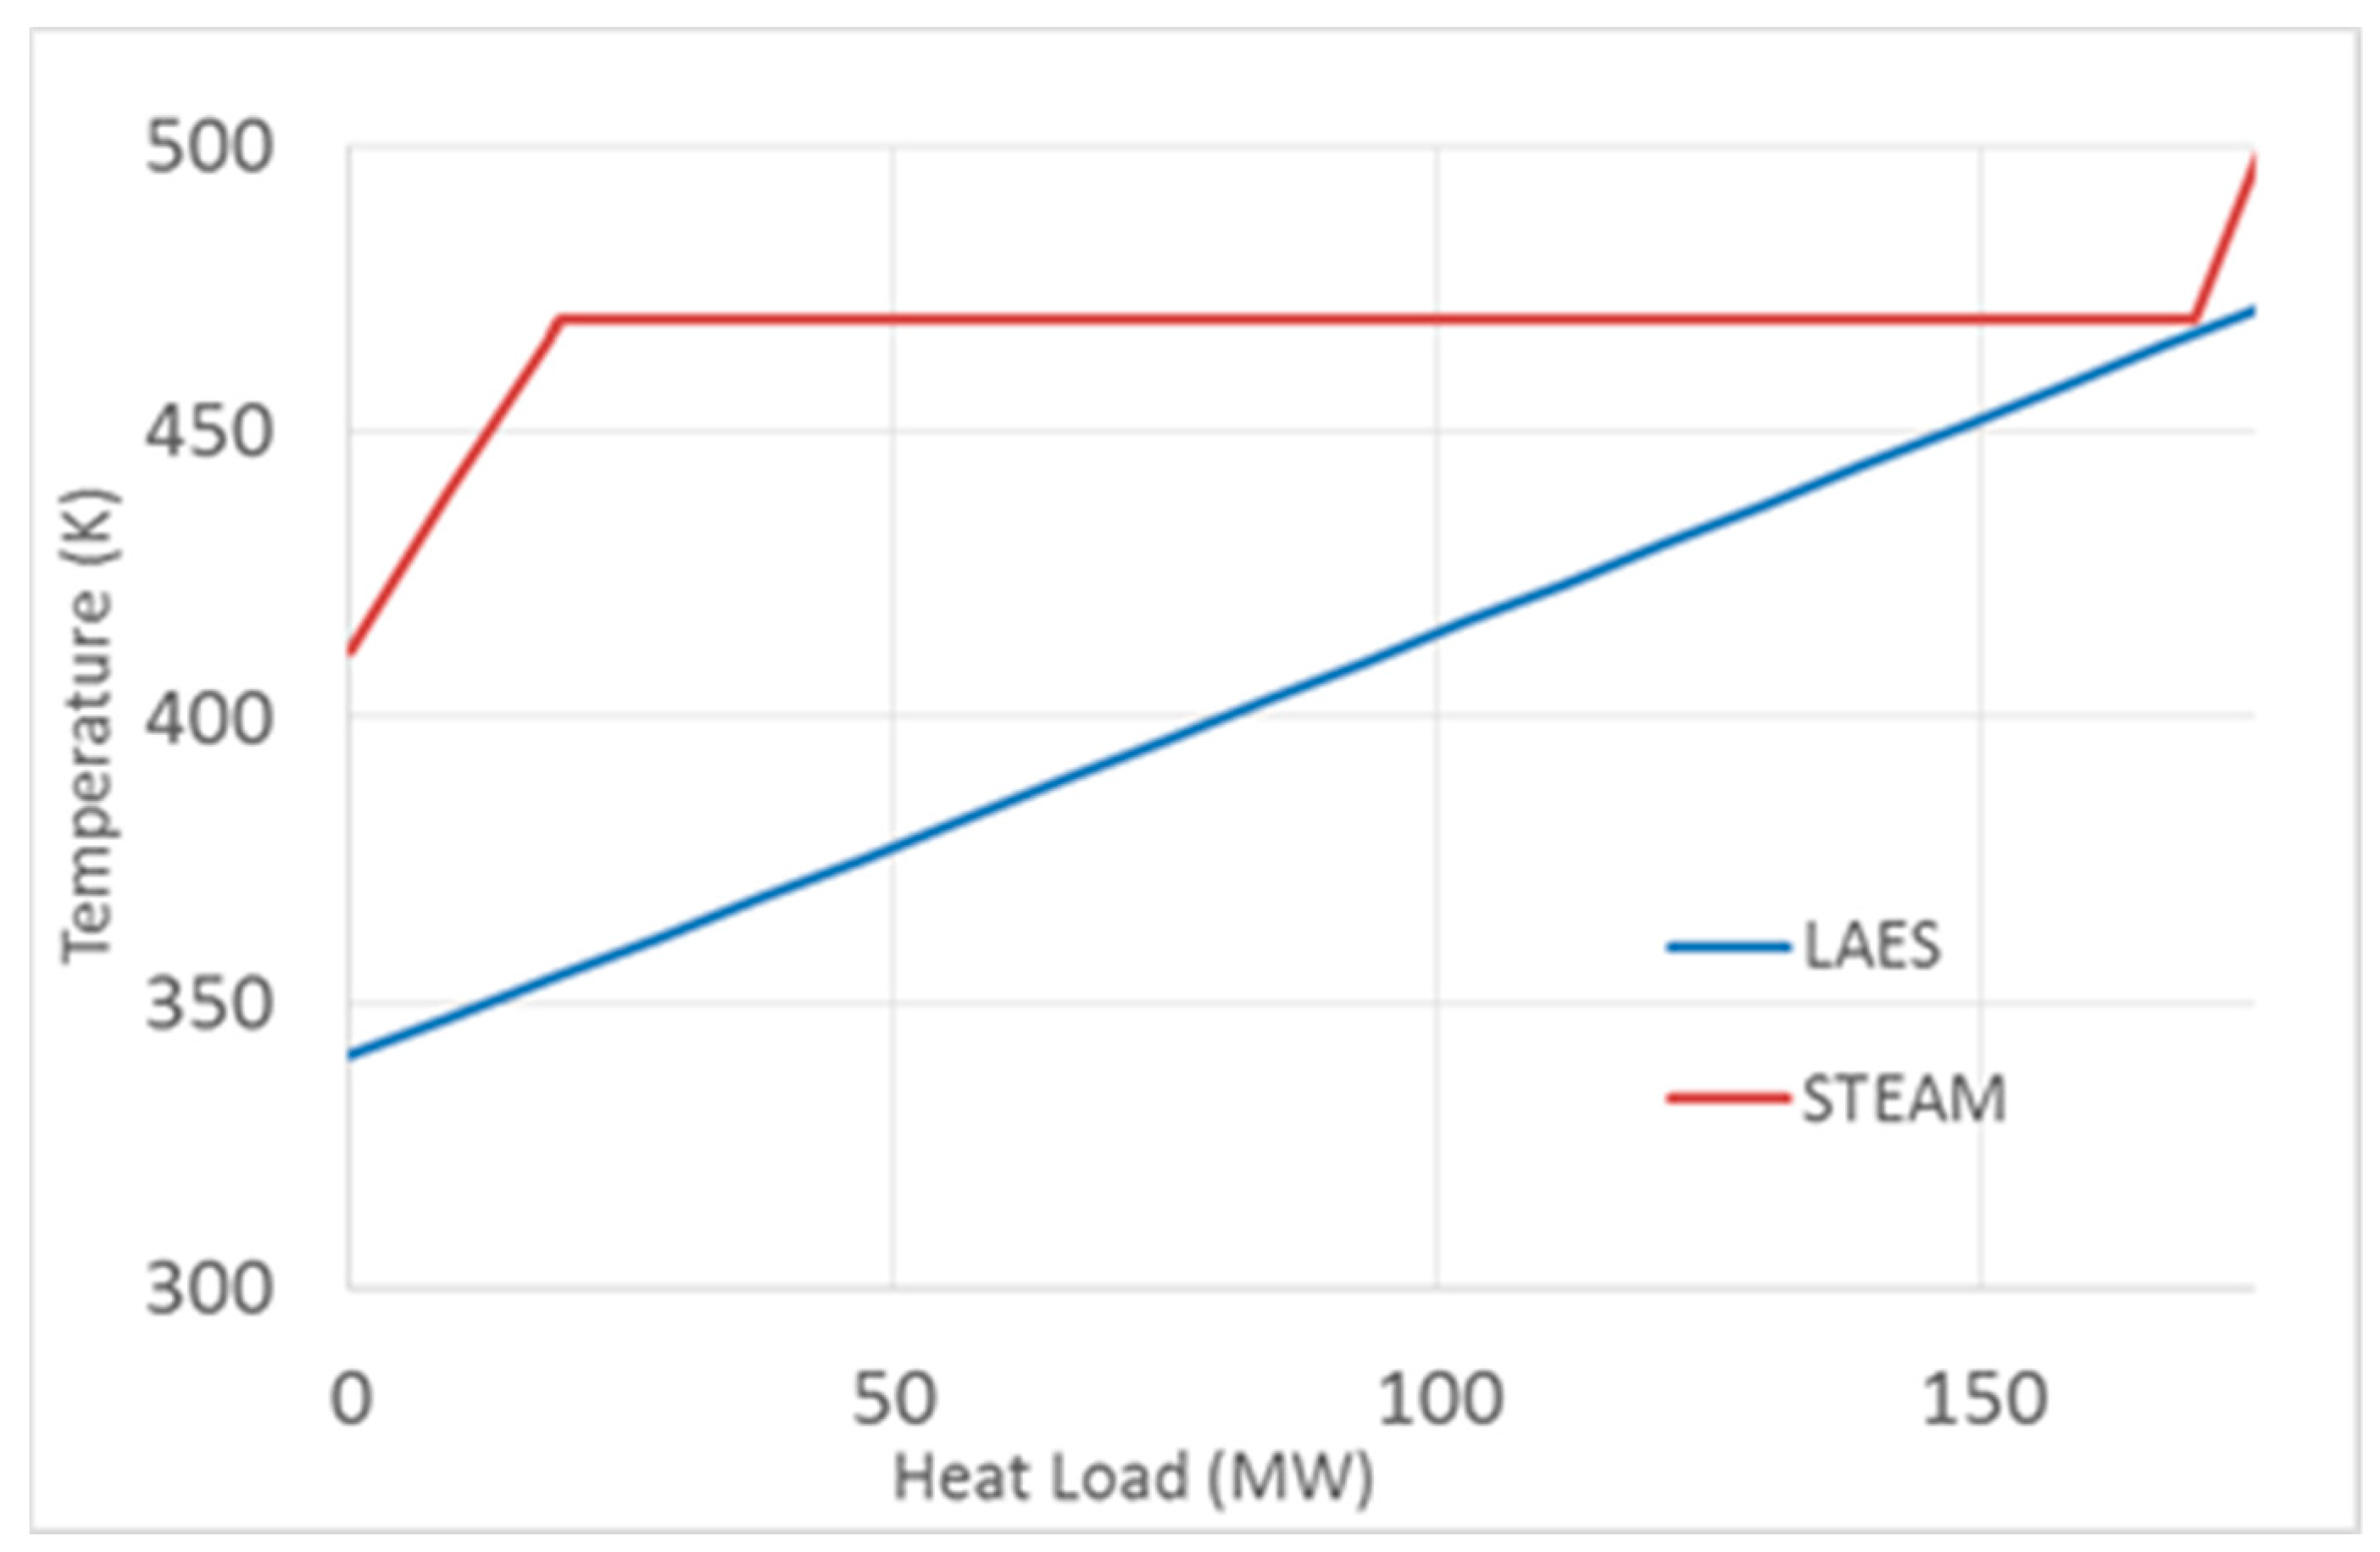
2.4. Heat Exchanger (Air to Steam)
2.5. Exergy Calculation
2.6. Round-Trip Efficiency
3. Result and Discussion
3.1. Comparison of Result
3.2. Pinch Effect
3.3. Realistic Nuclear Power Plant Model (APR1400)
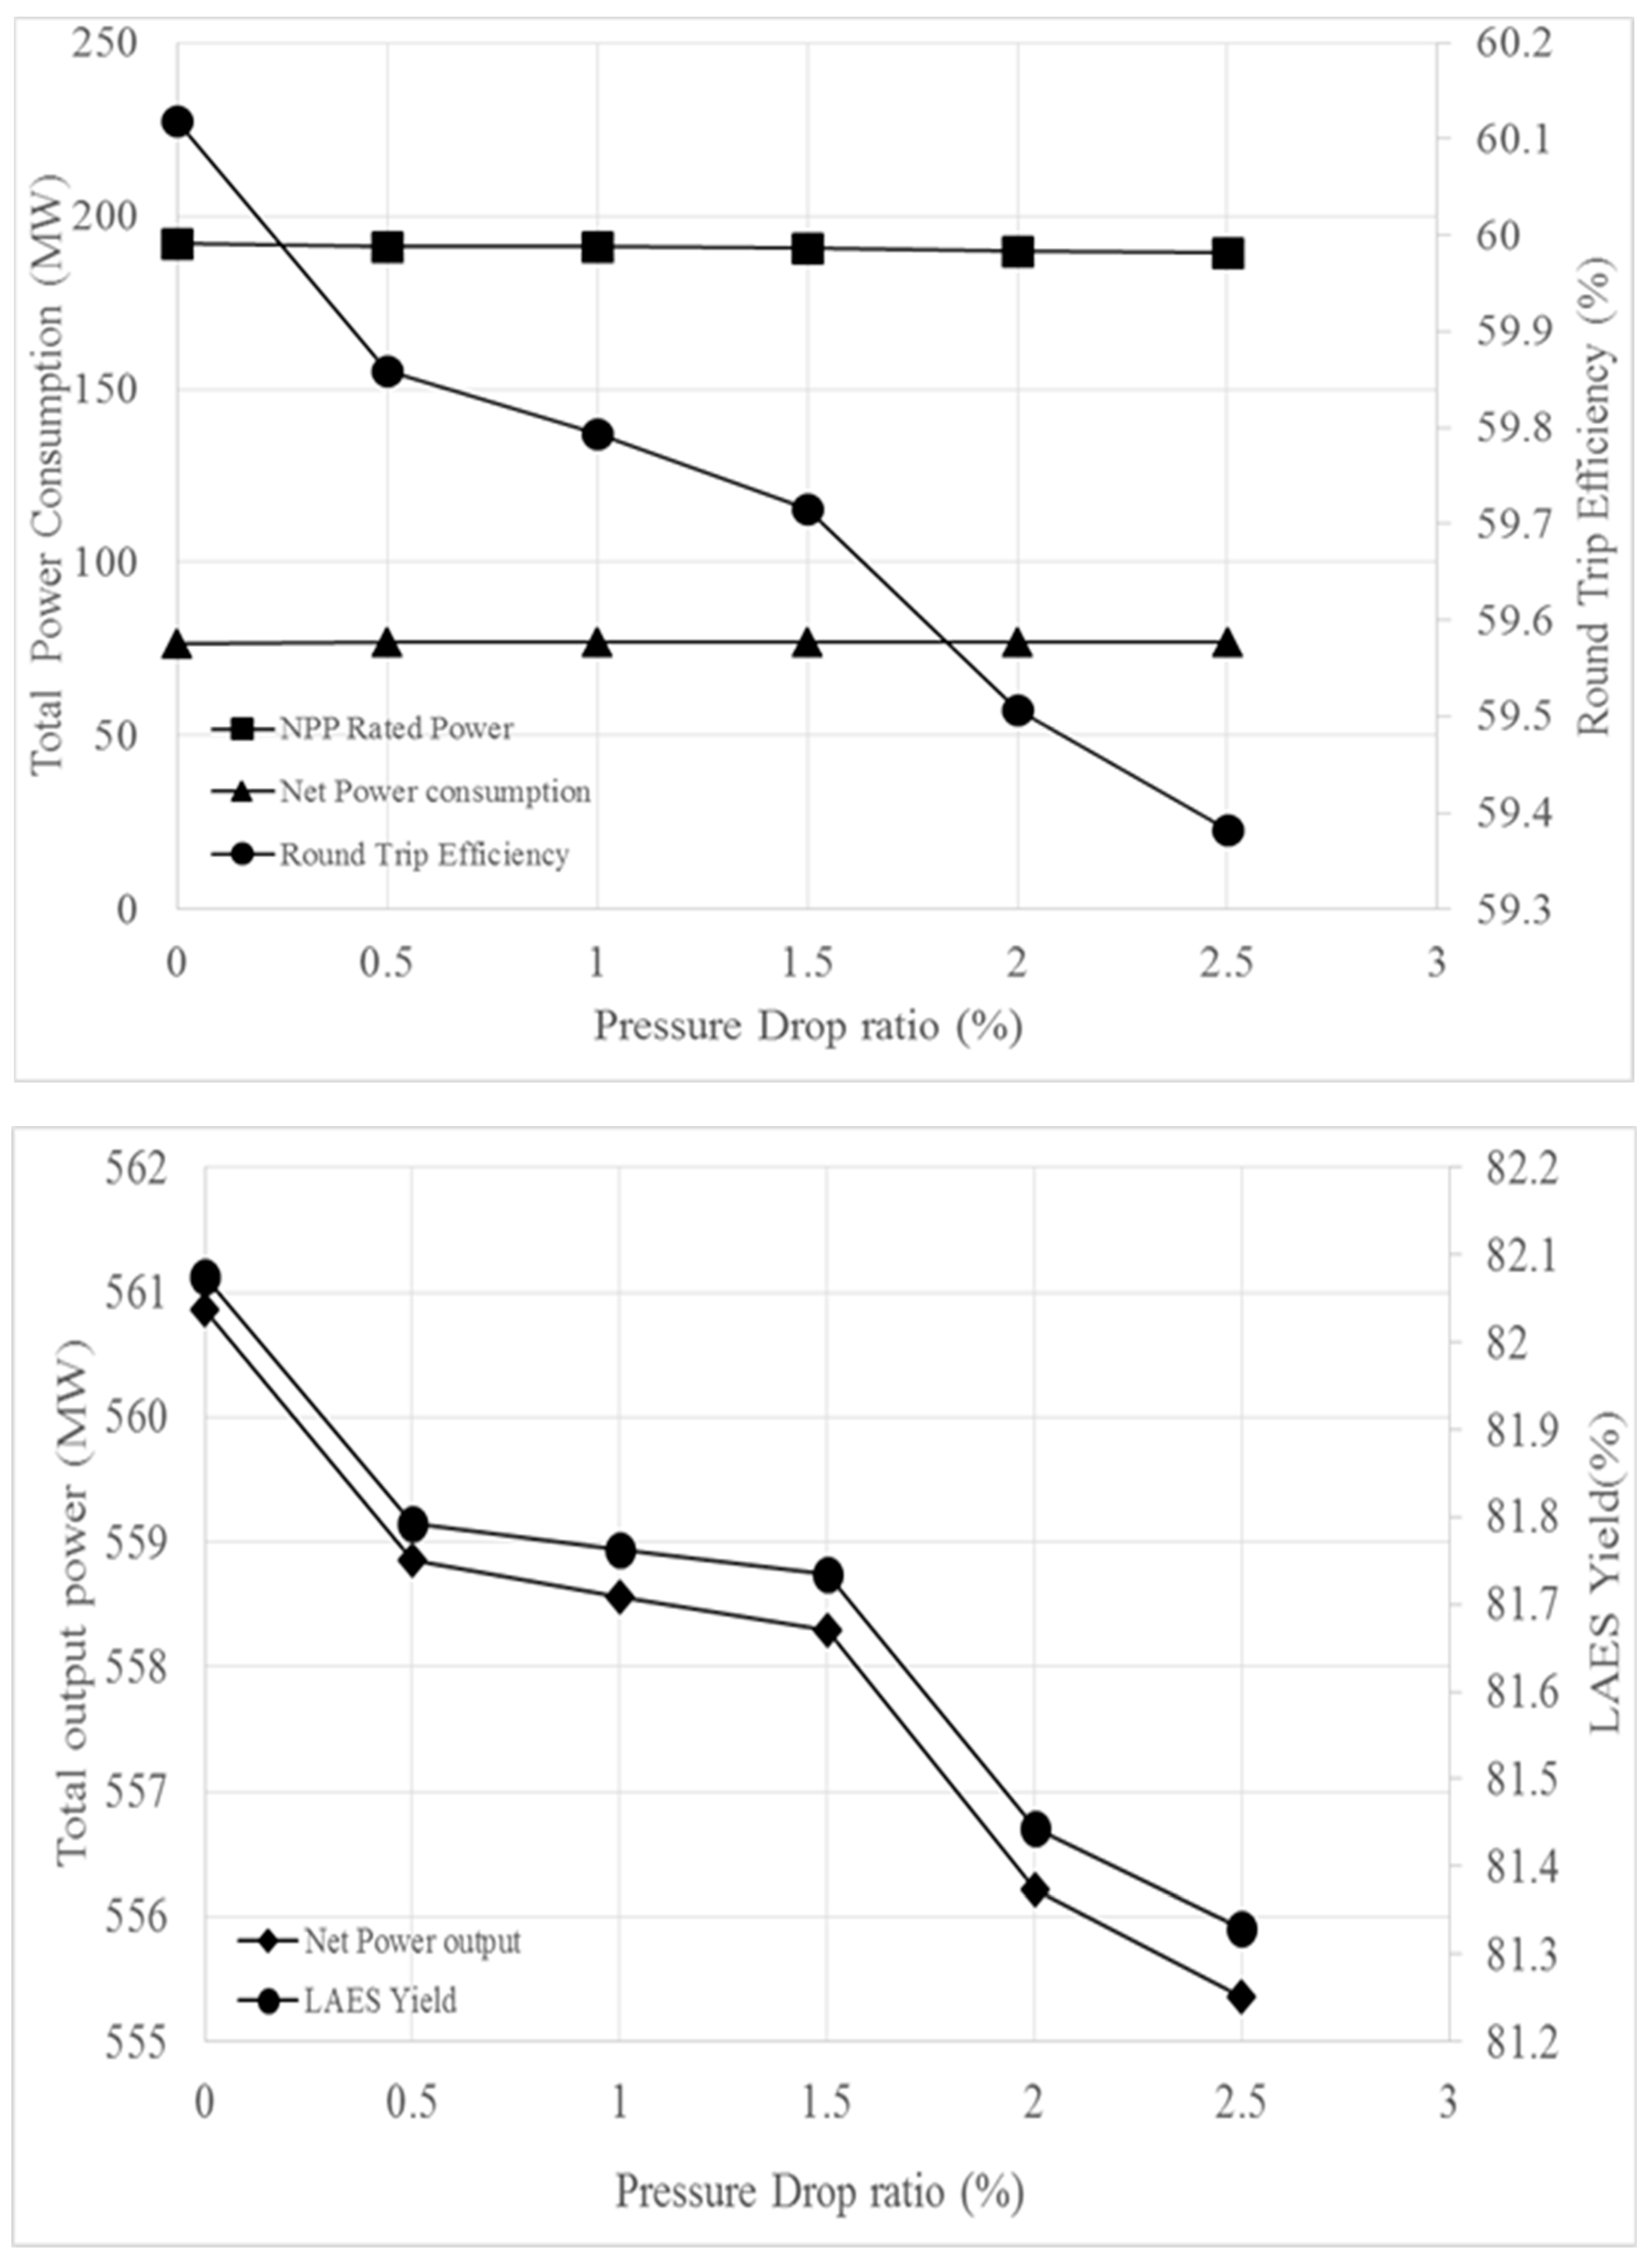
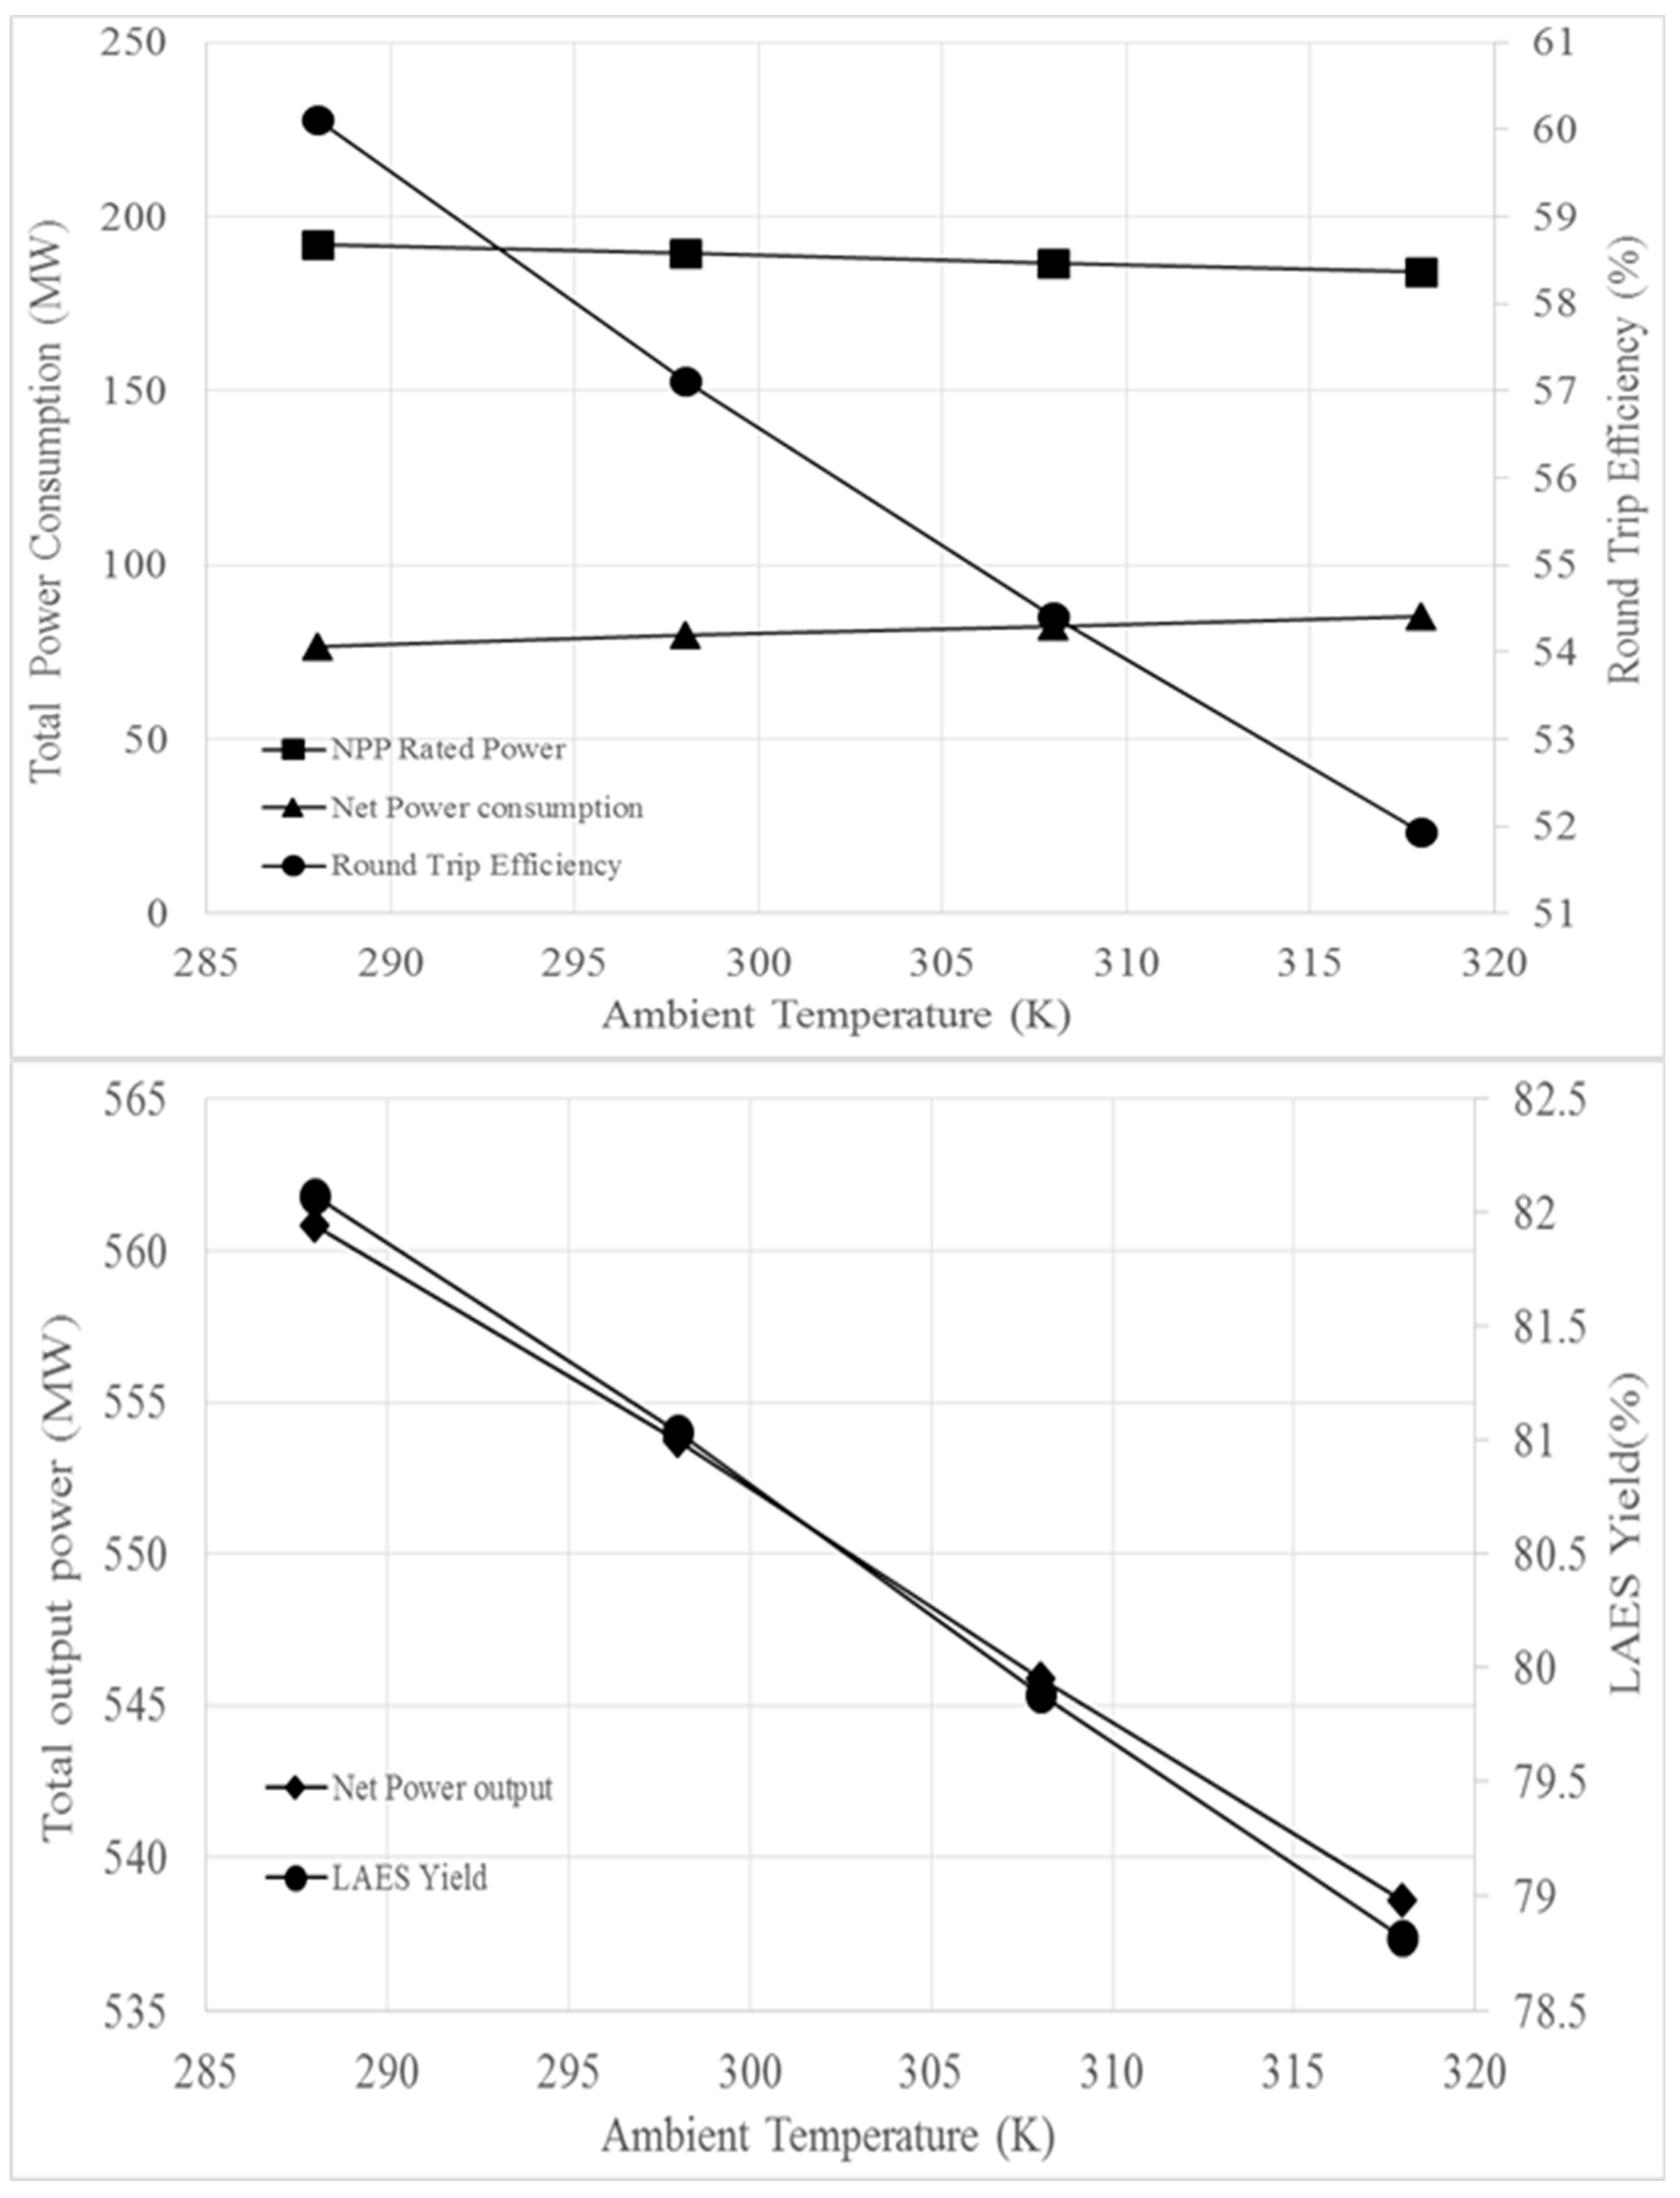
3.4. Pressure Drop and Ambient Temperature Effects
4. Conclusions
- Pinch temperature of heat exchangers—storage mode power consumption increased and release mode power output decreased
- Realistic NPP steam conditions—thermal power from NPP decreased, LAES yield decreased, and release mode power output decreased
- Pressure drop—round-trip efficiency is slightly decreased
- Ambient temperature—round-trip efficiency decreased substantially
Author Contributions
Funding
Institutional Review Board Statement
Informed Consent Statement
Data Availability Statement
Conflicts of Interest
Nomenclature
| CCD | Closed Cycle Design |
| CP | Compressor |
| Effectiveness | |
| ES | Energy Storage |
| ER | Energy Release |
| T | Operation time of system |
| LAES | Liquefied Air Energy Storage |
| NPP | Nuclear Power Plant |
| H | Enthalpy |
| Mass Flow Rate | |
| H | Efficiency of component |
| Round-trip Efficiency | |
| E | Exergy per unit mass |
| Q | Heat |
| W | Work |
| X | Exergy Destruction of component |
| TB | Turbine |
| HX | Heat Exchanger |
| Y | LAES Yield |
References
- Xu, X.; Wei, Z.; Ji, Q.; Wang, C.; Gao, G. Global renewable energy development: Influencing factors, trend predictions and countermeasures. Resour. Policy 2019, 63, 101470. [Google Scholar] [CrossRef]
- Abidin, Z.; Ashraf, M.; Mahyuddin, M.N.; Zai-nuri, M.A.A.M. Solar Photovoltaic Architecture and Agronomic Management in Agrivoltaic System: A Review. Sustainability 2021, 13, 7846. [Google Scholar] [CrossRef]
- Supriyanto, E.; Sentanuhady, J.; Dwiputra, A.; Permana, A.; Muflikhun, M. The Recent Progress of Natural Sources and Manufacturing Process of Biodiesel: A Review. Sustainability 2021, 13, 5599. [Google Scholar] [CrossRef]
- Zhao, H.; Wu, Q.; Hu, S.; Xu, H.; Rasmussen, C.N. Review of energy storage system for wind power integration support. Appl. Energy 2015, 137, 545–553. [Google Scholar] [CrossRef]
- Min, D.; Ryu, J.-H.; Choi, D.G. Effects of the move towards renewables on the power system reliability and flexibility in South Korea. Energy Rep. 2020, 6, 406–417. [Google Scholar] [CrossRef]
- Damak, C.; Leducq, D.; Hoang, H.M.; Negro, D.; Delahaye, A. Liquid Air Energy Storage (LAES) as a large-scale storage technology for renewable energy integration—A review of investigation studies and near perspectives of LAES. Int. J. Refrig. 2020, 110, 208–218. [Google Scholar] [CrossRef]
- Nikoobakht, A.; Aghaei, J.; Shafie-Khah, M.; Catalao, J.P.S. Assessing Increased Flexibility of Energy Storage and Demand Response to Accommodate a High Penetration of Renewable Energy Sources. IEEE Trans. Sustain. Energy 2019, 10, 659–669. [Google Scholar] [CrossRef]
- Denholm, P.; O’Connell, M.; Brinkman, G.; Jorgenson, J. Overgeneration from Solar Energy in California. A Field Guide to the Duck Chart; National Renewable Energy Lab. (NREL): Golden, CO, USA, 2015.
- Kosowatz, J. Energy Storage Smooths the Duck Curve. Mech. Eng. 2018, 140, 30–35. [Google Scholar] [CrossRef] [Green Version]
- Marcos, T.-V.; Icaza-Alvarez, D.; Jurado, F. A novel methodology for optimal sizing photovoltaic-battery systems in smart homes considering grid outages and demand response. Renew. Energy 2021, 170, 884–896. [Google Scholar]
- Adamantiades, A.; Kessides, I. Nuclear power for sustainable development: Current status and future prospects. Energy Policy 2009, 37, 5149–5166. [Google Scholar] [CrossRef]
- Locatelli, G.; Boarin, S.; Pellegrino, F.; Ricotti, M.E. Load following with Small Modular Reactors (SMR): A real options analysis. Energy 2015, 80, 41–54. [Google Scholar] [CrossRef] [Green Version]
- Nuclear Energy Agency. Technical and Economic Aspects of Load Following with Nuclear Power Plants, Organisation for Economic Co-Operation and Development. 2011. Available online: http://www.oecd-nea.org/ndd/reports/2011/load-following-npp.pdf (accessed on 11 January 2021).
- Borri, E.; Tafone, A.; Zsembinszki, G.; Comodi, G.; Romagnoli, A.; Cabeza, L.F. Recent Trends on Liquid Air Energy Storage: A Bibliometric Analysis. Appl. Sci. 2020, 10, 2773. [Google Scholar] [CrossRef]
- Li, Y.; Cao, H.; Wang, S.; Jin, Y.; Li, D.; Wang, X.; Ding, Y. Load shifting of nuclear power plants using cryogenic energy storage technology. Appl. Energy 2014, 113, 1710–1716. [Google Scholar] [CrossRef]
- Li, Y.-R.; Wang, J.-N.; Du, M.-T. Influence of coupled pinch point temperature difference and evaporation temperature on performance of organic Rankine cycle. Energy 2012, 42, 503–509. [Google Scholar] [CrossRef]
- Lemmon, E.W.; Huber, M.L.; Mclinden, M.O. NIST Standard Reference Database 23: Reference Fluid Thermodynamic and Transport Properties-REFPROP, Version 10.0, National Institute of Standards and Technology; Standard Reference Data Program: Gaithersburg, MA, USA, 2018.
- Heo, J.Y.; Kim, M.S.; Baik, S.; Bae, S.J.; Lee, J.I. Thermodynamic study of supercritical CO2 Brayton cycle using an isothermal compressor. Appl. Energy 2017, 206, 1118–1130. [Google Scholar] [CrossRef]
- Lukasz, S.; Krawczyk, P.; Wolowicz, M. Exergy Analysis of Adiabatic Liquid Air Energy Storage (A-LAES) System Based on Linde–Hampson Cycle. Energies 2021, 14, 945. [Google Scholar]
- Marinescu, G.; Ehrsam, A. Experimental Investigation into Thermal Behavior of Steam Turbine Components: Part 2—Natural Cooling of Steam Turbines and the Impact on LCF Life. In Proceedings of the ASME Turbo Expo 2012, Copenhagen, Denmark, 11–15 June 2012. [Google Scholar]

| Variables | Values |
|---|---|
| Thermal power from NPP (MW) | 250 |
| NPP inlet steam pressure (kPa) | 7093 |
| NPP inlet steam temperature (K) | 560 |
| Thermal efficiency of the NPP (%) | 31 |
| Ambient pressure (kPa) | 101 |
| Ambient temperature (K) | 288 |
| Liquid air storage pressure (kPa) | 101 |
| Operational period in energy storage mode (hours/day) | 8 |
| Operational period in energy release mode (hours/day) | 1 |
| Temperature approach of heat exchangers (K) | 2 |
| Isentropic efficiency of the air turbines (%) | 92 |
| Isentropic efficiency of the cryogenic turbine (%) | 88 |
| Isothermal efficiency of air compressors (%) | 90 |
| Isentropic efficiency of the cryogenic pump (%) | 70 |
| Variables | Values |
|---|---|
| Thermal power from NPP (MW) | variable |
| NPP inlet steam pressure (kPa) | 1352 |
| NPP inlet steam temperature (K) | 500 |
| Thermal efficiency of the NPP (%) | 31 |
| Ambient pressure (kPa) | 101 |
| Ambient temperature (K) | 288 |
| Liquid air storage pressure (kPa) | 101 |
| Operational period in energy storage mode (hours/day) | 8 |
| Operational period in energy release mode (hours/day) | 1 |
| Temperature approach of heat exchangers (K) | 5 |
| Isentropic efficiency of the air turbines (%) | 92 |
| Isentropic efficiency of the cryogenic turbine (%) | 88 |
| Isothermal efficiency of air compressors (%) | 90 |
| Isentropic efficiency of the cryogenic pump (%) | 70 |
| Reference [15] | KAIST-CCD | ||||||
|---|---|---|---|---|---|---|---|
| Flow No. | Mass Flow (kg/s) | Pressure (kPa) | Temperature (K) | Mass Flow (kg/s) | Pressure (kPa) | Temperature (K) | Fluid Type |
| 1 | 150 | 101 | 288 | Ambient air intake | |||
| 2 | 179 | 101 | 288 | 179 | 101 | 288 | Air |
| 3 | 179 | 1159 | 288 | 179 | 1159 | 289 | Air |
| 4 | 179 | 1159 | 282 | 179 | 1159 | 287 | Air |
| 5 | 179 | 13,409 | 288 | 179 | 13,409 | 289 | Air |
| 6 | 179 | 13,409 | 102 | 179 | 13,409 | 104 | Air |
| 7 | 179 | 101 | 81 | 179 | 101 | 79 | Air |
| 8 | 29 | 101 | 83 | 33 | 101 | 82 | Air |
| 9 | 29 | 101 | 250 | 33 | 101 | 250 | Air |
| 10 | 29 | 101 | 288 | 33 | 101 | 287 | Air |
| 11 | 167 | 101 | 95 | 167 | 101 | 95 | Propane |
| 12 | 167 | 101 | 212 | 167 | 101 | 212 | Propane |
| 13 | 90 | 101 | 219 | 90 | 101 | 219 | Methanol |
| 14 | 90 | 101 | 286 | 90 | 101 | 286 | Methanol |
| 15 | 1195 | 101 | 80 | 1170 | 101 | 79 | Air |
| 16 | 1195 | 11,385 | 83 | 1170 | 11,385 | 85 | Air |
| 17 | 1195 | 11,385 | 283 | 1170 | 11,385 | 286 | Air |
| 18 | 1195 | 11,385 | 380 | 1170 | 11,385 | 405 | Air |
| 19 | 1195 | 11,385 | 553 | 1170 | 3497 | 558 | Air |
| 20 | 1195 | 3497 | 396 | 1170 | 3497 | 412 | Air |
| 21 | 1195 | 3497 | 553 | 1170 | 3497 | 558 | Air |
| 22 | 1195 | 1074 | 397 | 1170 | 1074 | 413 | Air |
| 23 | 1195 | 1074 | 553 | 1170 | 1074 | 558 | Air |
| 24 | 1195 | 330 | 397 | 1170 | 330 | 414 | Air |
| 25 | 1195 | 330 | 553 | 1170 | 330 | 558 | Air |
| 26 | 1195 | 101 | 397 | 1170 | 110 | 422 | Air |
| 27 | 1195 | 101 | 288 | 1170 | 110 | 288 | Air |
| 28 | 1195 | 101 | 288 | Rejection | |||
| 29 | 723 | 101 | 288 | 723 | 101 | 288 | Methanol |
| 30 | 723 | 101 | 217 | 723 | 101 | 217 | Methanol |
| 31 | 1337 | 101 | 214 | 1337 | 101 | 214 | Propane |
| 32 | 1337 | 101 | 93 | 1337 | 101 | 93 | Propane |
| 33 | 442 | 7093 | 560 | 442 | 7093 | 560 | Water |
| 34 | 442 | 7093 | 493 | 442 | 7093 | 493 | Water |
| Reference [15] | KAIST-CCD | |||
|---|---|---|---|---|
| Power (MW) | Exergy Loss (MW) | Power (MW) | Exergy Loss (MW) | |
| Energy storage mode | ||||
| Compressor 1 | 40.03 | 3.96 | 40.11 | 4.05 |
| Compressor 2 | 39.83 | 3.99 | 39.65 | 3.82 |
| Cryogenic turbine | 3.12 | 0.43 | 3.32 | 1.64 |
| Energy release mode | ||||
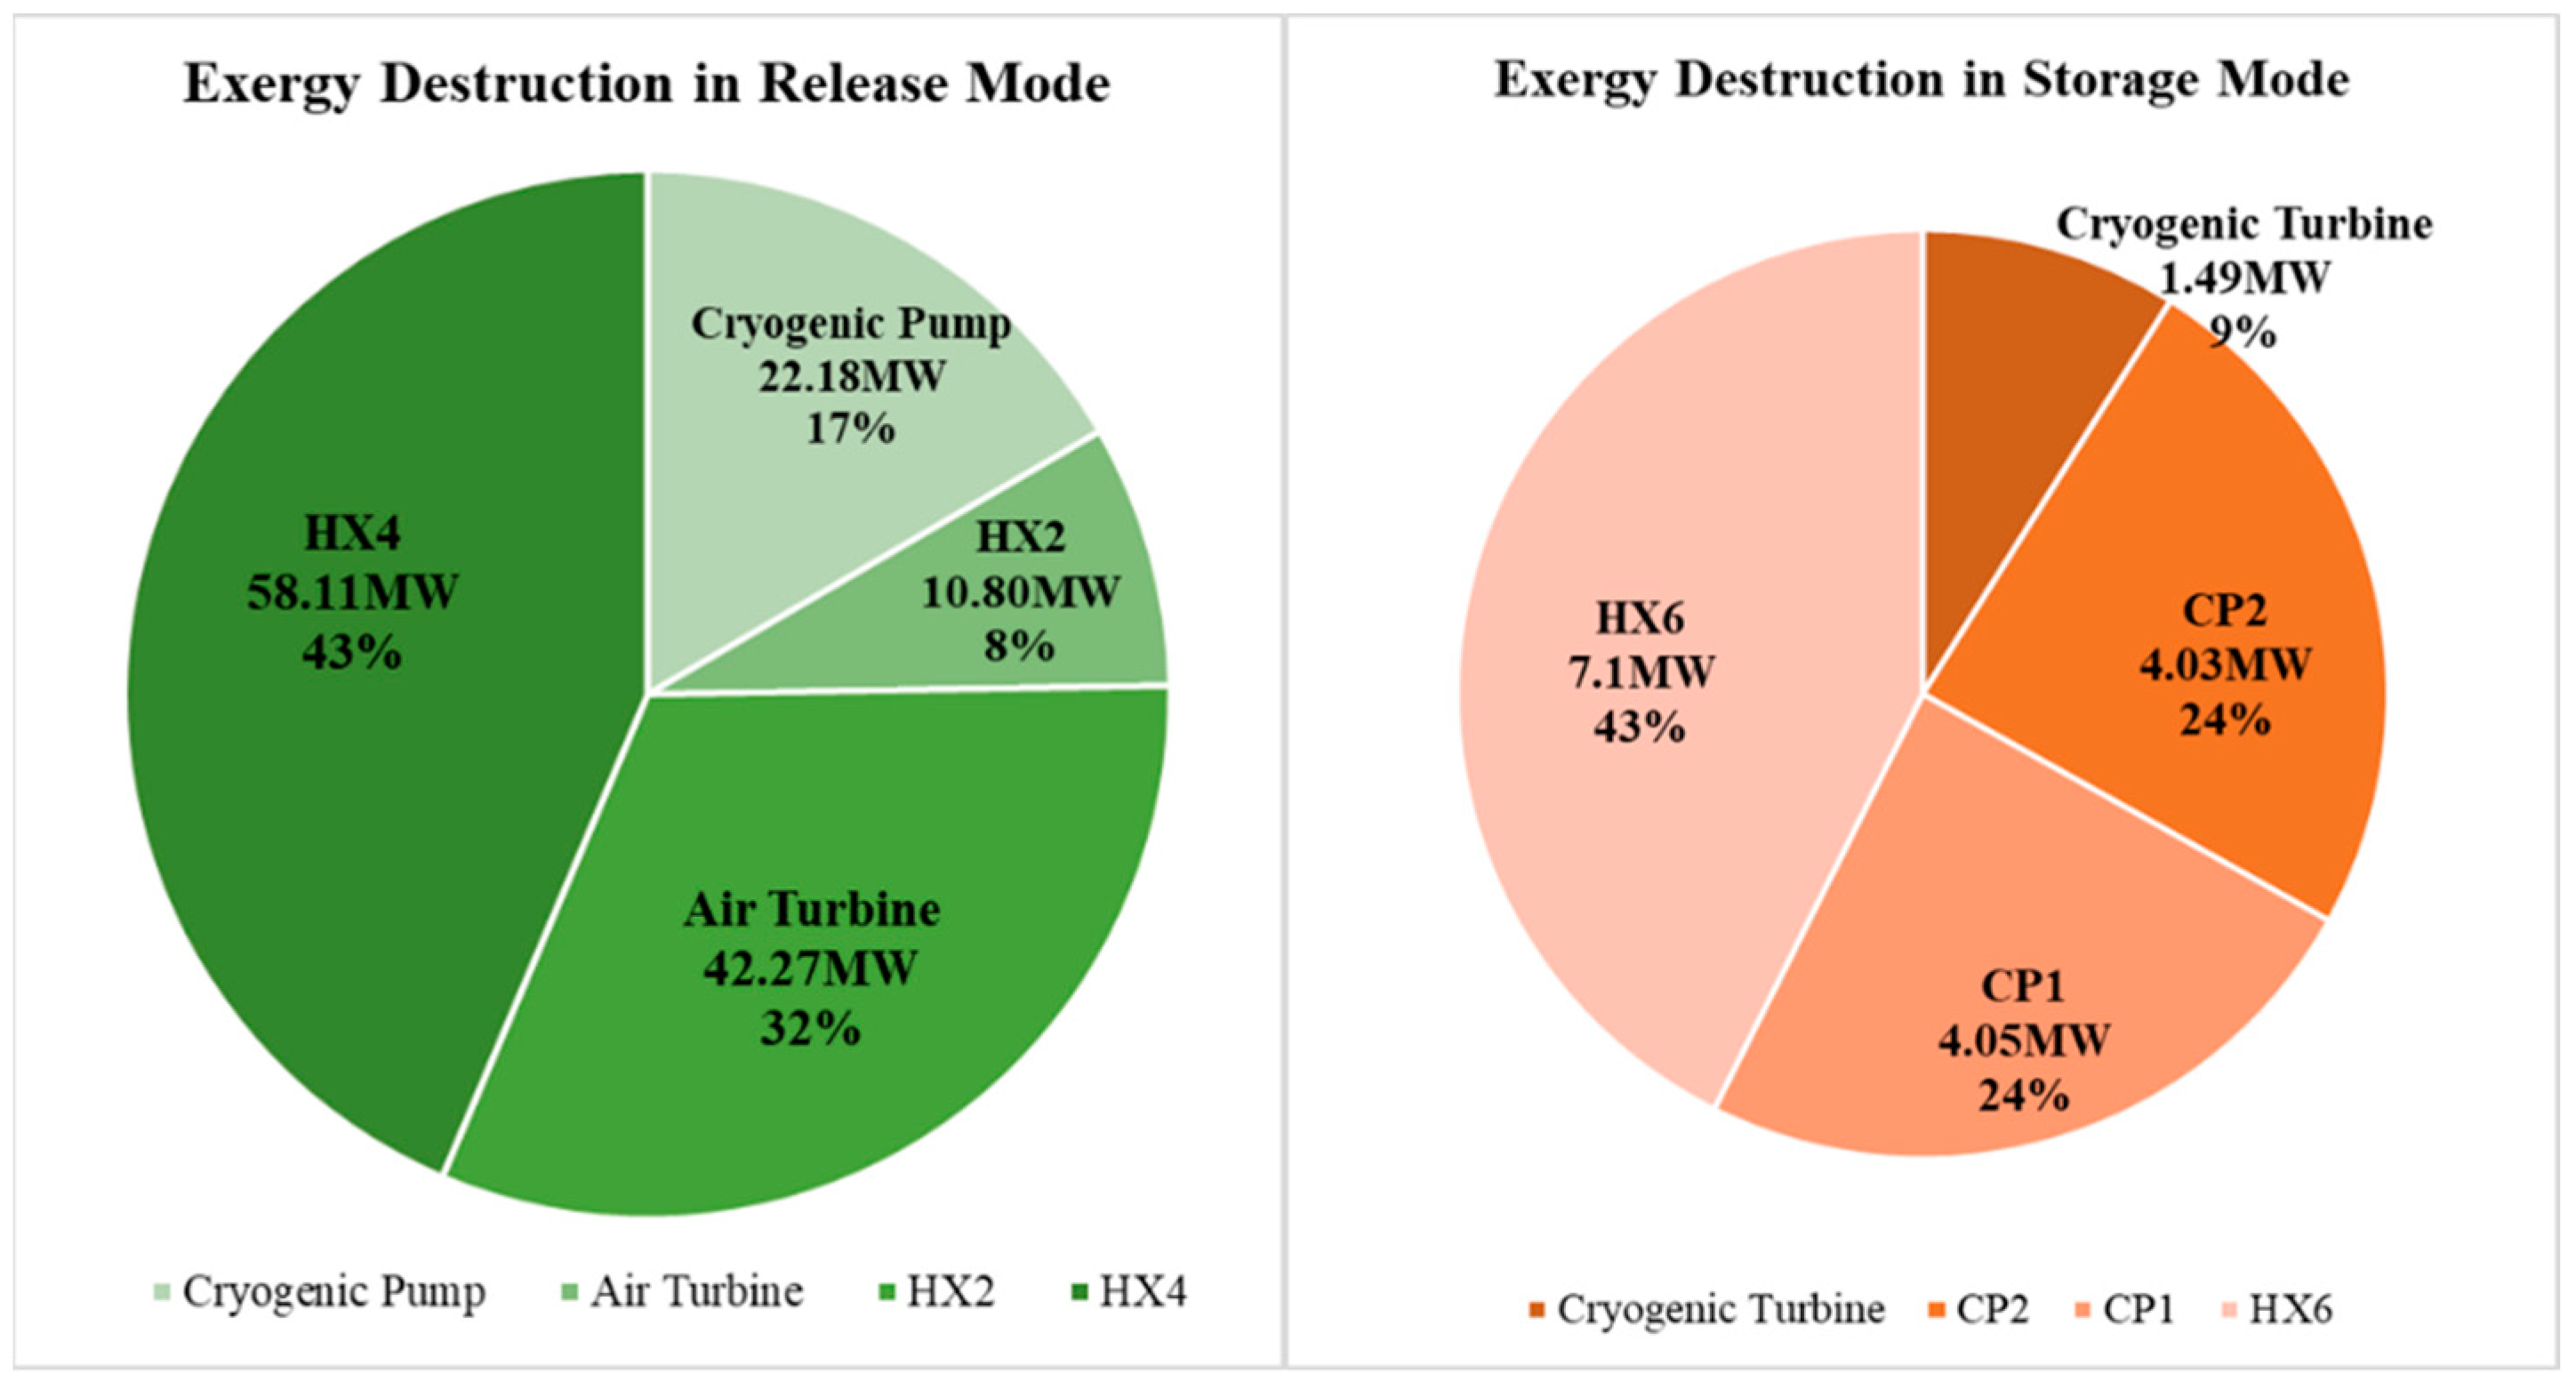
| Cryogenic pump | 19.18 | 5.77 | 21.35 | 22.15 |
| Air turbines | 706.69 | 62.81 | 689.00 | 42.22 |
| Net power consumption in Storage mode (MW) | 76.74 | 76.45 | ||
| Net power output in release mode (MW) | 687.51 | 667.65 | ||
| Round-trip efficiency (%) | 71.26 | 68.29 | ||
| Pinch (K) | 2 | 5 |
| Inlet Temperature for Propane (K) | 95 | 95 |
| Outlet Temperature for Propane (K) | 212 | 212 |
| Inlet Temperature for Methanol (K) | 219 | 219 |
| Outlet Temperature for Methanol (K) | 286 | 283 |
| 5K Pinch | 2K Pinch | |||
|---|---|---|---|---|
| Power (MW) | Exergy Loss (MW) | Power (MW) | Exergy Loss (MW) | |
| Energy storage mode | ||||
| Compressor 1 | 40.11 | 4.05 | 40.11 | 4.05 |
| Compressor 2 | 39.87 | 4.03 | 39.65 | 3.82 |
| Cryo-turbine | 3.30 | 1.64 | 3.32 | 1.64 |
| Energy release mode | ||||
| Cryogenic pump | 21.38 | 22.18 | 21.35 | 22.15 |
| Air turbines | 686.19 | 42.28 | 689.00 | 42.22 |
| LAES Yield | 0.81793 | 0.81676 | ||
| Net power consumption in Storage mode (MW) | 76.68 | 76.45 | ||
| Net power output in release mode (MW) | 664.81 | 667.65 | ||
| Round-trip efficiency (%) | 67.62 | 68.29 | ||
| 5K Pinch Case | 2K Pinch Case | ||||||
|---|---|---|---|---|---|---|---|
| Flow No. | Mass Flow (kg/s) | Pressure (kPa) | Temperature (K) | Mass Flow (kg/s) | Pressure (kPa) | Temperature (K) | Fluid Type |
| 1 | Inhalation | ||||||
| 2 | 179 | 101 | 288 | 179 | 101 | 288 | Air |
| 3 | 179 | 1159 | 289 | 179 | 1159 | 289 | Air |
| 4 | 179 | 1159 | 288 | 179 | 1159 | 287 | Air |
| 5 | 179 | 13,409 | 290 | 179 | 13,409 | 289 | Air |
| 6 | 179 | 13,409 | 104 | 179 | 13,409 | 104 | Air |
| 7 | 179 | 101 | 79 | 179 | 101 | 79 | Air |
| 8 | 33 | 101 | 82 | 33 | 101 | 82 | Air |
| 9 | 33 | 101 | 268 | 33 | 101 | 250 | Air |
| 10 | 33 | 101 | 284 | 33 | 101 | 287 | Air |
| 11 | 167 | 101 | 95 | 167 | 101 | 95 | Propane |
| 12 | 167 | 101 | 212 | 167 | 101 | 212 | Propane |
| 13 | 90 | 101 | 219 | 90 | 101 | 219 | Methanol |
| 14 | 90 | 101 | 283 | 90 | 101 | 286 | Methanol |
| 15 | 1171 | 101 | 79 | 1170 | 101 | 79 | Air |
| 16 | 1171 | 11,385 | 85 | 1170 | 11,385 | 85 | Air |
| 17 | 1171 | 11,385 | 282 | 1170 | 11,385 | 286 | Air |
| 18 | 1171 | 11,385 | 400 | 1170 | 11,385 | 405 | Air |
| 19 | 1171 | 11,385 | 555 | 1170 | 11,385 | 558 | Air |
| 20 | 1171 | 3497 | 410 | 1170 | 3497 | 412 | Air |
| 21 | 1171 | 3497 | 555 | 1170 | 3497 | 558 | Air |
| 22 | 1171 | 1074 | 411 | 1170 | 1074 | 413 | Air |
| 23 | 1171 | 1074 | 555 | 1170 | 1074 | 558 | Air |
| 24 | 1171 | 330 | 411 | 1170 | 330 | 414 | Air |
| 25 | 1171 | 330 | 555 | 1170 | 330 | 558 | Air |
| 26 | 1171 | 110 | 420 | 1170 | 110 | 422 | Air |
| 27 | 1171 | 110 | 287 | 1170 | 110 | 288 | Air |
| 28 | Rejection | ||||||
| 29 | 723 | 101 | 288 | 723 | 101 | 288 | Methanol |
| 30 | 723 | 101 | 217 | 723 | 101 | 217 | Methanol |
| 31 | 1337 | 101 | 214 | 1337 | 101 | 214 | Propane |
| 32 | 1337 | 101 | 93 | 1337 | 101 | 93 | Propane |
| 33 | 412 | 7093 | 560 | 442 | 7093 | 560 | Water |
| 34 | 412 | 7093 | 493 | 442 | 7093 | 493 | Water |
| Flow No. | Mass Flow (kg/s) | Pressure (kPa) | Temperature (K) | Fluid |
|---|---|---|---|---|
| 1 | Inhalation | |||
| 2 | 179 | 101 | 288 | Air |
| 3 | 179 | 1159 | 289 | Air |
| 4 | 179 | 1159 | 288 | Air |
| 5 | 179 | 13,409 | 290 | Air |
| 6 | 179 | 13,409 | 104 | Air |
| 7 | 179 | 101 | 79 | Air |
| 8 | 33 | 101 | 82 | Air |
| 9 | 33 | 101 | 268 | Air |
| 10 | 33 | 101 | 284 | Air |
| 11 | 167 | 101 | 95 | Propane |
| 12 | 167 | 101 | 212 | Propane |
| 13 | 90 | 101 | 219 | Methanol |
| 14 | 90 | 101 | 283 | Methanol |
| 15 | 1171 | 101 | 79 | Air |
| 16 | 1171 | 11,385 | 85 | Air |
| 17 | 1171 | 11,385 | 282 | Air |
| 18 | 1171 | 11,385 | 341 | Air |
| 19 | 1171 | 11,385 | 472 | Air |
| 20 | 1171 | 3497 | 346 | Air |
| 21 | 1171 | 3497 | 471 | Air |
| 22 | 1171 | 1074 | 347 | Air |
| 23 | 1171 | 1074 | 471 | Air |
| 24 | 1171 | 330 | 348 | Air |
| 25 | 1171 | 330 | 471 | Air |
| 26 | 1171 | 110 | 356 | Air |
| 27 | 1171 | 110 | 287 | Air |
| 28 | Rejection | |||
| 29 | 723 | 101 | 288 | Methanol |
| 30 | 723 | 101 | 217 | Methanol |
| 31 | 1337 | 101 | 214 | Propane |
| 32 | 1337 | 101 | 93 | Propane |
| 33 | 270 | 1458 | 500 | Water |
| 34 | 270 | 1346 | 412 | Water |
| Component | Power (MW) | Exergy LOSS (MW) |
|---|---|---|
| Energy storage mode | ||
| Compressor1 | 40.11 | 4.05 |
| Compressor2 | 39.87 | 4.03 |
| Cryogenic turbine | 3.30 | 1.64 |
| Energy release mode | ||
| Cryogenic pump | 21.38 | 22.18 |
| Air turbines | 580.41 | 42.27 |
| Net Power Consumption in Storage Mode (MW), | 76.68 | |
| Net Power Output in Release Mode (MW), | 599.04 | |
| Thermal Power from NPP (MW), | 191.21 | |
| Round-trip Efficiency (%), | 59.96 | |
Publisher’s Note: MDPI stays neutral with regard to jurisdictional claims in published maps and institutional affiliations. |
© 2021 by the authors. Licensee MDPI, Basel, Switzerland. This article is an open access article distributed under the terms and conditions of the Creative Commons Attribution (CC BY) license (https://creativecommons.org/licenses/by/4.0/).
Share and Cite
Song, S.-H.; Heo, J.-Y.; Lee, J.-I. Design Considerations for the Liquid Air Energy Storage System Integrated to Nuclear Steam Cycle. Appl. Sci. 2021, 11, 8484. https://doi.org/10.3390/app11188484
Song S-H, Heo J-Y, Lee J-I. Design Considerations for the Liquid Air Energy Storage System Integrated to Nuclear Steam Cycle. Applied Sciences. 2021; 11(18):8484. https://doi.org/10.3390/app11188484
Chicago/Turabian StyleSong, Seok-Ho, Jin-Young Heo, and Jeong-Ik Lee. 2021. "Design Considerations for the Liquid Air Energy Storage System Integrated to Nuclear Steam Cycle" Applied Sciences 11, no. 18: 8484. https://doi.org/10.3390/app11188484
APA StyleSong, S.-H., Heo, J.-Y., & Lee, J.-I. (2021). Design Considerations for the Liquid Air Energy Storage System Integrated to Nuclear Steam Cycle. Applied Sciences, 11(18), 8484. https://doi.org/10.3390/app11188484