Article

HybridTabNet: Towards Better Table Detection in Scanned Document Images

by
Danish Nazir
1,2,†,
Khurram Azeem Hashmi
1,2,3,†,
Alain Pagani
3,
Marcus Liwicki
4,
Didier Stricker
1,3 and
Muhammad Zeshan Afzal
1,2,3,*
1
Department of Computer Science, Technical University of Kaiserslautern, 67663 Kaiserslautern, Germany
2
Mindgarage, Technical University of Kaiserslautern, 67663 Kaiserslautern, Germany
3
German Research Institute for Artificial Intelligence (DFKI), 67663 Kaiserslautern, Germany
4
Department of Computer Science, Luleå University of Technology, 971 87 Luleå, Sweden
*
Author to whom correspondence should be addressed.
These authors contributed equally to this work.
Appl. Sci. 2021, 11(18), 8396; https://doi.org/10.3390/app11188396
Submission received: 16 August 2021 / Revised: 3 September 2021 / Accepted: 3 September 2021 / Published: 11 September 2021

Abstract

:
Tables in document images are an important entity since they contain crucial information. Therefore, accurate table detection can significantly improve the information extraction from documents. In this work, we present a novel end-to-end trainable pipeline, HybridTabNet, for table detection in scanned document images. Our two-stage table detector uses the ResNeXt-101 backbone for feature extraction and Hybrid Task Cascade (HTC) to localize the tables in scanned document images. Moreover, we replace conventional convolutions with deformable convolutions in the backbone network. This enables our network to detect tables of arbitrary layouts precisely. We evaluate our approach comprehensively on ICDAR-13, ICDAR-17 POD, ICDAR-19, TableBank, Marmot, and UNLV. Apart from the ICDAR-17 POD dataset, our proposed HybridTabNet outperformed earlier state-of-the-art results without depending on pre- and post-processing steps. Furthermore, to investigate how the proposed method generalizes unseen data, we conduct an exhaustive leave-one-out-evaluation. In comparison to prior state-of-the-art results, our method reduced the relative error by 27.57 % on ICDAR-2019-TrackA-Modern, 42.64 % on TableBank (Latex), 41.33 % on TableBank (Word), 55.73 % on TableBank (Latex + Word), 10 % on Marmot, and 9.67 % on the UNLV dataset. The achieved results reflect the superior performance of the proposed method.

1. Introduction

Rapid growth in the digitization of documents has alleviated the demand for methods that can process information accurately and efficiently. Due to the size of the corpus, it has become impractical to employ humans to extract the information. Along with the text, the digital documents contain various graphical page objects, such as tables, figures, and formulas [1]. While state-of-the-art OCR (Optical Character Recognition) [2,3,4] systems can process the raw text in document images, they are vulnerable to extracting information from graphical page objects [5].
Hence, it is important to first localize these page objects in document images such that the information can be retrieved accurately. Tables are one of the most important page objects in documents because they summarize a major piece of information compactly and precisely. In this paper, we have taken a step forward towards improving the table detection methods in document images.
It has already been established in the community of table understanding [6,7,8,9,10,11,12] that table detection in document images hold two major challenges: (1) low inter-class variance (between different classes, such as tables, figures and charts) and (2) high intra-class variance (within the single class, such as tables with and without ruling lines). Due to these challenges, it is highly complex to come up with custom heuristics that can assist in developing robust and generic table detection system [13].
Thus far, we have seen a similar trend in the advancement of object detection algorithms in computer vision [14,15,16,17] with the progress in table detection systems [6,7,8,11,12]. Although recent object detection frameworks have noticeably improved the performance of table detection approaches [7,18], there is room in further reducing the close false positives. These case of close false positives can be resolved by leveraging the instance segmentation networks where an additional segmentation loss is added along with the bounding box and classification loss [12,17,19].
In this paper, we advanced the research for the problem of table detection in scanned document images by introducing the idea of implementing novel state-of-the-art hybrid task cascade networks [20] equipped with deformable convolutions [21]. Unlike prior methods, the proposed technique neither relies on prepossessing methods to transform the raw document images nor requires any rule-based post-processing method to refine the predictions. Moreover, the introduced method is not only applicable for scanned document images but also for PDF documents. Furthermore, the added deformable convolutions in our employed ResNeXt-101 backbone network solve the problem of detecting tables with arbitrary layouts.
In particular, the contributions of this paper are summarized as follows:
  • We propose HybridTabNet, a novel table detection system by incorporating deformable convolutions in the backbone network of an instance segmentation-based Hybrid Task Cascade (HTC) network.
  • During our exhaustive evaluation, we accomplish state-of-the-art performance on five well-recognized publicly available datasets for table detection in scanned document images.
  • We present the superiority of the proposed method by reporting results with a leave-one-out scheme on several table detection datasets. The employed strategy sets a new direction, indicating the generalization capabilities of the proposed method.
The remaining paper is organized as follows: Section 2 briefly discusses the earlier literature available on the task of table detection. Section 2.1 talks about the rule-based methods, whereas Section 2.2 highlights learning-based approaches. Section 3 explains the proposed table detection framework by discussing the employed deformable convolutions, backbone network, and object detection algorithm. Section 4 describes the essential details of the datasets that are utilized in the experiments. Section 5 explains the evaluation criteria, whereas Section 6 provides the experiment details and presents both a quantitative and qualitative analysis of the proposed method. Section 7 concludes the paper and outlines possible future directions.

2. Related Work

Table understanding is an integral step towards document image analysis. Over the past few decades, several researchers have presented solutions for the task of detecting tables having arbitrary layouts in documents. Earlier, most of the proposed methods either relied on custom heuristics or leveraged the external meta-data information to tackle the problem of table detection [22,23,24,25,26]. Later, researchers exploited statistical learning [27] followed by deep-learning-based approaches to alleviate the generalization capabilities of table detection systems [6,7,8,10,11,12,28,29,30,31,32]. This section presents a brief overview of some of these approaches.

2.1. Rule-Based Approaches

Based on our knowledge, the first work on detecting tables in document images was introduced by Itonori et al. [22] in 1993. The approach defines the table as a block of text that follows fixed constraints. In that same year, Chandran and Kasturi [24] developed a table detection method that relies on vertical and horizontal lines. Pyreddy and Croft [33] presented a system that leverages the custom heuristics to retrieve structural elements from text and separates tabular areas from the extracted elements.
Pivk et al. [34] published a system that is capable of transforming tables embedded in HTML documents into logical structures. This work defines the set of relevant table layout, which are exploited to extract tables. Along with tabular layouts, grammar was defined to recognize tables in documents [26]. Hu et al. [35] proposed a table detection method relying on the correlation of white spaces and vertical connected component analysis. For the comprehensive summarization of these rule-based approaches, readers may refer to [13,36,37,38,39].
Although these rule-based methods work well on documents with similar tabular layouts, they are laborious in terms of finding optimal heuristics. Furthermore, these conventional approaches are vulnerable to producing generic solutions. Therefore, approaches with better generalization capabilities are required to solve the problem of table detection in document images.

2.2. Learning-Based Approaches
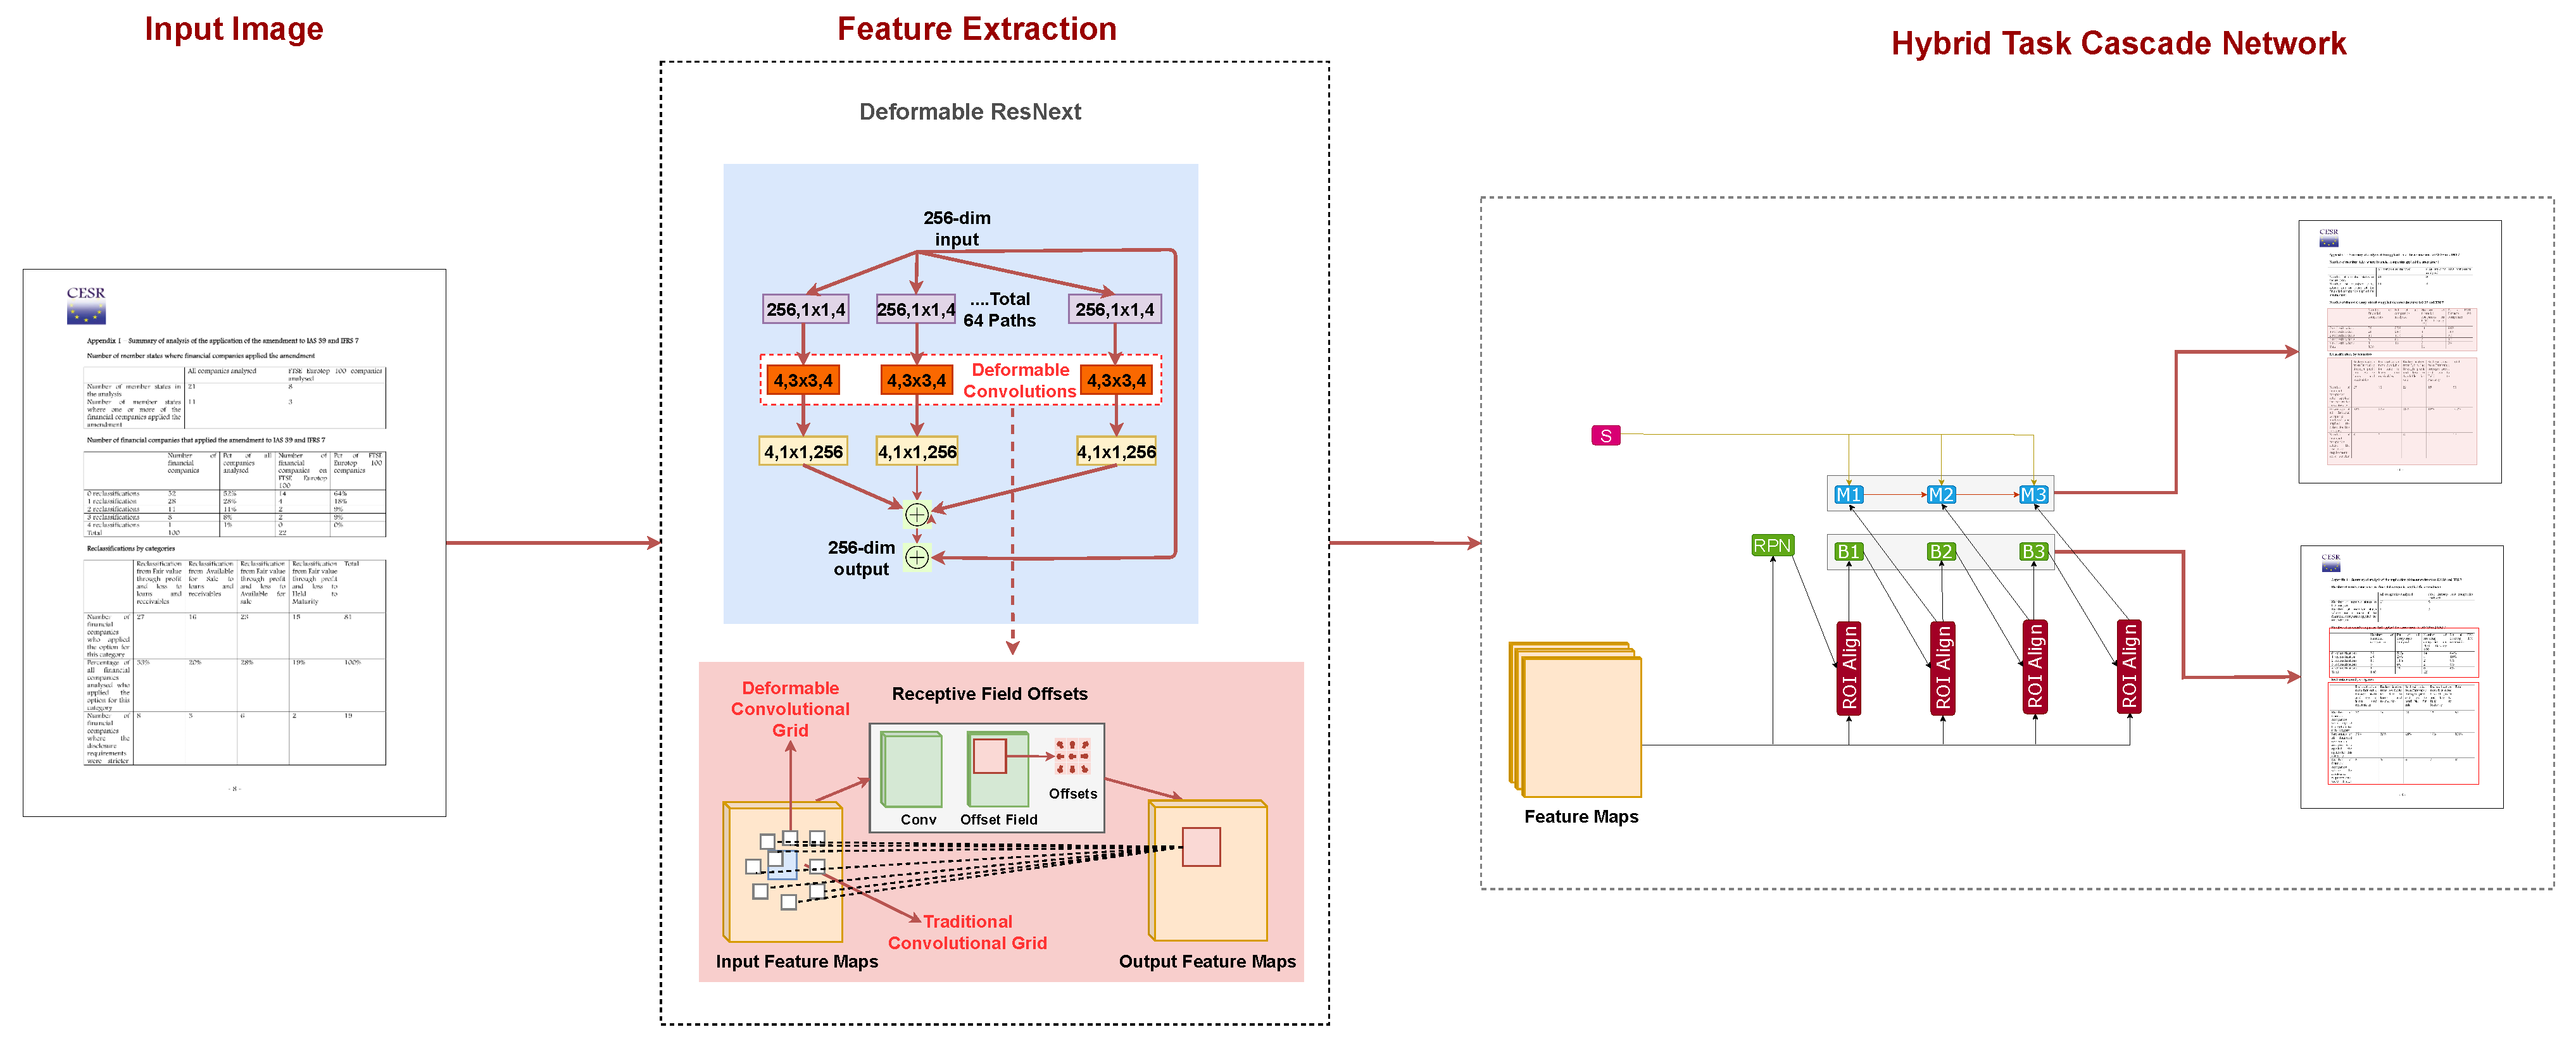
Kieninger and Dengel [40] introduced T-Recs, which is a clustering approach to detect tables in documents. Later, in a follow up work, PDF-TREX [41] is proposed. This method applied T-Recs to extract tables from PDF documents. Along with unsupervised learning [40,42], supervised learning was exploited to detect tables in documents [43].
The proposed system, Tabfinder, transforms a document into an MXY tree representation. Subsequently, the method proposes the possible tables by looking for the blocks that are enclosed in vertical and horizontal ruling lines. Hidden Markov Models (HMMs) [44,45] and the combination of SVM classifier and custom heuristics [46] has also been exploited to produce table detection methods that depend on visible ruling lines in tables. Although machine learning-based methods have improved the performance of table detection systems, they either rely on the additional meta-data information or tables having specific layouts, such as the presence of ruling lines and so on.
With the recent surge of deep learning-based algorithms in computer vision, a similar trend can be seen in the table understanding community. To begin with, Hao et al. [47] implemented a deep Convolutional Neural Network (CNN) to extract spatial features, which were later combined with custom heuristics and meta-information from PDF to classify the tabular regions in documents. Later object detection algorithms [10,14,15,16,17] were heavily explored to develop robust and data-driven image-based table detection systems [6,8,9,10,11,12,28,30].
Gilani et al. [11] employed Faster R-CNN [15] to detect tables in document images. In this work, the raw document images were first transformed by modifying their pixel values using the distance transform mechanism. These transformed images were fed to the object detection network to aid the process of recognizing tabular structures. An end-to-end image based table detection method was published by Schreiber et al. [6]. The proposed method exploited Faster R-CNN [15] with a pretrained backbone (ZFNet [48] and VGG-16 [49]).
The system GOD (Graphical Object Detection) [12] is an object detection framework that detects graphical page objects in document images. In the proposed work, the author empirically claimed that Mask R-CNN [16] worked better as compared to Faster R-CNN [15] in recognizing graphical page objects in scanned document images. A similar conclusion was presented by Zhong et al. [50] in which their novel proposed dataset PubLayNet was evaluated on both Faster and Mask R-CNN.
Instead of conventional convolutions, Siddiqui et al. [7] employed deformable convolutions to detect tables in document images. The authors empirically established that the dynamic receptive field of deformable convolutions adapted better in detecting tabular boundaries with arbitrary layouts. In another work, Faster R-CNN [29] was employed to tackle the problem of table detection in document images. The final tabular area was retrieved by refining the coroners of predicted tabular boundaries. Vo et al. [30] presented an ensembling technique in which Fast R-CNN [14] and Faster R-CNN [15] were combined to detect graphical page objects in document images.
Since tabular images are limited in number, several of the above-mentioned approaches leverage fine-tuning techniques [6,7,11]. In one of the recent works [28], it has been proposed that close-domain fine-tuning performs better as compared to open-domain fine-tuning for detecting tables in document images. In order to establish this conclusion, the authors exploited Mask R-CNN [16], RetinaNet [51], SSD [52], and YOLO [53] to perform the task of table detection.
CascadeTabNet [8] is an end-to-end table detection system that operates on Cascade Mask R-CNN, which is an extension of Cascade R-CNN [17]. Along with the novel object detection network, the proposed approach relies upon transfer learning, image transformation, and data augmentation techniques to produce state-of-the-art results for table detection in document images.

3. Method

Figure 1 illustrates the pipeline of the proposed HybridTabNet. It comprises a ResNeXt-101 [54] with deformable convolution layers and a Hybrid Task Cascade network (HTC). ResNeXt-101 extracts features maps from the dataset, and HTC uses the extracted feature maps to propose regions through Region Proposal Network (RPN). It performs Region of Interest (ROI) align or pooling on the proposed regions, and the bounding box and semantic heads use pooled feature maps to compute bounding boxes and semantic regions. The whole pipeline is trained in an end to end manner. The following sections will describe the essential components of our proposed approach.

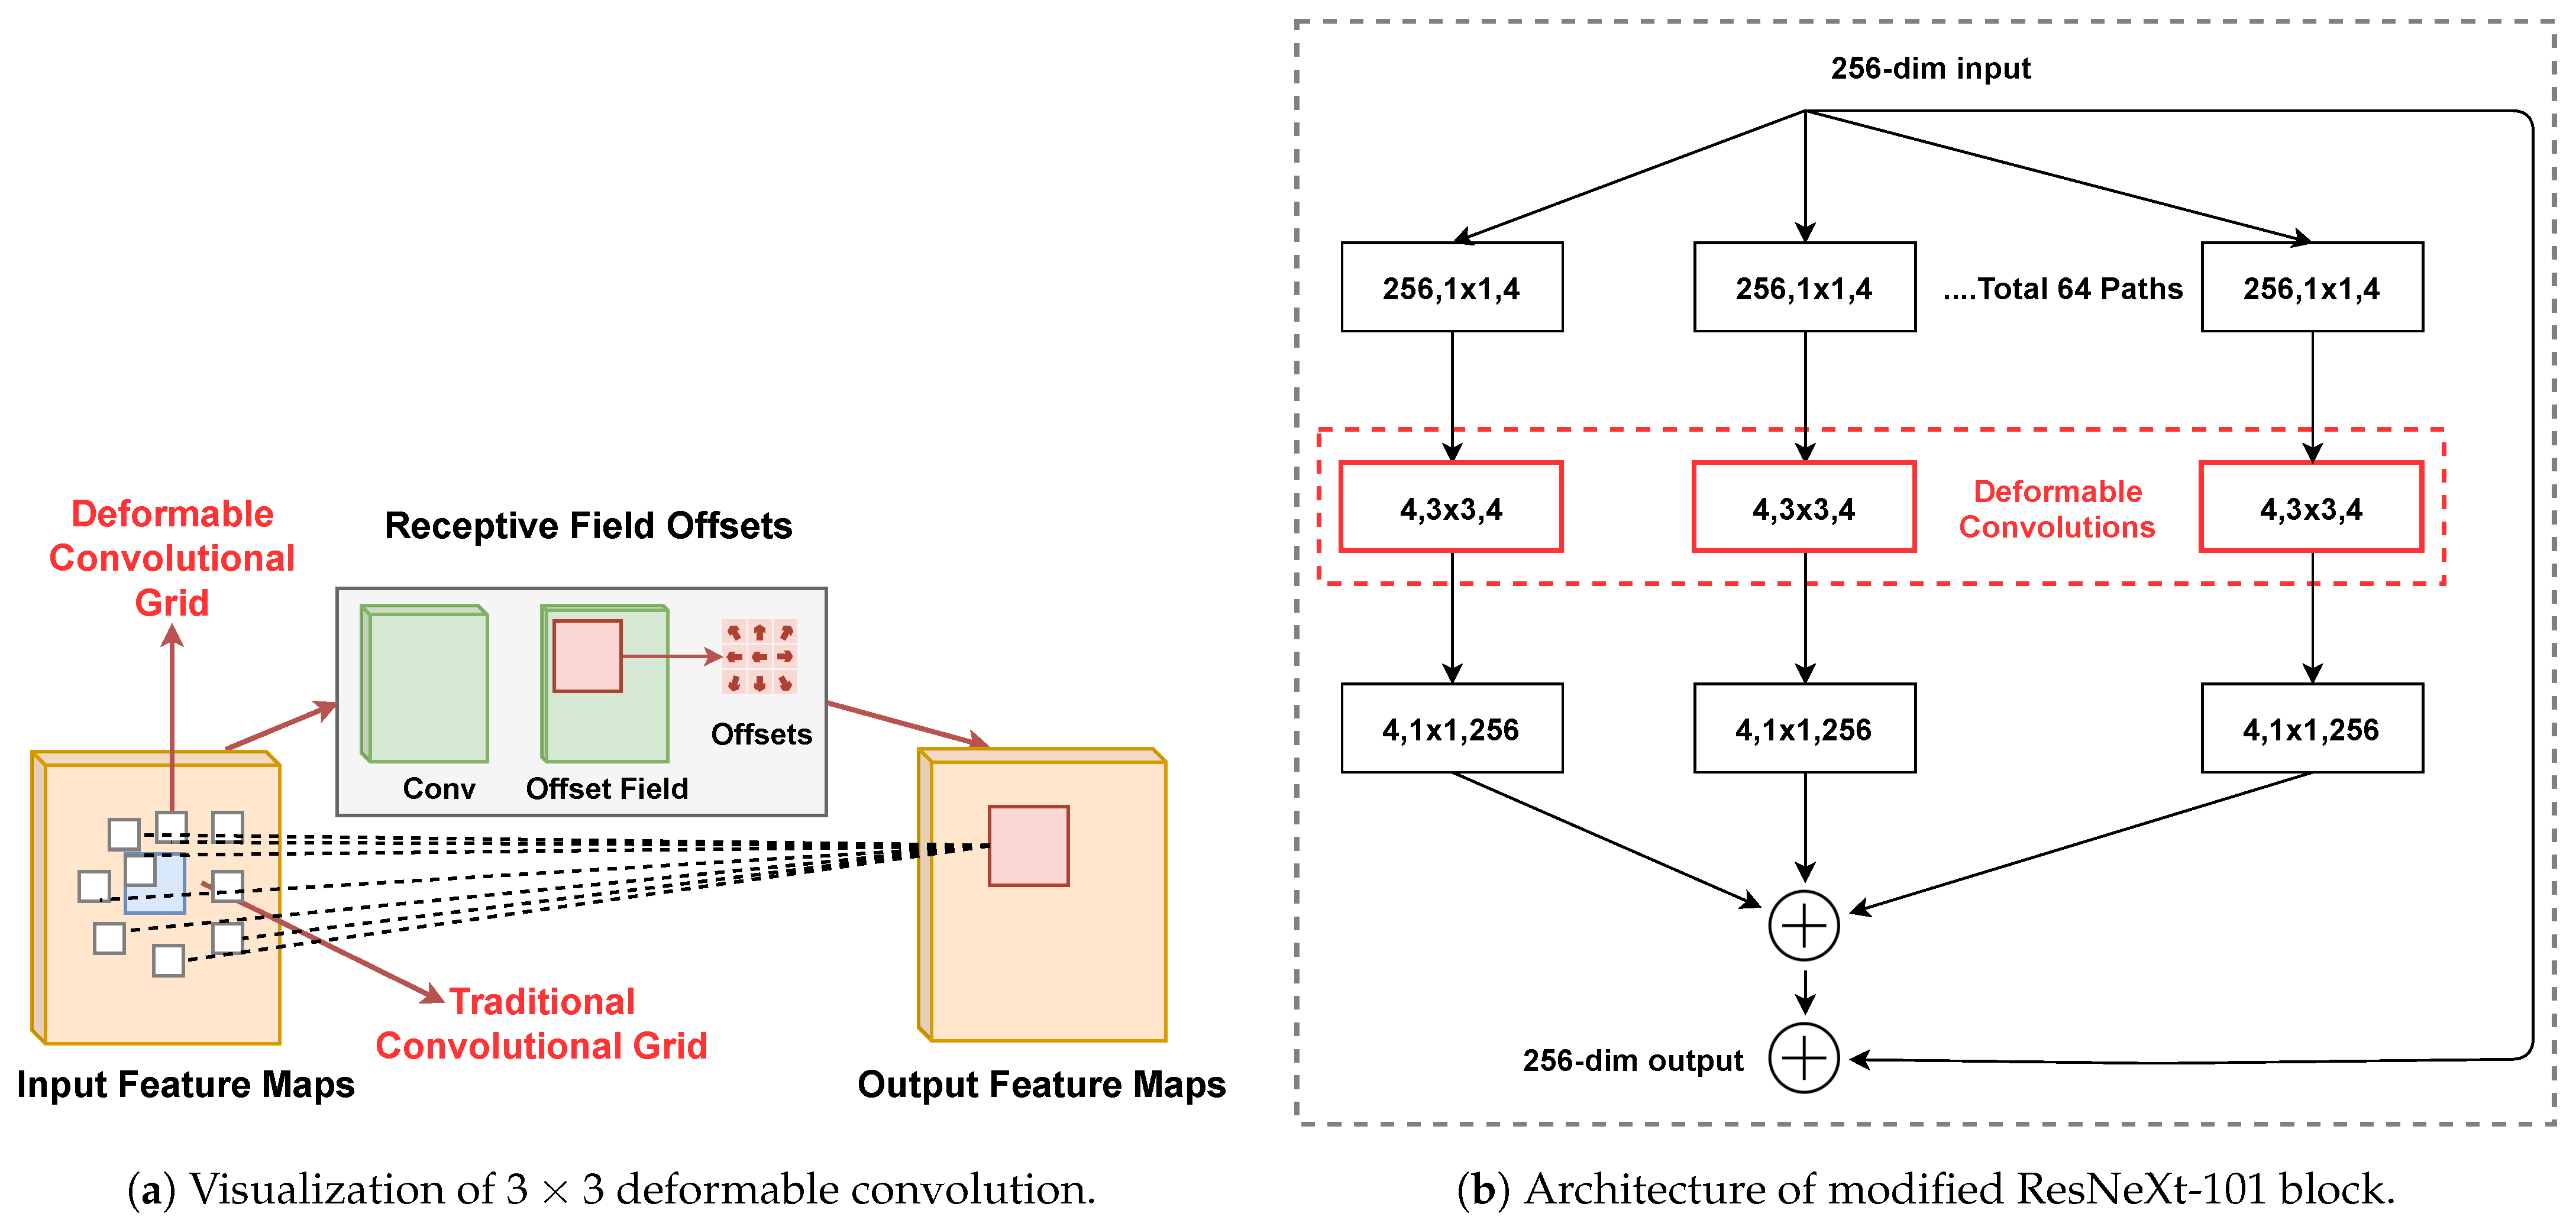
3.1. Deformable Convolution

Convolutional Networks [55] have been very successful over the past years on applications, including object detection and segmentation [56,57,58]. However, they cannot model complex geometric transformations due to their fixed kernel size. Deformable convolutional layers [21] were introduced to overcome this limitation. The intuition behind deformable convolutional layers is to add 2D offsets at regular grid sampling positions in the standard convolution operation, which deforms the constant receptive field of the preceding activation unit.
The added offsets are learnable from the preceding feature maps. The receptive fields of the deformable layers are adaptive, which changes according to the scale of the object, and this allows the capture of objects at different scales [21]. The deformable layers use the same number of learnable parameters as convolutional layers, but exploit a much larger receptive field. This makes the performance of deformable layer s superior to that of convolutional layers [21].
The deformable convolution operation can be defined as follows.
y p 0 = p n R w p n · x p 0 + p n + Δ p n
where R is any kernel of size n × n , w is the weight of the kernel, x is the input feature map, y is the output of convolution operation, p 0 is the starting position of each kernel, p n is enumerating along with all the positions in R , and Δ p n denotes the offsets added to the normal convolution operation.
Figure 2a depicts that 2D offsets for the deformable layer are obtained by applying a convolutional layer over the input feature maps. The spatial resolution and dilation of the convolution kernel are the same as in the current convolutional layer. The output channels are of dimension 2N, where N corresponds to the number of 2D offsets.

3.2. ResNeXt-101

ResNeXt [54] is a variant of ResNet [59], and it exposes a new dimension called Cardinality along with the width and depth. Cardinality defines the size of the transform set, which greatly contributes to the performance of ResNeXt [54]. Experiments demonstrated that cardinality showed better performance than going wide and deep [54]. We used ResNeXt-101 as a backbone for feature extraction with Cardinality = 64 and bottleneck width = 4d. Figure 2b illustrates that the convolutional layers in blocks c3–c5 are replaced by deformable layers.

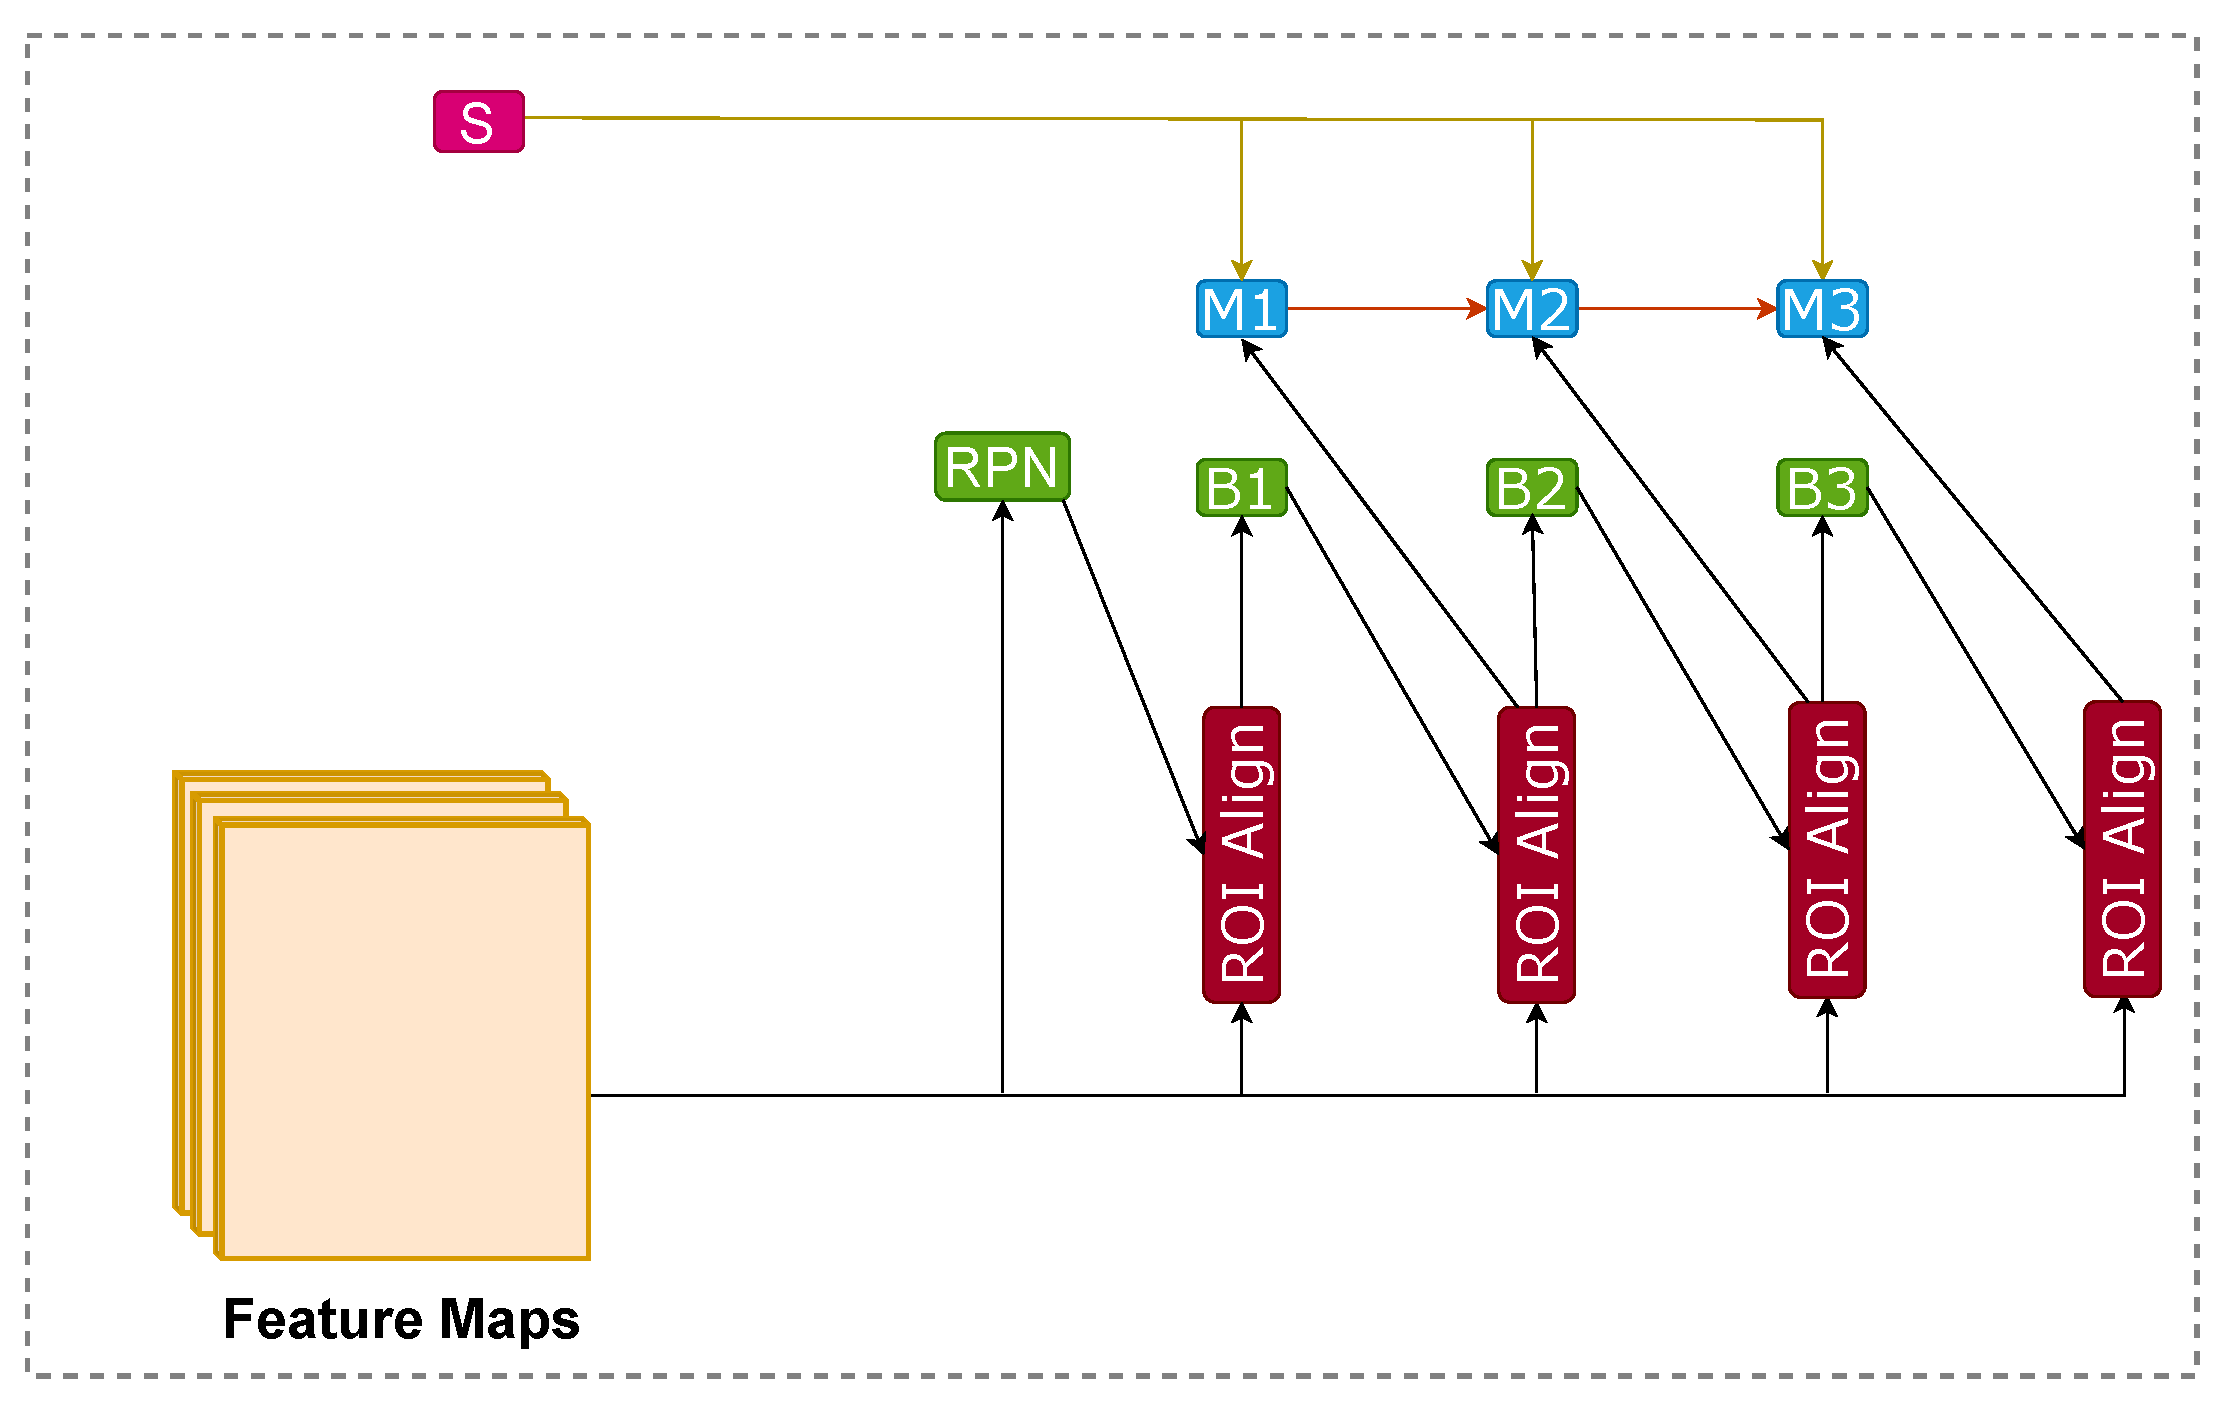
3.3. Hybrid Task Cascade

Cascade architecture has been very successful and effective in tasks, such as object detection [17]. However, to successfully apply the idea of cascade architecture to instance segmentation problems was still an open-ended research question until HTC [20] was introduced. The main idea behind HTC is to leverage the relationship between object detection and segmentation tasks. Instead of treating detection and segmentation as different problems, it performs joint multi-stage processing.
The joint multi-stage processing refers to the combination of object detection and segmentation at each stage. Due to the joint multi-stage processing, the improvement in one task, e.g., detection, improves the mask prediction and segmentation task [20]. It also utilizes the spatial context to distinguish the background from the foreground. The semantic branch (S) provides spatial cues, which complement the bounding box and mask features.
Figure 3 exhibits the architecture of HTC. It has multiple heads for both bounding box and semantic segmentation to process input at different scales. It consists of a segmentation branch (S) with mask (M1,M2,M3) and bounding box (B1,B2,B3) heads. The RPN head predicts preliminary object proposals for these feature maps, whereas the semantic segmentation branch predicts per-pixel semantic segmentation for the whole image through a fully convolutional architecture trained jointly with other branches.
In the first stage of architecture, the RPN head applies RoI pooling to the output features maps of the backbone model. B1 takes the output of RoI pooling as an input to make RoI-wise predictions. Each head makes two predictions: bounding box classification scores and box regression points. In the second stage, M1 generates pixel-wise segmentation masks for positive RoIs. The rest of the stages follow the same flow. At the inference time, object detection made by Bbox heads is complemented with segmentation masks made by the mask head for all detected objects.
Equation (2) explains the flow of Figure 3.
x t b o x = P x , r t 1 + P S ( x ) , r t 1 r t = B t x t b o x x t mask = P x , r t + P S ( x ) , r t m t = M t F x t mask , m t 1
where S indicates the semantic segmentation head, x indicates the CNN features of backbone network, and x t b o x and x t m a s k indicate the box and mask features derived from x and the input RoI. P . is a pooling operator, which could be RoI Align or RoI pooling; B t and M t denote the box and mask head at the t-th stage; and r t and m t represent the corresponding box predictions and mask predictions. Equation (2) indicates that the box and mask heads of each stage take RoI features extracted by the backbone network and semantic features given by semantic segmentation head. It is essential for HTC because it can differentiate between tables in a cluttered background by exploiting the semantic features.
Since the modules given in Equation (2) are differentiable [20]. HTC can be trained in an end-to-end manner. The overall loss function can be formulated in the form of multi-tasking [20] learning.
L = t = 1 T α t L b b o x t + L m a s k t + β L s e g , L b b o x t c i , r t , c ^ t , r ^ t = L c l s c t , c ^ t + L r e g r t , r ^ t , L m a s k t m t , m ^ t = B C E m t , m ^ t L s e g = C E ( s , s ^ ) .
where L b b o x t is the loss of the bounding box predictions at stage t, and it combines two terms L c l s and L r e g , respectively, for classification and bounding box regression. L mask t is the loss of mask prediction at stage t, which adopts the binary cross entropy form as in Mask R-CNN [16]. L s e g is the semantic segmentation loss in the form of cross entropy. B C E represents the binary cross entropy loss, and C E denotes the cross entropy loss [60,61]. The coefficients α t and β are used to balance the contributions of different stages and tasks. For all the experiments, we chose α t = [ 1 , 0.5 , 0.25 ] and β = 1 [20].

4. Datasets

4.1. ICDAR-13

ICDAR-2013 [62] is a widely used dataset not only for the problem of table detection but also for table structure recognition. The dataset consists of PDF files that are converted into images to perform an image-based table detection method. There are a total of 238 images that are utilized in evaluating our approach. In order to obtain a direct comparison with prior state-of-the-art-approaches [6,7], we used an IoU threshold of 0.5 to calculate the f1-score.

4.2. ICDAR-17 POD

ICDAR-2017-POD (Page Object Detection) [1] is another dataset that was released at ICDAR in 2017. Along with tables, the dataset also has information for the boundaries of figures and formulas. This is a larger dataset than ICDAR-13 [62]. The dataset consists of 2417 images in total, where 1600 images are used for the training purpose, and 817 images are employed in testing. Since the prior works [7] were evaluated with IoU thresholds of 0.6 and 0.8, we also evaluated our approach in the same manner.

4.3. ICDAR-19

ICDAR-2019 [63] is the outcome of the recently organized competition for table recognition at ICDAR 2019. This novel dataset contains two types of document images (modern and historical). Modern document images were retrieved from scientific papers and commercial documents whereas the archival part of the dataset contains hand-written document images. As suggested in the competition, for the modern part of the dataset, 600 images were allocated for training, whereas 240 images were for testing. Similarly, for the historical part, 600 images were assigned for training, and 199 images are adopted for the testing.

4.4. Marmot

Before the advent of TableBank [64], Marmot was one of the largest publicly available datasets for the task of table detection. The Institute of Computer Science and Technology (Peking University) proposed this dataset, which was later elaborated by Fang et al. [65]. The dataset consists of 2000 images, where a ratio of almost 1:1 is present between the positive to negative samples. Since the original version of the dataset has few incorrect annotations, we employed the corrected version of the dataset from [6]. Hence, instead of 2000, 1967 images were utilized in our evaluation.

4.5. UNLV

UNLV dataset is one of the most recognized datasets in the document analysis community. In general, the dataset is comprised of almost 10,000 document images. However, only 427 of them contain tables. In our experiments, we only utilized the document images that contained tabular information.

4.6. TableBank

Li et al. [64] introduced TableBank as one of the most prominent datasets in the table community. Since this dataset has 417,000 document images, we use this dataset to train our network. It is essential to highlight that, instead of the whole dataset, we utilized 1500 images each from Word and Latex split and 3000 images from the Word + Latex split to compare our results with prior state-of-the-art approaches [8].

5. Evaluation Metrics

In this section, we discuss the evaluation criteria used to evaluate our approach to table detection. We used similar evaluation metrics to current state-of-the-art approaches [7,8,12] for comparison with our results.
The precision, recall, and F1-scores were calculated on IoU [66,67] thresholds of 0.5, 0.6, 0.7, 0.8, and 0.9.

5.1. Intersection of Union

The Intersection over Union (IoU) [66,67] is one of the most prominent evaluation metrics used in object detection benchmarks. It measures the overlap between predicted and ground truth data. A higher value of IoU means that there is more overlap in the predicted and ground truth regions. We used IoU thresholds from 0.5 , 0.6 , 0.7 , 0.8 , and 0.9 to evaluate our table predictions. The formula for IoU is summarized in Equation (4).
I o U = A r e a o f I n t e r s e c t i o n A r e a o f U n i o n

5.2. Precision

Precision is the ratio of correctly predicted observations to the total predicted observations. Equation (5) depicts the formula of precision.
P r e c i s i o n = T r u e P o s i t i v e s T r u e P o s i t i v e s + F a l s e P o s i t i v e s

5.3. Recall

Recall is the ratio of correctly predicted observations to the total observations in ground truth. Equation (6) depicts the formula of recall.
R e c a l l = T r u e P o s i t i v e s T r u e P o s i t i v e s + F a l s e N e g a t i v e s

5.4. F1-Score

F1-score is the harmonic mean of precision and recall. Equation (7) exhibits the formula of the F1-score.
F 1 s c o r e = 2 × P r e c i s i o n × R e c a l l P r e c i s i o n + R e c a l l

5.5. Weighted-Average

We evaluated the F1-score at IoU thresholds 0.5 , 0.6 , 0.7 , 0.8 , and 0.9 and report the weighted-average (W.Avg) on the datasets. This allows us to give more importance to f1-scores, precision and recall with higher IoU thresholds. Equation (8) depicts the formula of the weighted-average.
W e i g h t e d A v e r a g e = n = 0.5 0.9 n × S n n = 0.5 0.9 S n
where n represents the IoU threshold and S n highlights the score achieved on a specific IoU threshold, ranging from 0.5 to 0.9. The weighted- average precision, recall, and F1-score were all calculated in a similar fashion.

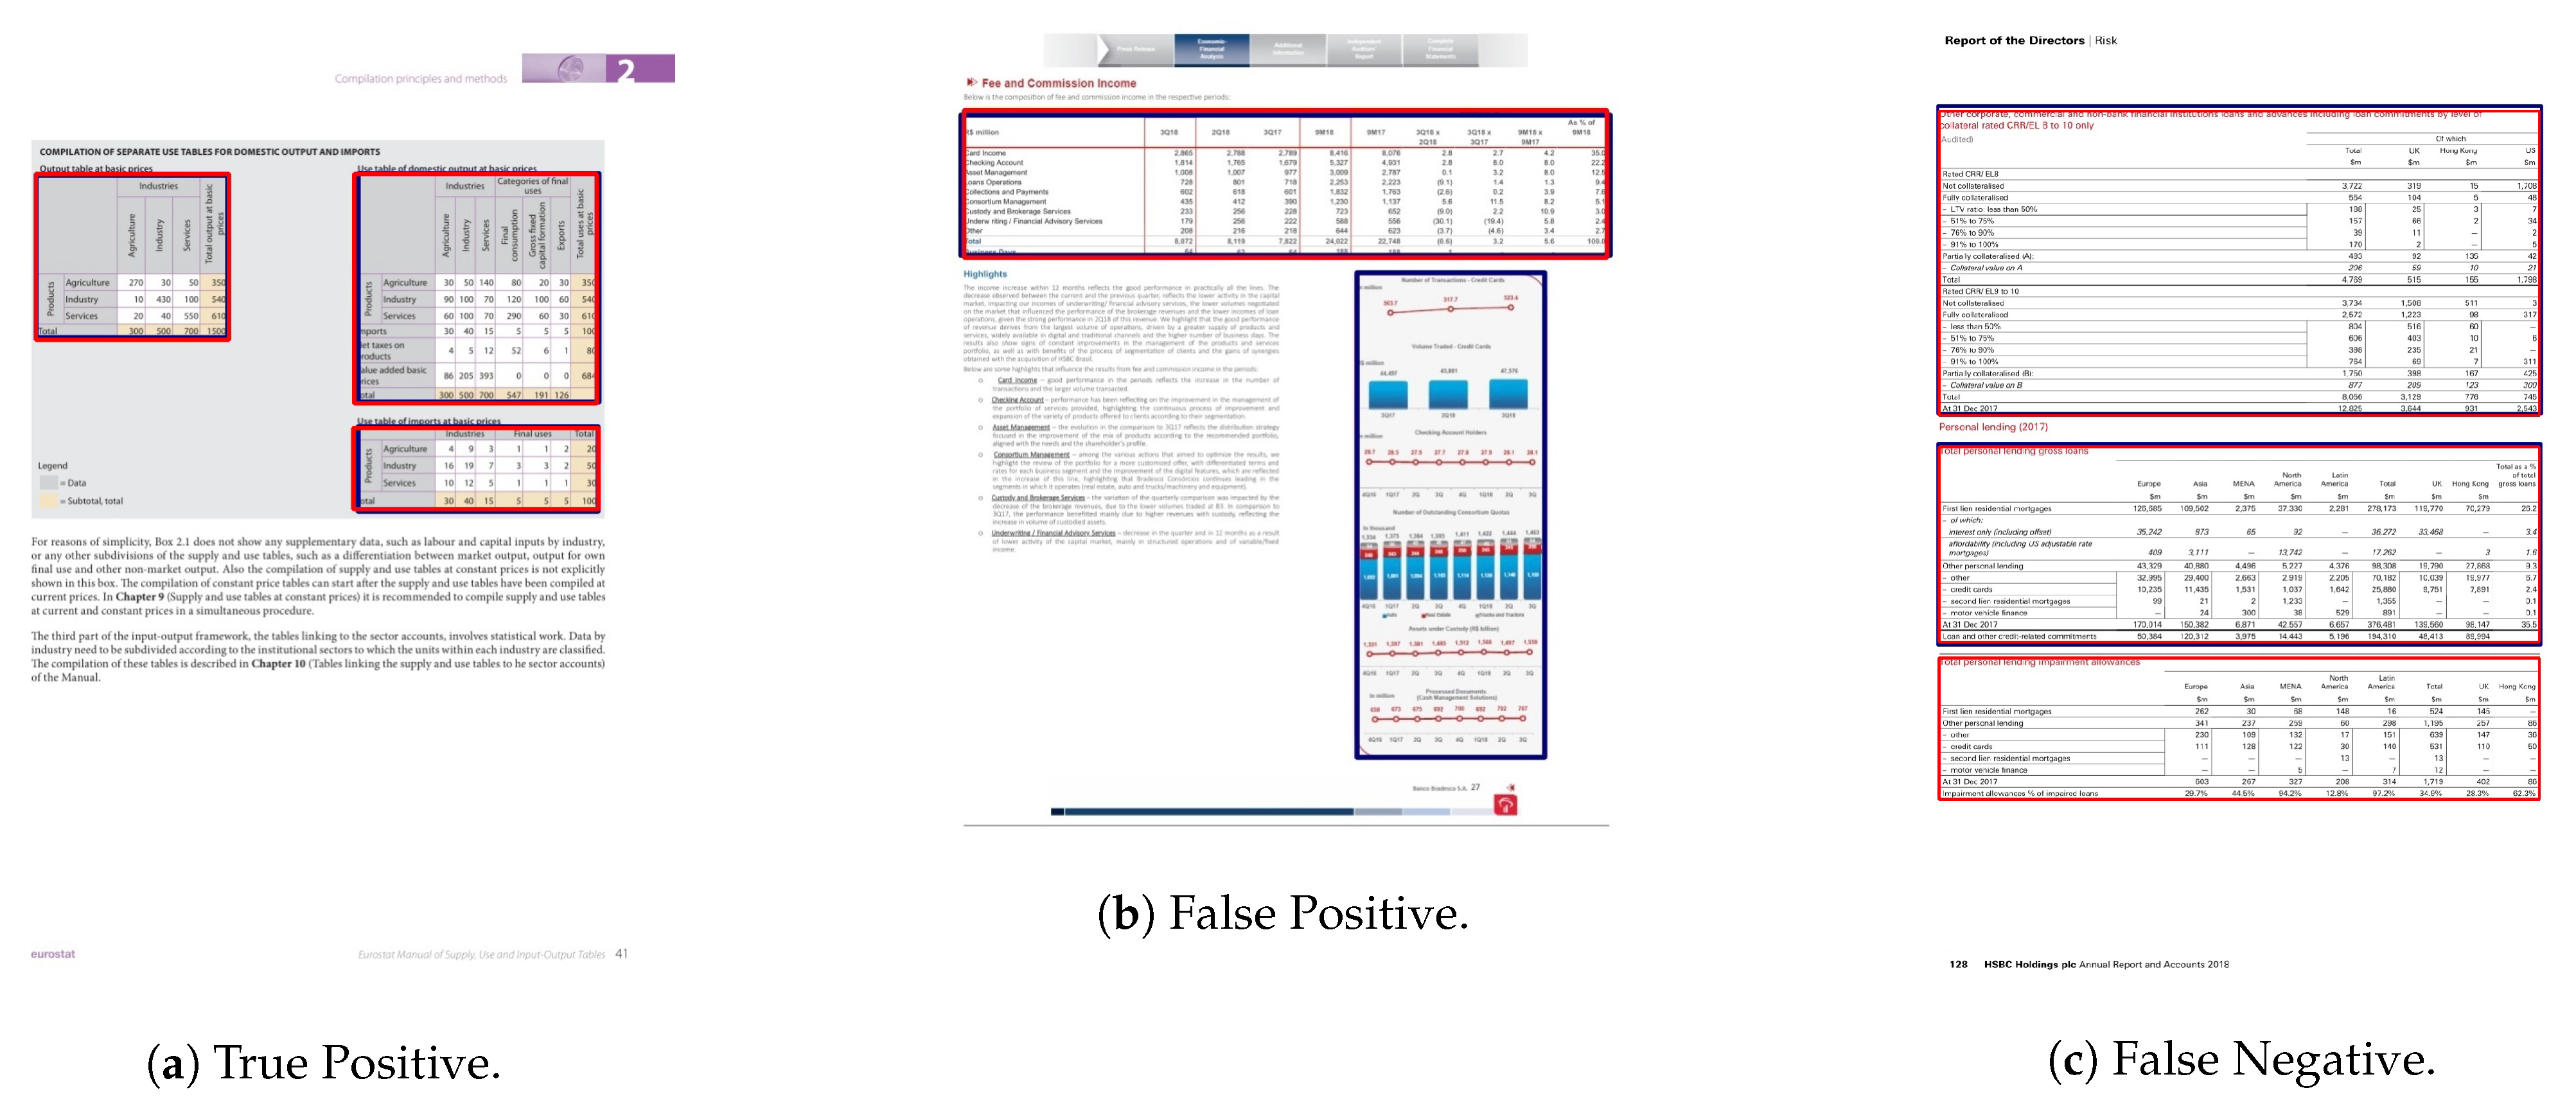
6. Experiments and Results

To perform all of our experiments, we used the MMDetection [68] framework, an open-source framework for object detection based on Pytorch [69]. We used HTC with backbone models ResNet-50 [59] and ResNeXt-101 [54] with deformable convolutions on different datasets to extract the best possible results. We use the configuration files resnet50_fpn and rexnext101_64x4d_fpn_c3–c5 _deconv (cardinality = 64 and Bottleneck width = 4 with deformable convolutions in resnet stage 3 to 5) from MMDetection [68] to implement our backbone models. Both of the models were pretrained on the COCO-2017 [70] dataset and used a Feature Pyramid Network (FPN) [71] neck. FPN extracts features at multiple spatial scales to obtain both low and high-level structures in an image.
ResNet-50 [59] uses a learning schedule of 1×, whereas ResNeXt-101 [54] uses a 20e learning schedule. Both of the learning schedules use Adam’s optimizer with an initial learning rate of 1.25 × 10 4 with a step-based learning rate decay policy. The learning schedule of 1× decays initial learning rate decays by a factor of 10 at the 8 and 16th epochs. Similarly, the learning rate schedule of 20e decays the initial learning rate by a factor of 10 at the 16th and 19th epochs. We used a batch size of 1 in all of our experiments.
We evaluated our results on the IoU thresholds of 0.5 , 0.6 , 0.7 , 0.8 , and 0.9 , which allowed us to perform direct comparison with state-of-the-art approaches [6,7,8,12] in table detection and segmentation.
In the subsequent sections, we discuss our results on different datasets and compare them with state-of-the-art methods.

6.1. ICDAR-19

We finetuned HybridTabNet [20] with backbone models i.e., ResNet-50 [59] and ResNeXt-101 [54] on ICDAR 2019 Track-A Modern dataset [63]. For training and evaluation of our approach, We used the official train-test split given by ICDAR 2019 [63]. Table 1 summarizes the quantitative results of our approach. Our approach achieved the highest precision of 0.953 and a recall of 0.952 on a lower IoU threshold of 0.5 with the ResNeXt-101 backbone. However, from the IoU threshold of 0.5 to 0.8 , there was only a slight decline in f1-scores.
This shows that the performance of our approach was not only limited to the lower IoU threshold. ResNet-50 backbone achieved the highest precision of 0.928 and a recall of 0.920 at the 0.5 IoU threshold, which is lower than the ResNext-101 backbone. Moreover, compared to ResNeXt-101 W.Avg of 0.928 , the W.Avg of f1-score for ResNet-50 was only 0.887 . Therefore, in the succeeding datasets, HybridTabNet used only ResNeXt-101 with deformable convolutions as the backbone in our experiments.
Figure 4 presents the qualitative results of the HybridTabNet on the ICDAR-2019 dataset. In Figure 4b, this network confused a group of bar charts with the table, whereas in Figure 4c, it failed to detect a table without a boundary.

6.2. ICDAR-17 POD

We finetuned HybridTabNet with a ResNeXt-101 backbone on the ICDAR-17-POD [1] dataset. Table 2 quantifies the results of HybridTabNet on the ICDAR-17-POD dataset. This achieved the highest precision of 0.882 and recall of 0.997 on the IoU thresholds of 0.5 to 0.8 . On the IoU threshold 0.9 , it achieved a recall of 0.983 and precision of 0.869 . Overall, the recall value was high and close to 1, whereas the precision value was low. This result means that it rarely failed to detect the table region in the image but also incorrectly labeled regions as tables. Figure 5 depicts the qualitative results of HybridTabNet. Figure 5b shows a False Positive predicted by our model where it confused an image containing a graph as a table. Figure 5c shows a False Negative of our approach where it failed to detect a clear table.

6.3. TableBank

TableBank [64] is a unique dataset that comprises three types of documents, i.e., Latex, Word, and a mixture of Latex and Word documents. It has a separate dataset for each document type. We used a smaller train-test split for training, which was defined by the current state-of-the-art approach [8]. This allowed us to perform a direct comparison of our results with their results. We performed finetuning of HybridTabNet on each of the three datasets in the TableBank dataset.
Table 3 summarizes the results of HybridTabNet on TableBank dataset. It achieved the highest F1-score of 0.980 on the 0.5 IoU threshold in Latex documents. There was only a slight drop in the f1-score of HybridTabNet from IoU thresholds of 0.6 to 0.8 , which shows that its performance was not limited to lower IoU thresholds. However, at the IoU threshold of 0.9 , there was a significant drop in the performance of our approach. Similarly, in Word and a mixture of Latex and Word documents, the F1-score almost remained constant from 0.5 to 0.8 . For the IoU threshold of 0.9 , the F1-score of Word was similar to lower thresholds, i.e., from 0.5 to 0.8 . Conversely, for the mixture of Latex and Word, the F1-score at 0.9 was low.
Figure 6, Figure 7 and Figure 8 illustrate the results on Latex, Word, and the mixture of Latex and Word, respectively. Figure 6a, Figure 7a and Figure 8a show the correct predictions of HybridTabNet. Figure 6b shows the over-segmentation of tables, whereas Figure 6c displays the table that our approach failed to detect. Figure 7b and Figure 8b show the case where a figure that is similar to a table was predicted as a table. Analysis of Figure 7c and Figure 8c, show that our approach faced difficulty when the table had no border.

6.4. Marmot

The Marmot [65] dataset comprises English and Chinese documents. We performed a mixture of both types to create a new dataset. We used HybridTabNet, which was finetuned on the ICDAR-17 dataset, to extract results on the mixed Marmot dataset. Table 4 shows the results of HybridTabNet on the Marmot dataset. Our approach achieved the highest precision of 0.962 and recall of 0.961 at the IoU threshold of 0.5 . There was a slight decrease in precision and recall for the IoU thresholds of 0.6 and 0.7 . However, the IoU thresholds 0.8 and 0.9 achieved lower precision and recall than other IoU thresholds due to the mixed language of documents.
Figure 9 shows the qualitative results of HybridTabNet on the mixed Marmot dataset. Figure 9b shows the under-segmentation of the tables, whereas, in Figure 9c, our approach failed to detect two tables without proper boundaries.

6.5. UNLV

We finetuned HybridTabNet on the UNLV [72] dataset. Table 5 illustrates the results of HybridTabNet on the UNLV dataset. Our approach achieved the highest precision of 0.926 and recall of 0.962 on the IoU threshold of 0.5 . There was a slight decrease in the precision and recall for IoU thresholds of 0.6 , 0.7 , and 0.8 . However, at 0.9 IoU, our approach achieved precision of 0.792 and recall of 0.822 , which was worse than lower thresholds. We manually inspected the failure cases and found that the boundaries of tables and figures were ambiguous in the dataset. Such cases are shown in Figure 10.
Figure 10 depicts the results of HybridTabNet on the UNLV dataset. Figure 10b shows the False Positive predicted by our model in which our approach performed over-segmentation of the table. Figure 10c illustrates the False Negative result, which shows that our approach failed to detect boundary-less tables.

6.6. Comparison with State-of-the-Art Approaches

6.6.1. ICDAR-19

Table 6 summarizes the comparison of HybridTabNet and the current state-of-the-art approaches [8,63] on the ICDAR-2019-TrackA-Modern dataset. Our approach achieved a W.Avg of 0.928 , which is close to the state-of-the-art performance. This does not beat the state-of-the-art performance of table region detection because they utilize image processing techniques, such as Dilation and Smudging for effective learning.
The advantage of our approach is that we did not use any image preprocessing or post-processing techniques on the data. Our model directly takes the raw training data without any image preprocessing technique and learns effective representations. It outputs the accurate table region masks and bounding boxes directly at inference time due to its architectural design and the techniques implanted during its training.
The aforementioned points make our technique much better than the earlier state-of-the-art methods. Even without utilizing any image preprocessing or post-processing techniques, our model achieved better performance compared with current state-of-the-art approaches.

6.6.2. ICDAR-17

From Table 6, we can observe that the current state-of-the-art approaches [7,12,63] for ICDAR-17 dataset are evaluated only on 0.6 and 0.8 IoU thresholds. We achieve the f1-scores of 0.936 and 0.933 on the IoU thresholds 0.6 and 0.8 . If we directly compare our approach results on the mentioned IoU thresholds with current state-of-the-art methods, it is apparent that we do not achieve state-of-the-art performance. The inter-class variance in ICDAR-17 is less, which makes it harder to detect the table regions.
The current state-of-the-art approach [12] on this dataset also learns the difference between a table, figures, and equations. This enable their approach to produce less false positives. However, in our approach, we do not learn such differences between the classes, and instead, we learn the mapping directly for the table class. This leads to lower precision scores but higher recall scores even on higher IoU thresholds. Furthermore, we provide results at 0.5 , 0.8 , and 0.9 IoU thresholds for the sake of completeness and future bench-marking.

6.6.3. ICDAR-13

Table 6 shows the results of HybridTabNet on the ICDAR-2013 [62] dataset. The current state-of-the-art approach [8] already achieved the perfect f1-score of 1.0 at the 0.5 IoU threshold. Our approach achieved an f1-score of 1.0 at the 0.5 IoU threshold, which is state-of-the-art performance.

6.6.4. TableBank

The TableBank [64] dataset consists of three subset datasets, which are Latex, Word and a mixture of Latex and Word documents. Table 6 shows the comparison of HybridTabNet and the current state-of-the-art approach Cascade-TabNet [8]. Cascade-TabNet evaluates Latex, Word, and a mixture of Latex and Word documents only at the IoU threshold of 0.5 . It achieved f1-scores of 0.966 , 0.949 , and 0.943 on Latex, Word, and their mixture.
We also evaluated our approach on 0.5 and achieved f1-scores of 0.980 , 0.970 , and 0.974 on Latex, Word and their mixture. If we directly compare the results, we achieve state-of-the-art performance on each subset of TableBank. Moreover, CascadeTabNet [8] applies line correction on the test data as an image postprocessing technique to improve their results. However, we did not use any such image preprocessing or postprocessing techniques. This makes our technique and approach far superior to CascadeTabNet [8]. Furthermore, we also report results on 0.6 , 0.7 , 0.8 , and 0.9 IoU thresholds, which can be used for future benchmarking on the dataset.

6.6.5. Marmot

Table 6 illustrates the comparison of HybridTabNet and the current state-of-the-art approaches DeCNT [7] and CDeC-Net [9]. DeCNT achieved the F1-score of 0.895 on the 0.5 IoU threshold, and CDeC-Net [9] achieved F1-scores of 0.952 , 0.840 , and 0.769 on the 0.5 , 0.8 , and 0.9 IoU thresholds. Similarly, our approach achieved F1-scores of 0.956 , 0.936 , and 0.901 on the 0.5 , 0.8 , and 0.9 IoU thresholds. The direct comparison of our results with CDeC-Net and DeCNT proves that we achieved state-of-the-art results on the Marmot dataset. We also evaluated our approach on the 0.6 and 0.7 IoU thresholds for future benchmarking on the dataset.

6.6.6. UNLV

The current state-of-the-art approaches GOD [12] and CDeC-Net [9] on UNLV [72] were evaluated on the IoU thresholds of 0.5 and 0.6 . Table 6 presents the comparison of HybridTabNet and state-of-the-art approaches on the UNLV dataset. GOD achieved an F1-score of 0.928 on the 0.5 IoU threshold, whereas CDeC-Net achieved an F1-score of 0.938 and 0.883 on the IoU thresholds of 0.5 and 0.6 . For a direct comparison, we evaluated our approach from the 0.5 to 0.9 IoU thresholds. We obtained F1-scores of 0.944 and 0.931 on the 0.5 and 0.6 IoU thresholds, which is better than the current state-of-the-art methods, thus, achieving state-of-the-art performance on the UNLV dataset.

6.7. Leave-One-Out Evaluation

This section explores the employed evaluation strategy to measure the generalization and cross datasets performance of HybridTabNet. To the best of our knowledge, this is the first comprehensive cross dataset evaluation study that consists of several datasets. The idea is as follows: we combined all available datasets except one into a single dataset. This new dataset became our training dataset, whereas the dataset that was left out became our test dataset.
In the case of ICDAR-2019-TrackA-Modern, other datasets, such as ICDAR-2017-POD, ICDAR-2013, Marmot, UNLV, and TableBank were combined and became a single training dataset, whereas ICDAR-2019-TrackA-Modern became our test dataset. We repeated this process for all of the datasets, and performance evaluation was done on 0.5 to 0.9 IoU thresholds.
Table 7 presents the results of the leave-one-out evaluation of HybridTabNet. The results were not promising for datasets, including ICDAR-2013, ICDAR-2017-POD, and ICDAR-2019-TrackA-Modern. This is because the union of datasets included Marmot and UNLV, which are different from the ICDAR-2013, ICDAR-2017-POD, and ICDAR-2019-TrackA-Modern datasets. Consequently, the combined training datasets do not resemble the test dataset, and the performance dropped. We achieved f1-scores of 0.962, 0.960, 0.956, 0.949, 0.929, and 0.949 on 0.5 to 0.9 IoU thresholds for the Marmot dataset. These results are better than the ones presented for Marmot in Table 6, and therefore it achieved state-of-the-art performance. Similarly, the results on TableBank and UNLV are also comparable to the state-of-the-art results.

7. Conclusions and Future Work

This paper presents a novel approach, HybridTabNet, for table detection from scanned document images. The approach uses the ResNeXt-101 backbone for feature extraction and also replaces regular convolutions with deformable convolutions. The proposed approach is the Hybrid Task Cascade network for table detection that uses cascade architecture, for instance, segmentation. Our method surpassed the existing state-of-the-art table detection methods in all the datasets except for ICDAR-2017-POD. The relative improvement of error in terms of the weighted average amounted to 27.57 % for ICDAR-2019-TrackA-Modern, 42.64 % for TableBank (Latex), 41.33 % for TableBank (Word), 55.73 % for TableBank (Latex + Word), 10 % for Marmot, and 9.67 % for UNLV. For ICDAR-2013, the proposed approach achieved a perfect score for precision and recall, which is on par with the previous state-of-the-art method.
However, for ICDAR-2017-POD, the proposed approach did not outperform the state-of-the-art methods. This is because ICDAR-2017-POD contains a lot of other graphical page components that are similar to tables. Other methods rely on pre-and/or post-processing to transform the data for favorable results. However, our approach works on raw images. Moreover, we incorporated the leave-one-out evaluation for all the datasets, which demonstrated the algorithm’s generalization capabilities—a direction for evaluating table detection algorithms to follow in the future.
An important future direction is the development of generalized table detection methods that can work with various types of tables instead of being tuned for a specific dataset. We plan to extend this work to create a unified representation that eliminates the pre-and post-processing steps. Moreover, another interesting direction can be to explore table structure recognition with the proposed approach. The proposed approach can be used for cell detection directly. Afterward, cells are classified in rows and columns for the interpretation of the complete structure of table. In addition, we can further improve the results using a recently proposed enhanced version of deformable convolution [73].

Author Contributions

Writing—original draft preparation, D.N., K.A.H. and M.Z.A.; writing—review and editing, K.A.H., M.Z.A. and M.L.; supervision and project administration, A.P. and D.S. All authors have read and agreed to the submitted version of the manuscript.

Funding

The work leading to this publication has been partially funded by the European project INFINITY under Grant Agreement ID 883293.

Institutional Review Board Statement

Not applicable.

Informed Consent Statement

Not applicable.

Data Availability Statement

Not applicable.

Conflicts of Interest

The authors declare no conflict of interest.

References

  1. Gao, L.; Yi, X.; Jiang, Z.; Hao, L.; Tang, Z. ICDAR2017 competition on page object detection. In Proceedings of the 2017 14th IAPR International Conference on Document Analysis and Recognition (ICDAR), Kyoto, Japan, 9–15 November 2017; Volume 1, pp. 1417–1422. [Google Scholar]
  2. Zhao, Z.; Jiang, M.; Guo, S.; Wang, Z.; Chao, F.; Tan, K.C. Improving deep learning based optical character recognition via neural architecture search. In Proceedings of the 2020 IEEE Congress on Evolutionary Computation (CEC), Glasgow, UK, 19–24 July 2020; pp. 1–7. [Google Scholar]
  3. Hashmi, K.A.; Ponnappa, R.B.; Bukhari, S.S.; Jenckel, M.; Dengel, A. Feedback Learning: Automating the Process of Correcting and Completing the Extracted Information. In Proceedings of the 2019 International Conference on Document Analysis and Recognition Workshops (ICDARW), Sydney, Australia, 22–25 September 2019; Volume 5, pp. 116–121. [Google Scholar]
  4. Van Strien, D.; Beelen, K.; Ardanuy, M.C.; Hosseini, K.; McGillivray, B.; Colavizza, G. Assessing the Impact of OCR Quality on Downstream NLP Tasks. In Proceedings of the International Conference on Agents and Artificial Intelligence ICAART (1), Valletta, Malta, 22–24 February 2020; pp. 484–496. [Google Scholar]
  5. Bhatt, J.; Hashmi, K.A.; Afzal, M.Z.; Stricker, D. A Survey of Graphical Page Object Detection with Deep Neural Networks. Appl. Sci. 2021, 11, 5344. [Google Scholar] [CrossRef]
  6. Schreiber, S.; Agne, S.; Wolf, I.; Dengel, A.; Ahmed, S. Deepdesrt: Deep learning for detection and structure recognition of tables in document images. In Proceedings of the 2017 14th IAPR International Conference on Document Analysis and Recognition (ICDAR), Kyoto, Japan, 9–15 November 2017; Volume 1, pp. 1162–1167. [Google Scholar]
  7. Siddiqui, S.A.; Malik, M.I.; Agne, S.; Dengel, A.; Ahmed, S. Decnt: Deep deformable cnn for table detection. IEEE Access 2018, 6, 74151–74161. [Google Scholar] [CrossRef]
  8. Prasad, D.; Gadpal, A.; Kapadni, K.; Visave, M.; Sultanpure, K. CascadeTabNet: An approach for end to end table detection and structure recognition from image-based documents. In Proceedings of the IEEE/CVF Conference on Computer Vision and Pattern Recognition Workshops, Seattle, WA, USA, 14–19 June 2020; pp. 572–573. [Google Scholar]
  9. Agarwal, M.; Mondal, A.; Jawahar, C. CDeC-Net: Composite Deformable Cascade Network for Table Detection in Document Images. arXiv 2020, arXiv:2008.10831. [Google Scholar]
  10. Huang, Y.; Yan, Q.; Li, Y.; Chen, Y.; Wang, X.; Gao, L.; Tang, Z. A YOLO-based table detection method. In Proceedings of the 2019 International Conference on Document Analysis and Recognition (ICDAR), Sydney, Australia, 20–25 September 2019; pp. 813–818. [Google Scholar]
  11. Gilani, A.; Qasim, S.R.; Malik, I.; Shafait, F. Table detection using deep learning. In Proceedings of the 2017 14th IAPR International Conference on Document Analysis and Recognition (ICDAR), Kyoto, Japan, 9–15 November 2017; Volume 1, pp. 771–776. [Google Scholar]
  12. Saha, R.; Mondal, A.; Jawahar, C. Graphical object detection in document images. In Proceedings of the 2019 International Conference on Document Analysis and Recognition (ICDAR), Sydney, Australia, 20–25 September 2019; pp. 51–58. [Google Scholar]
  13. Coüasnon, B.; Lemaitre, A. Recognition of Tables and Forms; HAL: Lyon, France, 2014. [Google Scholar]
  14. Girshick, R. Fast r-cnn. In Proceedings of the IEEE International Conference on Computer Vision, Santiago, Chile, 7–13 December 2015; pp. 1440–1448. [Google Scholar]
  15. Ren, S.; He, K.; Girshick, R.; Sun, J. Faster r-cnn: Towards real-time object detection with region proposal networks. arXiv 2015, arXiv:1506.01497. [Google Scholar] [CrossRef] [PubMed] [Green Version]
  16. He, K.; Gkioxari, G.; Dollár, P.; Girshick, R. Mask r-cnn. In Proceedings of the IEEE International Conference on Computer Vision, Venice, Italy, 22–29 October 2017; pp. 2961–2969. [Google Scholar]
  17. Cai, Z.; Vasconcelos, N. Cascade r-cnn: Delving into high quality object detection. In Proceedings of the IEEE Conference on Computer Vision and Pattern Recognition, Salt Lake City, UT, USA, 18–23 June 2018; pp. 6154–6162. [Google Scholar]
  18. Paliwal, S.S.; Vishwanath, D.; Rahul, R.; Sharma, M.; Vig, L. Tablenet: Deep learning model for end-to-end table detection and tabular data extraction from scanned document images. In Proceedings of the 2019 International Conference on Document Analysis and Recognition (ICDAR), Sydney, Australia, 20–25 September 2019; pp. 128–133. [Google Scholar]
  19. Hashmi, K.A.; Stricker, D.; Liwicki, M.; Afzal, M.N.; Afzal, M.Z. Guided Table Structure Recognition through Anchor Optimization. arXiv 2021, arXiv:2104.10538. [Google Scholar]
  20. Chen, K.; Pang, J.; Wang, J.; Xiong, Y.; Li, X.; Sun, S.; Feng, W.; Liu, Z.; Shi, J.; Ouyang, W.; et al. Hybrid Task Cascade for instance segmentation. In Proceedings of the IEEE/CVF Conference on Computer Vision and Pattern Recognition, Long Beach, CA, USA, 15–20 June 2019; pp. 4974–4983. [Google Scholar]
  21. Dai, J.; Qi, H.; Xiong, Y.; Li, Y.; Zhang, G.; Hu, H.; Wei, Y. Deformable Convolutional Networks. arXiv 2017, arXiv:1703.06211. [Google Scholar]
  22. Itonori, K. Table structure recognition based on textblock arrangement and ruled line position. In Proceedings of the 2nd International Conference on Document Analysis and Recognition (ICDAR’93), Tsukuba, Japan, 20–22 October 1993; pp. 765–768. [Google Scholar]
  23. Tupaj, S.; Shi, Z.; Chang, C.H.; Alam, H. Extracting Tabular Information from Text Files; EECS Department, Tufts University: Medford, FL, USA, 1996. [Google Scholar]
  24. Chandran, S.; Kasturi, R. Structural recognition of tabulated data. In Proceedings of the 2nd International Conference on Document Analysis and Recognition (ICDAR’93), Sukuba, Japan, 20–22 October 1993; pp. 516–519. [Google Scholar]
  25. Hirayama, Y. A method for table structure analysis using DP matching. In Proceedings of the 3rd International Conference on Document Analysis and Recognition, Montreal, QC, Canada, 14–16 August 1995; Volume 2, pp. 583–586. [Google Scholar]
  26. Green, E.; Krishnamoorthy, M. Recognition of tables using table grammars. In Proceedings of the Fourth Annual Symposium on Document Analysis and Information Retrieval, Las Vegas, NV, USA, 24–26 April 1995; pp. 261–278. [Google Scholar]
  27. Kieninger, T.G. Table structure recognition based on robust block segmentation. In Document Recognition V. International Society for Optics and Photonics; SPIE Proceedings: San Jose, CA, USA, 1998; Volume 3305, pp. 22–32. [Google Scholar]
  28. Casado-García, Á.; Domínguez, C.; Heras, J.; Mata, E.; Pascual, V. The benefits of close-domain fine-tuning for table detection in document images. In International Workshop on Document Analysis Systems; Springer: Berlin/Heidelberg, Germany, 2020; pp. 199–215. [Google Scholar]
  29. Sun, N.; Zhu, Y.; Hu, X. Faster R-CNN based table detection combining corner locating. In Proceedings of the 2019 International Conference on Document Analysis and Recognition (ICDAR), Sydney, Australia, 20–25 September 2019; pp. 1314–1319. [Google Scholar]
  30. Vo, N.D.; Nguyen, K.; Nguyen, T.V.; Nguyen, K. Ensemble of deep object detectors for page object detection. In Proceedings of the 12th International Conference on Ubiquitous Information Management and Communication, Langkawi, Malaysia, 5–7 January 2018; pp. 1–6. [Google Scholar]
  31. Mondal, A.; Lipps, P.; Jawahar, C. IIIT-AR-13K: A new dataset for graphical object detection in documents. In International Workshop on Document Analysis Systems; Springer: Berlin/Heidelberg, Germany, 2020; pp. 216–230. [Google Scholar]
  32. Hashmi, K.A.; Liwicki, M.; Stricker, D.; Afzal, M.A.; Afzal, M.A.; Afzal, M.Z. Current Status and Performance Analysis of Table Recognition in Document Images with Deep Neural Networks. IEEE Access 2021, 9, 87663–87685. [Google Scholar] [CrossRef]
  33. Pyreddy, P.; Croft, W.B. Tintin: A system for retrieval in text tables. In Proceedings of the Second ACM International Conference on Digital Libraries, Philadelphia, PA, USA, 23–26 July 1997; pp. 193–200. [Google Scholar]
  34. Pivk, A.; Cimiano, P.; Sure, Y.; Gams, M.; Rajkovič, V.; Studer, R. Transforming arbitrary tables into logical form with TARTAR. Data Knowl. Eng. 2007, 60, 567–595. [Google Scholar] [CrossRef]
  35. Hu, J.; Kashi, R.S.; Lopresti, D.P.; Wilfong, G. Medium-independent table detection. In Document Recognition and Retrieval VII. International Society for Optics and Photonics; Proc. SPIE; International Society for Optics and Photonics: San Jose, CA, USA, 1999; Volume 3967, pp. 291–302. [Google Scholar]
  36. Zanibbi, R.; Blostein, D.; Cordy, J.R. A survey of table recognition. Doc. Anal. Recognit. 2004, 7, 1–16. [Google Scholar] [CrossRef]
  37. e Silva, A.C.; Jorge, A.M.; Torgo, L. Design of an end-to-end method to extract information from tables. Int. J. Doc. Anal. Recognit. 2006, 8, 144–171. [Google Scholar] [CrossRef]
  38. Khusro, S.; Latif, A.; Ullah, I. On methods and tools of table detection, extraction and annotation in PDF documents. J. Inf. Sci. 2015, 41, 41–57. [Google Scholar] [CrossRef]
  39. Embley, D.W.; Hurst, M.; Lopresti, D.; Nagy, G. Table-processing paradigms: A research survey. Int. J. Doc. Anal. Recognit. (IJDAR) 2006, 8, 66–86. [Google Scholar] [CrossRef]
  40. Kieninger, T.; Dengel, A. The t-recs table recognition and analysis system. In International Workshop on Document Analysis Systems; Springer: Berlin/Heidelberg, Germany, 1998; pp. 255–270. [Google Scholar]
  41. Oro, E.; Ruffolo, M. TREX: An approach for recognizing and extracting tables from PDF documents. In Proceedings of the 2009 10th International Conference on Document Analysis and Recognition, Barcelona, Spain, 26–29 July 2009; pp. 906–910. [Google Scholar]
  42. Fan, M.; Kim, D.S. Detecting table region in PDF documents using distant supervision. arXiv 2015, arXiv:1506.08891. [Google Scholar]
  43. Cesarini, F.; Marinai, S.; Sarti, L.; Soda, G. Trainable table location in document images. Object Recognit. Support. User Interact. Service Rob. 2002, 3, 236–240. [Google Scholar]
  44. e Silva, A.C. Learning rich hidden markov models in document analysis: Table location. In Proceedings of the 2009 10th International Conference on Document Analysis and Recognition, Barcelona, Spain, 26–29 July 2009; pp. 843–847. [Google Scholar]
  45. Silva, A. Parts That Add up to a Whole: A Framework for the Analysis of Tables; Edinburgh University: Edinburgh, UK, 2010. [Google Scholar]
  46. Kasar, T.; Barlas, P.; Adam, S.; Chatelain, C.; Paquet, T. Learning to detect tables in scanned document images using line information. In Proceedings of the 2013 12th International Conference on Document Analysis and Recognition, Washington, DC, USA, 25–28 August 2013; pp. 1185–1189. [Google Scholar]
  47. Hao, L.; Gao, L.; Yi, X.; Tang, Z. A table detection method for pdf documents based on convolutional neural networks. In Proceedings of the 2016 12th IAPR Workshop on Document Analysis Systems (DAS), Santorini, Greece, 11–14 April 2016; pp. 287–292. [Google Scholar]
  48. Zeiler, M.D.; Fergus, R. Visualizing and understanding convolutional networks. In European Conference on Computer Vision; Springer: Berlin/Heidelberg, Germany, 2014; pp. 818–833. [Google Scholar]
  49. Simonyan, K.; Zisserman, A. Very deep convolutional networks for large-scale image recognition. arXiv 2014, arXiv:1409.1556. [Google Scholar]
  50. Zhong, X.; Tang, J.; Yepes, A.J. Publaynet: Largest dataset ever for document layout analysis. In Proceedings of the 2019 International Conference on Document Analysis and Recognition (ICDAR), Sydney, Australia, 20–25 September 2019; pp. 1015–1022. [Google Scholar]
  51. Lin, T.Y.; Goyal, P.; Girshick, R.; He, K.; Dollár, P. Focal loss for dense object detection. In Proceedings of the IEEE International Conference on Computer Vision, Venice, Italy, 22–29 October 2017; pp. 2980–2988. [Google Scholar]
  52. Liu, W.; Anguelov, D.; Erhan, D.; Szegedy, C.; Reed, S.; Fu, C.Y.; Berg, A.C. Ssd: Single shot multibox detector. In European Conference on Computer Vision; Springer: Berlin/Heidelberg, Germany, 2016; pp. 21–37. [Google Scholar]
  53. Redmon, J.; Divvala, S.; Girshick, R.; Farhadi, A. You only look once: Unified, real-time object detection. In Proceedings of the IEEE Conference on Computer Vision and Pattern Recognition, Las Vegas, NV, USA, 27–30 June 2016; pp. 779–788. [Google Scholar]
  54. Xie, S.; Girshick, R.; Dollár, P.; Tu, Z.; He, K. Aggregated Residual Transformations for Deep Neural Networks. arXiv 2016, arXiv:1611.05431. [Google Scholar]
  55. Krizhevsky, A.; Sutskever, I.; Hinton, G.E. Imagenet classification with deep convolutional neural networks. Adv. Neural Inf. Process. Syst. 2012, 25, 1097–1105. [Google Scholar] [CrossRef]
  56. Zhao, Z.Q.; Zheng, P.; Xu, S.T.; Wu, X. Object Detection with Deep Learning: A Review. arXiv 2019, arXiv:1807.05511. [Google Scholar] [CrossRef] [Green Version]
  57. Jiao, L.; Zhang, F.; Liu, F.; Yang, S.; Li, L.; Feng, Z.; Qu, R. A Survey of Deep Learning-Based Object Detection. IEEE Access 2019, 7, 128837–128868. [Google Scholar] [CrossRef]
  58. Minaee, S.; Boykov, Y.; Porikli, F.; Plaza, A.; Kehtarnavaz, N.; Terzopoulos, D. Image Segmentation Using Deep Learning: A Survey. arXiv 2020, arXiv:2001.05566. [Google Scholar]
  59. He, K.; Zhang, X.; Ren, S.; Sun, J. Deep Residual Learning for Image Recognition. arXiv 2015, arXiv:1512.03385. [Google Scholar]
  60. Nasr, G.E.; Badr, E.; Joun, C. Cross entropy error function in neural networks: Forecasting gasoline demand. In Proceedings of the FLAIRS Conference, Pensacola Beach, FL, USA, 16–18 May 2002; pp. 381–384. [Google Scholar]
  61. Ruby, U.; Yendapalli, V. Binary cross entropy with deep learning technique for image classification. Int. J. Adv. Trends Comput. Sci. Eng. 2020, 9. [Google Scholar] [CrossRef]
  62. Göbel, M.; Hassan, T.; Oro, E.; Orsi, G. ICDAR 2013 table competition. In Proceedings of the 2013 12th International Conference on Document Analysis and Recognition, Washington, DC, USA, 25–28 August 2013; pp. 1449–1453. [Google Scholar]
  63. Gao, L.; Huang, Y.; Déjean, H.; Meunier, J.L.; Yan, Q.; Fang, Y.; Kleber, F.; Lang, E. ICDAR 2019 competition on table detection and recognition (cTDaR). In Proceedings of the 2019 International Conference on Document Analysis and Recognition (ICDAR), Sydney, Australia, 20–25 September 2019; pp. 1510–1515. [Google Scholar]
  64. Li, M.; Cui, L.; Huang, S.; Wei, F.; Zhou, M.; Li, Z. Tablebank: Table benchmark for image-based table detection and recognition. In Proceedings of the 12th Language Resources and Evaluation Conference, Marseille, France, 11–16 May 2020; pp. 1918–1925. [Google Scholar]
  65. Fang, J.; Tao, X.; Tang, Z.; Qiu, R.; Liu, Y. Dataset, ground-truth and performance metrics for table detection evaluation. In Proceedings of the 2012 10th IAPR International Workshop on Document Analysis Systems, Gold Coast, Australia, 27–29 March 2012; pp. 445–449. [Google Scholar]
  66. Yu, J.; Jiang, Y.; Wang, Z.; Cao, Z.; Huang, T. Unitbox: An advanced object detection network. In Proceedings of the 24th ACM international conference on Multimedia, Amsterdam, The Netherlands, 15–19 October 2016; pp. 516–520. [Google Scholar]
  67. Rezatofighi, H.; Tsoi, N.; Gwak, J.; Sadeghian, A.; Reid, I.; Savarese, S. Generalized intersection over union: A metric and a loss for bounding box regression. In Proceedings of the IEEE/CVF Conference on Computer Vision and Pattern Recognition, Long Beach, CA, USA, 15–20 June 2019; pp. 658–666. [Google Scholar]
  68. Chen, K.; Wang, J.; Pang, J.; Cao, Y.; Xiong, Y.; Li, X.; Sun, S.; Feng, W.; Liu, Z.; Xu, J.; et al. MMDetection: Open MMLab Detection Toolbox and Benchmark. arXiv 2019, arXiv:1906.07155. [Google Scholar]
  69. Paszke, A.; Gross, S.; Massa, F.; Lerer, A.; Bradbury, J.; Chanan, G.; Killeen, T.; Lin, Z.; Gimelshein, N.; Antiga, L.; et al. PyTorch: An Imperative Style, High-Performance Deep Learning Library. In Advances in Neural Information Processing Systems 32; Wallach, H., Larochelle, H., Beygelzimer, A., d’Alché-Buc, F., Fox, E., Garnett, R., Eds.; Curran Associates, Inc.: Vancouver, BC, Canada, 2019; pp. 8024–8035. [Google Scholar]
  70. Lin, T.Y.; Maire, M.; Belongie, S.; Bourdev, L.; Girshick, R.; Hays, J.; Perona, P.; Ramanan, D.; Zitnick, C.L.; Dollár, P. Microsoft COCO: Common Objects in Context. arXiv 2014, arXiv:1405.03129. [Google Scholar]
  71. Lin, T.Y.; Dollár, P.; Girshick, R.; He, K.; Hariharan, B.; Belongie, S. Feature Pyramid Networks for Object Detection. arXiv 2017, arXiv:1612.03144. [Google Scholar]
  72. Shahab, A.; Shafait, F.; Kieninger, T.; Dengel, A. An open approach towards the benchmarking of table structure recognition systems. In Proceedings of the 9th IAPR International Workshop on Document Analysis Systems, Boston, MA, USA, 9–11 June 2010; pp. 113–120. [Google Scholar]
  73. Zhu, X.; Hu, H.; Lin, S.; Dai, J. Deformable convnets v2: More deformable, better results. In Proceedings of the IEEE/CVF Conference on Computer Vision and Pattern Recognition, Long Beach, CA, USA, 15–20 June 2019; pp. 9308–9316. [Google Scholar]
Figure 1. HybridTabNet for Table detection and segmentation. In the first step, the network performs feature extraction using ResNeXt-101 [54] with deformable convolution layers. The second step utilizes the Hybrid Task Cascade network to regress the bounding box and semantic mask coordinates of the table in the image.
Applsci 11 08396 g001
Figure 2. The components of our feature extraction pipeline. Part (a) shows the structure of deformable convolutions where the traditional convolutional grid (in blue) is transformed into deformable grid (in white) by adding 2D offsets. Part (b) shows that the conventional convolutions are replaced with deformable convolutions in ResNeXt-101 to extract tables at multiple scales.
Applsci 11 08396 g002
Figure 3. Explained architecture of the Hybrid Task Cascade Network. This network utilizes three box and mask heads in a cascading architecture to produce accurate predictions.
Applsci 11 08396 g003
Figure 4. HybridTabNet results on ICDAR-2019 Track-A Modern dataset. (ac) True positive, False positive, and False negative results, respectively. The blue outline shows the predicted table, and the red outline highlights the ground truth table.
Applsci 11 08396 g004
Figure 5. HybridTabNet results on the ICDAR-2017 dataset. (ac) True positive, False positive, and False negative results, respectively. The blue outline shows the predicted table, and the red outline highlights the ground truth table.
Applsci 11 08396 g005
Figure 6. HybridTabNet results on TableBank Latex dataset. (ac) True positive, False positive, and False negative results, respectively. The blue outline shows the predicted table, and the red outline highlights the ground truth table.
Applsci 11 08396 g006
Figure 7. HybridTabNet results on TableBankWord dataset. (ac) True positive, False positive, and False negative results, respectively. The blue outline shows the predicted table, and the red outline highlights the ground truth table.
Applsci 11 08396 g007
Figure 8. HybridTabNet results on TableBank Both (Latex + Word) dataset. (ac) True positive, False positive, and False negative results, respectively. The blue outline shows the predicted table, and the red outline highlights the ground truth table.
Applsci 11 08396 g008
Figure 9. HybridTabNet results on Marmot dataset. (ac) True positive, False positive, and False negative results, respectively. The blue outline shows the predicted table, and the red outline highlights the ground truth table.
Applsci 11 08396 g009
Figure 10. HNet results on UNLV dataset. (ac) True positive, False positive, and False negative results, respectively. The blue outline shows the predicted table, and the red outline highlights the ground truth table.
Applsci 11 08396 g010
Table 1. HybridTabNet results on the ICDAR-19 dataset with deformable ResNeXt-101 and ResNet-50 backbones. W.Avg denotes the weighted-average of the respective measure on the IoU threshold.
BackboneIOU ThresholdPrecisionRecallF1-Score
ResNeXt-1010.50.9540.9530.953
0.60.9370.9480.942
0.70.9270.9480.933
0.80.9200.93310.927
0.90.8950.9050.901
W.Avg0.9230.9340.928
ResNet-500.50.9280.9200.924
0.60.9050.9220.913
0.70.8940.9100.902
0.80.8790.8950.887
0.90.8310.8460.838
W.Avg0.8810.8940.887
Table 2. HybridTabNet results ICDAR-17 POD results with a deformable ResNeXt-101 backbone. W.Avg denotes weighted-average of the respective measure on the IoU threshold.
ModelIOU ThresholdPrecisionRecallF1-Score
HybridTabNet0.50.8820.9970.936
0.60.8820.9970.936
0.70.8820.9970.936
0.80.8790.9940.933
0.90.8700.9830.926
W.Avg0.8780.9930.932
Table 3. HybridTabNet results on each document type of TableBank dataset. W.Avg denotes the weighted-average of the respective measure on the IoU threshold.
DatasetIOU ThresholdPrecisionRecallF1-Score
Latex0.50.9770.9830.980
0.60.9770.9820.979
0.70.9750.9800.978
0.80.9690.9740.971
0.90.9320.9370.934
W.Avg0.9630.9680.966
Word0.50.9550.9850.970
0.60.9530.9820.967
0.70.9510.9800.965
0.80.9500.9780.964
0.90.9480.9770.962
W.Avg0.9500.9790.965
Both0.50.9630.9860.974
0.60.9610.9840.972
0.70.9590.9820.970
0.80.9550.9780.967
0.90.9380.9600.949
W.Avg0.9530.9760.965
Table 4. HybridTabNet results on the mixed (Chinese + English) Marmot dataset. W.Avg denotes weighted-average of the respective measure on the IoU threshold.
IOU ThresholdPrecisionRecallF1-Score
0.50.9620.9610.956
0.60.9520.9550.953
0.70.9470.9500.948
0.80.9340.9380.936
0.90.9000.9030.901
W.Avg0.9350.9370.935
Table 5. HybridTabNet results on UNLV dataset. W.Avg denotes the weighted-average of the respective measure on the IoU threshold.
IOU ThresholdPrecisionRecallF1-Score
0.50.9260.9620.944
0.60.9140.9490.931
0.70.9140.9490.931
0.80.9020.9360.919
0.90.7920.8220.807
W.Avg0.8820.9150.898
Table 6. Comparison of HybridTabNet on f1-scores with previous state-of-the-art methods. Our proposed method achieved state-of-the-art performance on every dataset except ICDAR-2017-POD. W.Avg denotes the weighted-average of the respective measure on the IoU threshold.
DatasetMethodIOUW.Avg
0.50.60.70.80.9
ICDAR-2019-TrackA-ModernTableRadar [63]0.9690.9570.9510.8970.940
NLPR-PAL [63]0.9790.9660.9390.8500.927
Cascade-TabNet [8]0.9430.9340.9250.9010.901
Ours0.9530.9420.9330.9270.9010.928
ICDAR-2017-PODFast Detectors [1]0.9210.896
PAL [1]0.9600.951
GOD [12]0.9710.968
DeCNT [7]0.9680.952
Ours0.9360.9360.9360.9330.9230.932
ICDAR-2013Cascade-TabNet [8]1.0
Ours1.0
TableBank (Latex)Cascade-TabNet [8]0.966
Ours0.9800.9800.9780.9710.9340.9661
TableBank (Word)Cascade-TabNet [8]0.949
Ours0.9700.9670.9650.9640.9620.965
TableBank (Both)Cascade-TabNet [8]0.943
Ours0.9740.9720.9700.9670.9490.965
MarmotDeCNT [7]0.895
CDeC-Net [9]0.9520.8400.769
Ours0.9560.9530.9480.9360.9010.935
UNLVGOD [12]0.928
CDeC-Net [9]0.9380.883
Ours0.9440.9310.9310.9190.8070.898
Table 7. The results of our leave one out dataset strategy. HybridTabNet achieved state-of-the-art performance on the Marmot dataset. W.Avg denotes the weighted-average of the respective measure on the IoU threshold.
Train DatasetTest DatasetIOUW.Avg
0.50.60.70.80.9
UNLV + ICDAR-2013
+ TableBank (Both) + Marmot
+ ICDAR-2017-POD
ICDAR-2019-Modern0.8230.8080.7870.7670.7060.770
ICDAR-2019-TrackA-Modern + UNLV
+ TableBank (Both) + Marmot
+ ICDAR-2013
ICDAR-2017-POD0.8950.8900.8840.8460.8130.860
ICDAR-2019-TrackA-Modern + UNLV
+ TableBank (Both) + Marmot
+ ICDAR-2017-POD
ICDAR-20130.8250.8250.7880.7670.6190.751
ICDAR-2019-TrackA-Modern + UNLV
+ TableBank (Word) + Marmot
+ ICDAR-2017-POD + ICDAR-2013
TableBank(Latex)0.9510.9470.9440.9330.8660.923
ICDAR-2019-TrackA-Modern + UNLV
+ TableBank (Latex) + Marmot
+ ICDAR-2017-POD + ICDAR-2013
TableBank(Word)0.9320.9260.9220.9170.9060.919
ICDAR-2019-TrackA-Modern + UNLV
+ Marmot + ICDAR-2017-POD
+ ICDAR-2013
TableBank(Both)0.9490.9430.9400.9320.8860.926
ICDAR-2019-TrackA-Modern + UNLV
+ TableBank (Both) + UNLV
+ ICDAR-2017-POD
Marmot0.9620.9600.9560.9490.9290.949
ICDAR-2017-POD + Marmot
+ TableBank (Both) + ICDAR-2013
+ ICDAR-2019-TrackA-Modern
UNLV0.8080.7870.7660.7110.5030.898
Publisher’s Note: MDPI stays neutral with regard to jurisdictional claims in published maps and institutional affiliations.

