Article

Adsorption Method for the Remediation of Brilliant Green Dye Using Halloysite Nanotube: Isotherm, Kinetic and Modeling Studies

by
Shareefraza J. Ukkund
1,2,
Prasad Puthiyillam
1,
Hashim M. Alshehri
3,
Marjan Goodarzi
3,4,
Syed Noeman Taqui
5,
Ali E. Anqi
6,
Mohammad Reza Safaei
7,8,*,
Masood Ashraf Ali
9,
Usman Taqui Syed
10,
Rayees Afzal Mir
11,
Ashraf Elfasakhany
12,
Emad M. Eed
13,
Md Irfanul Haque Siddiqui
14,
Imran Mokashi
15 and
Manzoore Elahi M. Soudagar
16
1
Department of Nano-Biotechnology, College of Engineering and Technology, Srinivas University, Mangalore 574146, India
2
Department of Nano Technology, Srinivas Institute of Technology, Mangalore 574143, India
3
Department of Mathematics, Faculty of Science, King Abdulaziz University, Jeddah 21521, Saudi Arabia
4
Mechanical Engineering Department, Lamar University, Beaumont, TX 77706, USA
5
CSIR-Central Food Technological Research Institute, Mysore 570020, India
6
Department of Mechanical Engineering, College of Engineering, King Khalid University, Abha 61421, Saudi Arabia
7
Department of Mechanical Engineering, Florida International University, Miami, FL 33174, USA
8
Department of Medical Research, China Medical University Hospital, China Medical University, Taichung 40402, Taiwan
9
Department of Mechanical Engineering, College of Engineering, Prince Sattam Bin Abdulaziz University, Al Kharj 16273, Saudi Arabia
10
LAQV-REQUIMTE, Department of Chemistry, Faculty of Science and Technology, NOVA University of Lisbon, 2829-516 Caparica, Portugal
11
Glocal School of Agricultural Science, Glocal University, Mirzapur Pole, Saharanpur 247121, India
12
Mechanical Engineering Department, College of Engineering, Taif University, P.O. Box 11099, Taif 21944, Saudi Arabia
13
Department of Clinical Laboratory Sciences, College of Applied Medical Sciences, Taif University, P.O. Box 11099, Taif 21944, Saudi Arabia
14
Department of Mechanical Engineering, College of Engineering, King Saud University, Riyadh 11451, Saudi Arabia
15
Department of Mechanical Engineering, Bearys Institute of Technology, Visvesvaraya Technological University, Mangaluru 575001, India
16
Department of Mechanical Engineering, School of Technology, Glocal University, Delhi-Yamunotri Marg, SH-57, Mirzapur Pole, Saharanpur 247121, India
*
Author to whom correspondence should be addressed.
Appl. Sci. 2021, 11(17), 8088; https://doi.org/10.3390/app11178088
Submission received: 21 July 2021 / Revised: 25 August 2021 / Accepted: 25 August 2021 / Published: 31 August 2021
(This article belongs to the Special Issue Characterizations of Three-Dimensional Surfaces at Micro/Nanoscale)

Abstract

:
The first-ever use of halloysite nanotube (HNT), a relatively low-cost nanomaterial abundantly available with minor toxicity for removing brilliant green dye from aqueous media, is reported. The factors affecting adsorption were studied by assessing the adsorption capacity, kinetics, and equilibrium thermodynamic properties. All the experiments were designed at a pH level of around 7. The Redlich-Peterson isotherm model fits best amongst the nine isotherm models studied. The kinetic studies data confirmed a pseudo model of the second order. Robotic investigations propose a rate-controlling advance being overwhelmed by intraparticle dispersion. The adsorbent features were interpreted using infrared spectroscopy and electron microscopy. Process optimization was carried out using Response Surface Methodology (RSM) through a dual section Fractional Factorial Experimental Design to contemplate the impact of boundaries on the course of adsorption. The examination of fluctuation (ANOVA) was utilized to consider the joined impact of the boundaries. The possibilities of the use of dye adsorbing HNT (“sludge”) for the fabrication of the composites using plastic waste are suggested.

1. Introduction

The global sustainable fabrics market report mentions a compound annual growth rate of 11.4%, valued at USD 58.3 billion [1]. However, manufacturing textures by material enterprises appallingly affect the climate because of the tremendous exhaustion of engineered colors; most of them increment BOD and COD., disable photosynthesis, upset plant development, give hard-headedness, and advance the cancer-causing nature and mutagenicity [2]. Additionally, unquenchable water utilization hurrying by trillions of gallons for every annum and a lot of handled color effluents containing a large number of huge loads of unconsumed colors represent a critical danger to nature and the climate [3,4]. Notwithstanding the rigid guidelines forced on the material ventures in wastewater treatment, the results have been horrifyingly baffling [5,6]. One of the essential reasons is the shortfall of an economical remediation strategy technique and the methodology for eliminating poisonous colors.
Supportability as a framework resolves financial matters, climate, and, thus, social concerns [7]. The various techniques and methods reported in the literature may be broadly classified into four types—namely, biological [8,9], chemical [10,11,12], physicochemical [13,14], and physical methods [15,16,17]. The methods described above have severe limitations: the time of completion of the remediation process, the cost of the technique and/or method; the fall-out of chemical, electrochemical, and photochemical degradation processes, resulting in toxic substances [18]. Besides, one of the major problems associated with all the reported techniques is the disposal of sludge.
Adsorption as a technique addresses many of the problems described above with substantial answers for the remediation of colors from modern effluents [19]. Notwithstanding, this technique also falls short of the disposal of “sludge” produced after the adsorption of the adsorbate onto the adsorbent. Hence, address the issue to give an amicable answer for ooze removal [20]. One of the options is to utilize an inorganic class of adsorbents which will affect less the climate and environment [21].
The textile industry requires an enormous quantity of adsorbent for the process of remediation of dyes and allied materials for the treatment of effluents. Thus, the adsorbent must have the following characteristics: availability in abundance, cost-effective, environmentally friendly, prepared to use with no pretreatment, and ought to have a pore structure. The latter assumes importance, as the adsorption technique is a physical method and requires an enormous surface region for the cooperation of the adsorbent with the adsorbate [22].
Halloysite nanotube (HNT) as an adsorbent qualifies as a candidate to meet the above requirements. Moreover, the tubular structure of HNT with different chemistries inside the pore and on the surface suits our present study. Additionally, HNT has been extensively used as filler material providing strength to the composites fabricated [23]. This information helps us to address the issue of disposal of the sludge as a reinforcement material.
Brilliant green (B.G.) is the triarylmethane class of dyes. It is widely utilized in the paper industry to dye wool, biological staining, and dermatological agents. However, it is a hazardous contaminant that causes diarrhea, eye irritation, nausea, and vomiting [24]. Besides, scant literature is available to remove the triarylmethane class of compounds using HNT [25]. There are about a dozen research articles described in review studies relevant to imbibing inorganic materials. However, none of the papers have used nanomaterials and addressed the adsorption of brilliant green dye.
The present research work is oriented towards the experimental optimization of the state of the features influencing the process of adsorption, model studies for better understanding, and carry out RSM studies based on a fractional factorial experimental design (FFED) for possible commercialization. Lastly, the novelty of this work lies in the amalgamation of the experimental studies of the brilliant green dye remediation with halloysite nanotubes and the detailed modeling studies, including the isotherm, kinetic, thermodynamic, mechanistic, and process optimization.

2. Constituent and Process Sequence

2.1. Constituents

Halloysite nanotubes (H.N.T.) and brilliant green (B.G.) dye were obtained from Aldrich, Delhi, India. The dye was commonly referred to as Emerald Green. C.I. = 42,040, CAS registry number = 633-03-4, chemical formula = C27H33N2HO4S, and molecular weight = 482.64. λmax was 625 nm. Figure 1 is a schematic of the BG atomic design.

2.2. Parametric Influence of BG on HNT

The influential test variables (pH grade of solution, concentration of BG initially, adsorbent quantity, and thermal changes) were considered utilizing group tests. For preparing the stock solution of BG (1000 mgL−1), water distilled twice was utilized. This was used to prepare concentrations of 25–200 mgL−1. To numerous 250-mL Erlenmeyer flasks, 50 mL of prepared solution and a calculated quantity of HNT was added. Parametric variations included for evaluation were, pH (2, 4, 6, 7, 8, 10, and 12); BG concentration in beginning (25–200 mgL−1), and adsorbent amount (0.5–6 gL−1). Thermal influence on process of adsorption was investigated for three temperatures were selected with an underlying color centralization of 100 mgL−1. Test solution under static thermal conditions was stirred for 180 min at a rotational speed of 165 rpm in an orbital shaker. BG color not adsorbed by HNT was separated by subjection to high-speed centrifuging (3000 rpm) for a duration of 5 min. Centrifugation is reprocessed for 5-min durations till a clear solution is obtained. The equilibrium concentration centrifuged solution was not set in stone utilizing a Perkin-Elmer Lambda EZ-201 UV-vis spectrometer. To consider the impact in the scope of pH 2–12 the group tests were performed. To achieve the desired pH grade, 0.01–1 M HCl or NaOH was utilized. Solution concentration (100 mgL−1), kinetics were investigated at 303 K, 313 K and 323 K at time-variant conditions. Analyses were recreated threefold, and the mean qualities are considered.

2.3. Characterization Methods

IR spectra were recorded using the FTIR spectrophotometer (Perkin Elmer 3 lambda). A JEOL model 3300 scanning electron microscope was used to record SEM images. A pH meter Model 802-Systronics, India, was used to measure the pH.

2.4. Statistical Optimization of the Process Parameters

An experimental design [26] for optimizing five process parameters at two levels, as mentioned in Table 1, was prepared for the BG-HNT system to obtain a quadratic regression equation using the ANOVA model.

3. Test Data Analysis

3.1. HNT/BG-HNT Surface Syntesis

Analyses of SEM Images and FTIR Spectrum

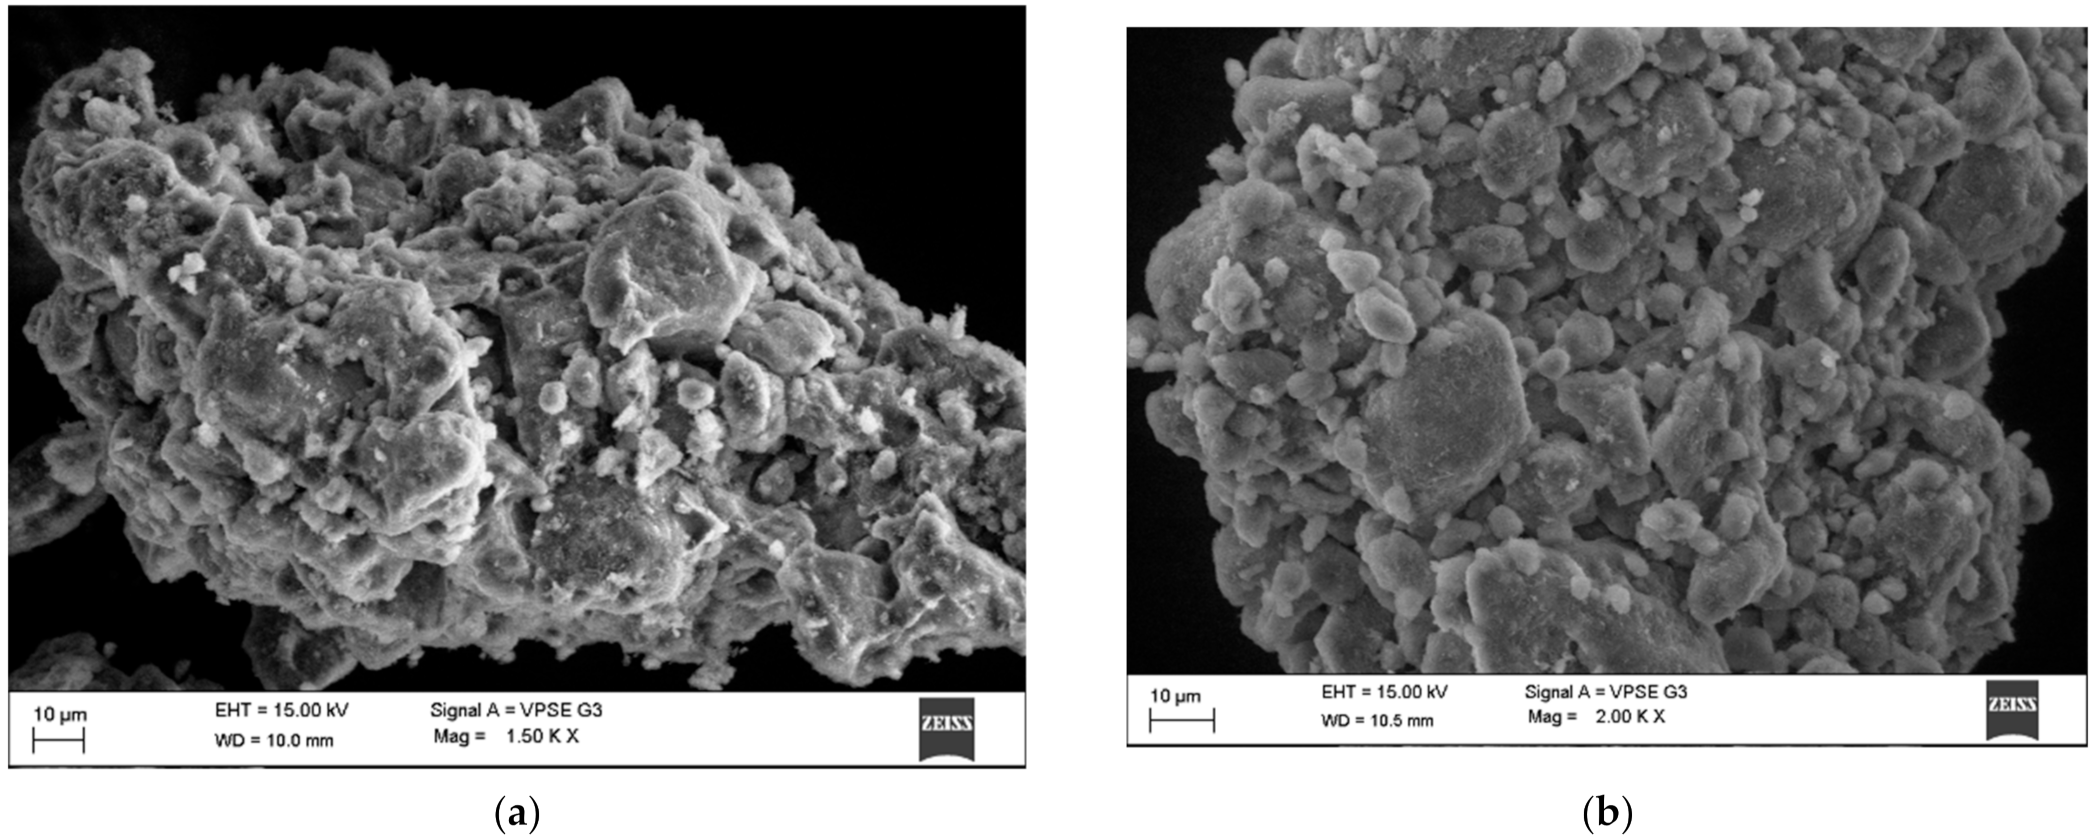
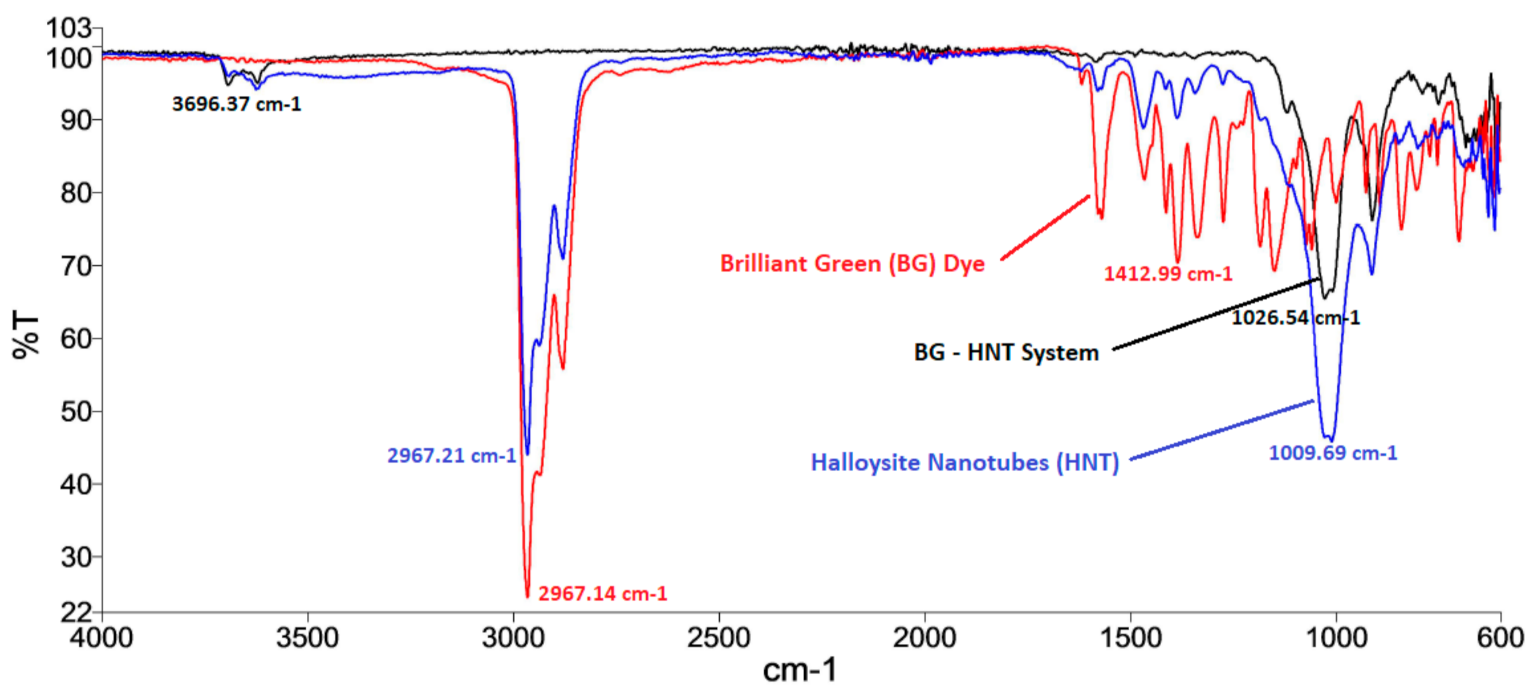
SEM images showing HNT and HNT with BG dye adsorbed are shown in Figure 2a,b. The dye adsorption onto the HNT surface can be depicted from these pictures. The pores in HNT texture resembles a honeycomb shape. The substrate adherence to the adsorbent is enhanced by this surface structure. Figure 2b affirms the adsorption of the color on the outside of HNT as the pores appear to be filled. The FTIR spectra for BG dye (Figure 3) exhibit distinctive peaks at 3500 and 3200, and 3100 cm−1 refers to N-H and CH-aromatic elongation caused by periodic disturbances. The maximum vibration noticed at 1700/cm recognizes S=O of the sulphites group in dyed structures. The triplet peaks exist in the spectrum between 1620, 1590, and 1480/cm and C=C, related to the aromatic ring, which couples with N=N of the azo group in the dye structure. The multiple peaks that appear at 1460–1337/cm are orient by bowing, a periodic vibrational motion relevant to N-H and CH individually. Other than the range of the halloysite, 3660/cm addresses the extending movement on the inward surface OH gatherings, and 1010/cm handles the extension of Si-O. The inward surface -OH bunches concerned the aluminum-focused sheets of octahedral stature and hydrogen-oxygen bonding in a bilayer structure.
The FTIR spectrum showing complex BG-HNT in Figure 3 displays a significant change in the vibration modes compared to pure BG. It is noticed that the vibrational peaks at 3500–3200 cm−1, which are referred to as the -OH and -NH groups in BG dye, tend to vanish. This indicates HNT’s strong interactions with functional groups and modifies the morphology of the structure of the dyes in BG-HNT. Similar behaviors can also be witnessed at 3000 cm−1, 1600–1450 cm−1 and 1260–1030 cm−1, confirming that HNT has high adsorption and good interaction with BG dye.

3.2. Parametric Impact

3.2.1. pH Effect

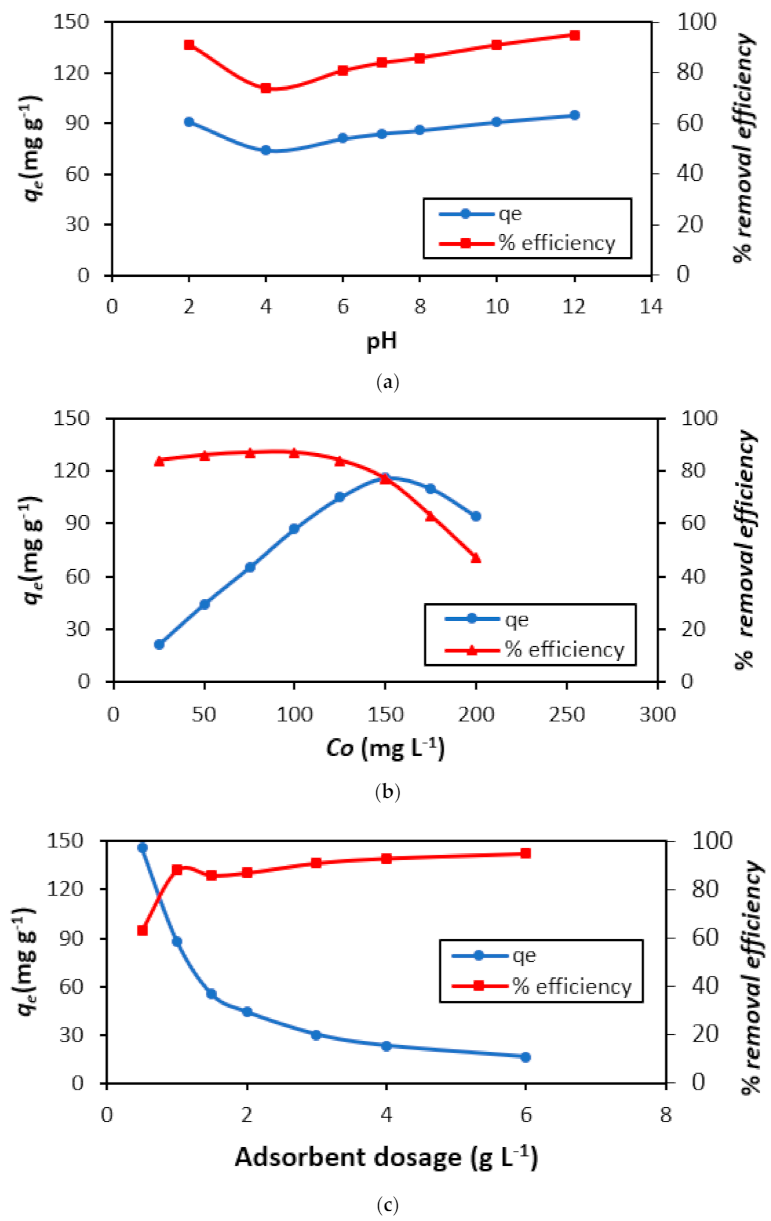
HNT adsorption upon pH arrangement. It influences the process as follows: it primarily affects surface features of the adsorbent and, secondly, BG chemical alterations [28]. The efficient utilization of selected adsorbents is exclusively influenced by pH. It is thus critical to have a thorough understanding of pH effect when commercialization of the process is desired [29]. The shape of the curve displaced in Figure 4a was consistent with the expected chemistry. The principal constituents of HNT are the oxides of aluminum and silicon. These oxides display different ionization properties and surface charges due to different zeta potentials when kept in contact with water [30]. The external surface of HNT showed negative charges due to silica above pH values of 2. Accordingly, the adsorption capacity of cationic BG dye decreased from pH 2 to 4. The pH has a profound influence on BG’s structure and its characteristic feature as a cationic dye. Thus, with an increase in the pH, the BG dye loses its positive charge and also changes its color. A marginal rise in qe from pH 6 to 12 is attributed to the positive charges of alumina in neutral and alkaline media, which attract the possibly negatively charged BG dye.

3.2.2. Initial BG Dye Concentration

Initial color focus affects the adsorption limit of H.N.T. This is manifested in the results displayed in Figure 4b. The shape of the curve suggests that the percent removal capacity of the adsorbate (B.G.) by the absorbent (H.N.T.) remains almost constant within 25–100 mgL−1 and diminishes with an increment in the concentrations, as is observed in most cases [31].

3.2.3. Quantity of Adsorbent

Measurements as a boundary will significantly impact the commercialization of the cycle since it chooses monetary achievability [27]. The expulsion of BG color from the arrangement diminishes the following adsorbent enhancement up to 6.00 gL−1. Then again, it was observed that the percent of BG color evacuation expanded pointedly with an increment in adsorbent measurements from 0.50 to 1.00 g L−1. From that point forward, minute expansion in the efficiency of eradication was observed (Figure 4c). Observations were made from a process commercialization perspective. Several attempts using minimum adsorbent quantity extensively improvised adsorbent dye removal efficiency.

3.2.4. Thermal Influence

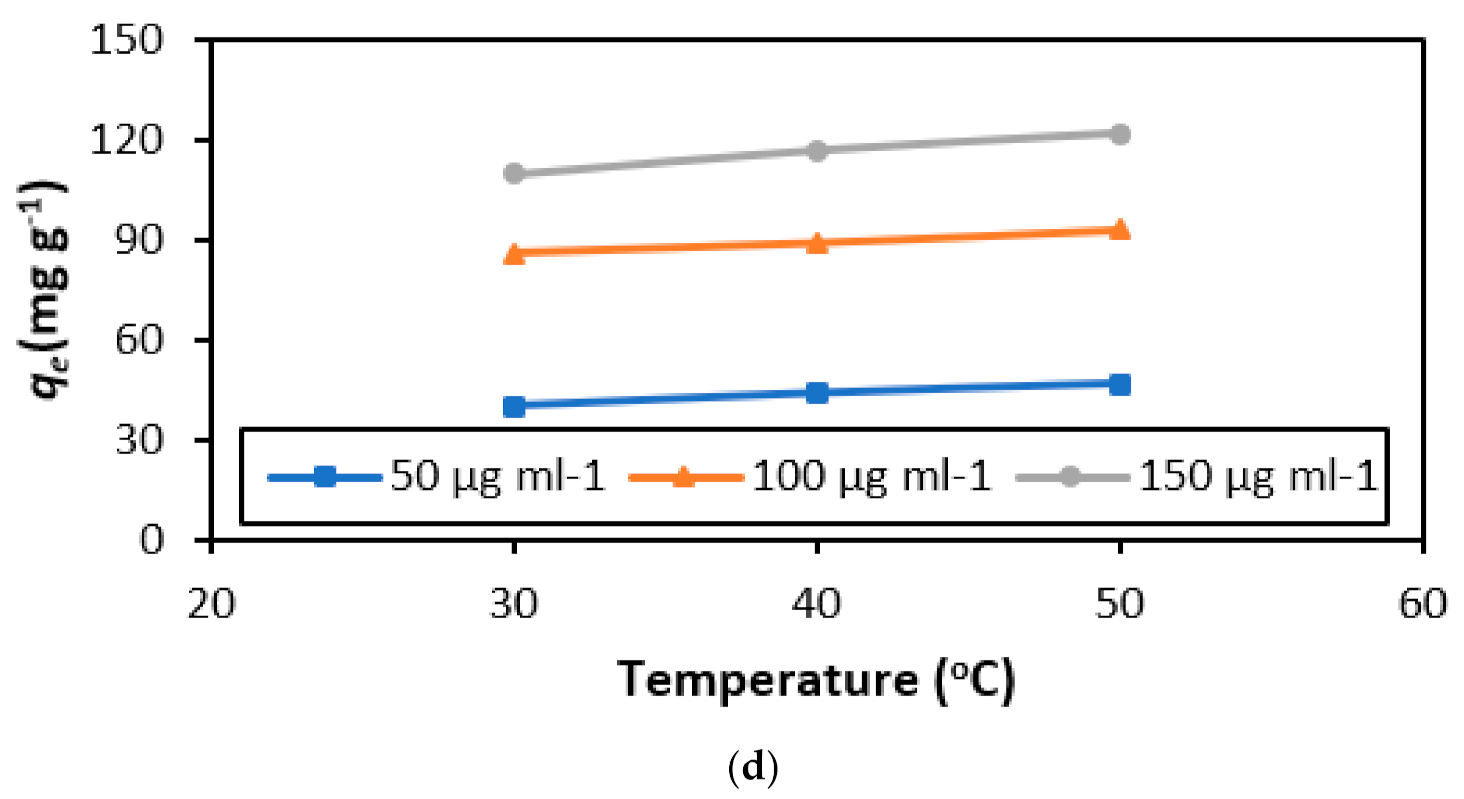
Process thermal evaluation distinctly motivated for commercial applications was considered when utilizing Table 1. The impact of temperature on BG dye adsorption onto HNT are presented in Figure 4d. The test readings relevant to thermodynamic parameters—ΔG°, ΔH°, and ΔS° reveal the reaction features. Indicatively, the negative ΔH° (enthalpy change) for selected temperatures specify exothermic interaction. Negative ΔG° (free energy change) affirm the suddenness and suitability of the adsorption interaction. The magnitude of ΔG° projects fasts and extensive adsorption at low thermal conditions. Further, it was inferred that the negative values of ΔS° (entropy) suggest minimum changes in the internal structure of HNT. A similar observation has been reported elsewhere [32].

3.3. Adsorption Isotherms-Modeling Analysis

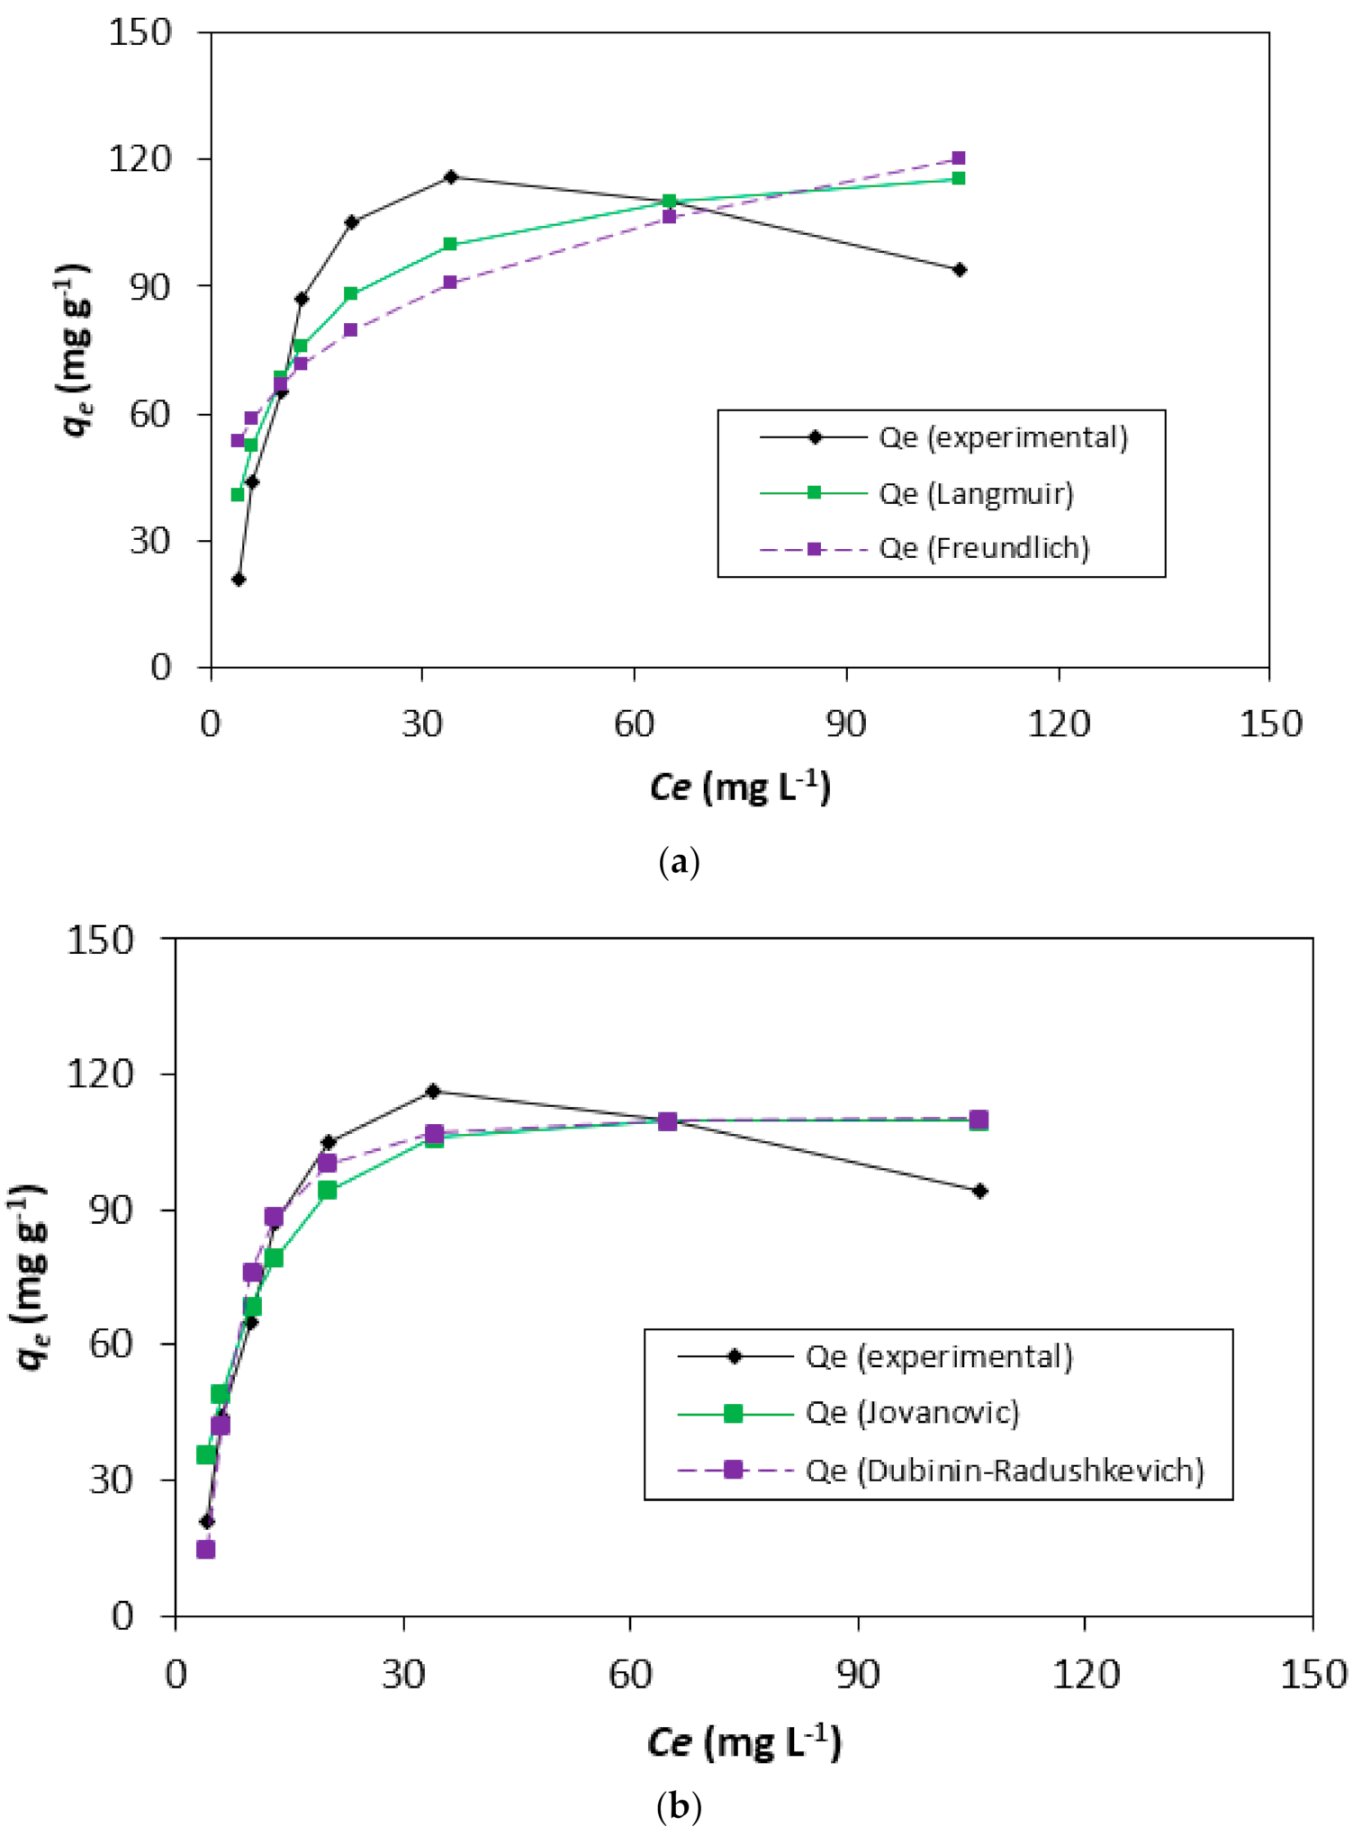
The study of the isotherm models wereintended to provide a view of the efficiency of HNT for the remediation of the dye for commercial applications. With a focus on the degree of economic advantages. The adsorption of BG dye onto HNT was evaluated employing the isotherm models of adsorption proposed by Langmuir, Freundlich, Jovanovic, Dubinin-Radushkevich Toth, Brouers-Sotolongo, Vieth-Sladek, Radke-Prausnitz, and Redlich-Peterson. The main criteria of the adsorption isotherm study specified the selection of a model, qe (test equilibrium), closely equivalent to Qm (single layer adsorption capacity), coefficient of determination (R2) ≥ 0.9. Data accuracy improvement was imbibed by including error correction factors, SSE and χ2.
Langmuir [33] assumed uniform energy sites available on the adsorbent, with no transverse interactions among molecules. 2D graph (Figure 5a), of Ce (independent variable) and qe (dependent variable), flattening specifies energy locality of the adsorbent surface saturation. This condition resists process continuation and rules out the occurrence of sorption in multilayers. The experimental data, R2 = 0.82, qe = 87.00 mg g−1, and Qm = 124.15 mg g−1 for the BG-HNT system, indicate a close fit to the Langmuir adsorption isotherm model. The separation factor (R.L.) values of 0.039 and 0.247 indicate the favorable adsorption of BG dye onto HNT.
Moreover, the adsorption was considered more favorable if the increase in the initial concentrations decreases the RL value. This is in contradiction to our results displayed in Figure 5a. Additionally, the variances between the Qm and qe values of 124.15 and 87.00 mg g−1, respectively, for HNT has given the impetus to explore other models.
Contrary to the above discussion, Freundlich professed diversity of surface sites with different adsorption energy and demonstrated relevance to multilayer adsorption [34]. nF = 4.060 and 1/nF = 0.246 (Table 2) of HNT indicate that the course of adsorption is physical and suits the behavior of the Langmuir isotherm.
The Jovanovic model [35] attempts to minimize the deviancies of the test results from the Langmuir isotherm model by introducing the exponential term KJ. On comparing the differences in the values of qe = 87.00 mg/g and Qm = 109.71 mg/g with the values obtained by the Langmuir isotherm model, one may surmise that the values obtained in the Jovanovic isotherm were better compared to the Langmuir isotherm model.
The adsorption isotherm empirical model proposed by Dubinin-Radushkevich [36] describes adsorption process through the filling of the pore of the adsorbent. qs = 110.59 mg/g, comparatively with the Langmuir and Jovanovic models, is more (Table 2). Furthermore, a value of 0.97 coefficient of determination (R2) confirms that the adsorption process is linear (Figure 5b).
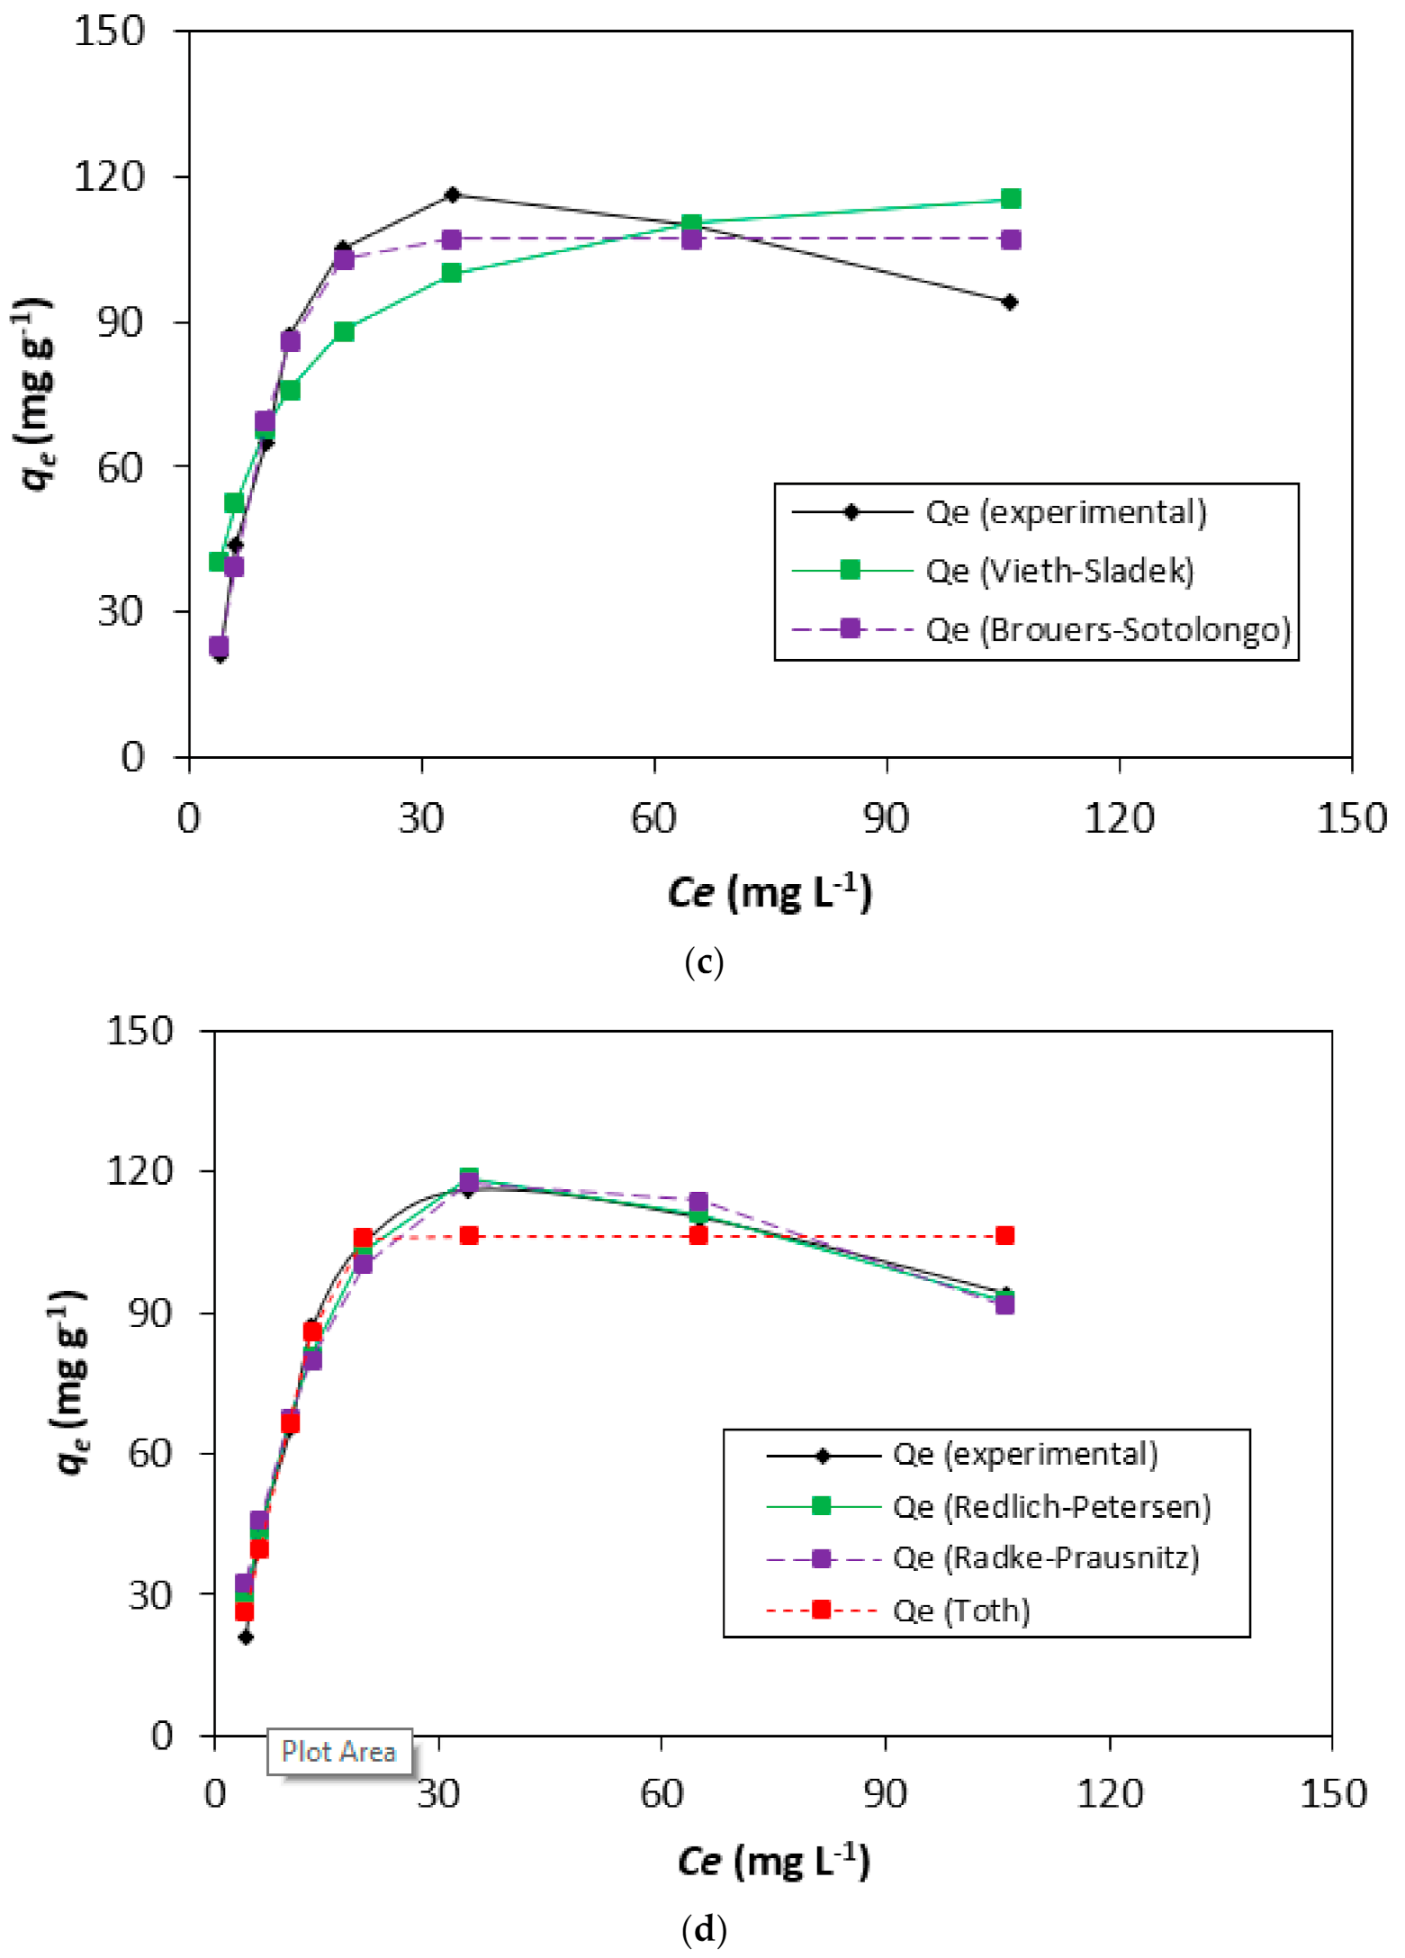
To identify specific model(s) with a smaller gap between experimental qe and Qm values, five isotherm models are Radke-Prausnitz, Vieth-Sladek, Redlich-Peterson, Brouers-Sotolongo, and Toth—were also studied. The importance of these models is described by us elsewhere [37]. To describe the heterogeneous adsorption system, the empirical mathematical equation was developed by Toth [38]. Brouers-Sotolongo isotherm model [39] and the Vieth-Sladek isotherm model [40]. The results are presented in Figure 5c. The isotherm model of Radke-Prausnitz [41]. The Redlich–Peterson isotherm model [42]. Table 2 has a “g” value of 1.638 as the correction exponent, which shows similarity to the Langmuir isotherm (Figure 5d).
The data obtained using five three-factor models are tabulated in Table 2. The study of nine isotherm models and the evaluation of statistical parameters were obtained in Table 3. In brief, the graphs obtained by nine models have the similarity that it contains two parts, viz., a nonlinear part and a plateau. The former indicates that the dye molecule adheres to the active site of the porous H.N.T., and the latter characterizes the saturation of the adsorption process. Considering the values of R2, S.S.E., and χ2, the Redlich-Peterson isotherm model fits best.

3.4. Adsorption Kinetics

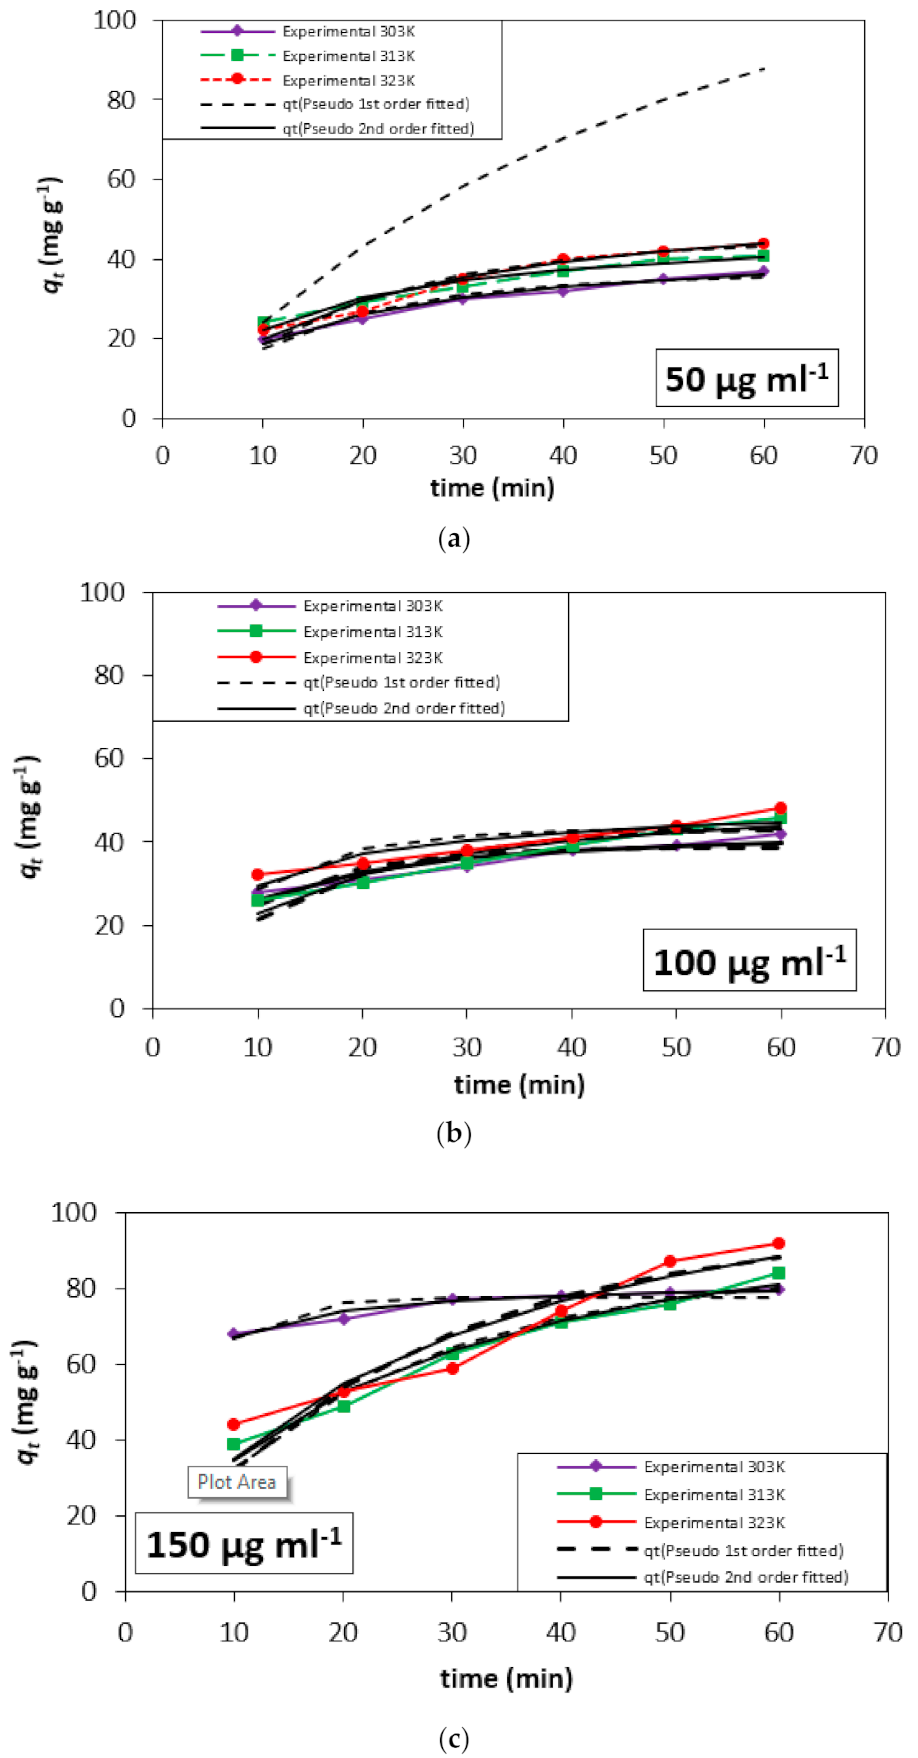
The kinetic models provide an insight into the performance of adsorption of DB15 dye on HNT with time as an independent variable. Therefore, the studies will have a significant impact to scale for commercial applications. To provide the variation in the adsorption rate concentrations of 50, 100, and 150 g mL−1 of BG dye were used to carry out kinetic studies at temperatures of 303 K, 313 K, and 323 K. The output data secured are depicted in Figure 6 and tabulated in Table 4. The kinetic data of the adsorption of BG on minerals were analyzed using pseudo-first-order [43] and pseudo-second-order [44]. The R2 and χ2 values suggest the pseudo-second request model is well-fitted, contrasted with the pseudo-first request for the BG-HNT system.
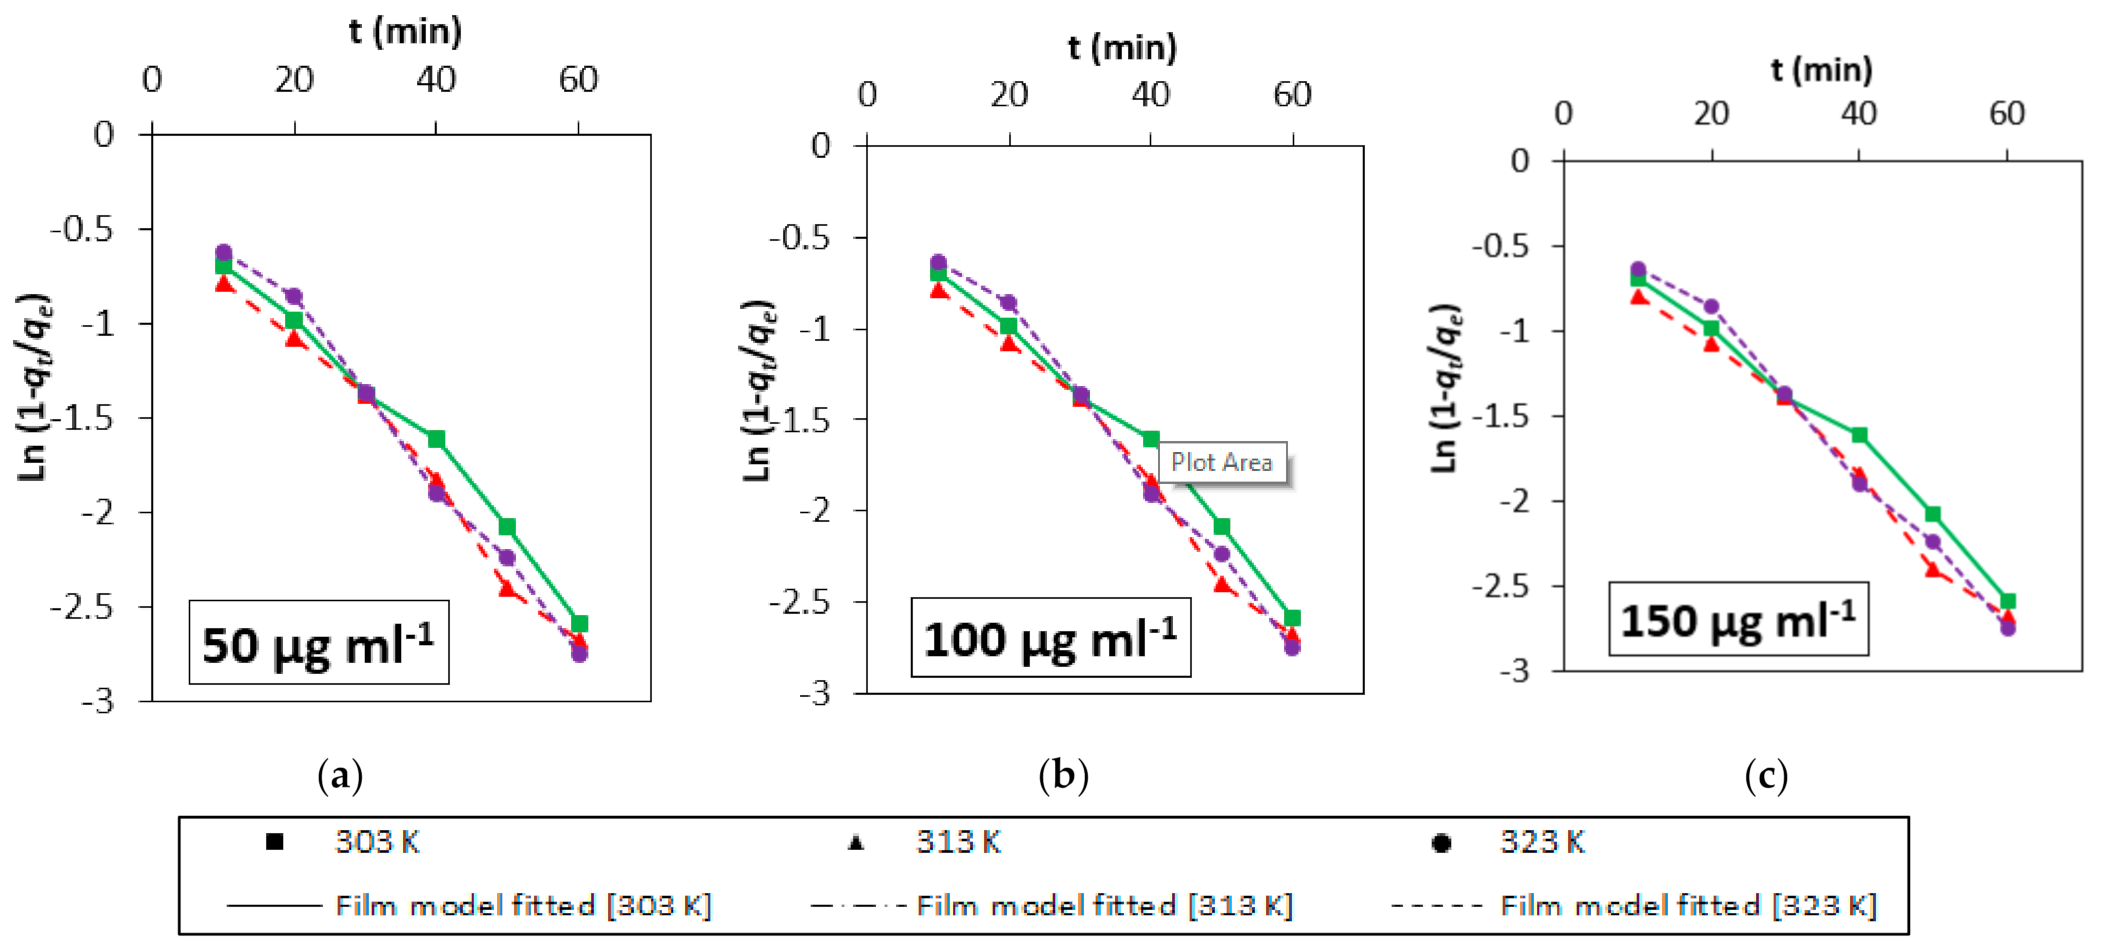
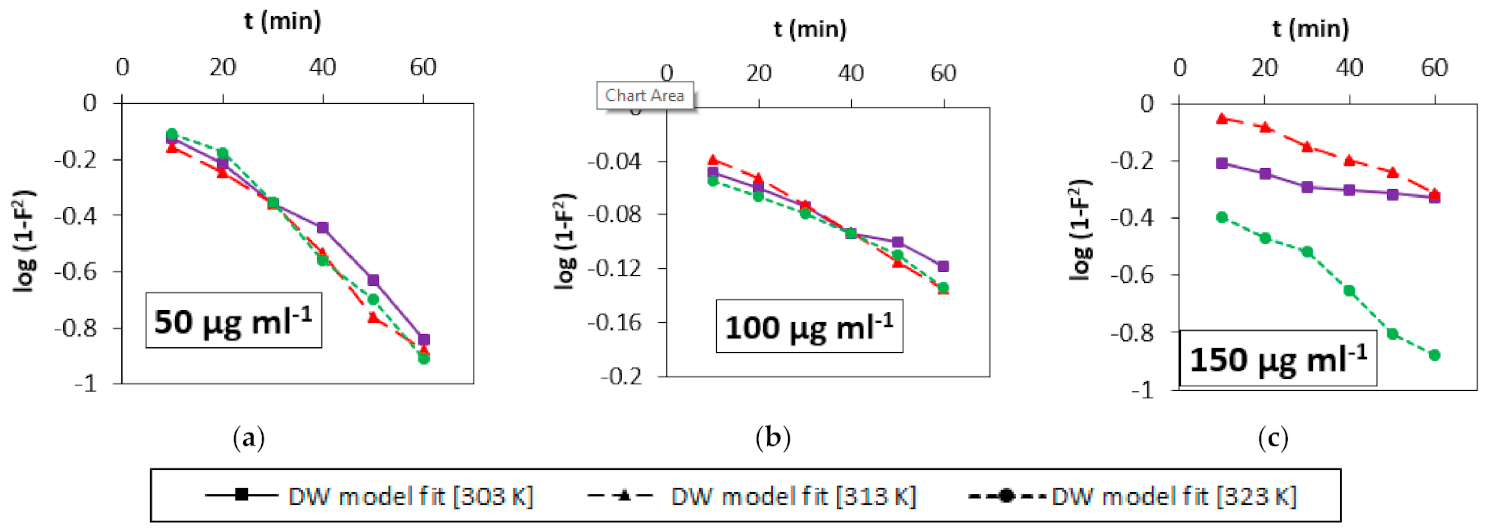
Analysis of the adsorption kinetics data confirmed multiple levels of linearity, which, in turn, suggests multiple mechanisms. Higher concentrations and higher temperatures lead to higher adsorption rates, which lead to different linear routes. However, the process of adsorption gets stabilized over time. This was observed in the film diffusion model [45]. From Figure 7 and Table 5, the diffusion constant values of R′ of a liquid film agree with high R2 values.
Furthermore, the values of R′ infers the fast adsorption of a solute onto the outside of the particles, leaving a flimsy film. The phenomena is retarded to the process of diffusion, which affects the rate of adsorption. This step confirms that the diffusion phenomenon limits the adsorption process.

3.5. Mechanistic Study

Mathematical models of the adsorption response and adsorption dissemination are proposed to recognize the importance of diffusion in the adsorption process of the BG dye onto H.N.T. We resorted to a functional empirical relationship of the uptake of the substrate at a given time qt varying almost proportionally with t1/2. This was done by fitting an intraparticle diffusion model. These results demonstrate that the process of adsorption is not rate-limiting, and the progression of adsorption takes place in multiple steps. Thus, it may be envisaged that the development of BG color particles onto the outside of HNT goes before the dispersion into the pores of H.N.T.
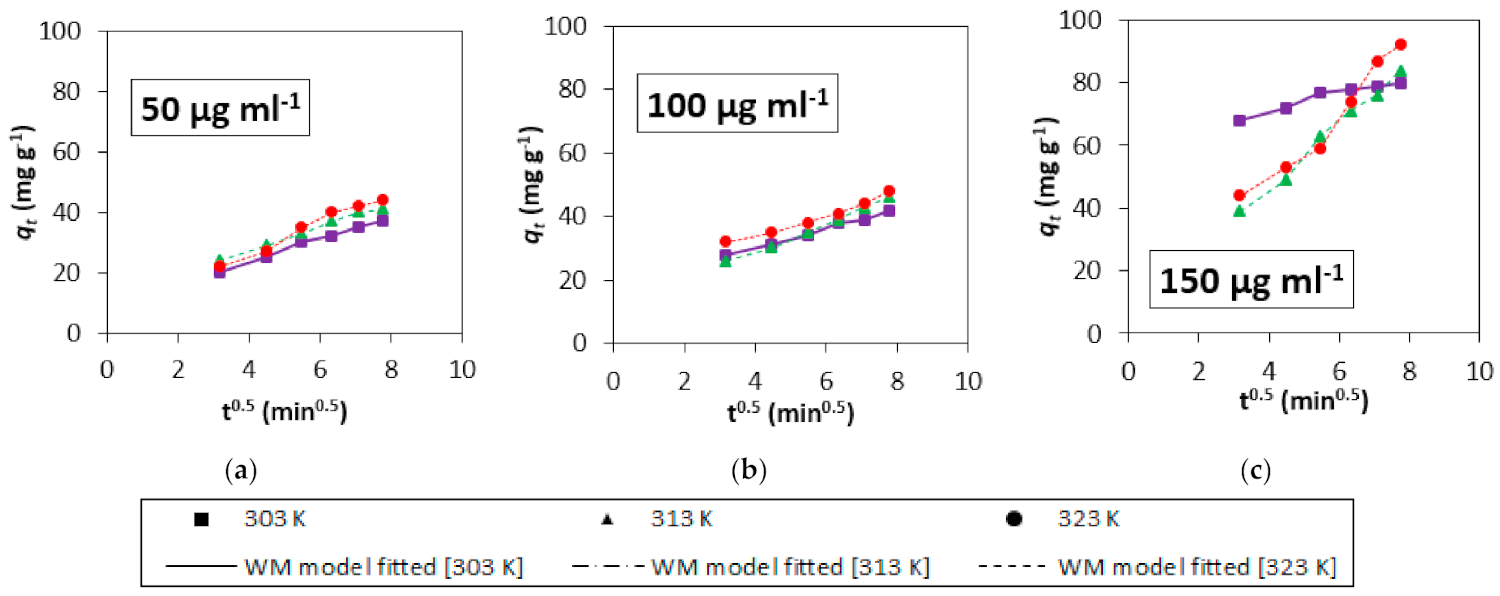
As indicated by the Weber-Morris model [32], the solute take-up fluctuates with the t½. Therefore, a straight line was obtained on plotting qt versus t½. The dissemination rate was consistent determined from a straight line incline, as displayed in Figure 8. From the information, we presumed that intraparticle dispersion is the rate-restricting advance for the course of adsorption of the color on the adsorbent. Henceforth, the qt versus t½ plot should give a straight line whose slant (kint) will be a consistent dissemination rate (Figure 8). In any case, the state of the bend construes that the intraparticle dissemination is not the sole rate-restricting advance. Conversely, the Dumwald-Wagner model [46] calculates the actual absorption rate. The data is presented in Table 5 and Figure 9.

3.6. Thermodynamics of the Adsorption Process

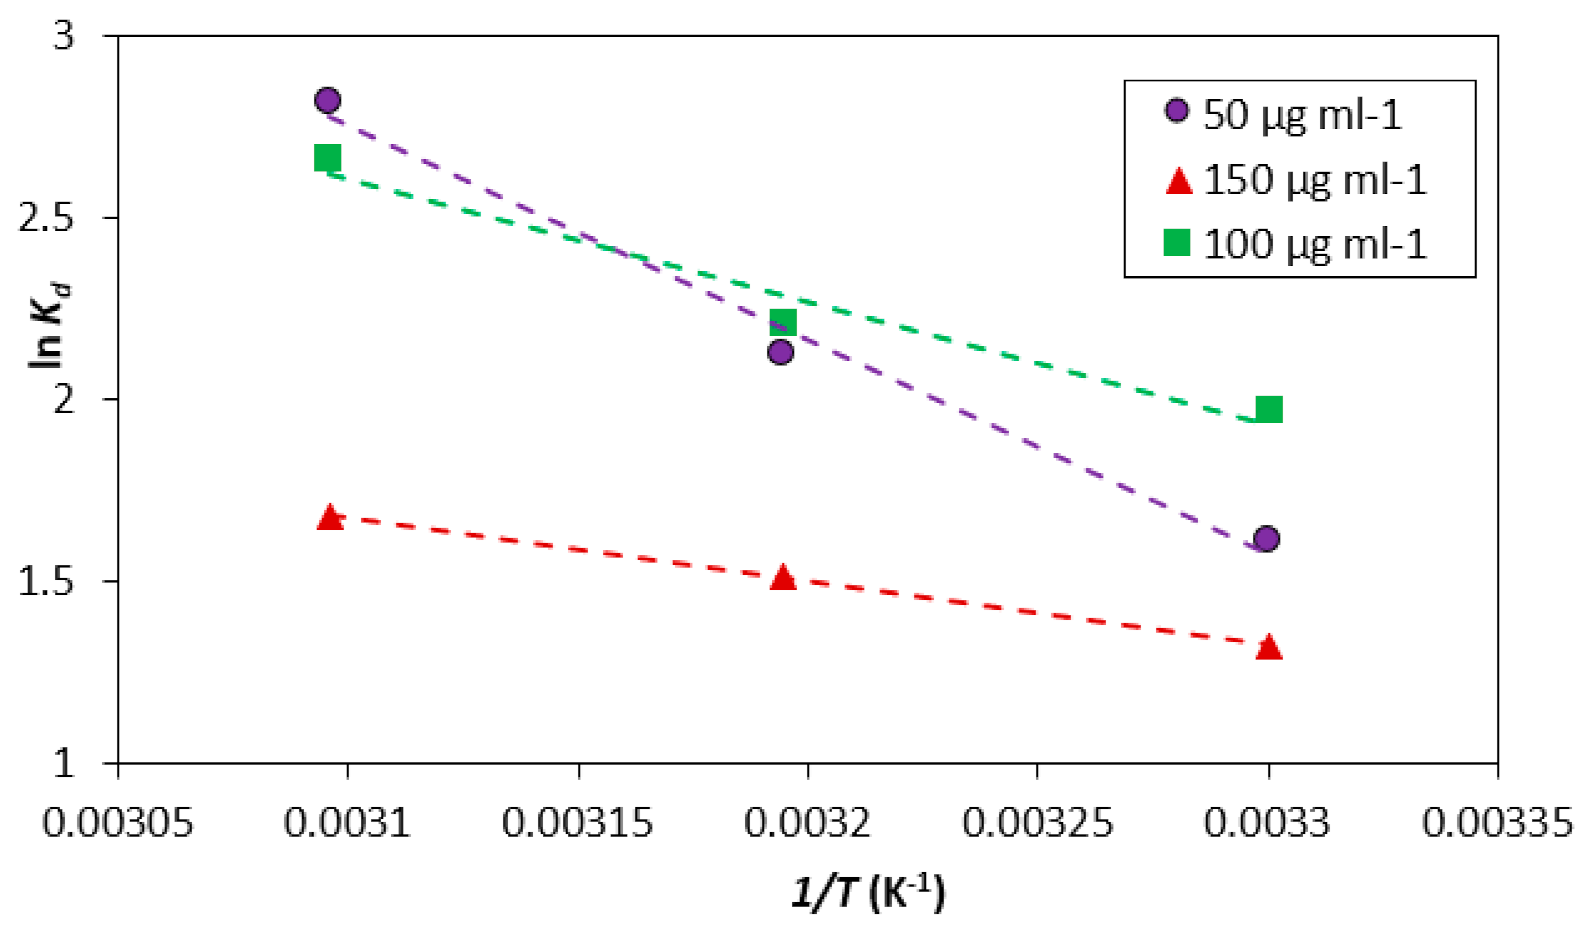
The change in free energy (∆G°) and entropy (∆S°) of the dye HNT system are credited with thermodynamic process design parameters. The thermodynamic parameters presented in Table 6 were summarized through plots of ln (Kd) v/s 1/T shown in Figure 10. ∆G° values suggest that the adsorption process is almost spontaneous. The reduced ∆G°-negative upsides related to thermal enhancement signifies the response is practically unconstrained at a lower temperature. ∆S°-positive readings commemorate the fall in dynamic interaction at the dye/HNT conjugate surface.

3.7. Process Optimization

In recent years, halloysite nanotubes have been widely researched as a “green resource” for their applications as drug carriers, for sustained drug release, and catalysis, to name a few [47,48]. Their function as an adsorptive material [49] is an application of great interest. To optimize the extent of adsorption in HNT for BG remediation statistically, a quadratic model in Fractional Factorial Experimental Design under RSM was used [50]. The following general equation can explain the model.
Y = β 0 + β i X i + β i i X 2 + β i j X i X j
where Y addresses the reliant reaction variable, β0 is a relapse coefficient, βi is the direct impact, βii is the squared impact, and βij is the collaboration impact of autonomous variable X. Plan master (7.0.0), measurable programming was utilized for RSM study and graphical portrayal (3D and shape plots) for the impact of the free factors on the reaction [51,52,53,54,55,56]. The quadratic regression equation derived from ANOVA shows the possible individual and combined effect of the factors for the BG-HNT system (Table 7) [57,58]. The p-esteem < 0.05% with 95% certainty span was considered huge.
The regression Equation obtained for the BG-HNT system is shown below:
BG HNT   System = 4.2 + 26.1 × A + 1.4 × B + 37.1 × C 40.9 × D 10.2 × E + 3.2 × AB + 11.4 × AC 0.4 × BC 11.3 × A 2 + 3.3 × B 2 + 8.3 × C 2 + 46.5 × D 2 + 16.8 × E 2
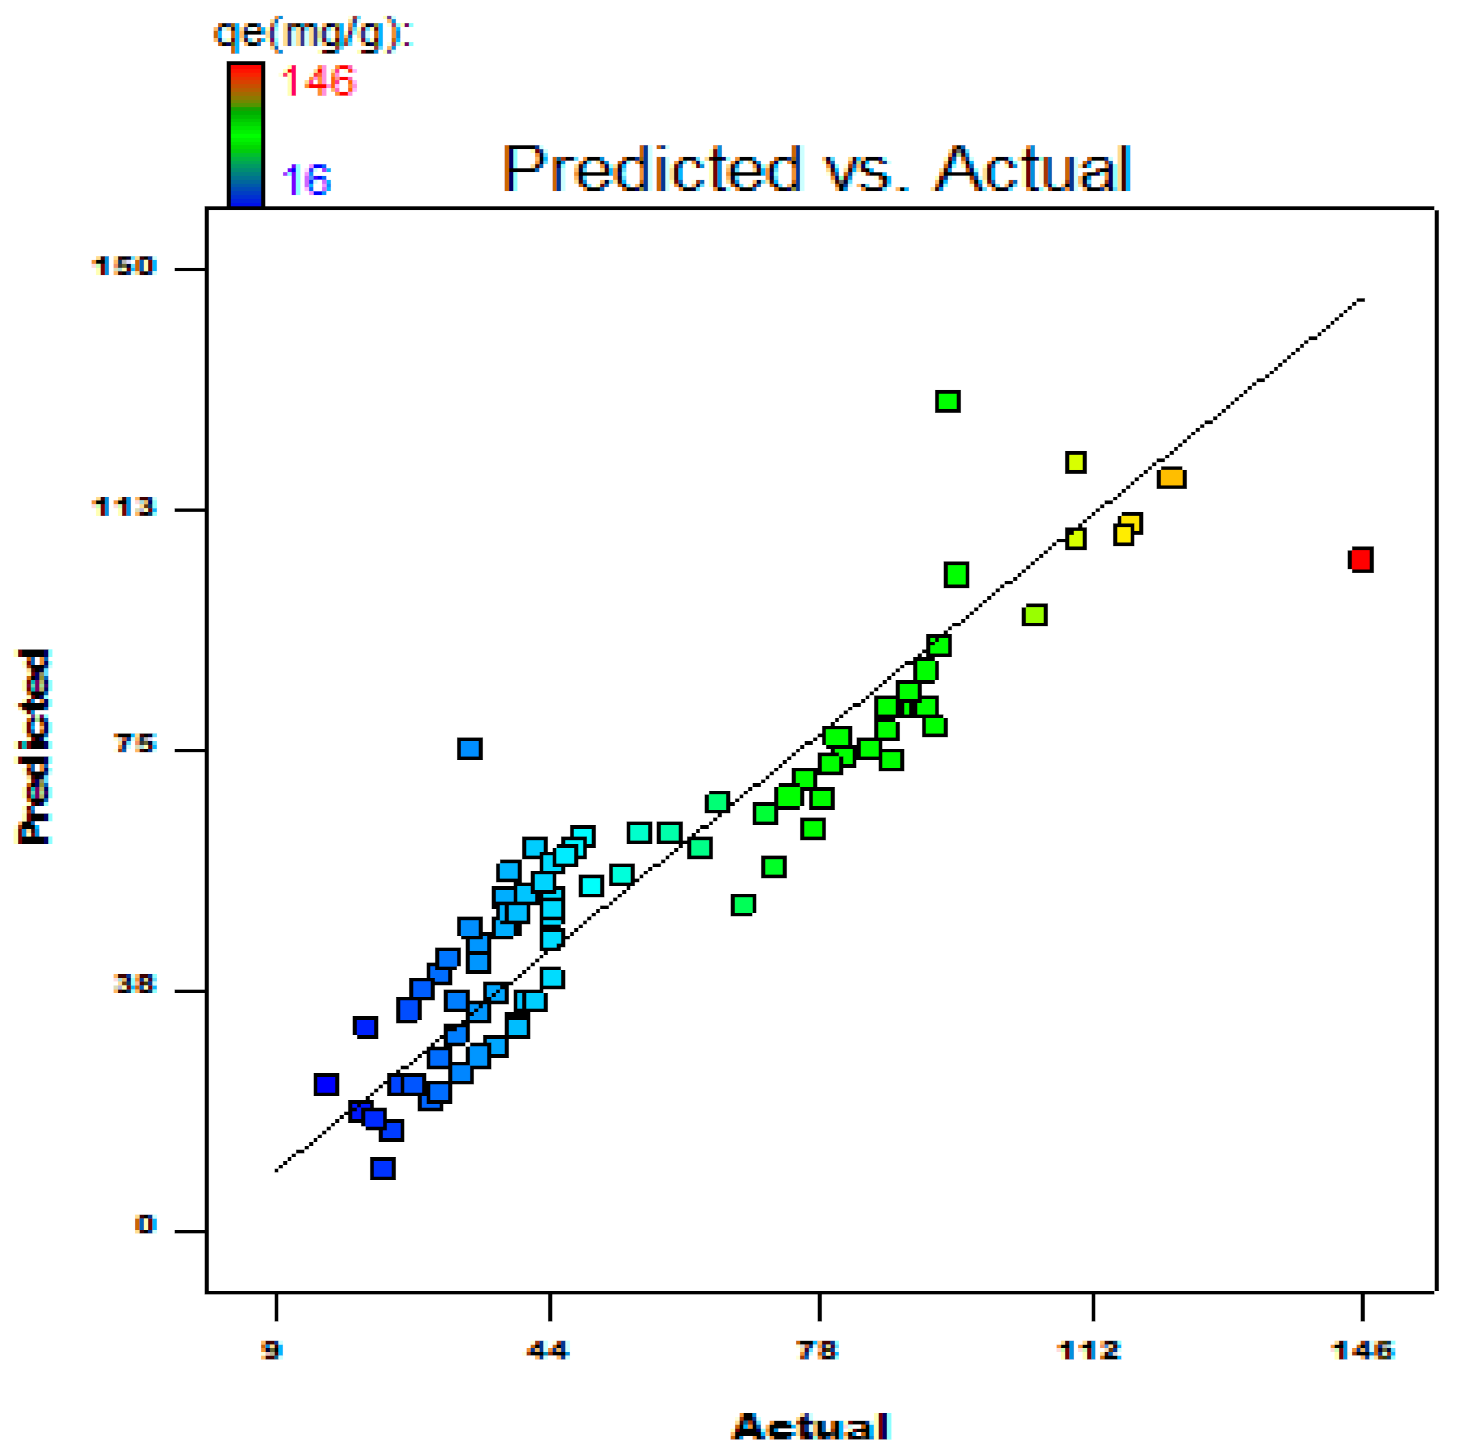
In this examination A, C, D, AC, A2, and D2 are significant factors, and the other variables are inconsequential. Cross-items AD, AE, BD, BE, BF, CD, CE, CF, DE, DF, and EF are zero and, thus, are avoided to build the previously mentioned relapse condition. The RSM format is exceptionally critical concerning the F-value model of 30.12. The examination diagram for real versus anticipated qualities (Figure 11) demonstrate a solid connection between the experimental and anticipated reactions.
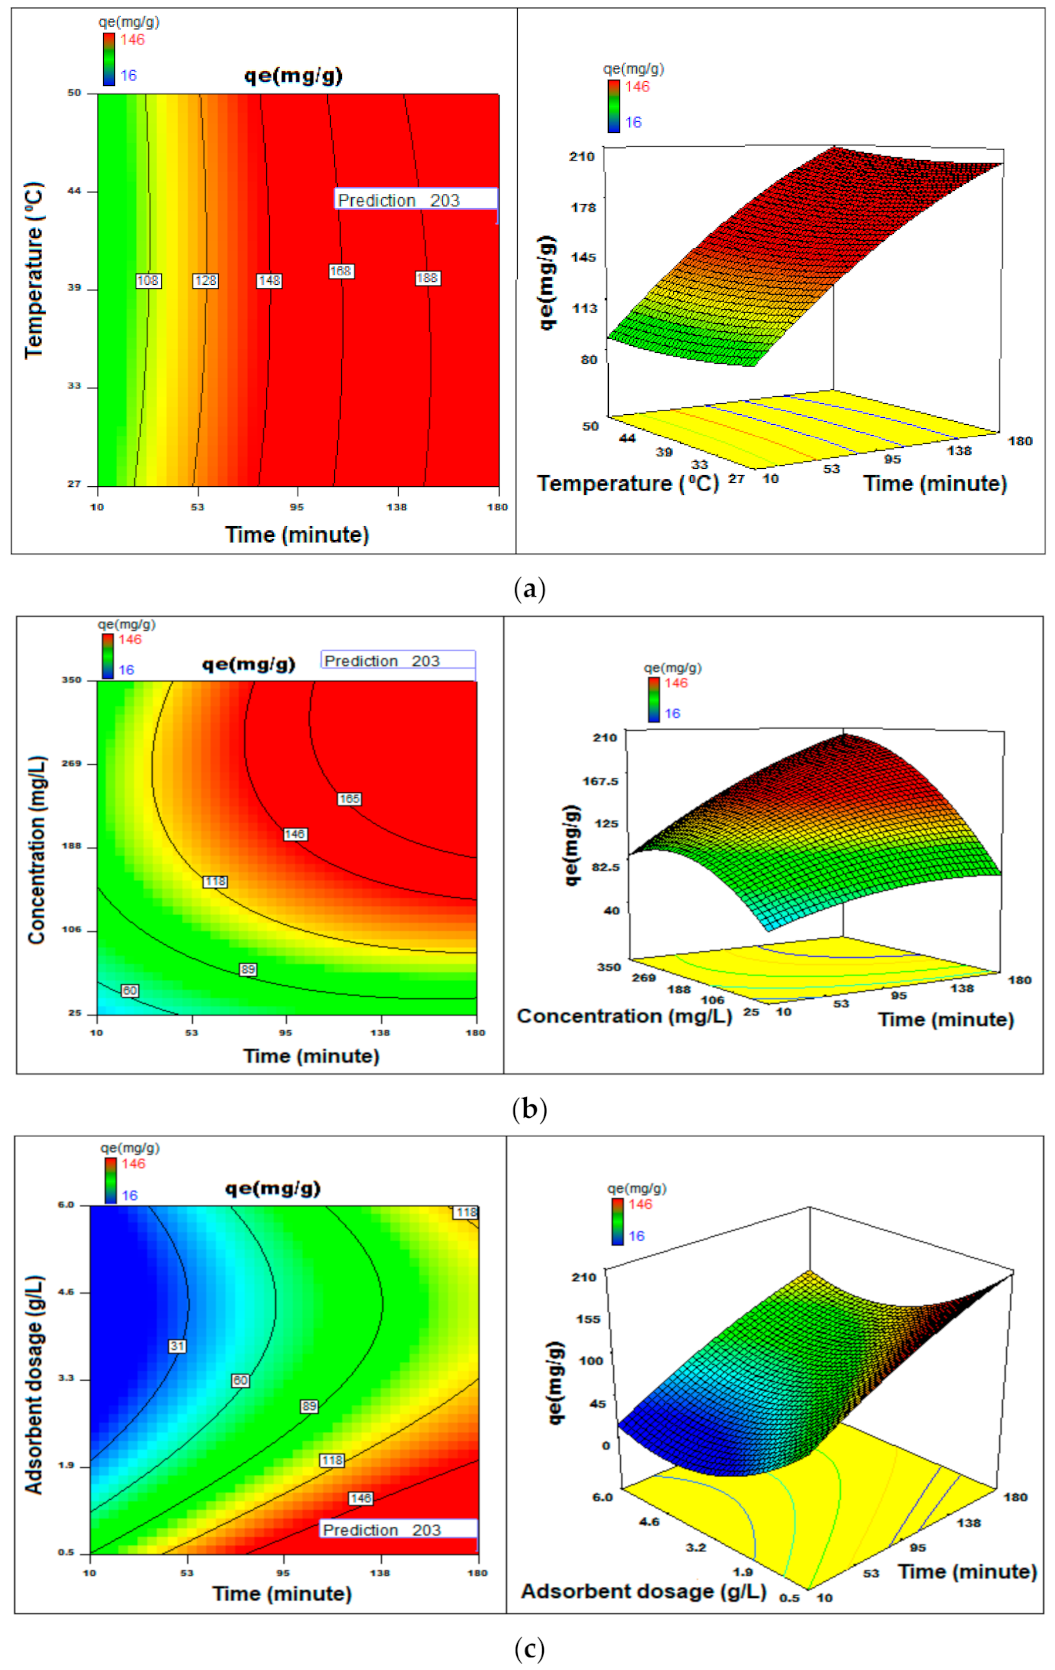
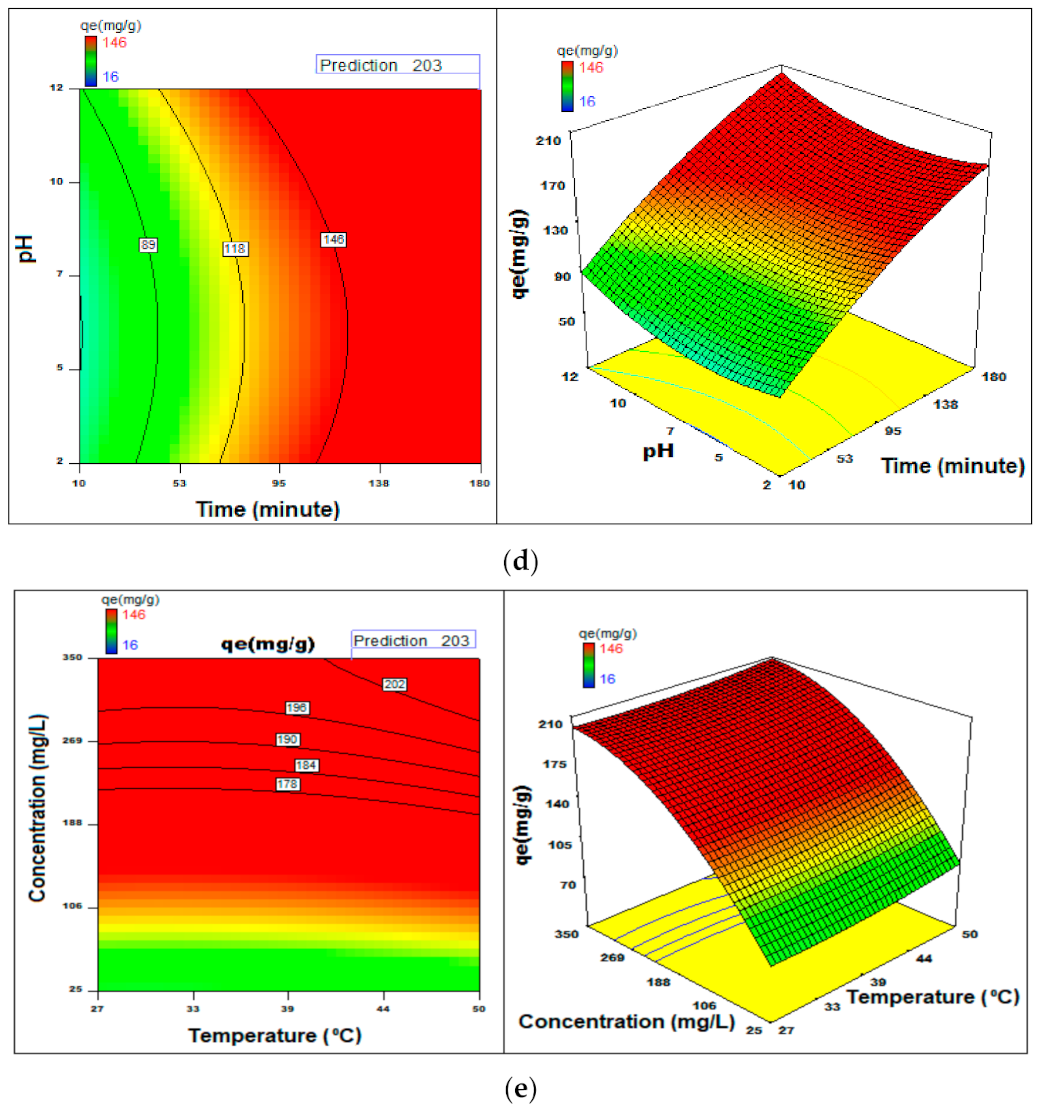
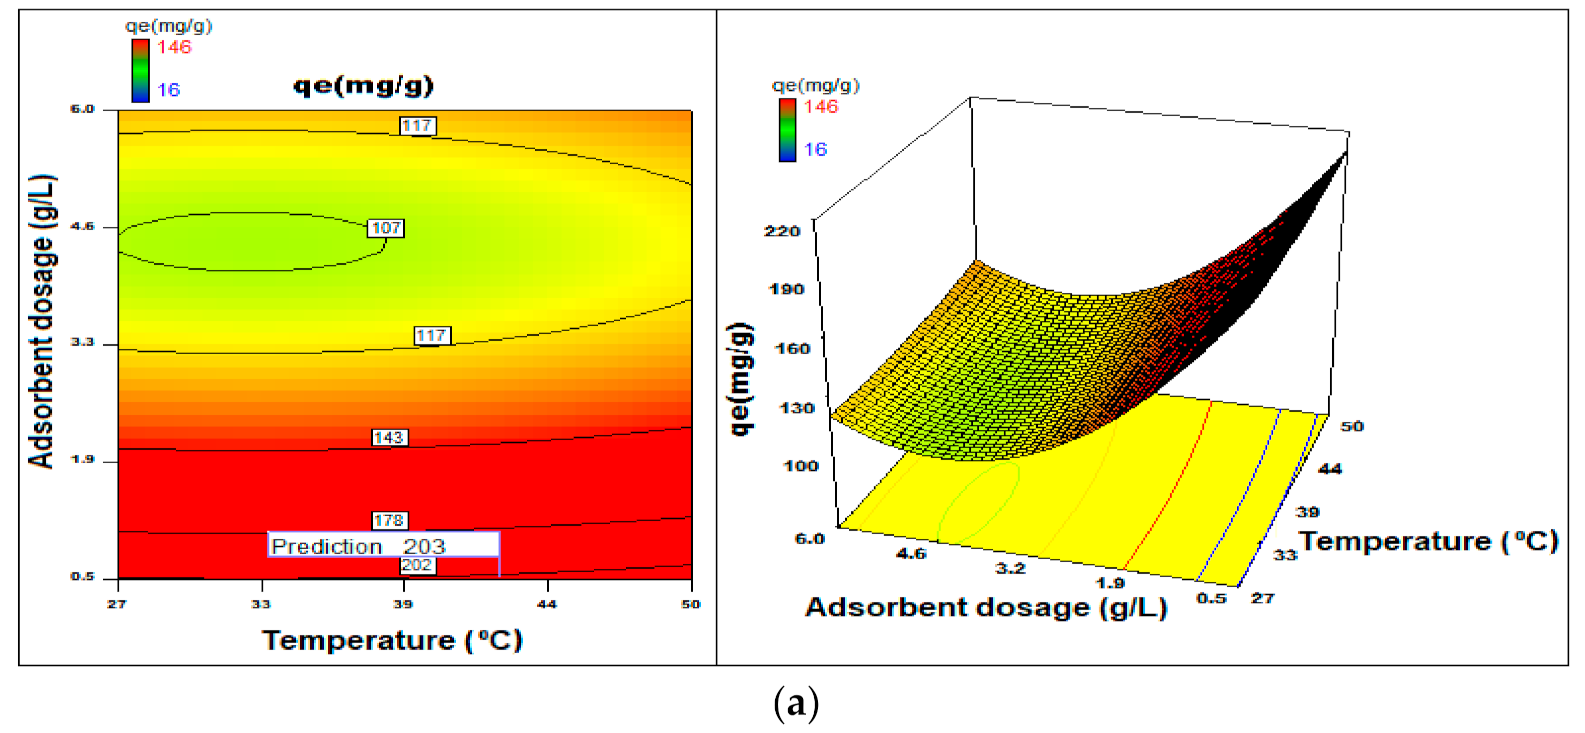
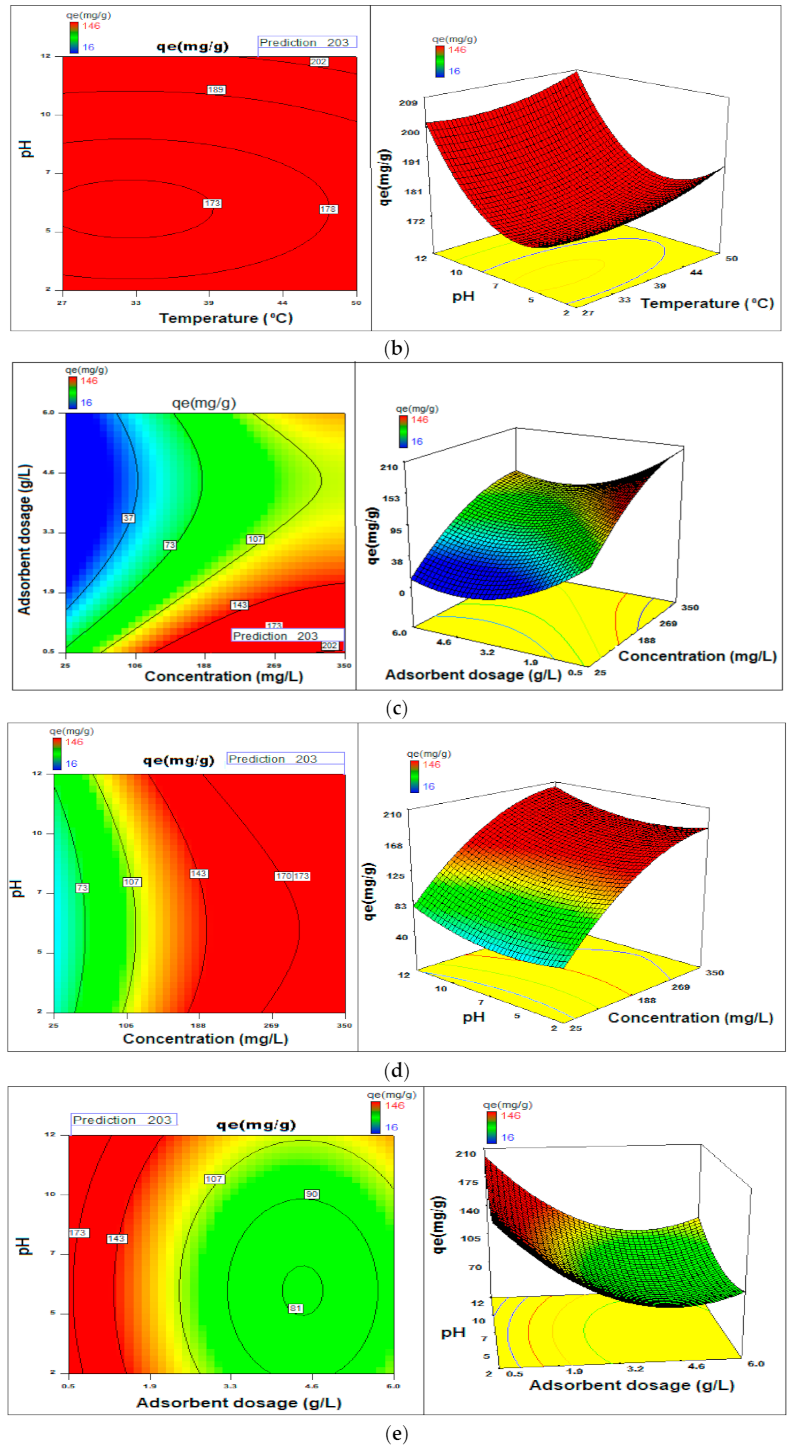
The regression coefficient values indicate the effect of the parameter(s) on the adsorption capacity. The graphs showing the contour and surface response illustrate the combined influence caused by two factors in the process of adsorption, and the results were graphically presented in Figure 12 and Figure 13. Based on the selected results obtained by employing the conditions of the study evolved through statistical modeling, a value of qe = 203 mg/g was obtained for an initial dye concentration of 344 mg/L at pH 12, adsorbent quantity = 0.52 g/L for the duration, 180 min along 165 rpm orbital shaking at 27.7 °C.
The measurable cycle enhancement in a given scope of boundary esteems permits for ascertaining the ideal condition, yet, deciding the impact of the interaction conditions on the adsorption. Figure 12 and Figure 13 presents the collaborated impact of two boundaries of the process.
Figure 12 resembles 3D plots of time versus various factors revealing the positive impact of the duration of adsorption on the extent of adsorption. The advancement of time supported by the pH and the concentration of BG increment improvises adsorption. The maximum period of 180 min showed the maximum adsorption. The optimum temperature is 29 °C and an increase in time with increased time motivates the capacity of a process. As the temperature increases with time, the adsorption capacity increases. The increase in pH beyond 1 decreases the adsorption capacity even if the time is increased. Graph (Figure 12c) plotted against time, and adsorbent dosage indicates that adsorbent measurements ve an adverse effect on adsorption.
Nonetheless, expanded time can work on the course of sorption. Figure 12e and Figure 13a,b 12 h for temperature against other autonomous factors, demonstrate that the temperature has a beneficial outcome with any remaining variable on the reaction. Figure 13c–e plotted for the initial dye concentration against other variables indicate that an increase in the initial concentration has a positive effect on adsorption capacity.
The process optimization studies enabled us to estimate the peak adsorption extent by employing a quadratic model. It further provided a tool to comprehend the relationships between the independent variables that play a significant role in the adsorption studies. Using statistical optimization studies, the value of adsorption was enhanced from 156 mg/g to 203 mg/g.

3.8. Mechanism of Adsorption of BG Dye onto H.N.T.

According to the literature, the studies establish the high surface area of H.N.T., such as 65 m2/g and specific weight = 2.53 g/cm3 [59]. The HNT particles surface gap depends on the factors recognized with measurements, shape, cross-segment, and appearance, and length (20–10,000 nm), and the unpredictable state of cross-segments prompt the outside surface of HNT particles to expand the surface region. Moreover, the HNT particles present as individuals, with no lump formation causing surface regional expansion [59,60]. Additionally, Shu et al. assert that HNT have significant porosity and, thus, forms an entity of interest with the (50 nm) qualities [61].
The plausible mechanism of cationic BG dye adsorption onto Halloysite Nanotubes is likely to occur due to the progression of a multi-step activity. The factors having a credible influence on adsorption are solution acidic level (pH), the concentration of dye, amount of adsorbent used, and variation in the temperature. Moreover, monolayer formation is initiated for the mass transfer of BG onto Halloysite Nanoclay. Additionally, the process of diffusion is likely to be a slow process. Therefore, the strong adherence of BG dye into Halloysite Nanoclay is probably by the bonds established between dye HSO4+ anions and the –CH3 group. Lastly, weak interactions are due to attract Vander Waal forces, and strong electrostatic forces of attraction of BG dye are because of the HSO4+ cationic group and –CH3 group. Thus, Halloysite Nanoclay contributes substantially to the adherence of the BG dye.

4. Conclusions

The process revelation with HNT (adsorbent) and BG dye (adsorbate) provided qe = 91 mg/g at pH = 2, 84 mg/g at almost neutral pH and 203 mg/g at statistically optimized conditions. To understand adsorption, nine isotherm models were studied. Redlich-Peterson isotherm model governs the process. HNT and BG interacted physically and followed kinetics of second-order. Contact duration, concentration of dye, amount, and initial value of pH profoundly influence the adsorption process. Preliminary investigations to regenerate dye-adsorbed HNT were carried out. It was observed that the cost of the regeneration process was higher than the cost of the adsorbent. Moreover, the dye-modified HNT was observed as a promising reinforcing material for fabricating the composites using plastic waste.
In brief, the present research is relevant to textile, clay minerals and plastic industries. Production in industries adopts a linear model to escalate the product value. The product lifecycle terminates with the disposal of the good after use. This model has serious implications concerning the depletion of resource. To encounter this witnessed problem, cultural shift in industries is recommended, where recycled and/or reuse of materials is promoted, rather than utilization of virgin raw goods. The research article presented is a step in this direction.

Author Contributions

Conceptualization, M.R.S. and M.G.; methodology, E.M.E. and S.J.U.; software, S.J.U. and S.N.T.; validation, M.A.A., S.J.U. and U.T.S.; formal analysis, M.A.A. and R.A.M.; investigation, U.T.S. and R.A.M.; resources, M.I.H.S. and M.E.M.S.; data curation, M.E.M.S. and I.M.; writing—original draft preparation, P.P. and S.J.U.; writing—review and editing, H.M.A. and A.E.; visualization, M.I.H.S. and I.M.; supervision, M.R.S. and M.G.; project administration, M.G. and H.M.A.; and funding acquisition, A.E.A. and E.M.E. All authors have read and agreed to the published version of the manuscript.

Funding

The Deanship of Scientific Research at King Khalid University General Research Project under the grant number (R.G.P.2/138/42) and Taif University researchers supporting project number (TURSP–2020/157), Taif University, Taif, Saudi Arabia.

Institutional Review Board Statement

Not applicable.

Informed Consent Statement

Not applicable.

Acknowledgments

The co-author Ali E. Anqi would like to extend his appreciation to the Deanship of Scientific Research at King Khalid University for the support he received through General Research Project under the grant number (R.G.P.2/138/42). This work was supported by Taif University researchers supporting project number (TURSP–2020/157), Taif University, Taif, Saudi Arabia. The first author was thankful to the Directorate of Minorities, Govt. of Karnataka for providing PhD fellowship to conduct the research.

Conflicts of Interest

The authors have no competing interests to report.

References

  1. Sustainable Fabrics Market Information: By Product Type (Organic, Regenerated, Recycled, Natural), Application (Clothing, Furnishing, Medical, Others), and Region—Global Forecast Till 2027. Available online: https://www.marketresearchfuture.com/reports/sustainable-fabrics-market-7435 (accessed on 10 July 2021).
  2. Anjaneyulu, Y.; Chary, N.S.; Raj, D.S.S. Decolourization of industrial effluents–available methods and emerging technologies–a review. Rev. Environ. Sci. Biotechnol. 2005, 4, 245–273. [Google Scholar] [CrossRef]
  3. Li, Y.; Lu, L.; Tan, Y.; Wang, L.; Shen, M. Decoupling water consumption and environmental impact on textile industry by using water footprint method: A case study in China. Water 2017, 9, 124. [Google Scholar] [CrossRef]
  4. Holkar, C.R.; Jadhav, A.J.; Pinjari, D.V.; Mahamuni, N.M.; Pandit, A.B. A critical review on textile wastewater treatments: Possible approaches. J. Environ. Manag. 2016, 182, 351–366. [Google Scholar] [CrossRef]
  5. Chequer, F.D.; de Oliveira, G.A.R.; Ferraz, E.R.A.; Cardoso, J.C.; Zanoni, M.B.; de Oliveira, D.P. Eco-Friendly Textile Dyeing and Finishing; InTech: Rijeka, Croatia, 2013; Volume 6, pp. 151–176. [Google Scholar]
  6. Püntener, A.; Page, C. European Ban on Certain Azo Dyes, Quality & Environment. Eur. J. 2004, 14, 231–458. Available online: http://www.dyediet.com/wp-content/uploads/2012/01/European-Ban-on-certain-Azo-Dyes.pdf (accessed on 24 August 2021).
  7. Glavič, P.; Lukman, R. Review of sustainability terms and their definitions. J. Clean. Prod. 2007, 15, 1875–1885. [Google Scholar] [CrossRef]
  8. Bhatia, D.; Sharma, N.R.; Singh, J.; Kanwar, R.S. BioloSSgical methods for textile dye removal from wastewater: A review. Crit. Rev. Environ. Sci. Technol. 2017, 47, 1836–1876. [Google Scholar] [CrossRef]
  9. Saraf, S.; Vaidya, V.K. Statistical optimization of biosorption of Reactive Orange 13 by dead biomass of Rhizopus arrhizus NCIM 997 using response surface methodology. Int. J. Ind. Chem. 2015, 6, 93–104. [Google Scholar] [CrossRef] [Green Version]
  10. Ahmadi, S.; Igwegbe, C.A.; Rahdar, S. The application of thermally activated persulfate for degradation of Acid Blue 92 in aqueous solution. Int. J. Ind. Chem. 2019, 10, 249–260. [Google Scholar] [CrossRef] [Green Version]
  11. Sharma, S.; Kaur, A. Various methods for removal of dyes from industrial effluents-a review. Indian J. Sci. Technol. 2018, 11, 1–21. [Google Scholar] [CrossRef]
  12. Tabaï, A.; Bechiri, O.; Abbessi, M. Degradation of organic dye using a new homogeneous Fenton-like system based on hydrogen peroxide and a recyclable Dawson-type heteropolyanion. Int. J. Ind. Chem. 2017, 8, 83–89. [Google Scholar] [CrossRef] [Green Version]
  13. Zauro, S.A.; Vishalakshi, B. Amphoteric gellan gum-based terpolymer–montmorillonite composite: Synthesis, swelling, and dye adsorption studies. Int. J. Ind. Chem. 2017, 8, 345–362. [Google Scholar] [CrossRef] [Green Version]
  14. Robinson, T.; McMullan, G.; Marchant, R.; Nigam, P. Remediation of dyes in textile effluent: A critical review on current treatment technologies with a proposed alternative. Bioresour. Technol. 2001, 77, 247–255. [Google Scholar] [CrossRef]
  15. Li, X.D.; Zhai, Q.Z. Evaluation of eosin Y removal from aqueous solution using nano-mesoporous material MCFs: Adsorption equilibrium, kinetics, and adsorption isotherms. Int. J. Ind. Chem. 2020, 11, 55–67. [Google Scholar] [CrossRef]
  16. Regti, A.; Laamari, M.R.; Stiriba, S.E.; El Haddad, M. Removal of Basic Blue 41 dyes using Persea americana-activated carbon prepared by phosphoric acid action. Int. J. Ind. Chem. 2017, 8, 187–195. [Google Scholar] [CrossRef] [Green Version]
  17. Sanghi, R.; Bhattacharya, B. Review on decolorisation of aqueous dye solutions by low cost adsorbents. Color. Technol. 2002, 118, 256–269. [Google Scholar] [CrossRef]
  18. Gupta, V.K. Application of low-cost adsorbents for dye removal—A review. J. Environ. Manag. 2009, 90, 2313–2342. [Google Scholar] [CrossRef]
  19. Papegowda, P.K.; Syed, A.A. Isotherm, kinetic and thermodynamic studies on the removal of methylene blue dye from aqueous solution using Saw Palmetto spent. Int. J. Environ. Res. 2017, 11, 91–98. [Google Scholar] [CrossRef]
  20. Taqui, S.N.; Yahya, R.; Hassan, A.; Nayak, N.; Syed, A.A. A novel sustainable design to develop polypropylene and unsaturated polyester resin polymer composites from waste of major polluting industries and investigation on their physicomechanical and wear properties. Polym. Compos. 2019, 40, 1142–1157. [Google Scholar] [CrossRef]
  21. Kausar, A.; Iqbal, M.; Javed, A.; Aftab, K.; Bhatti, H.N.; Nouren, S. Dyes adsorption using clay and modified clay: A review. J. Mol. Liq. 2018, 256, 395–407. [Google Scholar] [CrossRef]
  22. Taqui, S.N.; Yahya, R.; Hassan, A.; Nayak, N.; Syed, A.A. Development of sustainable dye adsorption system using nutraceutical industrial fennel seed spent—studies using Congo red dye. Int. J. Phytoremediat. 2017, 19, 686–694. [Google Scholar] [CrossRef]
  23. Vinokurov, V.; Novikov, A.; Rodnova, V.; Anikushin, B.; Kotelev, M.; Ivanov, E.; Lvov, Y. Cellulose nanofibrils and tubular halloysite as enhanced strength gelation agents. Polymers 2019, 11, 919. [Google Scholar] [CrossRef] [Green Version]
  24. Oplatowska, M.; Donnelly, R.F.; Majithiya, R.J.; Kennedy, D.G.; Elliott, C.T. The potential for human exposure, direct and indirect, to the suspected carcinogenic triphenylmethane dye Brilliant Green from green paper towels. Food. Chem. Toxicol. 2011, 49, 1870–1876. [Google Scholar] [CrossRef] [PubMed]
  25. Kiani, G.; Dostali, M.; Rostami, A.; Khataee, A.R. Adsorption studies on the removal of Malachite Green from aqueous solutions onto halloysite nanotubes. Appl. Clay Sci. 2011, 54, 34–39. [Google Scholar] [CrossRef]
  26. Dhaif-Allah, M.A.; Taqui, S.N.; Syed, U.T.; Syed, A.A. Kinetic and isotherm modeling for acid blue 113 dye adsorption onto low-cost nutraceutical industrial fenugreek seed spent. Appl. Water Sci. 2020, 10, 1–16. [Google Scholar] [CrossRef] [Green Version]
  27. Taqui, S.N.; Yahya, R.; Hassan, A.; Nayak, N.; Syed, A.A. Valorization of nutraceutical industrial coriander seed spent by the process of sustainable adsorption system of Acid Black 52 from aqueous solution. Int. J. Environ. Res. 2019, 13, 639–659. [Google Scholar] [CrossRef]
  28. Taqui, S.N.; Yahya, R.; Hassan, A.; Nayak, N.; Syed, A.A. Adsorption of Acid Blue 113 from aqueous solution onto nutraceutical industrial coriander seed spent: Isotherm, kinetics, thermodynamics and modeling studies. Desalin. Water Treat. 2019, 153, 321–337. [Google Scholar] [CrossRef]
  29. Childress, A.E.; Elimelech, M. Effect of solution chemistry on the surface charge of polymeric reverse osmosis and nanofiltration membranes. J. Membr. Sci. 1996, 119, 253–268. [Google Scholar] [CrossRef]
  30. Baral, S.S.; Das, N.; Chaudhury, G.R.; Das, S.N. A preliminary study on the adsorptive removal of Cr (VI) using seaweed, Hydrilla verticillata. J. Hazard. Mater. 2009, 171, 358–369. [Google Scholar] [CrossRef] [PubMed]
  31. Sulthana, R.; Taqui, S.N.; Zameer, F.; Syed, U.T.; Syed, A.A. adsorption of ethidium bromide from aqueous solution onto nutraceutical industrial fennel seed spent: Kinetics and thermodynamics modeling studies. Int. J. Phytoremediat. 2018, 20, 1075–1086. [Google Scholar] [CrossRef]
  32. Alkan, M.; Demirbaş, Ö.; Doğan, M. Adsorption kinetics and thermodynamics of an anionic dye onto sepiolite. Microporous Mesoporous Mater. 2007, 101, 388–396. [Google Scholar] [CrossRef]
  33. Langmuir, I. The adsorption of gases on plane surfaces of glass, mica and platinum. J. Am. Chem. Soc. 1918, 40, 1361–1403. [Google Scholar] [CrossRef] [Green Version]
  34. Freundlich, H. Uber die adsorption in lo sungen. Z. Phys. Chem. 1906, 57, 385–471. [Google Scholar]
  35. Jovanović, D.S. Physical adsorption of gases. Colloid Polym. Sci. 1969, 235, 1203–1213. [Google Scholar]
  36. Hu, Q.; Zhang, Z. Application of Dubinin–Radushkevich isotherm model at the solid/solution interface: A theoretical analysis. J. Mol. Liq. 2019, 277, 646–648. [Google Scholar] [CrossRef]
  37. Yakuth, S.A.; Taqui, S.N.; Syed, U.T.; Syed, A.A. Nutraceutical industrial chillies stalk waste as a new adsorbent for the removal of Acid Violet 49 from water and textile industrial effluent: Adsorption isotherms and kinetic models. Desalin. Water Treat. 2019, 155, 94–112. [Google Scholar] [CrossRef] [Green Version]
  38. Toth, J. State equation of the solid-gas interface layers. Acta Chim. Hung. 1971, 69, 311–328. [Google Scholar]
  39. Brouers, F.; Sotolongo, O.; Marquez, F.; Pirard, J.P. Microporous and heterogeneous surface adsorption isotherms arising from Levy distributions. Physica A Stat. Mech. Appl. 2005, 349, 271–282. [Google Scholar] [CrossRef]
  40. Vieth, W.R.; Sladek, K.J. A model for diffusion in a glassy polymer. J. Coll. Sci. 1965, 20, 1014–1033. [Google Scholar] [CrossRef]
  41. Radke, C.J.; Prausnitz, J.M. Adsorption of organic solutes from dilute aqueous solution of activated carbon. Ind. Eng. Chem. Fundam. 1972, 11, 445–451. [Google Scholar] [CrossRef]
  42. Redlich, O.J.D.L.; Peterson, D.L. A useful adsorption isotherm. J. Phy. Chem. 1959, 63, 1024. [Google Scholar] [CrossRef]
  43. Lagergren, S.K. About the theory of so-called adsorption of soluble substances. Kungliga Svenska Vetenskapsakademiens Handlingar 1898, 24, 1–39. [Google Scholar]
  44. Ho, Y.S.; McKay, G. Sorption of dye from aqueous solution by peat. Chem. Eng. J. 1998, 70, 115–124. [Google Scholar] [CrossRef]
  45. Boyd, G.E.; Adamson, A.W.; Myers, L.S., Jr. The exchange adsorption of ions from aqueous solutions by organic zeolites. II. Kinetics1. J. Am. Chem. Soc. 1947, 69, 2836–2848. [Google Scholar] [CrossRef] [PubMed]
  46. Wang, H.L.; Chen, J.L.; Zhai, Z.C. Study on thermodynamics and kinetics of adsorption of p-toluidine from aqueous solution by hypercrosslinked polymeric adsorbents. Environ. Chem. 2004, 23, 192–196. [Google Scholar]
  47. Lvov, Y.; Wang, W.; Zhang, L.; Fakhrullin, R. Halloysite clay nanotubes for loading and sustained release of functional compounds. Adv. Mater. 2016, 28, 1227–1250. [Google Scholar] [CrossRef]
  48. Massaro, M.; Lazzara, G.; Noto, R.; Riela, S. Halloysite nanotubes: A green resource for materials and life sciences. Rend. Fis. Acc. Lincei 2020, 31, 213–221. [Google Scholar] [CrossRef]
  49. Saki, H.; Alemayehu, E.; Schomburg, J.; Lennartz, B. Halloysite nanotubes as adsorptive material for phosphate removal from aqueous solution. Water 2019, 11, 203. [Google Scholar] [CrossRef] [Green Version]
  50. Dhaif-Allah, M.A.H.; Taqui, S.N.; Syed, U.T.; Syed, A.A. Development of sustainable acid blue 113 dye adsorption system using nutraceutical industrial Tribulus terrestris spent. SN Appl. Sci. 2019, 1, 330. [Google Scholar] [CrossRef] [Green Version]
  51. Bagherzadeh, S.A.; D’Orazio, A.; Karimipour, A.; Goodarzi, M.; Bach, Q.V. A novel sensitivity analysis model of EANN for F-MWCNTs-Fe3O4/EG nanofluid thermal conductivity: Outputs predicted analytically instead of numerically to more accuracy and less costs. Phys. A-Stat. Mech. Appl. 2019, 521, 406–415. [Google Scholar] [CrossRef]
  52. Hosseini, S.M.; Safaei, M.R.; Goodarzi, M.; Alrashed, A.; Nguyen, T.K. New temperature, interfacial shell dependent dimensionless model for thermal conductivity of nanofluids. Int. J. Heat Mass Transf. 2017, 114, 207–210. [Google Scholar] [CrossRef]
  53. Peng, Y.; Khaled, U.; Al-Rashed, A.A.; Meer, R.; Goodarzi, M.; Sarafraz, M.M. Potential application of Response Surface Methodology (RSM) for the prediction and optimization of thermal conductivity of aqueous CuO (II) nanofluid: A statistical approach and experimental validation. Phys. A: Stat. Mech. Appl. 2020, 554, 124353. [Google Scholar] [CrossRef]
  54. Wu, H.; Bagherzadeh, S.A.; D’Orazio, A.; Habibollahi, N.; Karimipour, A.; Goodarzi, M.; Bach, Q.V. Present a new multi objective optimization statistical Pareto frontier method composed of artificial neural network and multi objective genetic algorithm to improve the pipe flow hydrodynamic and thermal properties such as pressure drop and heat transfer coefficient for non-Newtonian binary fluids. Phys. A Stat. Mech. Appl. 2019, 535, 122409. [Google Scholar]
  55. Peng, Y.; Parsian, A.; Khodadadi, H.; Akbari, M.; Ghani, K.; Goodarzi, M.; Bach, Q.V. Develop optimal network topology of artificial neural network (AONN) to predict the hybrid nanofluids thermal conductivity according to the empirical data of Al2O3–Cu nanoparticles dispersed in ethylene glycol. Phys. A Stat. Mech. Appl. 2020, 549, 124015. [Google Scholar] [CrossRef]
  56. Mehrdad, S.; Dadsetani, R.; Amiriyoon, A.; Leon, A.S.; Reza Safaei, M.; Goodarzi, M. Exergo-economic optimization of organic rankine cycle for saving of thermal energy in a sample power plant by using of strength pareto evolutionary algorithm II. Processes 2020, 8, 264. [Google Scholar] [CrossRef] [Green Version]
  57. Taqui, S.N.; Mohan, C.S.; Khatoon, B.A.; Soudagar, M.E.M.; Khan, T.Y.; Mujtaba, M.A.; Ahmed, W.; Elfasakhany, A.; Kumar, R.; Pruncu, C.I. Sustainable adsorption method for the remediation of malachite green dye using nutraceutical industrial fenugreek seed spent. Biomass. Convers. Biorefin. 2021. [Google Scholar] [CrossRef]
  58. Taqui, S.N.; Mohan, C.S.; Goodarzi, M.S.; Elkotb, M.A.; Khatoon, B.A.; Soudagar, M.E.M.; Koki, I.B.; Elfasakhany, A.; Khalifa, A.S.; Ali, M.A.; et al. Sustainable Adsorption Method for the Remediation of Crystal Violet Dye Using Nutraceutical Industrial Fenugreek Seed Spent. Appl. Sci. 2021, 11, 7635. [Google Scholar] [CrossRef]
  59. Kamble, R.; Ghag, M.; Gaikawad, S.; Panda, B.K. Halloysite nanotubes and applications: A review. J. Adv. Sci. Res. 2012, 3, 25–29. [Google Scholar]
  60. Mitra, G.B.; Bhattacherjee, S. The structure of halloysite. Acta Crystallogr. B Struct. Crystallogr. Cryst. Chem. 1975, 31, 2851–2857. [Google Scholar] [CrossRef]
  61. Shu, Z.; Chen, Y.; Zhou, J.; Li, T.; Yu, D.; Wang, Y. Nanoporous-walled silica and alumina nanotubes derived from halloysite: Controllable preparation and their dye adsorption applications. Appl. Clay Sci. 2015, 112, 17–24. [Google Scholar] [CrossRef]
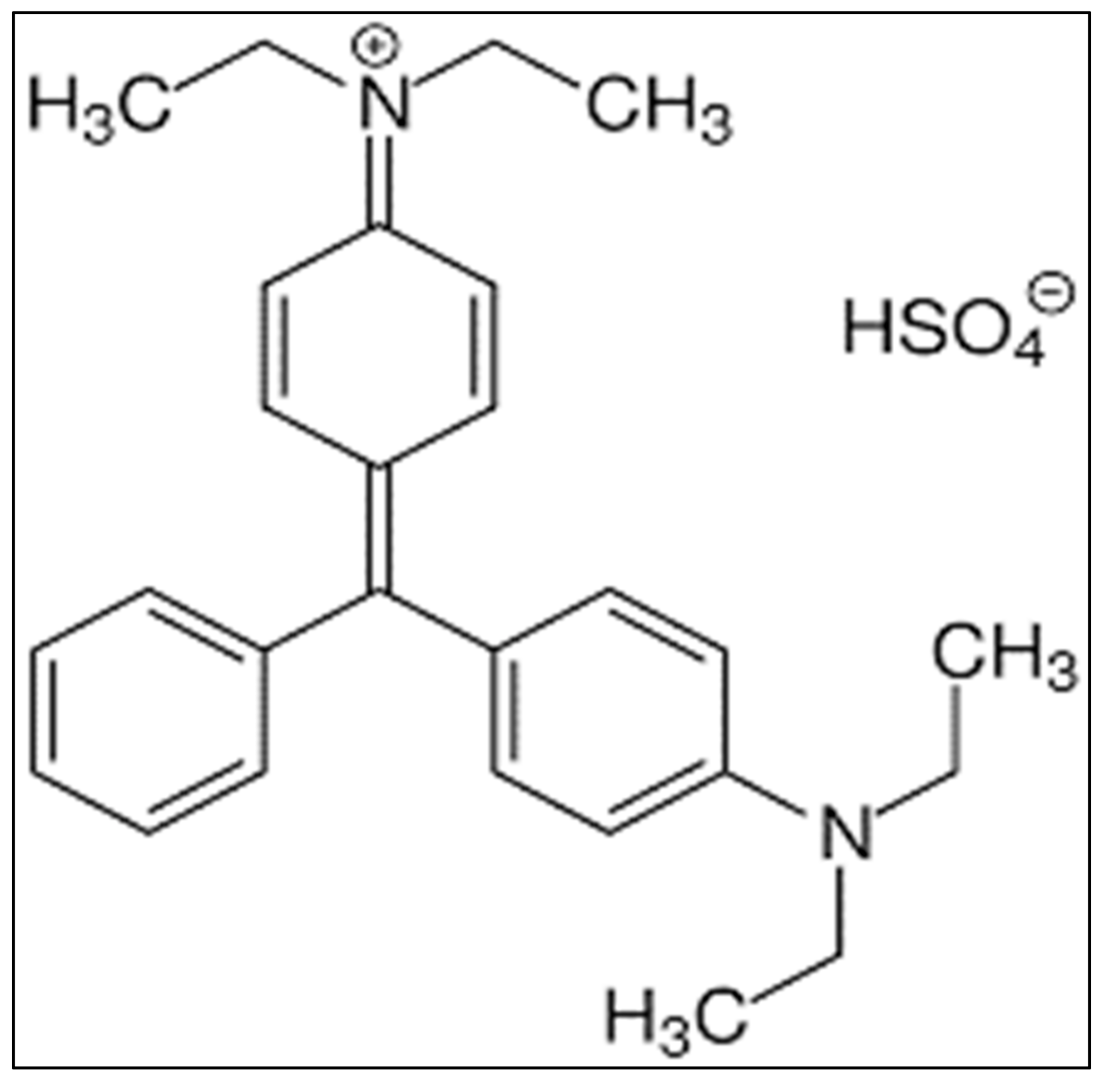
Figure 1. Brilliant green atomic structure.
Applsci 11 08088 g001
Figure 2. Halloysite nanotube surface characterization pre- and post-adsorption studies. (a) HNT pre-adsorption SEM image and (b) BG-HNT post-adsorption SEM image.
Applsci 11 08088 g002
Figure 3. FTIR spectra of BG dye, HNT, and BG-HNT.
Applsci 11 08088 g003
Figure 4. Effect of (a) the pH, (b) initial dye concentration, (Co) with percent removal efficiency, (c) adsorbent dosage, and (d) temperature of BG-HNT.
Applsci 11 08088 g004aApplsci 11 08088 g004b
Figure 5. BG-HNT adsorption fit with (a) Langmuir and Freundlich; (b) Jovanovic and Dubinin-Radushkevich; (c) Vieth-Sladek and Brouers-Sotolongo; and (d) the Redlich-Peterson, Radke-Prausnitz, and Toth adsorption isotherm.
Applsci 11 08088 g005aApplsci 11 08088 g005b
Figure 6. BG adsorption on HNT fittings for (a) 50 µg/mL, (b) 100 µg/mL, and (c) 150 µg/mL at thermal variations.
Applsci 11 08088 g006
Figure 7. Energy information fitting to format the film dissemination starting with BG focus: (a) 50 µg/mL and (b) 100 µg/mL and (c) 150 µg/mL.
Applsci 11 08088 g007
Figure 8. Energy information fitting to format the Weber–Morris model with the beginning BG focus (a) 50 µg/mL, (b) 100 µg/mL, and (c) 150 µg/mL.
Applsci 11 08088 g008
Figure 9. Energy Information fitted to the format of Dumwald-Wagner model with initial BG focus (a) 50 µg/mL, (b) 100 µg/mL, and (c) 150 µg/mL.
Applsci 11 08088 g009
Figure 10. Graph signifying the enthalpy and free energy of BG-HNT.
Applsci 11 08088 g010
Figure 11. Actual versus predicted values of BG-HNT.
Applsci 11 08088 g011
Figure 12. 3D surface plot and contour plot depicting a capacity variation of the adsorption with (a) time versus temperature, (b) time versus concentration, (c) time versus the adsorbent dosage, (d) time versus pH, and (e) temperature versus concentration.
Applsci 11 08088 g012aApplsci 11 08088 g012b
Figure 13. 3D surface plot and contour plot depicting the capacity variation of adsorption with (a) the temperature versus adsorbent dosage, (b) temperature versus pH, (c) concentration versus adsorbent dosage, (d) concentration versus pH, and (e) adsorbent dosage versus pH.
Applsci 11 08088 g013aApplsci 11 08088 g013b
Table 1. Test range for singular components [27] (adapted with permission from the publisher).
FeatureVariableDimensional
Value
ValueminValuemax
ADurationminute0180
BTemperature°C2750
CConcentrationmgL−125200
DAdsorbent quantitygL−10.56.0
EpH-212
Table 2. Calculated parameters of the adsorption isotherms.
Two-Parameter IsothermsThree-Parameter Isotherms
LangmuirFreundlichJovanovicDubinin-
Radushkevich
TothBrouers-SotolongoVieth-SladekRadke-PrausnitzRedlich-Peterson
Qm124.2KF37.9Qm109.7Qs110.6Qm106.4Qm107.1Qm124.2Qm774.8ARP7.8
KS0.12nF4.06KJ0.09Kad6.43 × 10−6nT012.50KBS0.02KVS1 × 10−7krp0.01BRP0.01
bT01.13 × 1015α1.61βVS0.12mrp2.89g1.64
Table 3. Model fit factual boundaries.
IsothermsLangmuirFreundlichJovanovicDubinin-RadushkevichTothBrouers-SotolongoVieth-SladekRadke-PrausnitzRedlich-Peterson
SSE1581.83506.7777.9544.4311.1311.81581.8244.5140.7
χ231.2877.0812.847.824.473.6131.297.704.63
R20.910.920.990.940.960.960.820.980.98
Table 4. Unsettled and hypothetically anticipated boundaries for the adsorption energy formats.
Initial Concentration
(µg mL−1)
Temp
(K)
qe, expt
(mg g−1)
Pseudo-First-OrderPseudo-Second-Order
qe, pred
(mg g−1)
K1R2χ2qe, pred
(mg g−1)
K2R2Χ2
503034035.966.63 × 10−20.940.5944.261.64 × 10−30.973.94
31344117.532.28 × 10−21.00149.5748.081.79 × 10−30.960.32
3234745.095.32 × 10−20.960.8057.859.04 × 10−40.970.48
1003038638.861.02 × 10−10.918.5144.683.12 × 10−30.910.48
3138943.904.39 × 10−10.931.5465.881.71 × 10−30.931.65
3239343.321.07 × 10−10.941.5849.702.94 × 10−30.940.76
15030311077.791.95 × 10−10.910.3682.435.33 × 10−30.950.07
31311785.274.76 × 10−20.941.65111.584.01 × 10−40.970.92
32312296.904.04 × 10−20.964.99127.722.95 × 10−40.903.61
Table 5. Determined boundaries for the dissemination models.
Initial Concentration
(µg mL−1)
Temp
(K)
Film Diffusion ModelWeber-Morris ModelDumwald-Wagner
R
(min−1)
R2χ2Kist
(mg g−1 s−0.5)
R2χ2K
(min−1)
R2χ2
503030.03720.980.5113.730.990.0500.0320.970.057
3130.03970.990.6823.880.990.0450.0350.980.045
3230.04370.990.1115.120.970.2730.0380.980.178
1003030.00550.995.1583.080.980.0560.0320.990.201
3130.00780.992.1914.490.990.0780.0050.990.030
3230.00600.995.1213.420.970.1170.0040.980.192
1503030.00660.904.2822.670.940.0860.0050.902.156
3130.01710.990.7629.950.990.2040.0120.990.387
3230.02020.960.47711.090.961.3140.0230.970.907
Table 6. Thermodynamic boundaries of BG-HNT framework.
Initial ConcentrationTempΔG°ΔS°ΔH°ln AEa
(µg mL−1)(K)(kJ mol-1)(J mol−1 K−10)(kJ mol−1)(kJ mol−1)
50303−6.54486.19120.452.9038.33
313−6.37
323−6.15
100303−5.95645.33233.614.5159.69
313−5.74
323−5.14
150303−3.93862.91432.706.4673.76
313−3.62
323−3.31
Table 7. ANOVA table of BG-HNT framework.
SourceSum of SquaresDegree of FreedomMean SquareF-Valuep-Value
Model60,415.24134647.3330.12<0.001
A18,483.5118,483.5119.8<0.0001
B66.8166.80.40.5128
C17,876.0117,876.0115.8<0.0001
D6660.916660.943.2<0.0001
E479.81479.83.10.0821
AB217.61217.61.40.2389
AC1176.811176.87.60.0073
BC1.3211.30.00860.9265
A2736.51736.54.80.0322
B2100.71100.70.70.4218
C2223.01223.01.40.2333
D22437.612437.615.80.0002
E2494.31494.33.20.0777
F2552.61736.54.80.0322
Residual10,955.871154.3
Total71,371.084
Publisher’s Note: MDPI stays neutral with regard to jurisdictional claims in published maps and institutional affiliations.