Abstract
The process of liquid radial reflux interference during jet penetration in a liquid-filled composite structure is divided in this study into three stages: bottom plate reflection interference, side-wall reflection interference, and side-wall secondary reflection interference. The calculation model of the velocity interval of the disturbed jet and the residual penetration depth of the jet has been established through theoretical analysis. Results show that the liquid-filled composite structure can interfere with the high-speed section of the shaped charge jet. The accuracy of the theoretical analysis in this paper has been verified through numerical simulation, X-ray, and depth-of-penetration experiments. Among the results, those of the X-ray experiment show that the liquid-filled composite structure has interference on the tip of the shaped charge jet, which provides a possibility for the application of the liquid-filled composite structure to ammunition safety and other extreme cases.
1. Introduction
A thin-walled, liquid-filled structure will demonstrate large deformation, tearing, or even complete failure when impacted by a high-speed projectile. This phenomenon is called the water hammer effect [1] because the incoming projectile will transform its kinetic energy into deformation energy of the shell through the liquid, which can lead to shell deformation and failure, to achieve structural damage. The water hammer effect makes thin-walled liquid-filled structures, such as aircraft and ship tanks, become one of the main attack targets on the battlefield. However, recent studies have found that the liquid-filled structure can also be used to resist the impact of high-speed penetrators such as a shaped charge jet (SCJ), when the constraint is strong. The liquid-filled composite structure (LFCS), a new type of protective structure, has gradually attracted the attention of scholars in the field of impact protection.
Scholars have conducted thorough theoretical studies, simulations, and tests on the dynamic response process of kinetic energy projectiles impacting liquid-filled structures, focusing on the velocity attenuation of the projectiles, cavitation dynamic characteristics, liquid pressure distribution, and energy-absorbing deformation of the shells. Fourest et al. [2,3] studied the bubble and fluid dynamic characteristics of an oil tank under the impact of fragments through numerical simulation. Varas [4] investigated the liquid pressure distribution and shell deformation of aluminum square tubes with different liquid level heights under the impact of spherical projectiles with different velocities. Lecysyn [5] analyzed the change in shock wave pressure, bubble drag pressure, and hole wall during penetration of a high-speed bullet in an open liquid container. Sauer [6] used the simulation method to analyze the container deformation, liquid dispersion, and residual velocity of the projectile when the liquid-filled container was affected by the impact. Disimile [7,8] analyzed the liquid dispersion after projectile impact on an oil tank by using high-speed camera technology and studied the damage characteristics of the simulated oil tank under a shock wave after a 12.7 mm tungsten ball impact. Chen [9] investigated the characteristics of a liquid spurt caused by the hydrodynamic ram in an experiment, which revealed the impact of high-velocity fragments on a liquid-filled container. Ji [10] compared the hydrodynamic ram caused by one and two spherical projectiles impacting water-filled containers by using a numerical model.
The interaction between the projectile and the LFCS is the dynamic impact response of the projectile to the LFCS, while its opposite is the interference of the LFCS in the projectile. The interference modes of an LFCS in different projectiles vary. A kinetic energy projectile, such as a long-rod projectile, and the fragments in the liquid will be subjected to resistance caused by the pressure difference between the head and the tail of the projectile and the viscosity of the liquid; the kinetic energy of the projectile is converted into kinetic energy of the liquid and finally into its potential energy and the deformation energy of the shell [11]. The movement trajectory of the projectile will also be changed by the interference of the liquid. In contrast, the LFCS mainly causes lateral interference in the SCJ through the convergence and reflux of the liquid driven by the shock wave, which results in necking fracture of the jet, thus reducing its penetration capability and realization of a high protection level. The use of an LFCS to resist the SCJ can play the role of replacing the rigid with the soft and meet the lightweight requirement of a protective structure. Therefore, the interference process of the LFCS in the SCJ must be studied for the application of an LFCS in the field of protection engineering.
In recent years, scholars have conducted studies on jet penetration in liquid or liquid-filled structures successively. Held and Backofen [12] investigated the penetration behavior of copper, aluminum, and tantalum molding jets in water by using high-speed photography and intermittent switching technology. White and Wahll [13] demonstrated that a closed structure full of liquid has a good interference effect on the jet through experiments. Lee [14] studied the penetrating behavior of jet particles in water through high-speed photography and X-ray experiments. Held [15,16] modified Szendrei equations and obtained the reaming equations of jet penetration in water through high spatial and temporal resolutions and profile-streak technology. Andersson [17] performed X-ray photography and found that the collapse of the penetration channel leads to complete disappearance of the jet tail during its penetration into a water-filled airtight container. From an engineering viewpoint, Yanqing [18] proposed a new type of protective armor comprising a sealed steel box unit structure filled with water and calculated the interference of this armor in the jet flow. Gao [19,20] and Zhang [21,22] established a theoretical model of the interference mechanism of fluid-filled single-cell structures in jets. Zu and Tan [23,24] determined the relationship between the residual penetration of the jet and the physical parameters of the target, jet, and liquid material through dimensional analysis. Guo [25,26] established a theoretical model to calculate the velocity interval of a jet subjected to interference by considering the compressibility of the liquid and the multiple impacts of the jet on the liquid and used the lateral velocity method to calculate the residual penetration depth. Zu [27] presented experimental and theoretical investigations of the penetration capability of the residual SCJ emerging from the liquid-filled compartment structure after the penetration process at different impact angles.
Gao et al. [19,20,21,22,23,24,25,26] established a calculation model for the velocity interval of a disturbed jet. However, they ignored the interference of the liquid radial reflux driven by the bottom plate reflection and the side-wall secondary reflection waves on the jet, which would introduce errors in the calculation of the interference velocity interval.
The interference of liquid radial reflux in the SCJ by the LFCS in this paper can be divided into the following three parts: bottom plate reflection interference, side-wall reflection interference, and side-wall secondary reflection interference. A theoretical model, which can accurately calculate the velocity interval of the disturbed jet and the residual penetration depth of the jet, is established considering the change in liquid sound velocity and the propagation path of shock waves. The calculation revealed that the interference of the LFCS in the SCJ is mainly concentrated in the tip and middle part of the jet. The AUTODYN-2D hydrocode and the Euler–Lagrange coupling algorithm are then used to demonstrate intuitively the three stages of the liquid reflux interfering jet driven by shock waves, which verifies the accuracy of the theoretical analysis. Finally, X-ray technology is used to capture the shape of the jet penetration in the LFCS, and the velocity interval of the disturbed jet is calculated. The experimental results show that the liquid composite structure has an obvious interference effect on the high-speed section of the SCJ, and the theoretical model established in this paper can accurately calculate the disturbed velocity interval and the residual penetration depth of the jet. Therefore, the theoretical model can be used to guide the design of the LFCS and predict its anti-jet capacity.
2. Theoretical Analysis
In this study, jet penetration into the LFCS (see Figure 1) is divided into five stages: jet penetration into the cover plate, jet reaming in the liquid, side-wall reflection interference, bottom plate reflection interference, and liquid spraying and side-wall secondary reflection interference. This study proposes several assumptions to simplify the calculation and formula derivation:
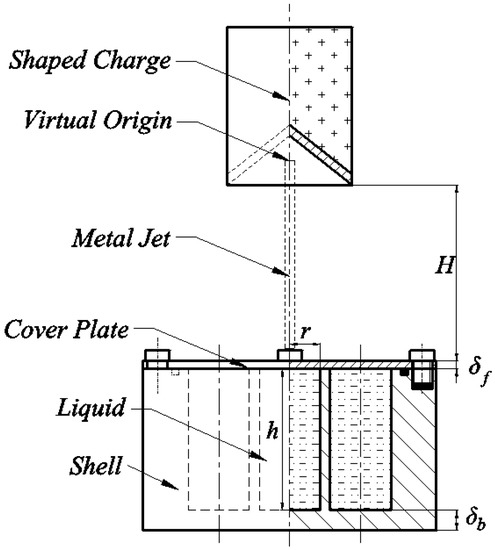
Figure 1.
Schematic of the interaction between the projectile and the target.
- (1)
- The radial and axial pressures of the initial reaming are equal, and the product of reaming pressure and hole wall area is constant.
- (2)
- During penetration, the jet is approximately a cylindrical rod.
- (3)
- Considering that the effect of liquid viscosity is small, it is ignored in the analysis of penetration [24].
- (4)
- The effect of shell plastic deformation in the penetration process is ignored.
Based on the above assumptions, the five stages of the jet penetration into the LFCS are as follows:
The first stage is the jet penetration into the cover plate, which can be treated as a steady-stage penetration.
The second stage is the jet reaming in the liquid.
The residual velocity and time spent after penetration of the liquid layer can be obtained as follows by using virtual origin theory [25]:
where is the residual velocity after jet penetration into the cover plate, is the density value of the liquid, is the density value of the SCJ, and is the coordinate value of the virtual origin.
Under the unconstrained condition, the radius and time of crater reaming of the SCJ in the liquid under the influence of shock waves can be obtained by using the penetration equation. When the jet penetrates the LFCS, the liquid pressure continuously increases due to the restriction of the shell. The crater radius of the liquid, , is assumed to reach the maximum when the liquid pressure increases to the same value as the reaming pressure. Then,
where is the penetration dynamic pressure, is the reaming pressure, and is the jet radius.
Dowson and Higginson found that the relationship between liquid pressure and density [28] is as follows:
where is the density of the liquid at atmospheric pressure.
Meanwhile, the liquid density at a certain liquid level can be approximated as follows:
The crater radius formed by the jet in the liquid can be obtained through Equations (3)–(5).
Given that the penetration velocity of the jet is greater than the sound velocity of the liquid , a shock wave will be generated in the liquid, and the propagation velocity of the shock wave can be approximated as follows [29]:
At equilibrium, [25].
The shock wave propagates to the side wall of the cylindrical cavity of the LFCS with the penetration. After being reflected by the side wall, the reflection shock wave propagates in the opposite direction until it meets the crater wall formed by jet penetration (Figure 2).
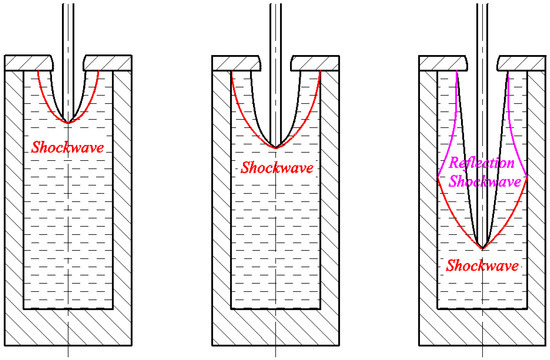
Figure 2.
Schematic of the shock wave side-wall reflection in liquid.
The third stage is the side-wall reflection interference, in which the reflection shock wave propagates to the crater wall and drives the radial reflux of the liquid to interfere with the SCJ.
Figure 3 shows the propagation path of the shock wave in the liquid. In the lateral direction, reflection occurs when the shock wave contacts the side-wall surface, and the shock wave has only one impact action on the shell of the LFCS and the jet. According to the propagation characteristics of the shock wave, the two limiting propagation directions of the shock wave during jet penetration into the liquid layer are as follows: (1) the shock wave propagates along the normal direction of the Mach angle , and (2) the initial shock wave propagates along the radial direction . The two shock wave propagation paths form corresponding to the maximum velocity and minimum velocity of the jet interfered by the liquid in the side-wall reflection interference stage, respectively.
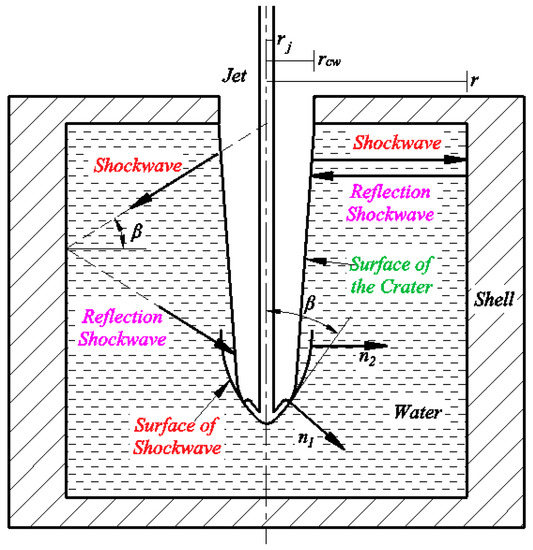
Figure 3.
Propagation path of the shock wave.
According to the geometric relationship of the propagation path, we can obtain
where and are the propagation times of the shock wave in two different directions.
When the reflection shock wave propagates to the penetration crater wall to make the liquid converge radially, the following expressions exist:
where is the closing pressure, is the intensity of the side-wall reflection shock wave, K is the reflection coefficient of the shock wave, is the closing velocity of the liquid particle, is a constant, and is the time taken for the liquid particle to move from the crater wall to the jet surface.
The jet velocity at the position where the liquid converges to the jet surface can be obtained for the two shock wave propagation paths:
where and are the times of the liquid’s movement to the jet surface corresponding to the two propagation paths.
In the side-wall reflection interference stage, the velocity interval of the jet interfered by the liquid is .
The fourth stage is the bottom reflection interference, which is marked by the impact of the jet on the bottom plate. The shock wave is then reflected at the interface between the liquid and the bottom plate. The bottom plate reflection shock wave propagates to the liquid crater wall and causes secondary reflection at the free interface, which drives the radial reflux of the liquid.
At the interface between the liquid and the bottom plate, we can obtain
where is the intensity of the bottom reflection shock wave at the crater wall, is the liquid closing speed, is the time for the bottom plate reflection shock wave to propagate to the crater wall, and is the liquid closing time.
In combination with Equations (16)–(19), the maximum velocity of the interference jet at the bottom plate reflection interference stage can be obtained as follows:
Considering the overlap and continuity of the bottom plate reflection interference and the side-wall reflection interference (see Figure 4), the total interference jet velocity interval disturbed by the liquid driven by the side-wall reflection shock wave and the bottom plate reflection shock wave was obtained as , in which the liquid continuously interfered with the jet.
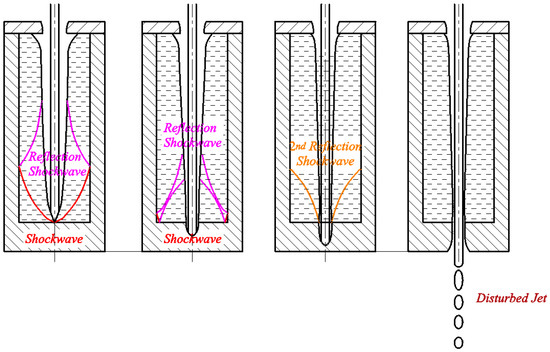
Figure 4.
Formation and propagation of the bottom plate reflection shock wave.
The fifth stage is liquid spraying and side-wall secondary reflection interference.
(1) Liquid spraying
When the jet penetrates through the bottom plate of the LFCS, the liquid is rapidly sprayed out along the penetration crater under the action of the pressure difference. The height of the liquid level drop caused by liquid spraying can be obtained [25]:
where is the liquid-spraying velocity, is the reaming area of the bottom plate, and is the liquid-spraying time.
(2) Side-wall secondary reflection interference process
In this process, the bottom plate reflection wave reflects on the side wall and generates a secondary reflection shock wave, which propagates to the liquid crater wall and drives the liquid to continue interfering with the jet (see Figure 5).
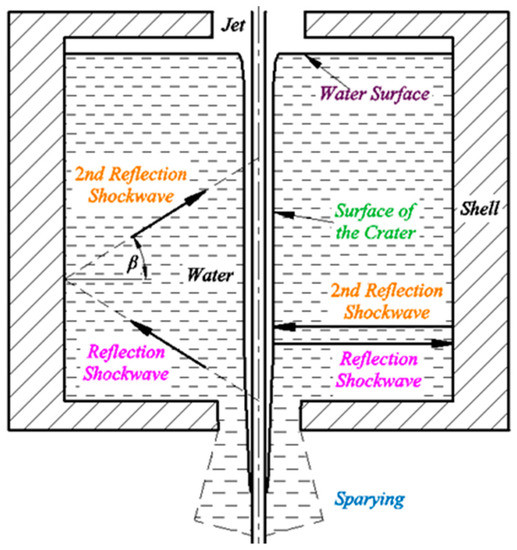
Figure 5.
Schematic of liquid-spraying and propagation path of the secondary reflection shock wave.
After the second and third stages, the liquid in the LFCS radially converges to the jet surface, and the jet carries out the secondary impact on the reflux liquid. However, the crater diameter of liquid secondary reaming is small due to the decrease in the jet impact pressure and the existence of liquid motion inertia, which is ignored in the calculation. Therefore, the initial interference time of the liquid reflux driven by the secondary reflection shock wave to the jet is the time when the secondary reflection shock wave propagates to the jet surface.
According to the geometrical relationship of the propagation path of the secondary reflection shock wave, we can obtain
where and are the propagation times of the shock wave corresponding to the two propagation paths. Considering that the liquid level in the LFCS decreases due to liquid spraying, the following expression should be present:
Then, the minimum and maximum interference velocities of the liquid to the jet driven by the secondary reflection shock wave can be calculated as follows:
In the secondary reflection shock wave interference stage, the velocity interval of the jet disturbed by liquid is . In combination with the analysis of the second and third stages, the velocity interval of the jet disturbed by liquid radial reflux during jet penetration into the LFCS is .
According to the velocity interval of the disturbed jet, the velocity interval of the escaping jet can be obtained, and the residual penetration depth of the jet can be calculated by combining the blast height curve of the SCJ.
3. Simulation Analysis
3.1. Simulation Modeling
The numerical simulation of jet penetration in the liquid-filled single-cell structure (LFSCS) was conducted by using Euler and Euler–Lagrange coupling algorithms with the AUTODYN solver to observe the shock wave propagation and liquid reflux intuitively. The simulation was divided into two stages: (1) The Euler algorithm was used to simulate the jet formation of a φ56 mm shaped charge (SC) [30], (2) the Euler–Lagrange coupling algorithm was adapted to calculate the jet penetration in the LFSCS. In the first stage, one Euler part was built to obtain the formed SCJ. Meanwhile, in the second stage, the formed SCJ in stage 1 was initially mapped to the Lagrange algorithm, and then one Euler part filled with water and another Lagrange part filled with Q235 were established.
The SC finite element models in the numerical research are shown in Figure 6. The diameter and height of the SC were 56 and 73.3 mm, respectively. The thickness of the oxygen-free high-conductivity copper (OFHC) liner was 1 mm. The high explosive of the SC was JH-2, with a density of 1.717 g/cm3. The initiation mode of the SC was top center initiation. The JWL equation of state (EOS) and the shock EOS were adapted for JH-2 and OFHC, respectively. The EOS of air was the ideal gas. The Euler domain was set to a gradient mesh of 0.25 mm × 0.25 mm to 0.25 mm × 1 mm to ensure the accuracy of jet formation.
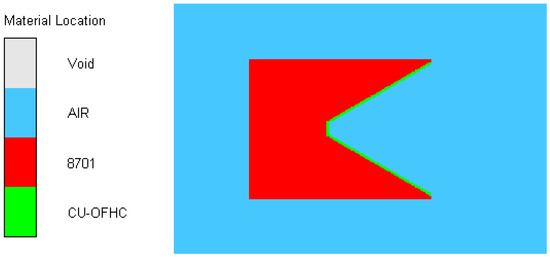
Figure 6.
SC finite element model.
The shape of the SCJ at 24 µs obtained by simulation is shown in Figure 7, and the jet tip velocity was 6506 m/s.
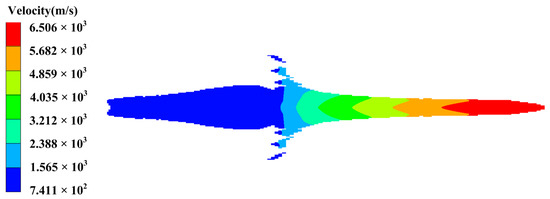
Figure 7.
Jet velocity distribution at 24 µs.
3.2. Simulation Results
The LFSCS 2D finite element models in the numerical research are shown in Figure 8. The LFCS was simplified into an LFSCS, and a side-wall thickness of 25 mm was given to the shell to reduce the deformation, which was consistent with assumption 4 in this study. The liquid cavity radius and depth of the LFSCS were 15 and 70 mm, respectively, and the thickness of the cover and bottom plates were 4 and 10 mm respectively. The liquid and the metal shell of the LFSCS were water and Q235, respectively. The shock EOS was adopted for water and Q235. The material parameters are shown in Table 1, Table 2, Table 3 and Table 4.

Figure 8.
Established simulation model.

Table 1.
Physical properties of the JH-2 explosive.

Table 2.
Physical properties of CU-OFHC.

Table 3.
Physical properties of water.

Table 4.
Physical properties of steel Q235.
The sensitivity of the mesh size was studied through the application of 1, 0.5, and 0.25 mm meshes in the numerical calculation. The calculation shows that the results were significantly different with mesh size reduction from 1 mm to 0.5 mm, while the results stabilized when the mesh size reduced from 0.5 mm to 0.25 mm. Thus, the size of the Euler and Lagrange mesh in the second stage was set to be 0.25 mm × 0.25 mm.
A total of 14 follow-up gauge points were set to obtain the travel trajectory and velocity–time curve of liquid particles. Among these points, gauge points 1 to 8 were set on the jet surface, and gauge points 9 to 14 were set on the liquid material beside the jet penetration channel.
Screenshots of 29, 35, 39, 43, and 47 μs were selected from the simulation calculation results to observe the interaction between the jet and the LFSCS. We can see the propagation of the shock wave and the movement direction of the liquid particles by using the Vector option.
Figure 9 shows the process of the initial shock wave generated in the liquid, the shock wave reflected on the side wall, and the radial reflux of the liquid driven by the reflection shock wave when the jet penetrated the LFSCS.
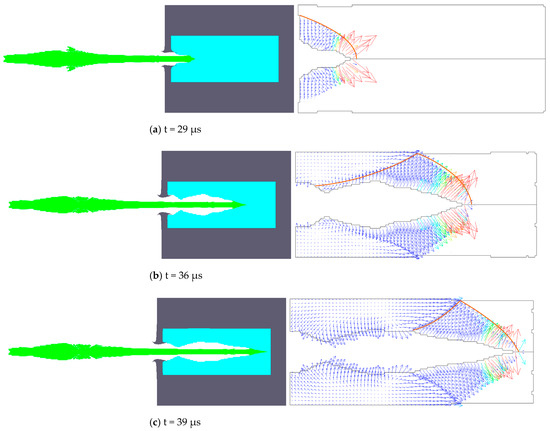
Figure 9.
Generation and propagation of the initial shock wave and side-wall reflection shock wave (the orange curve represents the shock wave front).
Figure 9a demonstrates that the velocity direction of the liquid particle behind the shock wave front changes with the propagation direction of the shock wave, which is between the normal direction of the Mach angle and the radial direction. Figure 9b shows that the side-wall reflection shock wave propagated in the opposite direction, and the common points of the incident and reflection waves moved along the side-wall surface at a certain speed at 36 μs. Figure 9c shows that the velocity direction of the liquid particles after the side-wall reflection shock wave front was vertical-inward at 39 μs. This result is because the side-wall reflection shock wave propagates to the liquid crater wall and drives the liquid particles to radially converge to the SCJ surface.
At 43 μs, the jet penetrated the bottom plate of the LFSCS, and the shock wave was reflected on the bottom plate surface to produce the reflection shock wave (see Figure 10). At this point, the side-wall and the bottom plate reflection shock wave simultaneously propagate in the liquid. Under the influence of the bottom plate reflection shock wave and the pressure difference between inside and outside, the bottom liquid begins to converge in the radial direction. Thereafter, the reflux liquid impinges on the jet, which interferes with the stability of the tip of the jet.

Figure 10.
Generation and propagation of the bottom plate reflection shock wave.
The bottom plate reflection wave is reflected from the side wall to form a secondary reflection wave. The secondary reflection wave propagates in the liquid until it reaches the liquid crater wall to drive the liquid to converge and disturb the jet. Figure 11 depicts that the upper part of the liquid converged to contact with the jet surface, and the jet carried out the secondary impact on the reflux liquid. However, the crater diameter of liquid secondary reaming is small due to the decrease in the jet impact pressure and the existence of liquid motion inertia, which is ignored in the calculation.

Figure 11.
Propagation of the side-wall secondary reflection shock wave.
The position, pressure, speed, and other parameters of the gauge points were obtained by using the data export function of the software. The position–time relationship curves of gauge points 9, 10, and 11 were plotted to obtain the motion trajectory of the three gauge points, as shown in Figure 12. The follow-up gauge point in the liquid goes through the reaming and reflux processes and then continues to oscillate but only slightly. Moreover, the trajectories of the three points are similar.
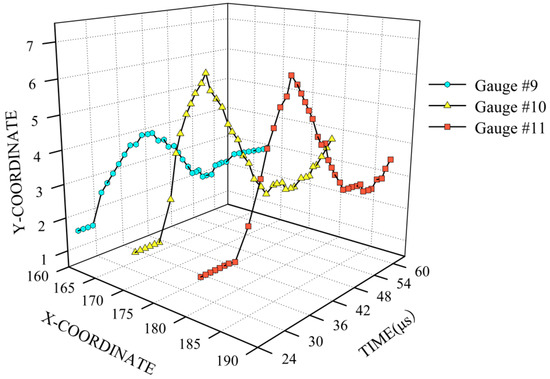
Figure 12.
Trajectory of gauge points 9, 10 and 11.
In addition, the relation curve between velocity and time in the y-direction at gauge point 12 and the pressure stroke curve at gauge point 2 were drawn. Figure 13 shows that the liquid particles fell into low oscillation after reaming and radial reflux, and the reflux velocity of the liquid particles was approximately 500 m/s. The pressure–time curve at gauge point 2 in Figure 14 demonstrates the appearance of a pressure peak in approximately 48 s, which lasted for a period and then oscillated back down. Therefore, gauge point 2 on the jet surface is under the impact of liquid reflux. At this time, the pressure of jet particles at this position sharply increases under the action of liquid reflux, and the jet is prone to necking fracture.
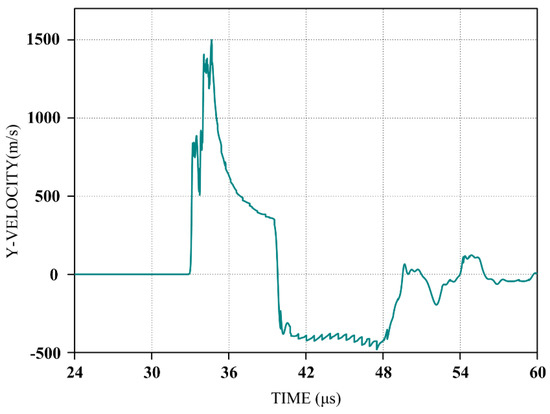
Figure 13.
Y-velocity–time curve at gauge point 12.
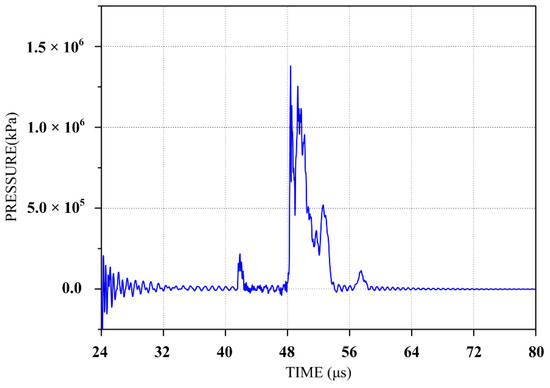
Figure 14.
Pressure–time curve at gauge point2.
The simulation results demonstrate the generation and propagation of the initial shock wave, side-wall reflection wave, bottom plate reflection wave, side-wall secondary reflection wave, and reflux of liquid particles driven by the shock wave. The simulation results verify the previous theoretical analysis. Specifically, the interference of liquid in the jet includes the following three parts: side-wall reflection interference, bottom plate reflection interference, and side-wall secondary reflection interference.
4. Experiments and Calculation
4.1. X-ray Experiment
X-ray tests were conducted on the process of jet penetration in the LFCS to verify the accuracy of the theoretical model.
The size parameters of the LFCS used in the test are shown in Figure 15. The LFCS mainly consisted of a metal shell with a cavity, a liquid filler, a cover plate, and a sealing strip, which were connected by screws. Here, the liquid filler was water, while the shell material was steel Q235. The jet tip velocity of the φ56 mm shaped charge used in the test was 6700 m/s, and the tail velocity was 1200 m/s. At 30 μs, the jet tip radius was 1 mm and the tail was 7 mm. The stand-off was 80 mm.
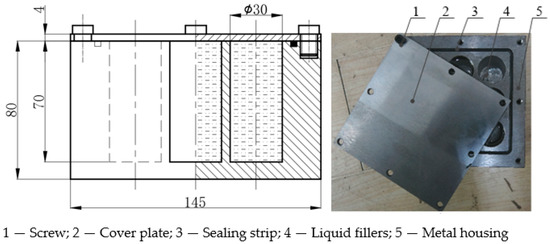
Figure 15.
Schematic and physical drawing of the liquid-filled composite structure (LFCS).
The X-ray test was arranged according to Figure 16, Figure 17 and Figure 18, where the distance between the bottom of the LFCS and the horizontal ground was , the magnification factor was and , and the light-emitting time of the two X-ray machines was and , respectively. Parameters of the X-ray test layout are shown in Table 5.
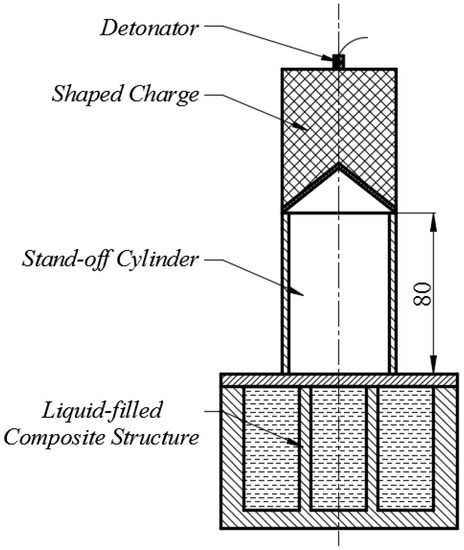
Figure 16.
Schematic of the interaction between projectile and target.
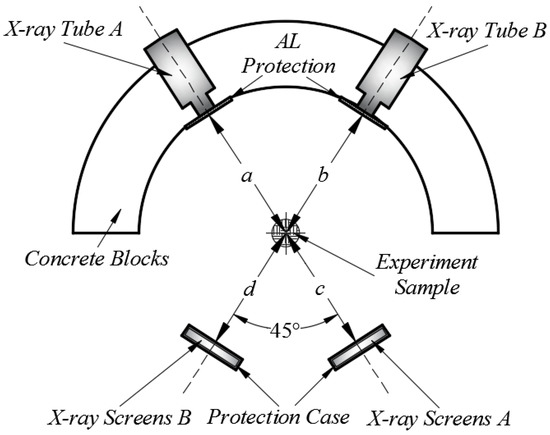
Figure 17.
Schematic of the X-ray experiment layout.
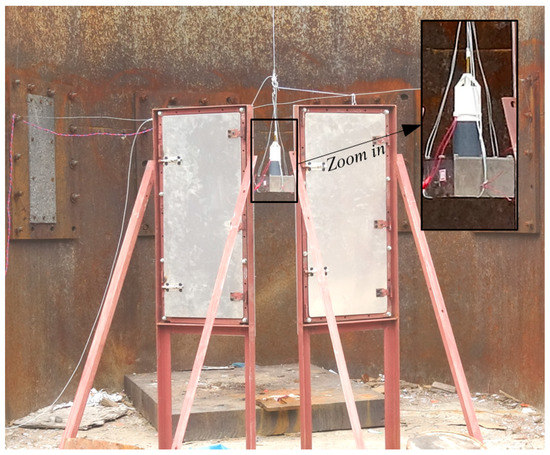
Figure 18.
Site layout of the X-ray experiment.

Table 5.
X-ray test layout parameters.
The two times of the X-ray machine emission were 60 and 80 μs. The jet shape captured by the X-ray machine is shown in Figure 19.
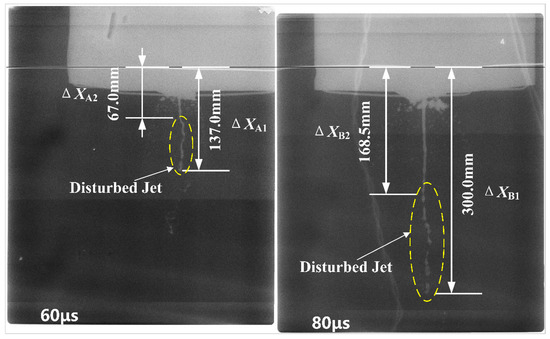
Figure 19.
X-ray test results.
The X-ray images at 60 μs showed that the tip of the jet was disturbed when the SCJ penetrated the LFCS, and necking and lateral deviation appeared. The undisturbed jet continued to extend over time due to the high velocity and velocity gradient of the SCJ, and the distance between the broken jets also increased. X-ray images at 80 μs showed that the fracture and lateral deviation of the jet further intensified, while the jet at the back part maintained good continuity and collimation, which is in good agreement with the analysis in this study.
According to the X-ray images, we can calculate the velocity interval of the SCJ disturbed by liquid radial reflux. Taking the marked lines as a reference, the measured distance between the tip of the jet and the marked line is at 60 μs and at 80 μs, while the measured distance between the tail of the disturbed jet and the marked line is at 60 μs and at 80 μs. Therefore, the distance of the tip of jet movement within the time range is , while the distance of the tail of disturbed jet movement within the time range is , so the velocity of the tip of the jet, , and the tail of the disturbed jet, , can be calculated as
where , , and .
Accordingly, it can be calculated that the velocity interval of the disturbed jet is [3389.9, 5456.7] m/s.
4.2. DOP Experiment
A static penetration test of the jet-penetrating liquid composite target was conducted to further verify the theoretical model. The field layout of the DOP experiment is shown in Figure 20. The SCJ and the LFCS used in the experiment were consistent with the X-ray experiment. The stand-off was still set to 80 mm, and the distance from the LFCS to the witness target was set to 90 mm. The results of the two experiments are shown in Figure 21.
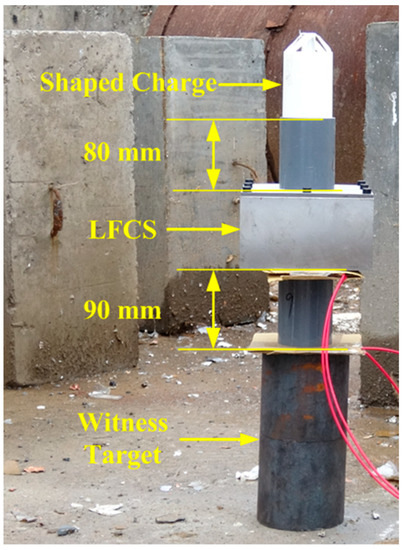
Figure 20.
Field layout of the DOP experiment.
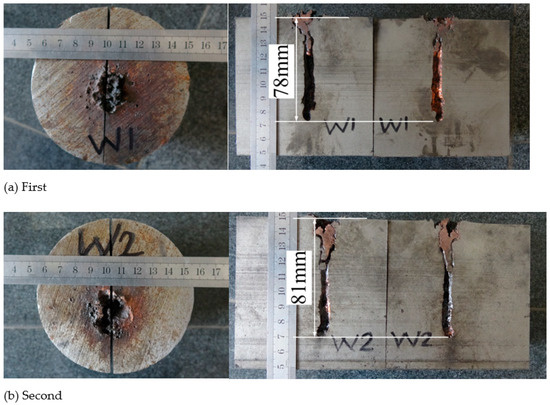
Figure 21.
Diagram of the DOP experimental results.
Figure 21 shows the formation of craters and penetration channels on the witness target after jet penetration in the LFCS. The residual penetration depths after the jet penetrated the LFCS filled with water were 78 and 81 mm based on two repeated tests. Craters were scattered on the surface of the witness target due to the tip of the disturbed jet caused by liquid radial reflux, leading to the failure of effective penetration. This also proves that the jet interfered by liquid radial reflux loses its penetrating capability.
4.3. Comparison between Experimental and Theoretical Results
The calculated results of the theoretical model in this study were compared with those of the X-ray and DOP experiments to verify the reliability of the theoretical model. Table 6 provides the velocity interval of the disturbed jet and the residual penetration depth calculated by the theoretical model established in this study and the results of the X-ray and DOP tests.

Table 6.
Comparison between the theoretical calculation results and the experimental results.
The velocity interval of the disturbed jet and the residual penetration of the jet calculated by using the theoretical model established in this paper is in good agreement with the X-ray test value, and the error is within a reasonable range. Among the findings, the error between the calculated minimum interference velocity and the test value was 7.6%, that between the calculated maximum interference velocity and the test value was 2.5%, and that between the calculated residual penetration value and the test value was 4.0%. The results demonstrate the reliability of the theoretical calculation model established in this study.
5. Conclusions
Considering the interference of liquid radial reflux driven by the bottom plate reflection shock wave on the jet and the change in sound velocity when the liquid is compressed, the process of jet penetration in the LFCS is divided in this study into the following five stages: jet penetration in the cover plate, jet reaming in the liquid, side-wall reflection interference, bottom plate reflection interference, and liquid spraying and side-wall secondary reflection interference. The theoretical calculation model of the velocity interval of the disturbed jet and residual penetration depth of jet is established, and the conclusions are as follows.
- (1)
- The interference of liquid radial reflux in the SCJ mainly comprises three parts: side-wall reflection interference, bottom plate reflection interference, and side-wall secondary reflection interference. The bottom plate reflection interference has observed interference on the tip of the SCJ.
- (2)
- The interference jet velocity interval during jet penetration in the LFCS is based on the theoretical model, and the residual penetration depth can be calculated through its combination with the stand-off curve of the jet.
- (3)
- Theoretical analysis and experimental results show that the LFCS has interference on the head of the SCJ. Thus, applying the LFCS to extreme protection fields, such as ammunition safety protection, is possible.
- (4)
- The theoretical model established in this study is suitable for calculating the interference process of the LFCS with a Newtonian liquid in the SCJ to predict the anti-jet capacity of the LFCS.
Author Contributions
Conceptualization, Y.T.; methodology, Y.C.; validation, X.Z.; writing—original draft preparation, Y.C.; writing—review and editing, X.Z. and Z.H. All authors have read and agreed to the published version of the manuscript.
Funding
This research was funded by the Jiangsu Province Graduate Research and Practice Innovation Program (grant no. KYCX20_0308) and the National Natural Science Foundation of China (grant no. 11602110).
Institutional Review Board Statement
Not applicable.
Informed Consent Statement
Not applicable.
Data Availability Statement
Data are contained within this article; more detailed data can be obtained from the corresponding author.
Conflicts of Interest
The authors declare no conflict of interest.
Abbreviations
| penetration depth of the SCJ in liquid | |
| residual velocity after jet penetration into the cover plate | |
| coordinate value of the virtual origin | |
| stand-off | |
| thickness of the LFCS panel | |
| thickness of the bottom plate of the LFCS | |
| density of the liquid | |
| density of the SCJ | |
| residual velocity of the jet that penetrates the liquid | |
| time of jet penetration into the liquid | |
| crater radius of the liquid | |
| wall pressure of the liquid crater | |
| penetration dynamic pressure | |
| reaming pressure of the crater | |
| radius of the jet | |
| density of the liquid at atmospheric pressure | |
| crater formed by the jet | |
| penetration velocity of the jet | |
| sound velocity of the liquid | |
| velocity of the shock wave | |
| normal direction of the Mach angle | |
| initial shock wave propagation along the radial direction | |
| , | propagation times of the shock wave in two different directions |
| radius of the inner cavity of the shell | |
| closing pressure of the crater | |
| intensity of the side-wall reflection shock wave | |
| reflection coefficient of the shock wave | |
| closing velocity of the liquid particle | |
| material constant of the liquid | |
| time for the liquid particle to move from the crater wall to the jet surface | |
| , | times of liquid movements to the jet surface corresponding to the two propagation paths |
| , | jet velocities at the positions where the liquid converges to the jet surface |
| intensity of the bottom reflection shock wave at the crater wall | |
| liquid closing speed of the crater wall at the bottom of the LFCS | |
| time for the bottom plate reflection shock wave to propagate to the crater wall | |
| liquid closing time | |
| maximum velocity of the interference jet at the bottom plate reflection interference stage | |
| height of the liquid level drop caused by liquid spraying | |
| liquid-spraying velocity | |
| reaming area of the bottom plate | |
| liquid-spraying time | |
| , | propagation times of the shock wave corresponding to the two propagation paths |
| height of the inner cavity of the shell | |
| Mach angle | |
| minimum interference velocities of the liquid to the jet driven by the secondary reflection shock wave | |
| maximum interference velocities of the liquid to the jet driven by the secondary reflection shock wave | |
| distance between the bottom of the LFCS and the horizontal ground | |
| , | corresponding magnification factors of X-ray tubes A and B, respectively |
| , | exposure times of X-ray tubes A and B, respectively |
| distance of the jet movement within the time range |
References
- Fuhs, A.E.; Ball, R.E.; Power, L.H. FY73 Hydraulic Ram Studies; Naval Postgraduate School: Monterey, CA, USA, 1973. [Google Scholar]
- Fourest, T.; Laurens, J.M.; Deletombe, E.; Dupas, J.; Arrigoni, M. Analysis of bubbles dynamics created by hydrodynamic ram in confined geometries using the rayleigh–plesset equation. Int. J. Impact Eng. 2014, 73, 66–74. [Google Scholar] [CrossRef]
- Fourest, T.; Laurens, J.M.; Deletombe, E.; Arrigoni, M.; Dupas, J. Cross validation of analytical and finite element models for Hydrodynamic Ram loads prediction in thin walled liquid filled containers. J. Fluids Struct. 2015, 59, 285–296. [Google Scholar] [CrossRef]
- Varas, D.; López-Puente, J.; Zaera, R. Experimental analysis of fluid-filled aluminum tubes subjected to high-velocity impact. Int. J. Impact Eng. 2009, 36, 81–91. [Google Scholar] [CrossRef] [Green Version]
- Lecysyn, N.; Bony-Dandrieux, A.; Aprin, L.; Heymes, F.; Slangen, P.; Dusserre, G.; Munier, L.; Le Gallic, C. Experimental study of hydraulic ram effects on a liquid storage tank: Analysis of overpressure and cavitation induced by a high-speed projectile. J. Hazard. Mater. 2010, 178, 635–643. [Google Scholar] [CrossRef] [PubMed] [Green Version]
- Sauer, M. Simulation of high velocity impact in fluid-filled containers using finite elements with adaptive coupling to smoothed particle hydrodynamics. Int. J. Impact Eng. 2011, 38, 511–520. [Google Scholar] [CrossRef]
- Disimile, P.J.; Toy, N. Liquid spurt caused by hydrodynamic ram. Int. J. Impact Eng. 2015, 75, 65–74. [Google Scholar] [CrossRef]
- Disimile, P.J.; Davis, J.; Toy, N. Mitigation of shock waves within a liquid filled tank. Int. J. Impact Eng. 2011, 38, 61–72. [Google Scholar] [CrossRef]
- Chen, A.; Li, X.; Zhou, L.; Ji, Y. Study of liquid spurt caused by hydrodynamic ram in liquid-filled container. Int. J. Impact Eng. 2020, 144, 103658. [Google Scholar] [CrossRef]
- Ji, Y.; Li, X.; Zhou, L.; Lan, X.; Chen, A. Comparison of the hydrodynamic ram caused by one and two projectiles impacting water-filled containers. Int. J. Impact Eng. 2020, 137, 103467. [Google Scholar] [CrossRef]
- Ji, Y.; Li, X.; Zhou, L.; Lan, X. Review of study on hydrodynamic ram effect generated due to high-velocity penetrator impacting fluid-filled container. J. Vib. Shock 2019, 38, 242–252. (In Chinese) [Google Scholar]
- Held, M.; Backofen, J.E. Penetration of shaped charge into water. Presented at the 12th International Symposium on Ballistics, San Antonio, TX, USA, 30 October–1 November 1990. [Google Scholar]
- Lee, E.S.; Oh, K.H.; Song, S.Y. Penetration of particulated shaped charge jet into water. In Proceedings of the 21st International Congress on: High-Speed Photography and Photonics, Taejon, Korea, 30 May 1995; pp. 975–981. [Google Scholar]
- White, J.J.; Wahll, M.J. Shaped charge jet interactions with liquids. In Proceedings of the 6th International Symposium on Ballistics, Orlando, FL, USA, 27–29 October 1981; pp. 554–561. [Google Scholar]
- Held, M. Verification of the equation for radial crater growth by shaped charge jet penetration. Int. J. Impact Eng. 1995, 17, 387–398. [Google Scholar] [CrossRef]
- Held, M.; Huang, N.S.; Jiang, D.; Chang, C.C. Determination of the crater radius as a function of time of a shaped charge j et that penetrates water. Propellants Explos. Pyrotech. 1996, 21, 64–69. [Google Scholar] [CrossRef]
- Andersson, G.; Karlsson, S.; Watterstam, A. Shaped charge jet interaction with confined water. In Proceedings of the 17th International Symposium on Ballistics, Midrand, South Africa, 23–27 March 1998; pp. 183–190. [Google Scholar]
- Li, Y.; Gao, F.; Wang, C.; Gao, J. Engineering algorithm for a new type of protective armor disturbing jet penetration. Acta Armamentarii 2002, 23, 546–550. (In Chinese) [Google Scholar]
- Gao, Z.Y.; Huang, Z.X.; Guo, M.; Zu, X.D.; Xiao, Q.Q.; Jia, X. Theoretical Study of a Diesel-Filled Airtight Structure Unit Subjected to Shaped Charge Jet Impact. Propellants Explos. Pyrotech. 2016, 41, 62–68. [Google Scholar] [CrossRef]
- Gao, Z.; Huang, Z.; Guo, M.; Zu, X.; Xiao, Q.; Jia, X. Anti-penetration performance analysis of diesel oil filled airtight structures against shaped charge jet. J. Vib. Shock 2016, 35. (In Chinese) [Google Scholar] [CrossRef]
- Zhang, X.; Zu, X.; Huang, Z.; Xiao, Q.; Jia, X. Analysis of liquid-filled unit cell structure subjected to shaped charge jet impact. Explos. Shock Waves 2017, 37, 1101–1106. (In Chinese) [Google Scholar]
- Zhang, X.; Zu, X.; Huang, Z.; Xiao, Q.; Jia, X. Interference Characteristics of Liquid Composite Armor of Cell Structure against Jet. Ordnance Ind. Autom. 2017, 11, 70–75. (In Chinese) [Google Scholar]
- Zu, X.; Dai, W.; Huang, Z.; Yin, X. Effects of Liquid Parameters on Liquid-Filled Compartment Structure Defense against Metal Jet. Materials 2019, 12, 1809. [Google Scholar] [CrossRef] [Green Version]
- Tan, Y.; Jia, X.; Huang, Z.; Cai, Y.; Zu, X. Effect of Liquid Parameters on Protective Performance of a Liquid Composite Target Subjected to Jet Impact. In Proceedings of the 15th Hypervelocity Impact Symposium, Destin, FL, USA, 14–19 April 2019. [Google Scholar] [CrossRef]
- Guo, M.; Zu, X.D.; Shen, X.J.; Huang, Z.X. Study on liquid-filled structure target with shaped charge verticality penetration. Def. Technol. 2019, 15, 861–867. [Google Scholar] [CrossRef]
- Guo, M.; Zu, X.-d.; Huang, Z.-x.; Shen, X.-j. Mechanism of hermetic single-cell structure interfering with shaped charge jet. Lat. Am. J. Solids Struct. 2018, 15. [Google Scholar] [CrossRef]
- Zu, X.D.; Huang, Z.X.; Guan, Z.W.; Yin, X.C.; Zheng, Y.M. Influence of a liquid-filled compartment structure on the incoming shaped charge jet stability. Def. Technol. 2021, 17, 571–582. [Google Scholar] [CrossRef]
- Dowson, D.; Higginson, G.R. Elasto-Hydrodynamic Lubrication: International Series on Materials Science and Technology; Elsevier: Amsterdam, The Netherlands, 2014. [Google Scholar]
- Oertel, H., Jr. Prandtl’s Essentials of Fluid Mechanics; Science Press: Beijing, China, 2008. [Google Scholar]
- Cai, Y.E.; Huang, Z.X.; Shen, X.J.; Zu, X.D.; Jia, X.; Ji, Q. Simulation Study on the influence of liquid level on anti-jet penetration ability of single-cell composite structure. J. Phys. Conf. Ser. 2020, 1507, 032050. [Google Scholar] [CrossRef]
Publisher’s Note: MDPI stays neutral with regard to jurisdictional claims in published maps and institutional affiliations. |
© 2021 by the authors. Licensee MDPI, Basel, Switzerland. This article is an open access article distributed under the terms and conditions of the Creative Commons Attribution (CC BY) license (https://creativecommons.org/licenses/by/4.0/).