
Adaptative Cover to Achieve Thermal Comfort in Open Spaces of Buildings: Experimental Assessment and Modelling


 , ,
, ,
Abstract
:1. Introduction
1.1. Context
1.2. Main Considerations of Thermal Comfort in Open Spaces
1.3. Bioclimatic Techniques
1.4. Active Surfaces (Cooling and Heating Ceiling Pannel)
1.5. Aims and Originality
2. Materials: System Description and Experimental Set-Up
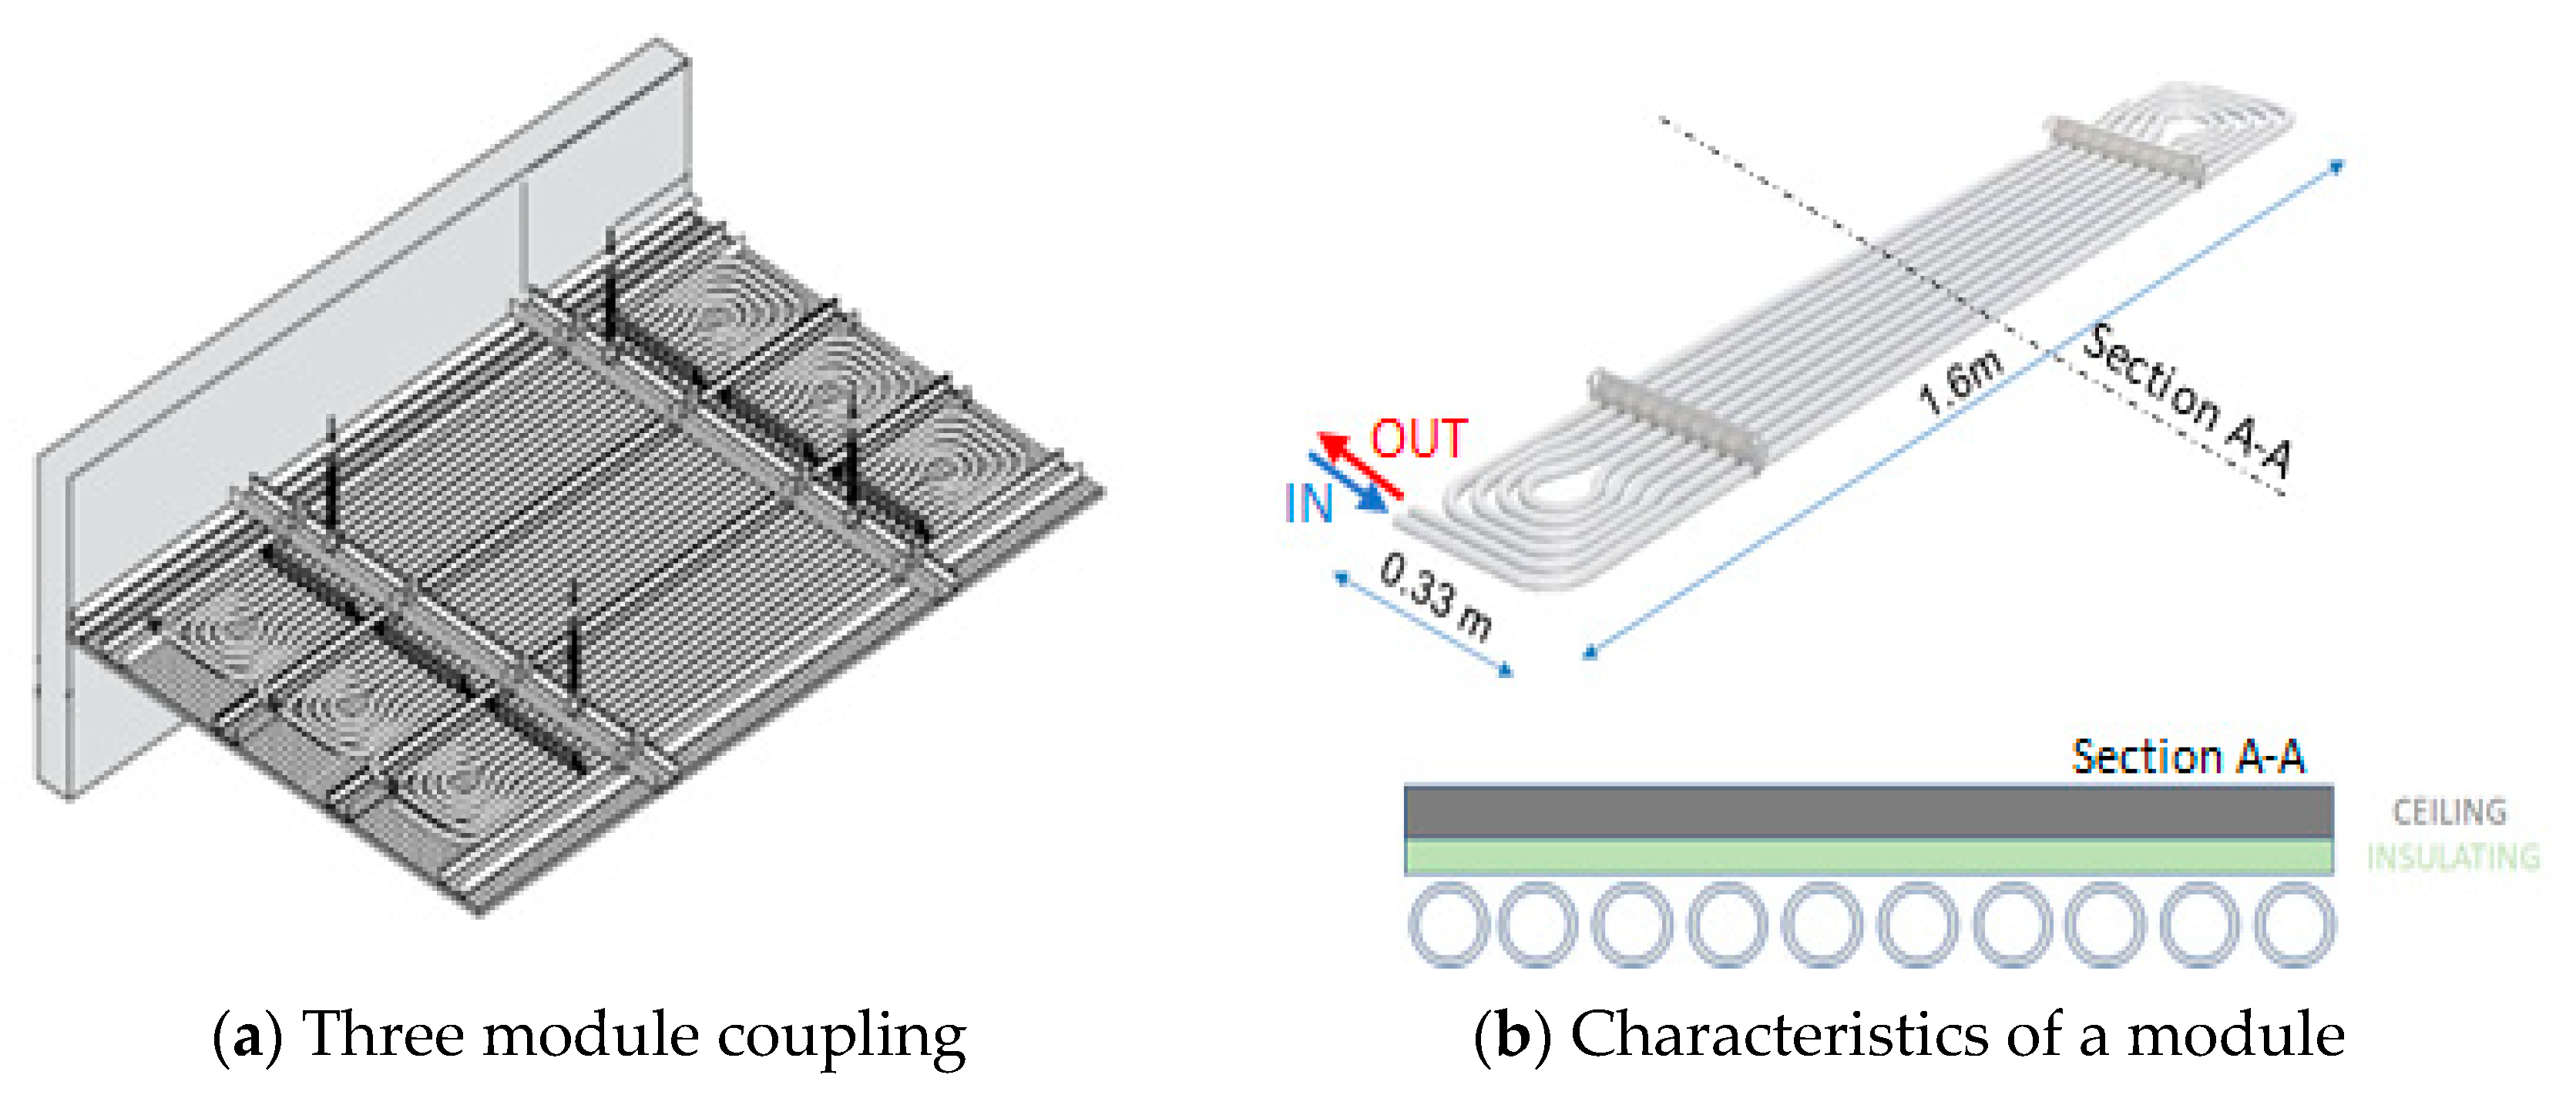
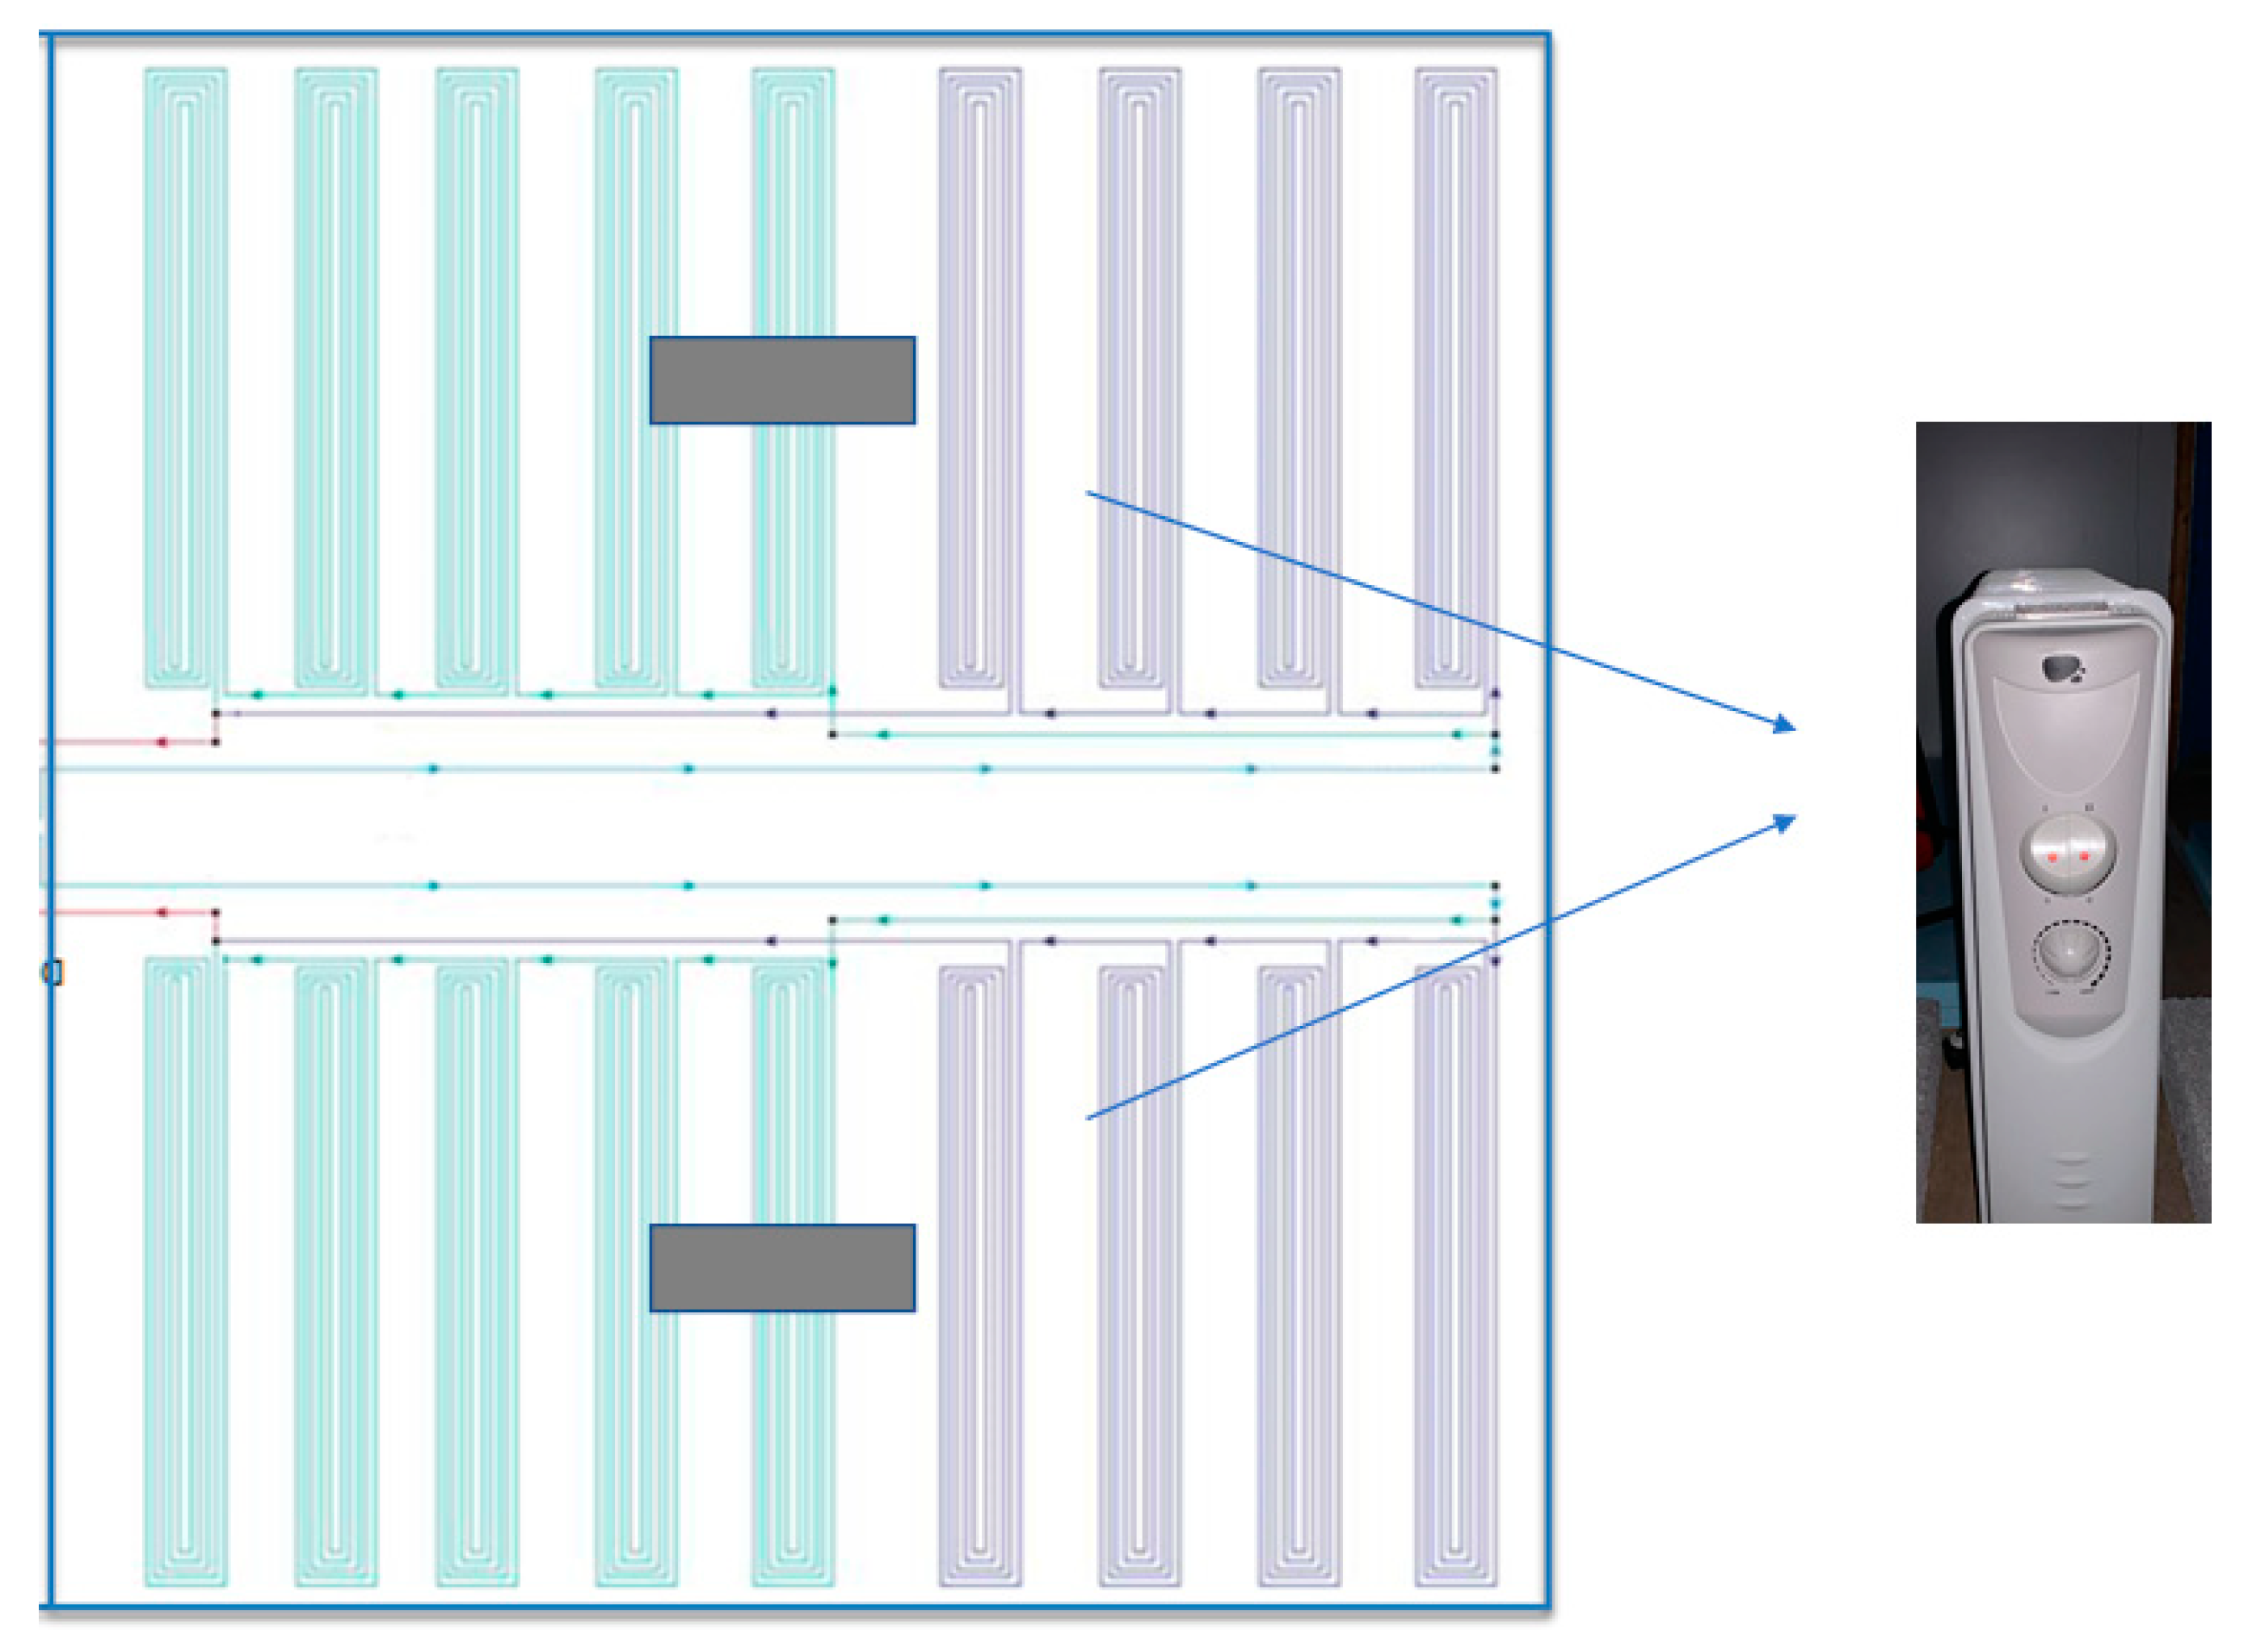
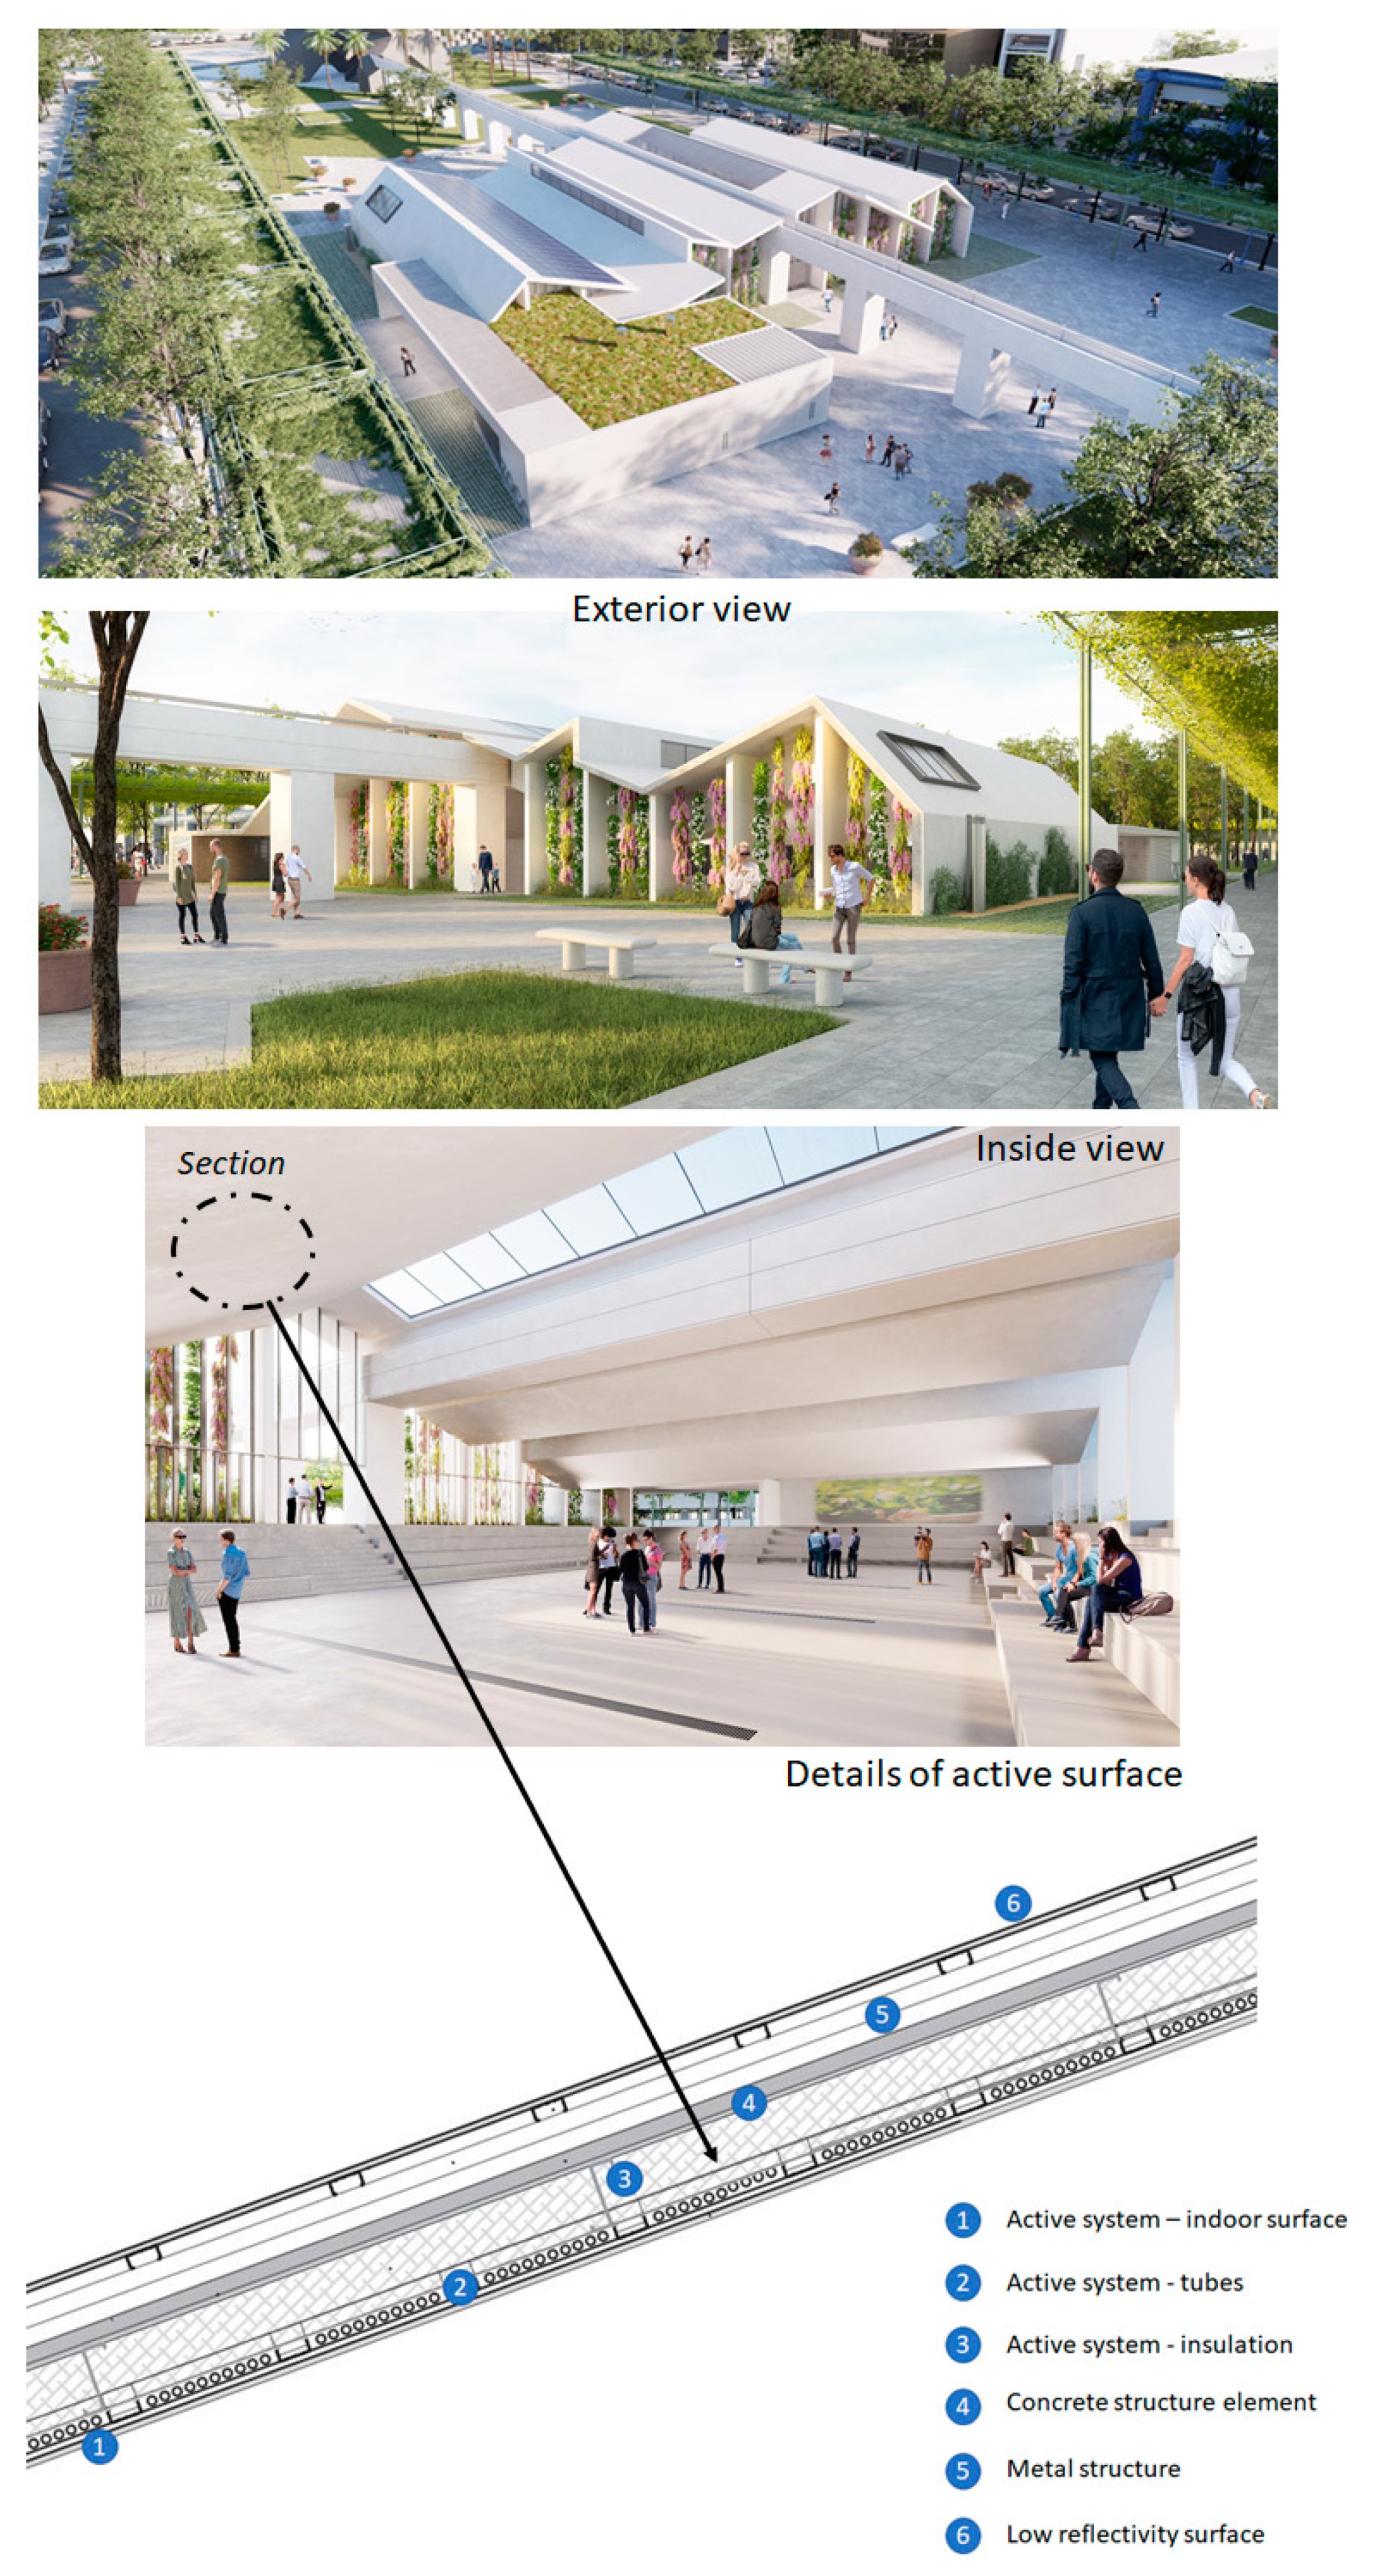
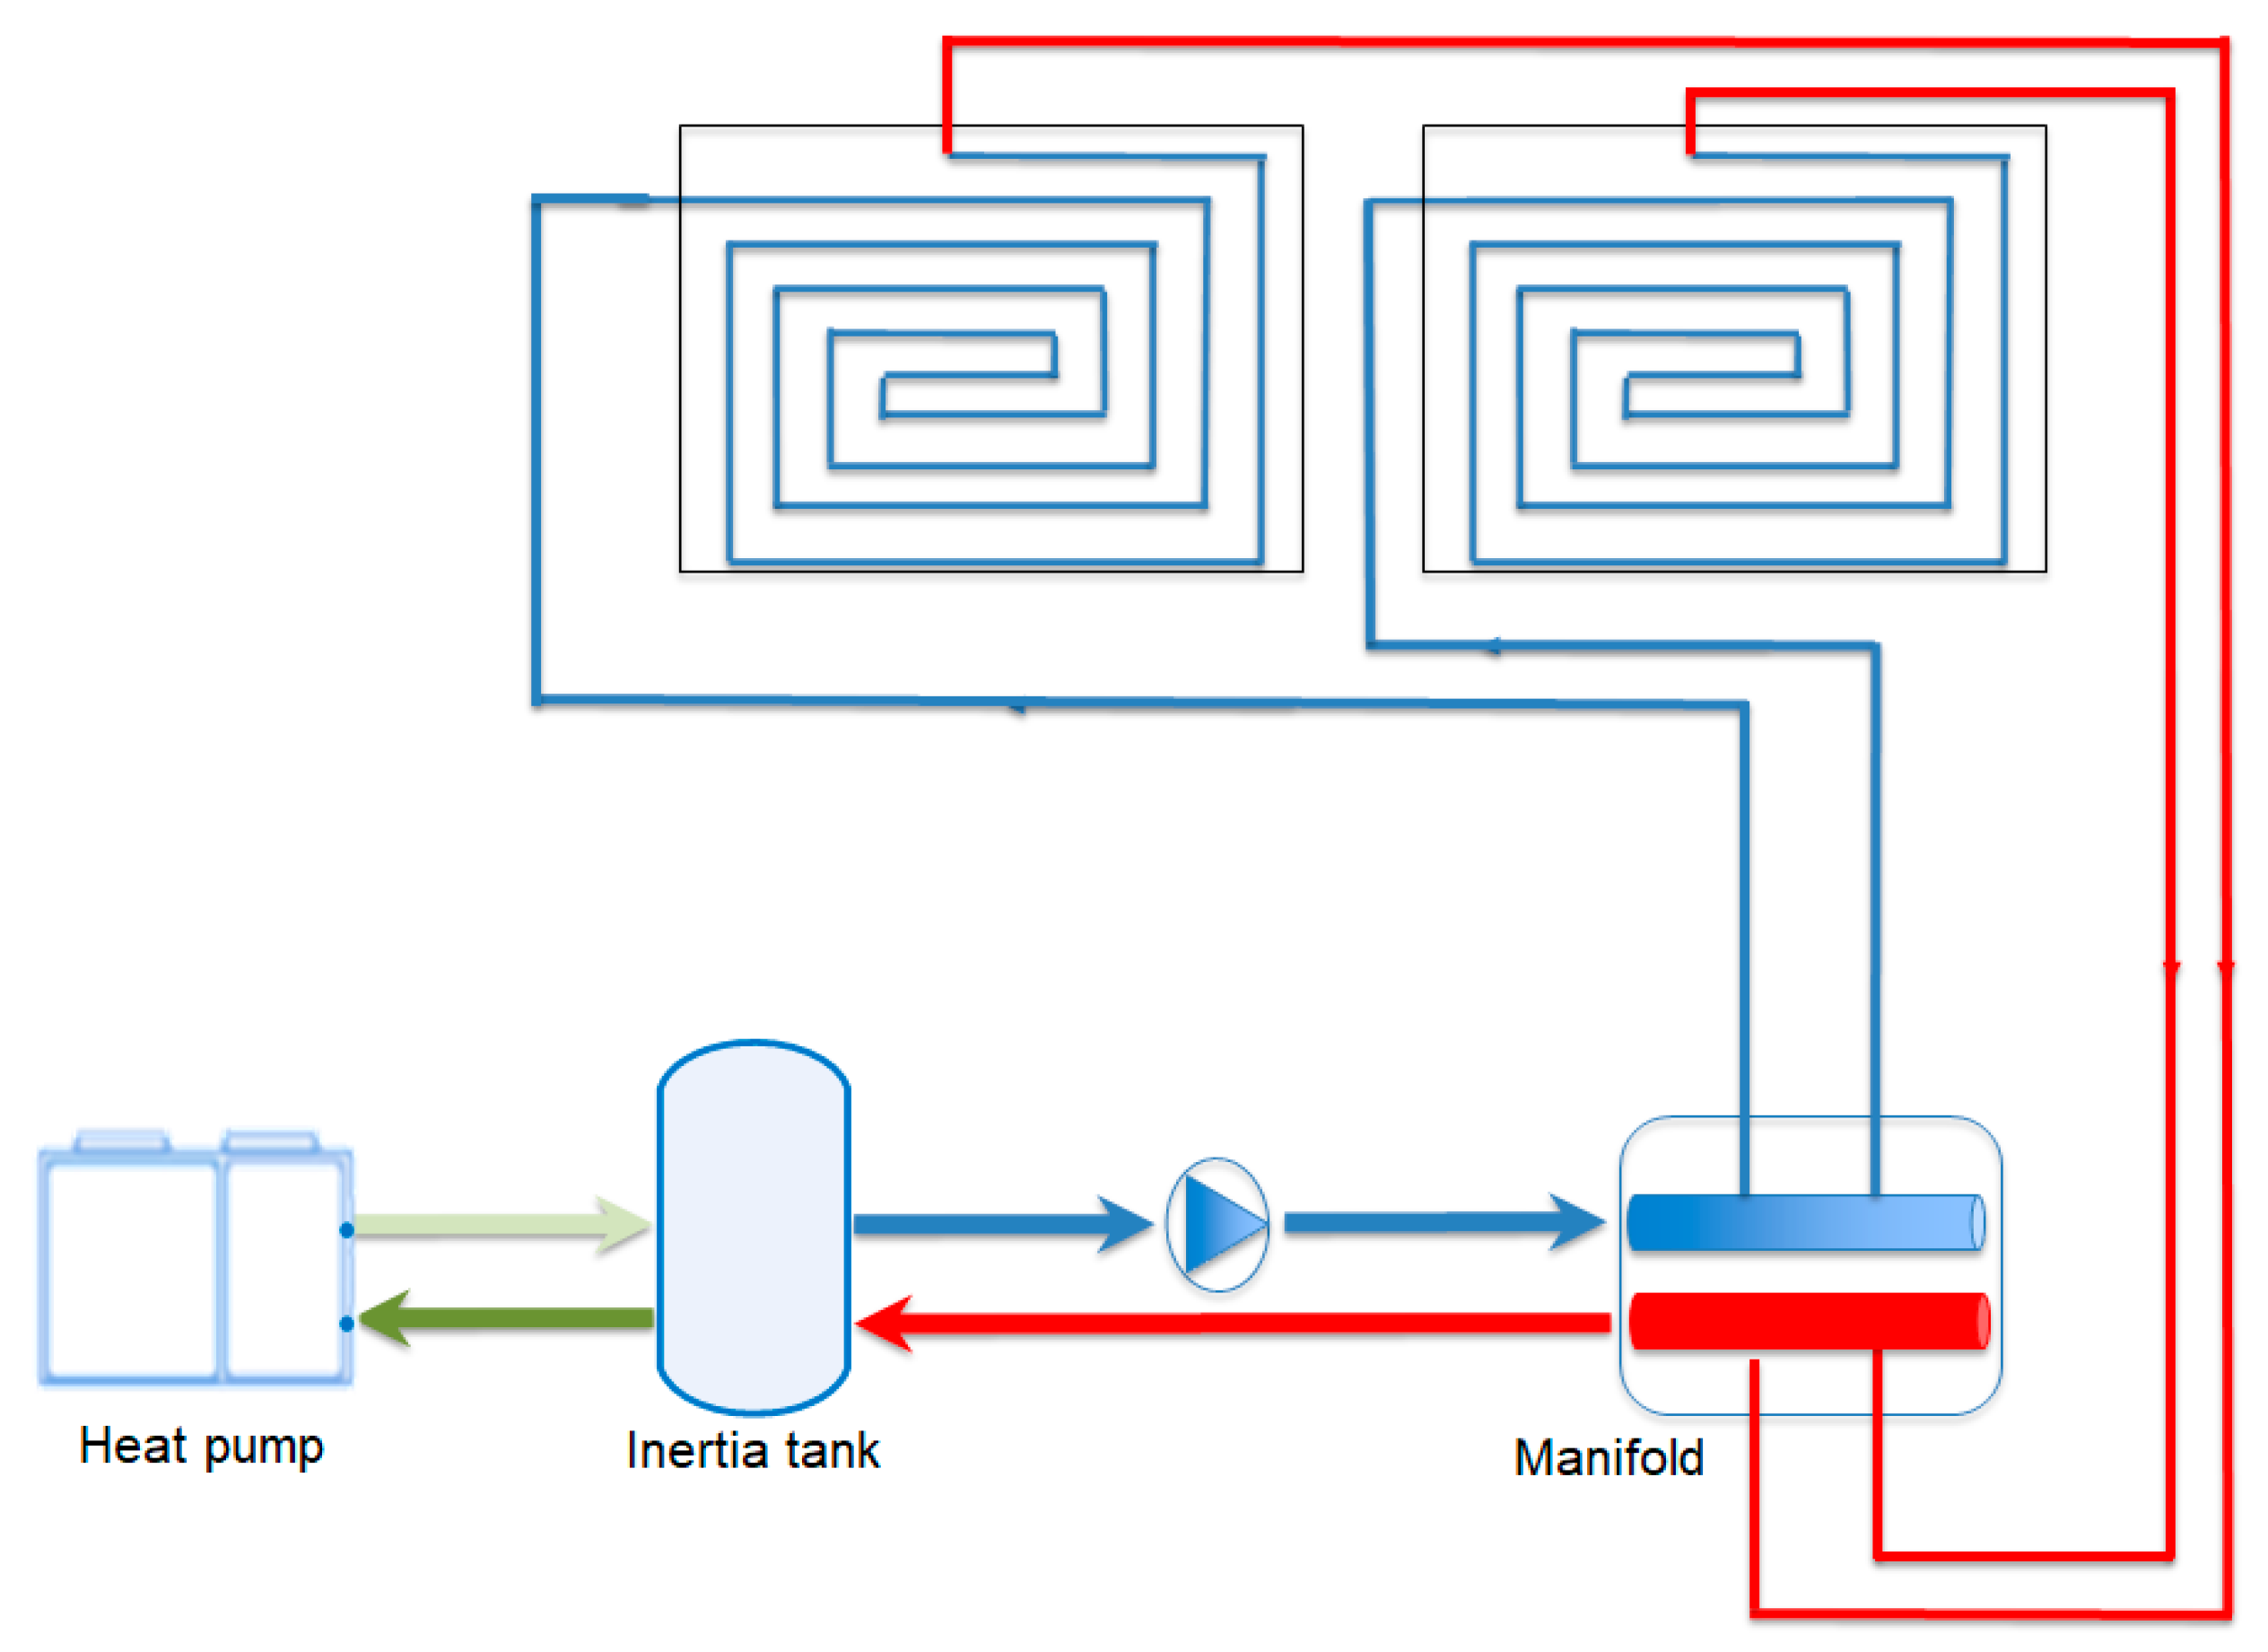
2.1. System
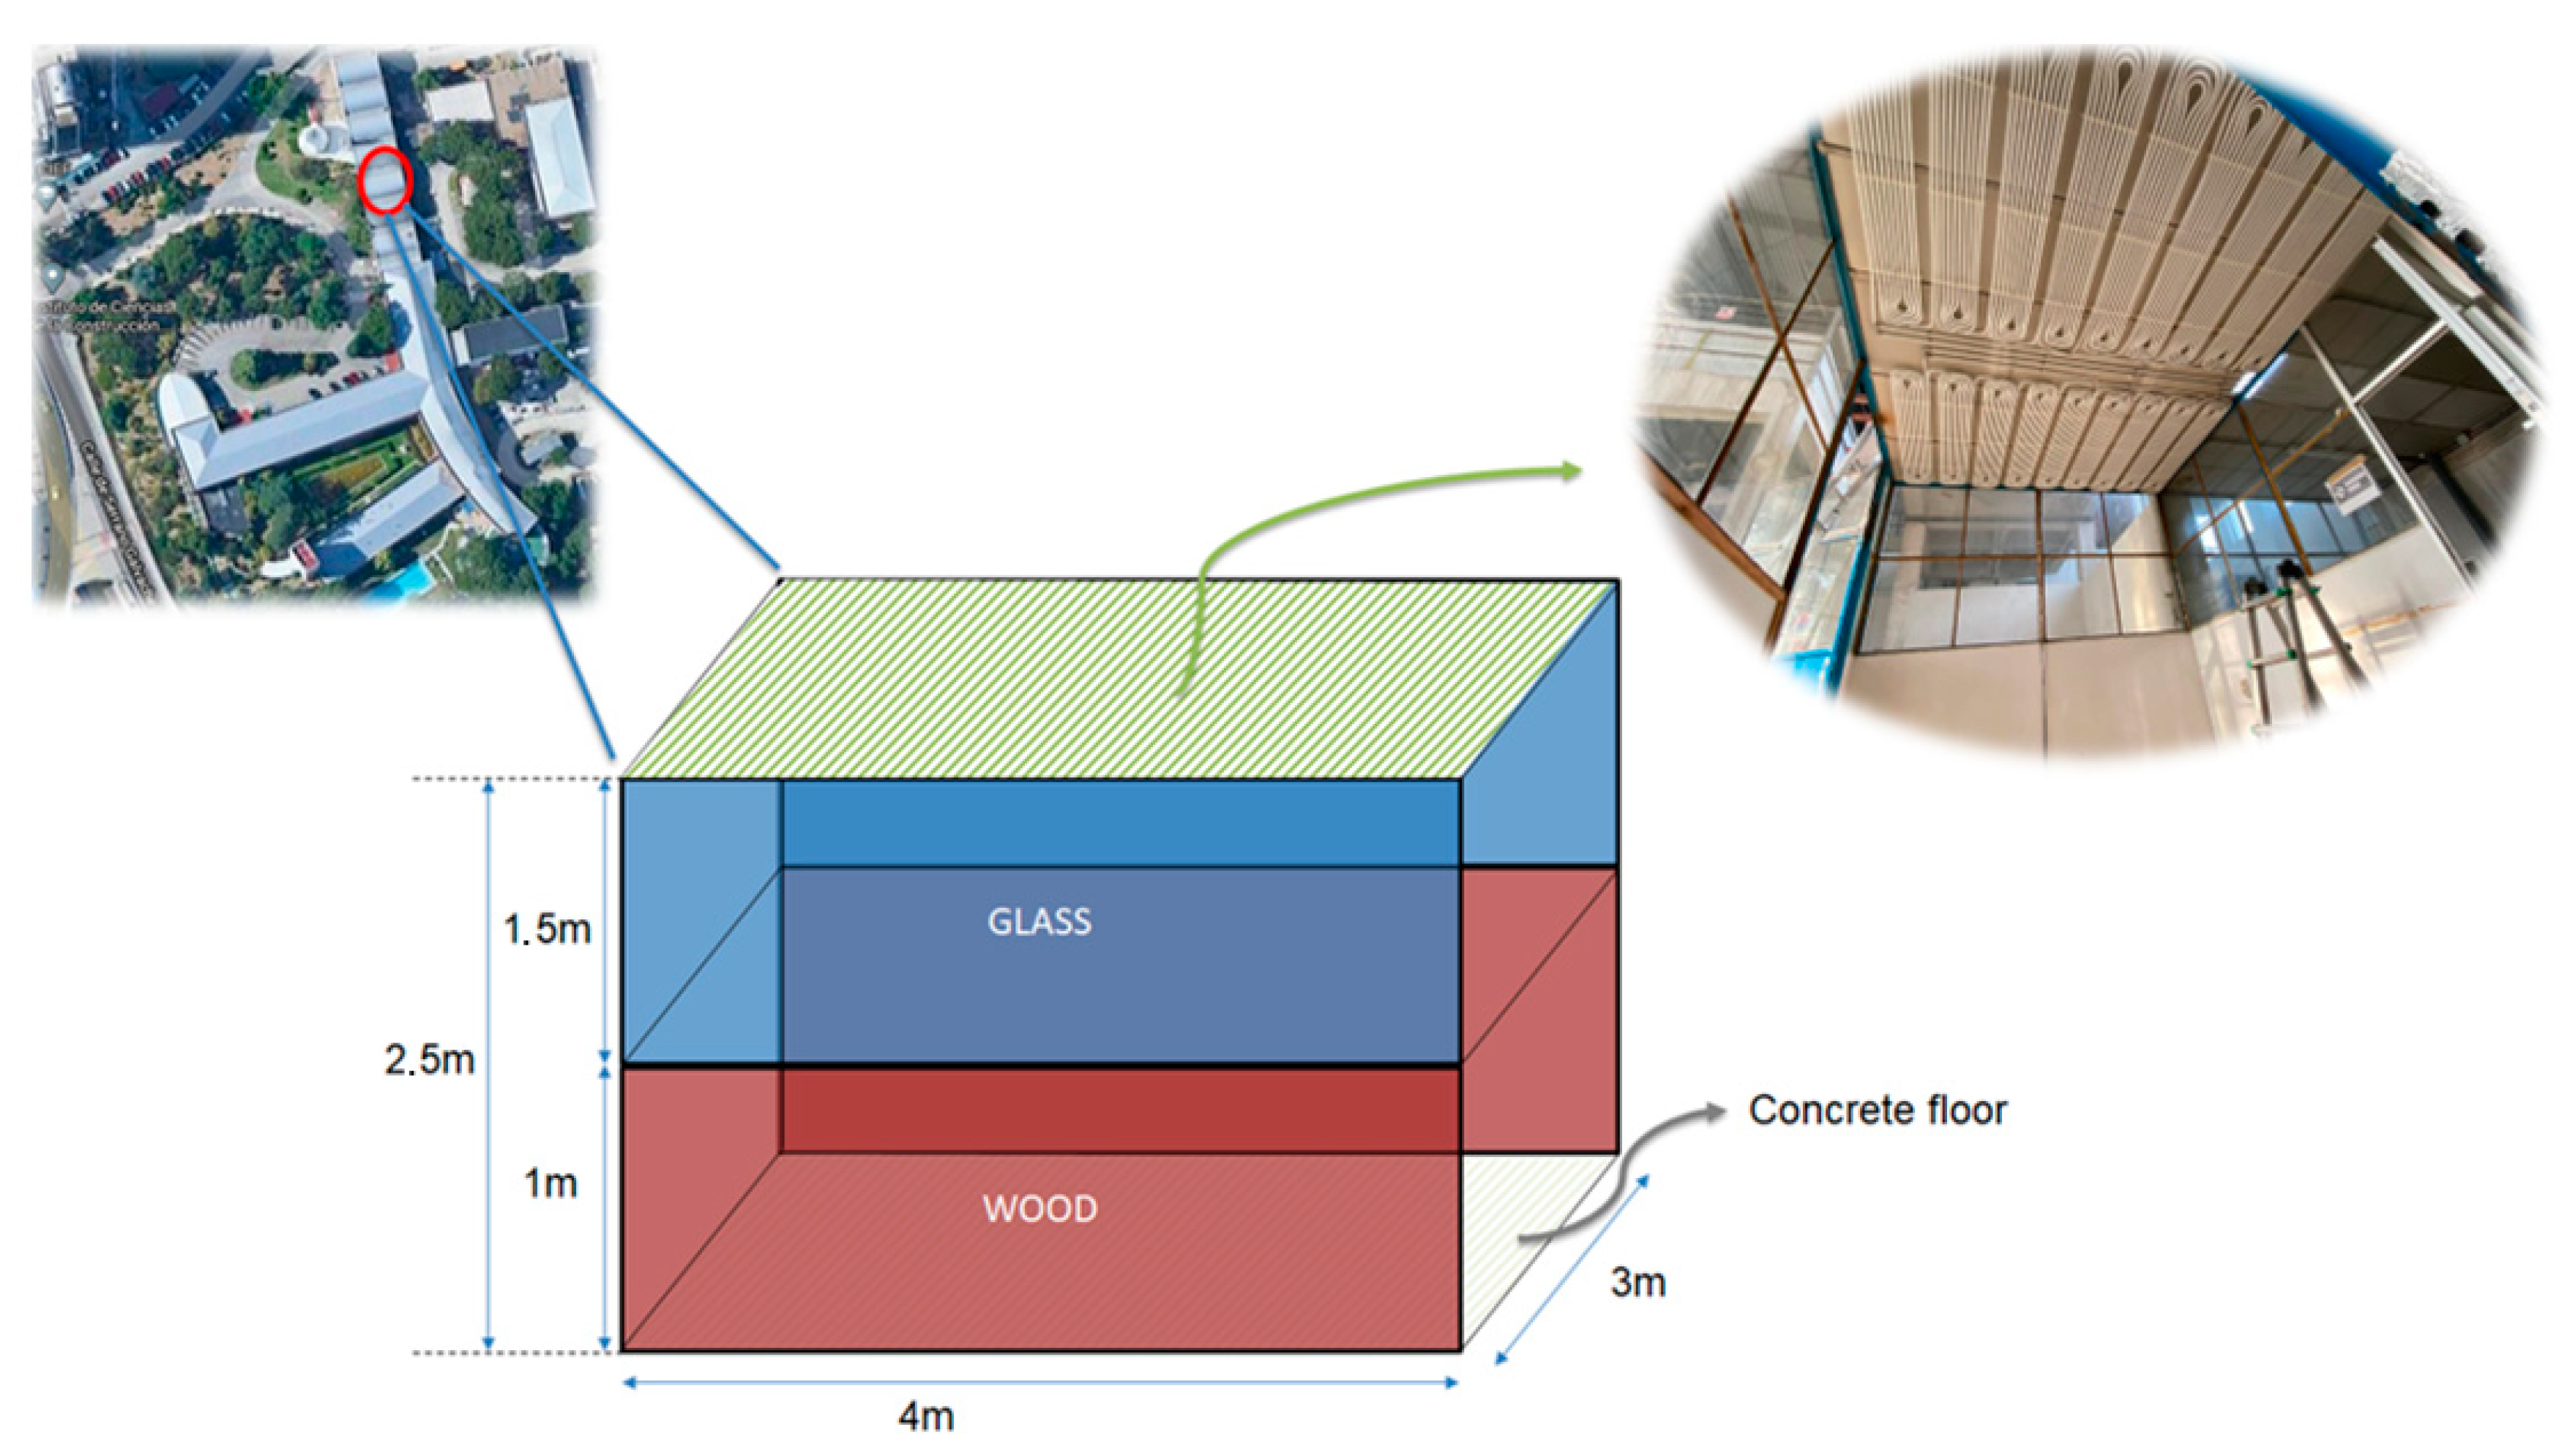
2.2. Experimental Facility
- Test cell cover: The radiant solution covered 10.5 m2 of the total gross surface, where the remaining 1.5 m2 corresponded to the space occupied by the impulsion and return pipes. The space between the roof and the radiant solution was fully insulated by 12 cm thick extruded panels.
- Walls of the test cell: The space walls were made of wood up to 1 m high and glass up to 2.5 m high. All walls were insulated from the outside by 8 cm thick extruded honeycombs.
- Test cell floor: the cement floor was entirely covered by 8 cm thick extruded insulation panels.
2.3. Overview of the Experimental Set-Up: Test Cell
2.4. Test Programme
- Both the ambient temperature and the average radiant temperature were not controlled. Only thermal excitation was carried out using a 4 kW fan coil and 1.2 kW radiators to simulate internal gains (conditions similar to the summer season). The temperature of the water in the tank was controlled. The heat pump cooled the water in the tank to the lowest possible temperature to obtain large temperature gradients between the average radiant temperature and the ambient temperature concerning the average temperature of the water that circulated through the radiant solution.
- The adjustable variable was the flow. Each mode described below was tested under a range of flow rates between 2 and 8 . These values corresponded to the total water flow.
3. Methods: Characterisation Model
3.1. Theoretical Basis
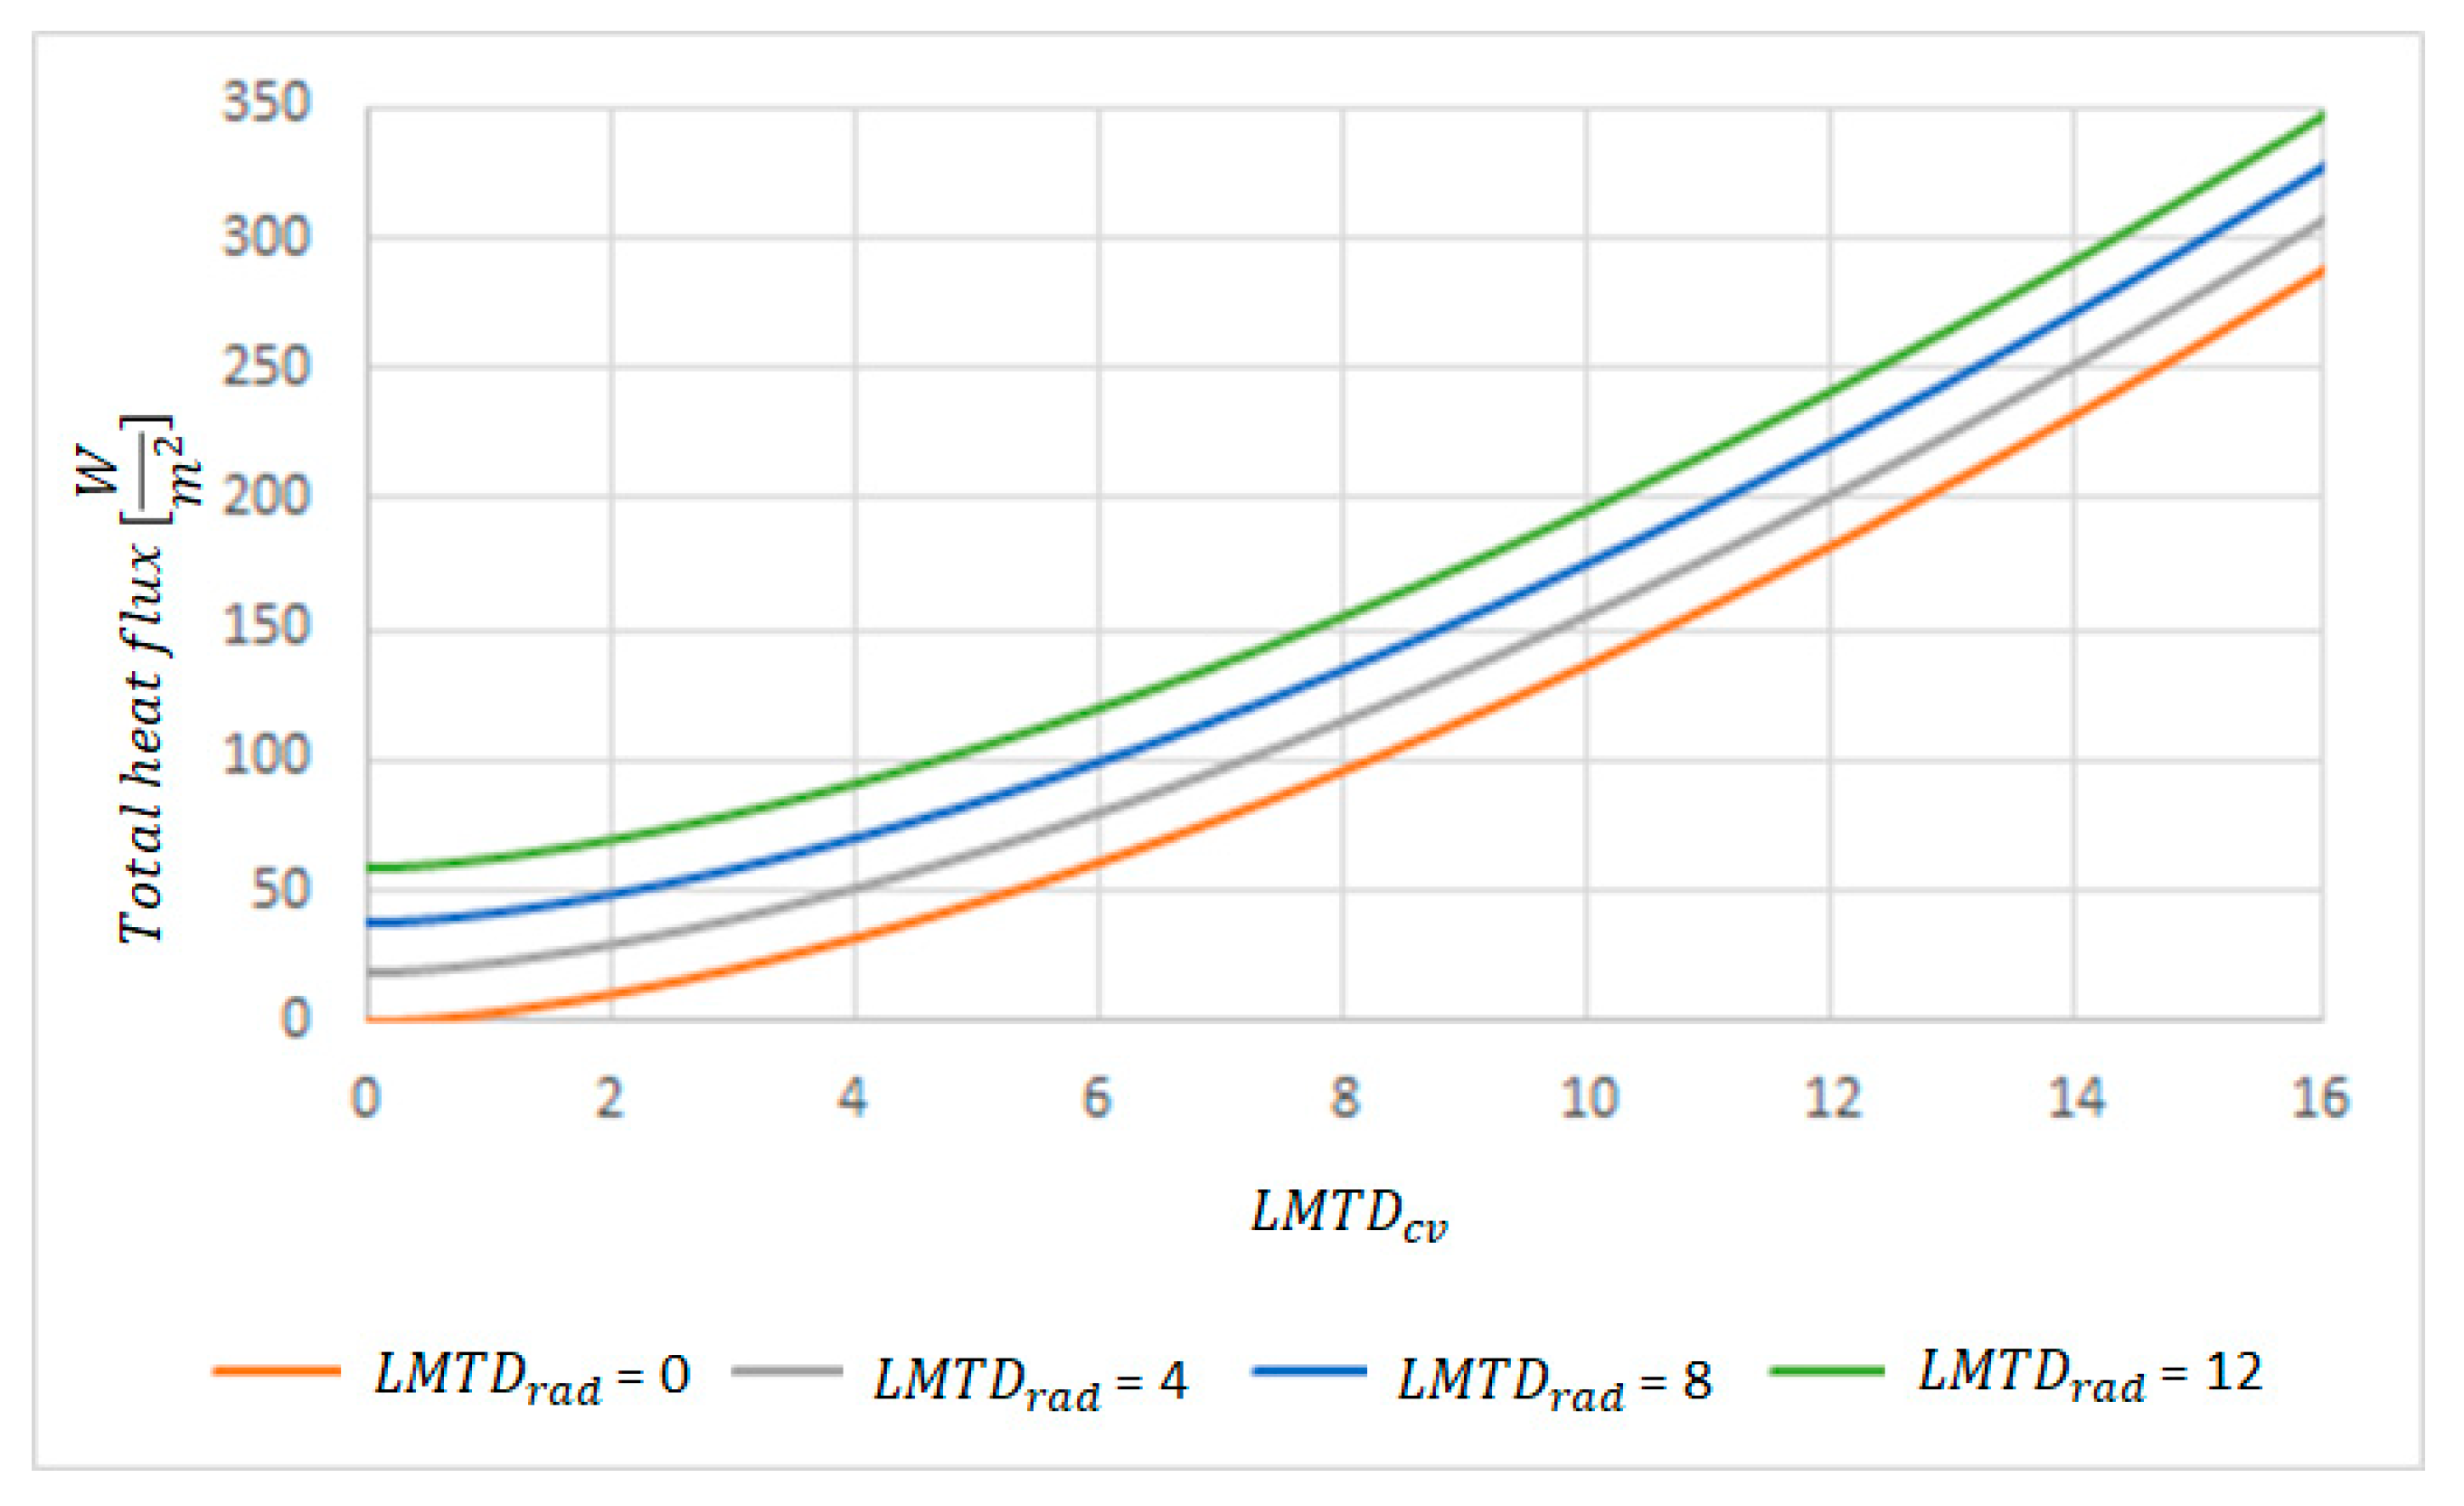
3.2. Model
4. Results
4.1. Analysis of a Typical Test
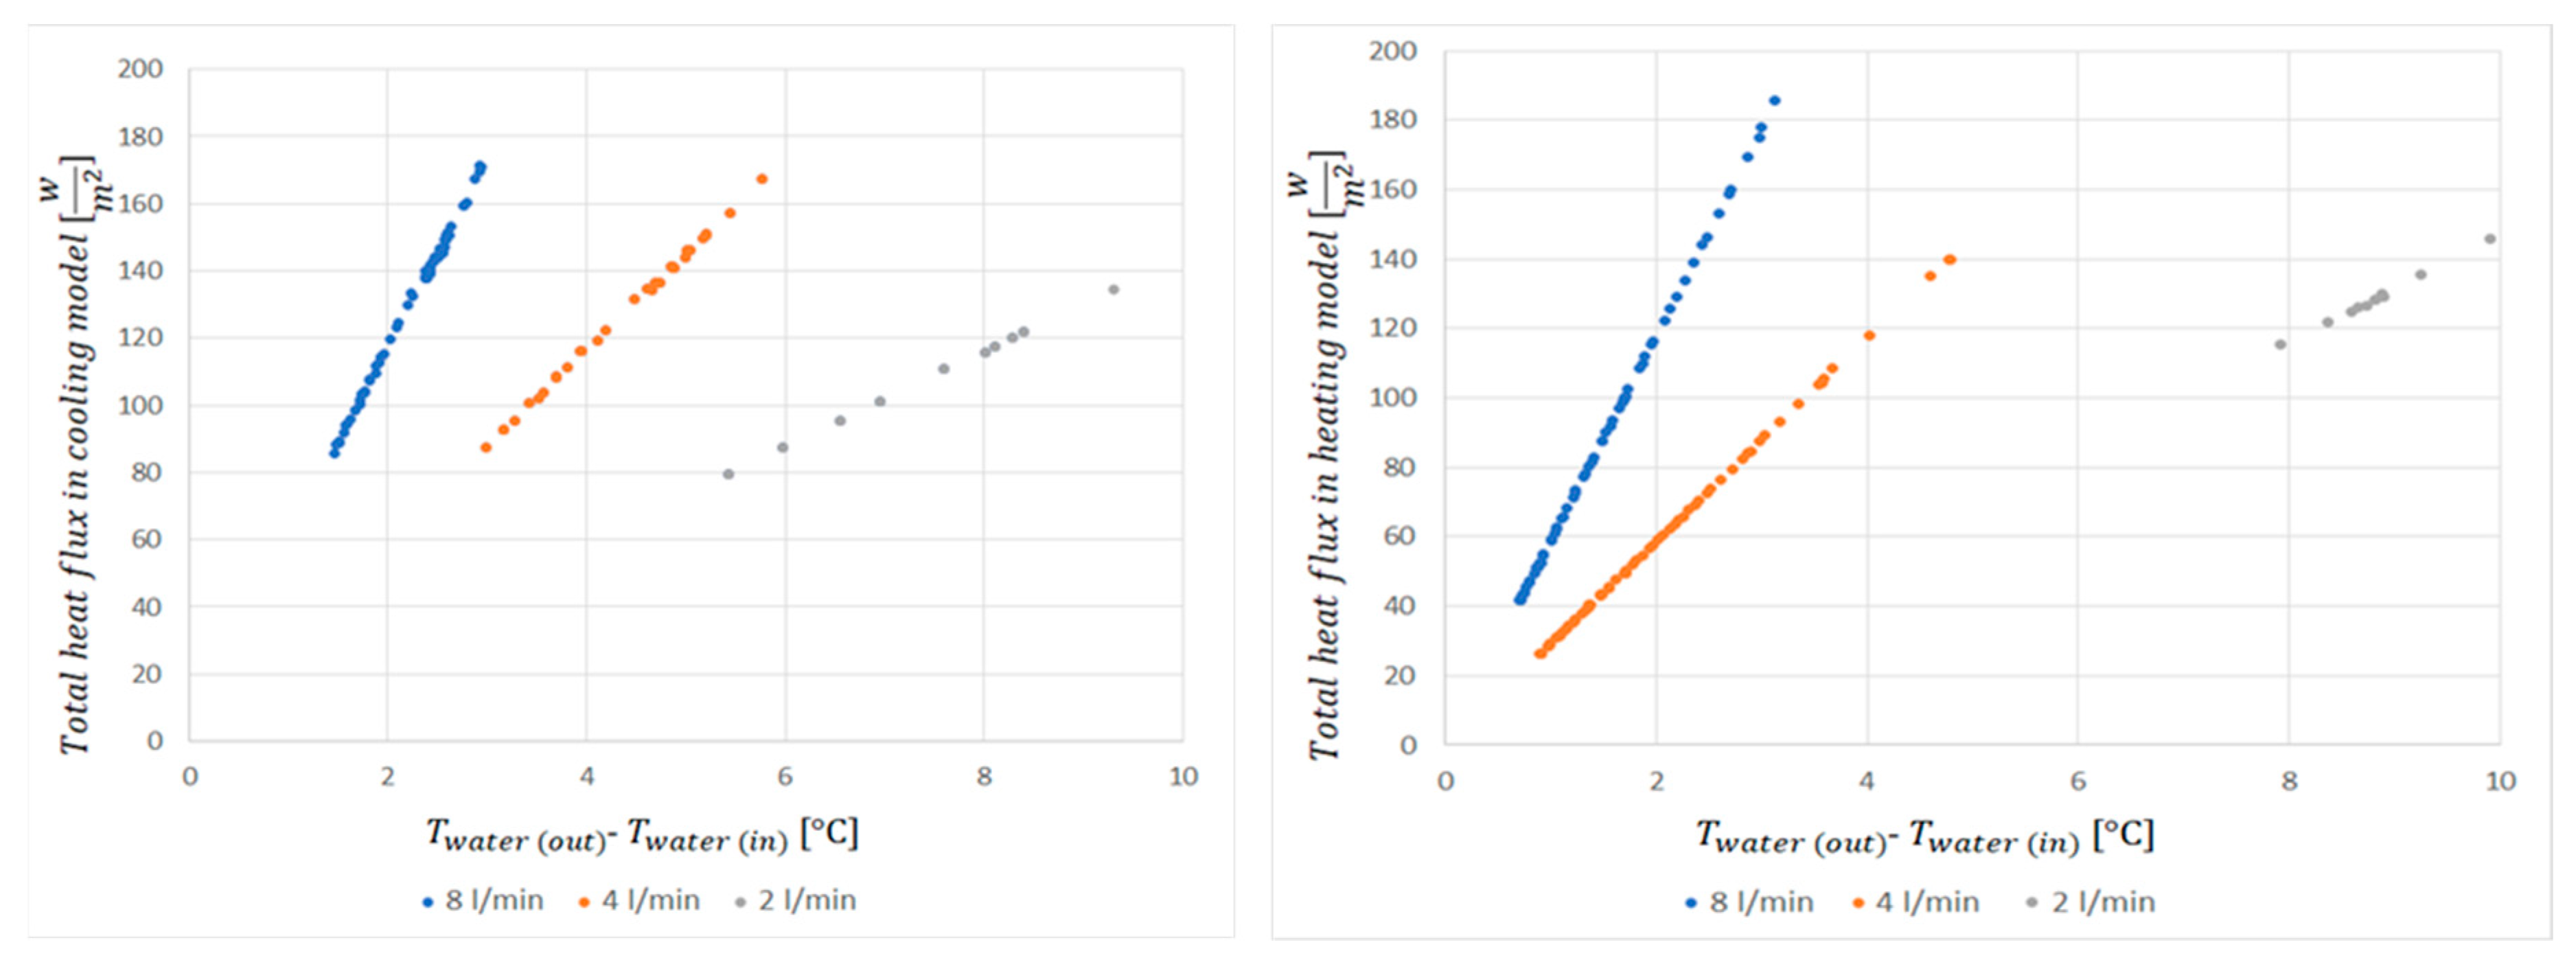
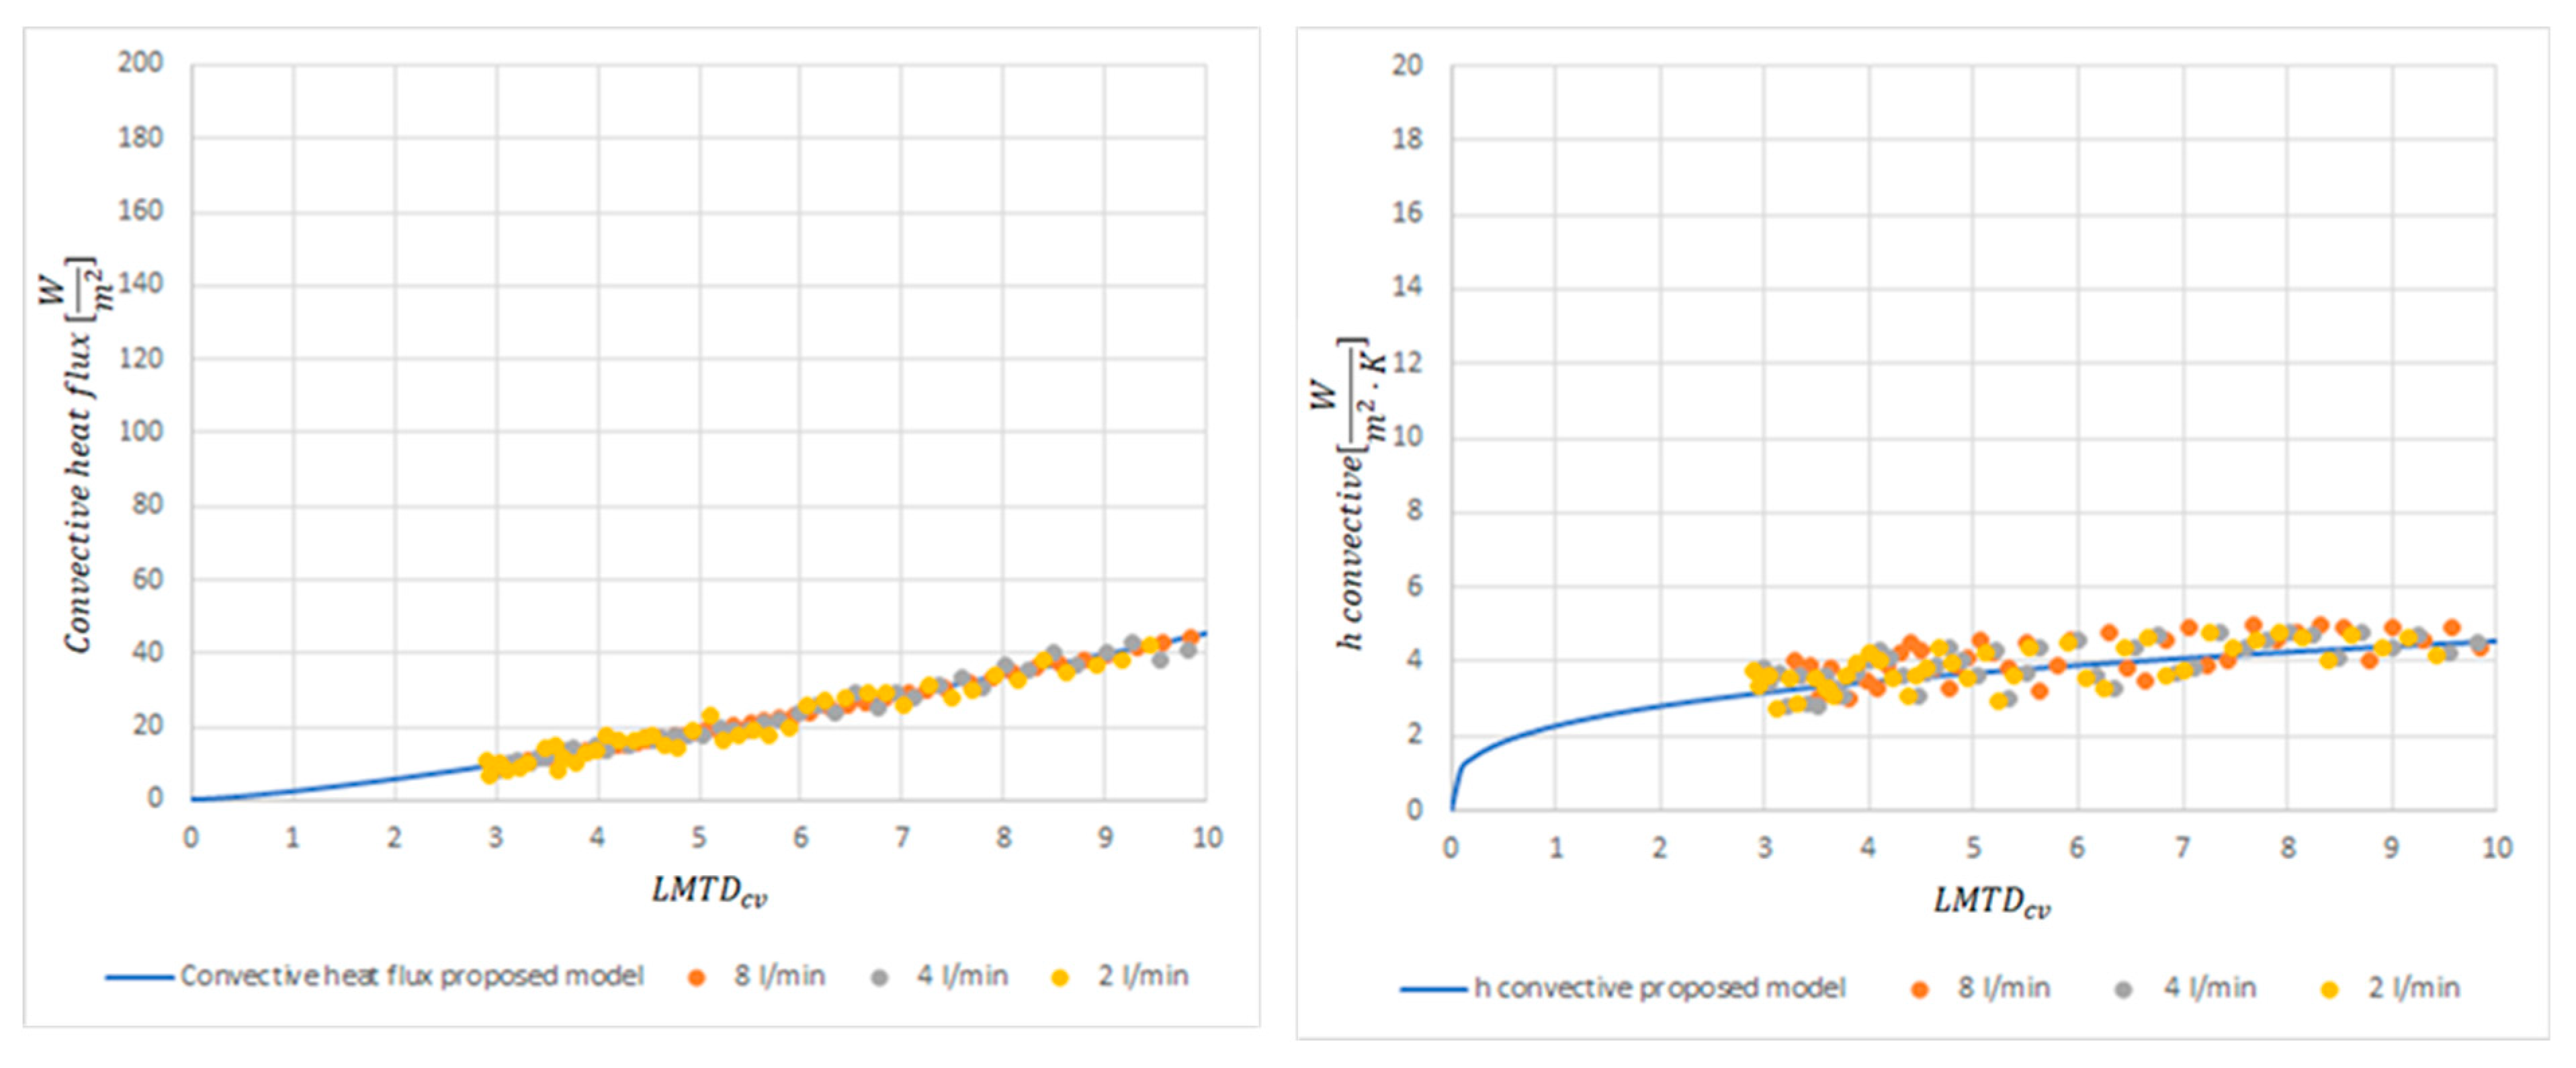
4.2. Comparison of Flow Effect
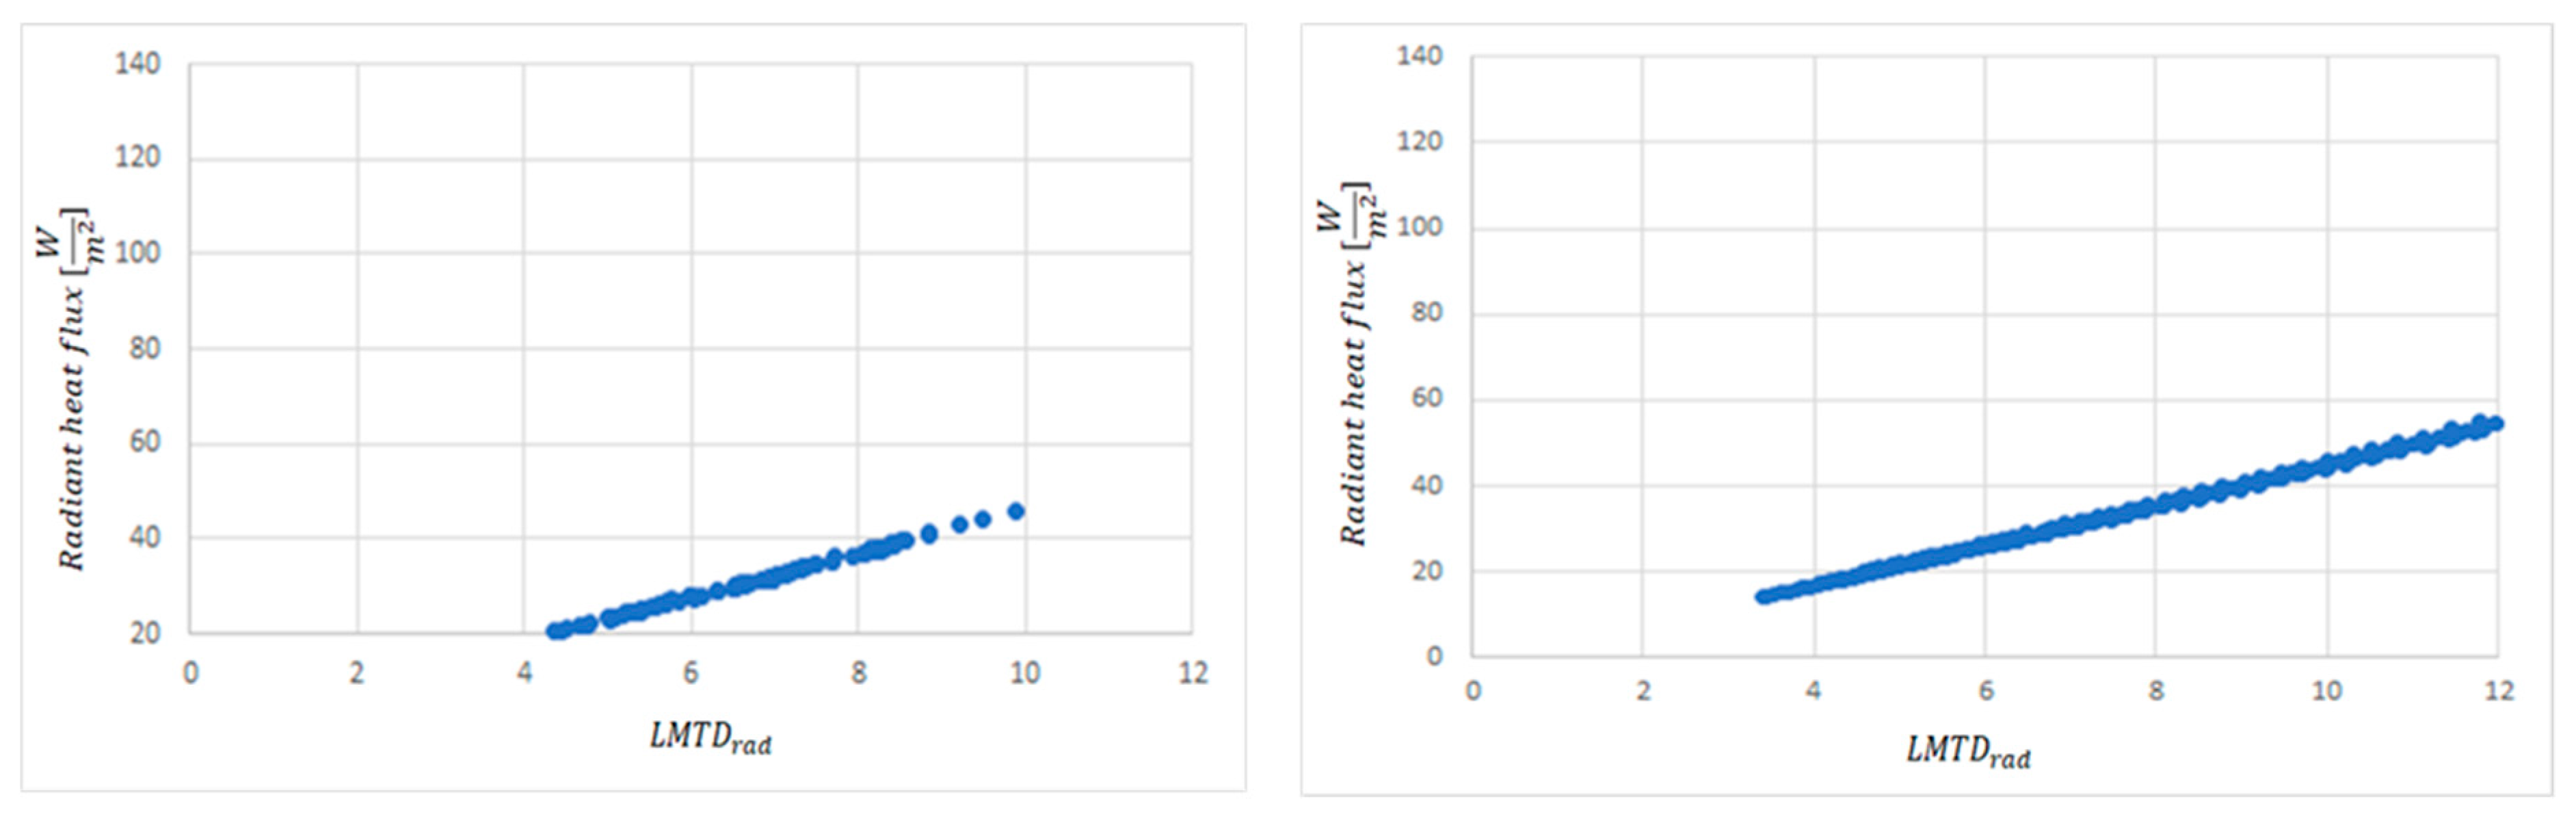
4.3. Identification of Parameters and Validation
5. Discussion and Applicability of Results
6. Conclusions
Author Contributions
Funding
Institutional Review Board Statement
Informed Consent Statement
Acknowledgments
Conflicts of Interest
Abbreviations
| Variable | Description | Units |
| Water flow | ||
| Water density | ||
| Specific heat of water | ||
| Convective heat flux | W | |
| Radiant heat flux | W | |
| Total density heat flux | ||
| Convective density heat flux | ||
| Radiant density heat flux | ||
| Convective heat transfer coefficient | ||
| Radiant heat transfer coefficient | ||
| Log mean temperature difference (convective) | ||
| Log mean temperature difference (radiant) | ||
| Radiant mean temperature | ||
| Surface temperature | ||
| View factor | - | |
| Emissivity | - | |
| Stefan–Boltzmann constant | ||
| Mean water temperature inside the circuit | ||
| Equivalent convective radiant temperature | ||
| Mean air temperature | ||
| Inlet water temperature | ||
| Outlet water temperature | ||
| Global heat transfer coefficient | ||
| Active surface | ||
| Operation water flow | ||
| Number of transfer units | - | |
| Efficiency | - |
References
- Santamouris, M. Cooling the cities—A review of reflective and green roof mitigation technologies to fight heat island and improve comfort in urban environments. Sol. Energy 2014, 103, 682–703. [Google Scholar] [CrossRef]
- Santamouris, M. On the energy impact of urban heat island and global warming on buildings. Energy Build. 2014, 82, 100–113. [Google Scholar] [CrossRef]
- Höppe, P. Different aspects of assessing indoor and outdoor thermal comfort. Energy Build. 2002, 34, 661–665. [Google Scholar] [CrossRef]
- Cordero, X. Microclima y Confort Térmico Urbano: Análisis Sobre la Influencia de la Morfología del Cañón Urbano Caso de Estudio en Los Barrios el Raval y Gracia, Barcelona. Master’s Thesis, Universitat Politècnica de Catalunya, Barcelona, Spain, 2014; p. 110. [Google Scholar]
- Pinto, D.; Rocha, A.; Simões, M.L.; Almeida, R.M.S.F.; Barreira, E.; Pereira, P.F.; Ramos, N.M.M.; Poças Martins, J. An innovative approach to evaluate local thermal discomfort due to draught in semi-outdoor spaces. Energy Build. 2019, 203, 109416. [Google Scholar] [CrossRef]
- Sarhadi, F.; Rad, V.B. The structural model for thermal comfort based on perceptions individuals in open urban spaces. Build. Environ. 2020, 185, 107260. [Google Scholar] [CrossRef]
- Liu, W.; Zhang, Y.; Deng, Q. The effects of urban microclimate on outdoor thermal sensation and neutral temperature in hot-summer and cold-winter climate. Energy Build. 2016, 128, 190–197. [Google Scholar] [CrossRef]
- Lai, D.; Lian, Z.; Liu, W.; Guo, C.; Liu, W.; Liu, K.; Chen, Q. A comprehensive review of thermal comfort studies in urban open spaces. Sci. Total Environ. 2020, 742, 140092. [Google Scholar] [CrossRef] [PubMed]
- Wang, Y.; Lian, Z.; Broede, P.; Lan, L. A time-dependent model evaluating draft in indoor environment. Energy Build. 2012, 49, 466–470. [Google Scholar] [CrossRef]
- Zhang, Y.; Liu, J.; Zheng, Z.; Fang, Z.; Zhang, X.; Gao, Y.; Xie, Y. Analysis of thermal comfort during movement in a semi-open transition space. Energy Build. 2020, 225, 110312. [Google Scholar] [CrossRef]
- Velazquez, R.; Alvarez, S.; Guerra, J. Climatic control of outdoor spaces in EXPO’92. Sun Work Eur. 1992, 7, 3–10. [Google Scholar]
- Givoni, B. Climate Considerations in Building and Urban Design; John Wiley & Sons: New York, NY, USA, 1998; pp. 241–300. [Google Scholar]
- Zhang, F.; Guo, H.A.; Liu, Z.; Zhang, G. A critical review of the research about radiant cooling systems in China. Energy Build. 2021, 235, 110756. [Google Scholar] [CrossRef]
- Rocha, A.; Pinto, D.; Ramos, N.M.M.; Almeida, R.M.S.F.; Barreira, E.; Simões, M.L.; Martins, J.P.; Pereira, P.F.; Sanhudo, L. A case study to improve the winter thermal comfort of an existing bus station. J. Build. Eng. 2020, 29, 101123. [Google Scholar] [CrossRef]
- Wang, Y.; Bakker, F.; de Groot, R.; Wörtche, H.; Leemans, R. Effects of urban green infrastructure (UGI) on local outdoor microclimate during the growing season. Environ. Monit. Assess. 2015, 187, 1–14. [Google Scholar] [CrossRef] [Green Version]
- Wang, Y.; Akbari, H. The effects of street tree planting on Urban Heat Island mitigation in Montreal. Sustain. Cities Soc. 2016, 27, 122–128. [Google Scholar] [CrossRef]
- Abdallah, A.S.H.; Hussein, S.W.; Nayel, M. The impact of outdoor shading strategies on student thermal comfort in open spaces between education building. Sustain. Cities Soc. 2020, 58, 102124. [Google Scholar] [CrossRef]
- Rossi, F.; Cardinali, M.; Gambelli, A.M.; Filipponi, M.; Castellani, B.; Nicolini, A. Outdoor thermal comfort improvements due to innovative solar awning solutions: An experimental campaign. Energy Build. 2020, 225, 110341. [Google Scholar] [CrossRef]
- Ferrari, A.; Kubilay, A.; Derome, D.; Carmeliet, J. The use of permeable and reflective pavements as a potential strategy for urban heat island mitigation. Urban Clim. 2020, 31, 100534. [Google Scholar] [CrossRef]
- Kyriakodis, G.E.; Santamouris, M. Using reflective pavements to mitigate urban heat island in warm climates—Results from a large scale urban mitigation project. Urban Clim. 2016, 24, 326–339. [Google Scholar] [CrossRef]
- Bianco, L.; Serra, V.; Larcher, F.; Perino, M. Thermal behaviour assessment of a novel vertical greenery module system: First results of a long-term monitoring campaign in an outdoor test cell. Energy Effic. 2017, 10, 625–638. [Google Scholar] [CrossRef]
- Kolokotsa, D.D.; Giannariakis, G.; Gobakis, K.; Giannarakis, G.; Synnefa, A.; Santamouris, M. Cool roofs and cool pavements application in Acharnes, Greece. Sustain. Cities Soc. 2018, 37, 466–474. [Google Scholar] [CrossRef]
- Guerrero Delgado, M.; Sánchez Ramos, J.; Pavón Moreno, M.; Tenorio Ríos, J.A.; Álvarez Domínguez, S. Experimental analysis of atmospheric heat sinks as heat dissipators. Energy Convers. Manag. 2020, 207, 112550. [Google Scholar] [CrossRef]
- Guerrero Delgado, M.; Sánchez Ramos, J.; Álvarez Domínguez, S.; Toral Ulloa, F.; Tenorio Ríos, J.A. Evaporative Mist Cooling as Heat Dissipation Technique: Experimental Assessment and Modelling. Appl. Sci. 2020, 10, 6026. [Google Scholar] [CrossRef]
- Guerrero, M.; Sánchez, J.; Antonio, J.; Ríos, T. Falling-film as natural cooling technique: Modelling and energy impact assessment. Energy Convers. Manag. 2020, 221, 113168. [Google Scholar] [CrossRef]
- Xie, Y.; Huang, T.; Li, J.; Liu, J.; Niu, J.; Mak, C.M.; Lin, Z. Evaluation of a multi-nodal thermal regulation model for assessment of outdoor thermal comfort: Sensitivity to wind speed and solar radiation. Build. Environ. 2018, 132, 45–56. [Google Scholar] [CrossRef]
- Zhang, H.; Yang, X.; Zheng, W.; You, S.; Zheng, X.; Ye, T. The CPMV* for assessing indoor thermal comfort and thermal acceptability under global solar radiation in transparent envelope buildings. Energy Build. 2020, 225, 110306. [Google Scholar] [CrossRef]
- Andrés-Chicote, M.; Tejero-González, A.; Velasco-Gómez, E.; Rey-Martínez, F.J. Experimental study on the cooling capacity of a radiant cooled ceiling system. Energy Build. 2012, 54, 207–214. [Google Scholar] [CrossRef]
- Zhao, W.; Kilpeläinen, S.; Kosonen, R.; Jokisalo, J.; Lestinen, S.; Wu, Y.; Mustakallio, P. Human response to thermal environment and perceived air quality in an office with individually controlled convective and radiant cooling systems. Build. Environ. 2021, 195. [Google Scholar] [CrossRef]
- Bogatu, D.-I.; Kazanci, O.B.; Olesen, B.W. An Experimental Study of the Active Cooling Performance of a Novel Radiant Ceiling Panel Containing Phase Change Material (PCM). Energy Build. 2021, 243, 110981. [Google Scholar] [CrossRef]
- Tang, H.; Zhang, T.; Liu, X.H.; Li, C. A novel pulse width modulation for metal radiant panels to control the condensation risk in a hot and humid environment. Build. Environ. 2021, 196, 107802. [Google Scholar] [CrossRef]
- Shen, C.; Li, X. Dynamic thermal performance of pipe-embedded building envelope utilizing evaporative cooling water in the cooling season. Appl. Therm. Eng. 2016, 106, 1103–1113. [Google Scholar] [CrossRef]
- Radwan, A.; Katsura, T.; Ding, L.; Serageldin, A.A.; EL-Seesy, A.I.; Nagano, K. Design and thermal analysis of a new multi-segmented mini channel based radiant ceiling cooling panel. J. Build. Eng. 2021, 40, 102330. [Google Scholar] [CrossRef]
- Sharma, H.B.; Panigrahi, S.; Sarmah, A.K.; Dubey, B.K. Numerical investigation of the thermal performance of a radiant ceiling cooling panel with segmented concave surfaces. J. Build. Eng. 2021, 42, 102450. [Google Scholar] [CrossRef]
- Ning, B.; Chen, Y. A radiant and convective time series method for cooling load calculation of radiant ceiling panel system. Build. Environ. 2021, 188, 107411. [Google Scholar] [CrossRef]
- Incropera, F.P. Fundamentals of Heat and Mass Transfer; John Wiley & Sons: New York, NY, USA, 2011; Volume 16, ISBN 9780471457282. [Google Scholar]
- Bergman, T.L.; Incropera, F.P. Fundamentals of Heat and Mass Transfer, 8th ed.; John Wiley & Sons: New York, NY, USA, 2011; ISBN 0470501979. [Google Scholar]
- EES: Engineering Equation Solver; Engineering Software; F-Chart Software: Madison, WI, USA, 2020.
- Doulos, L.; Santamouris, M.; Livada, I. Passive cooling of outdoor urban spaces. The role of materials. Sol. Energy 2004, 77, 231–249. [Google Scholar] [CrossRef]
- Santamouris, M.; Kolokotsa, D. Urban Climate Mitigation Techniques; Routledge: London, UK, 2016; ISBN 978-0415712132. [Google Scholar]
- Mansour, M.K. Practical effectiveness-NTU model for cooling and dehumidifying coil with non-unit Lewis Factor. Appl. Therm. Eng. 2016, 100, 1111–1118. [Google Scholar] [CrossRef]
- Çengel, Y.A.; Ghajar, A.J. Heat and Mass Transfer, 5th ed.; McGraw-Hill Higher Education: New York, NY, USA, 2015. [Google Scholar]


| Variable to Be Recorded | Type of Sensors | Measurement Points |
|---|---|---|
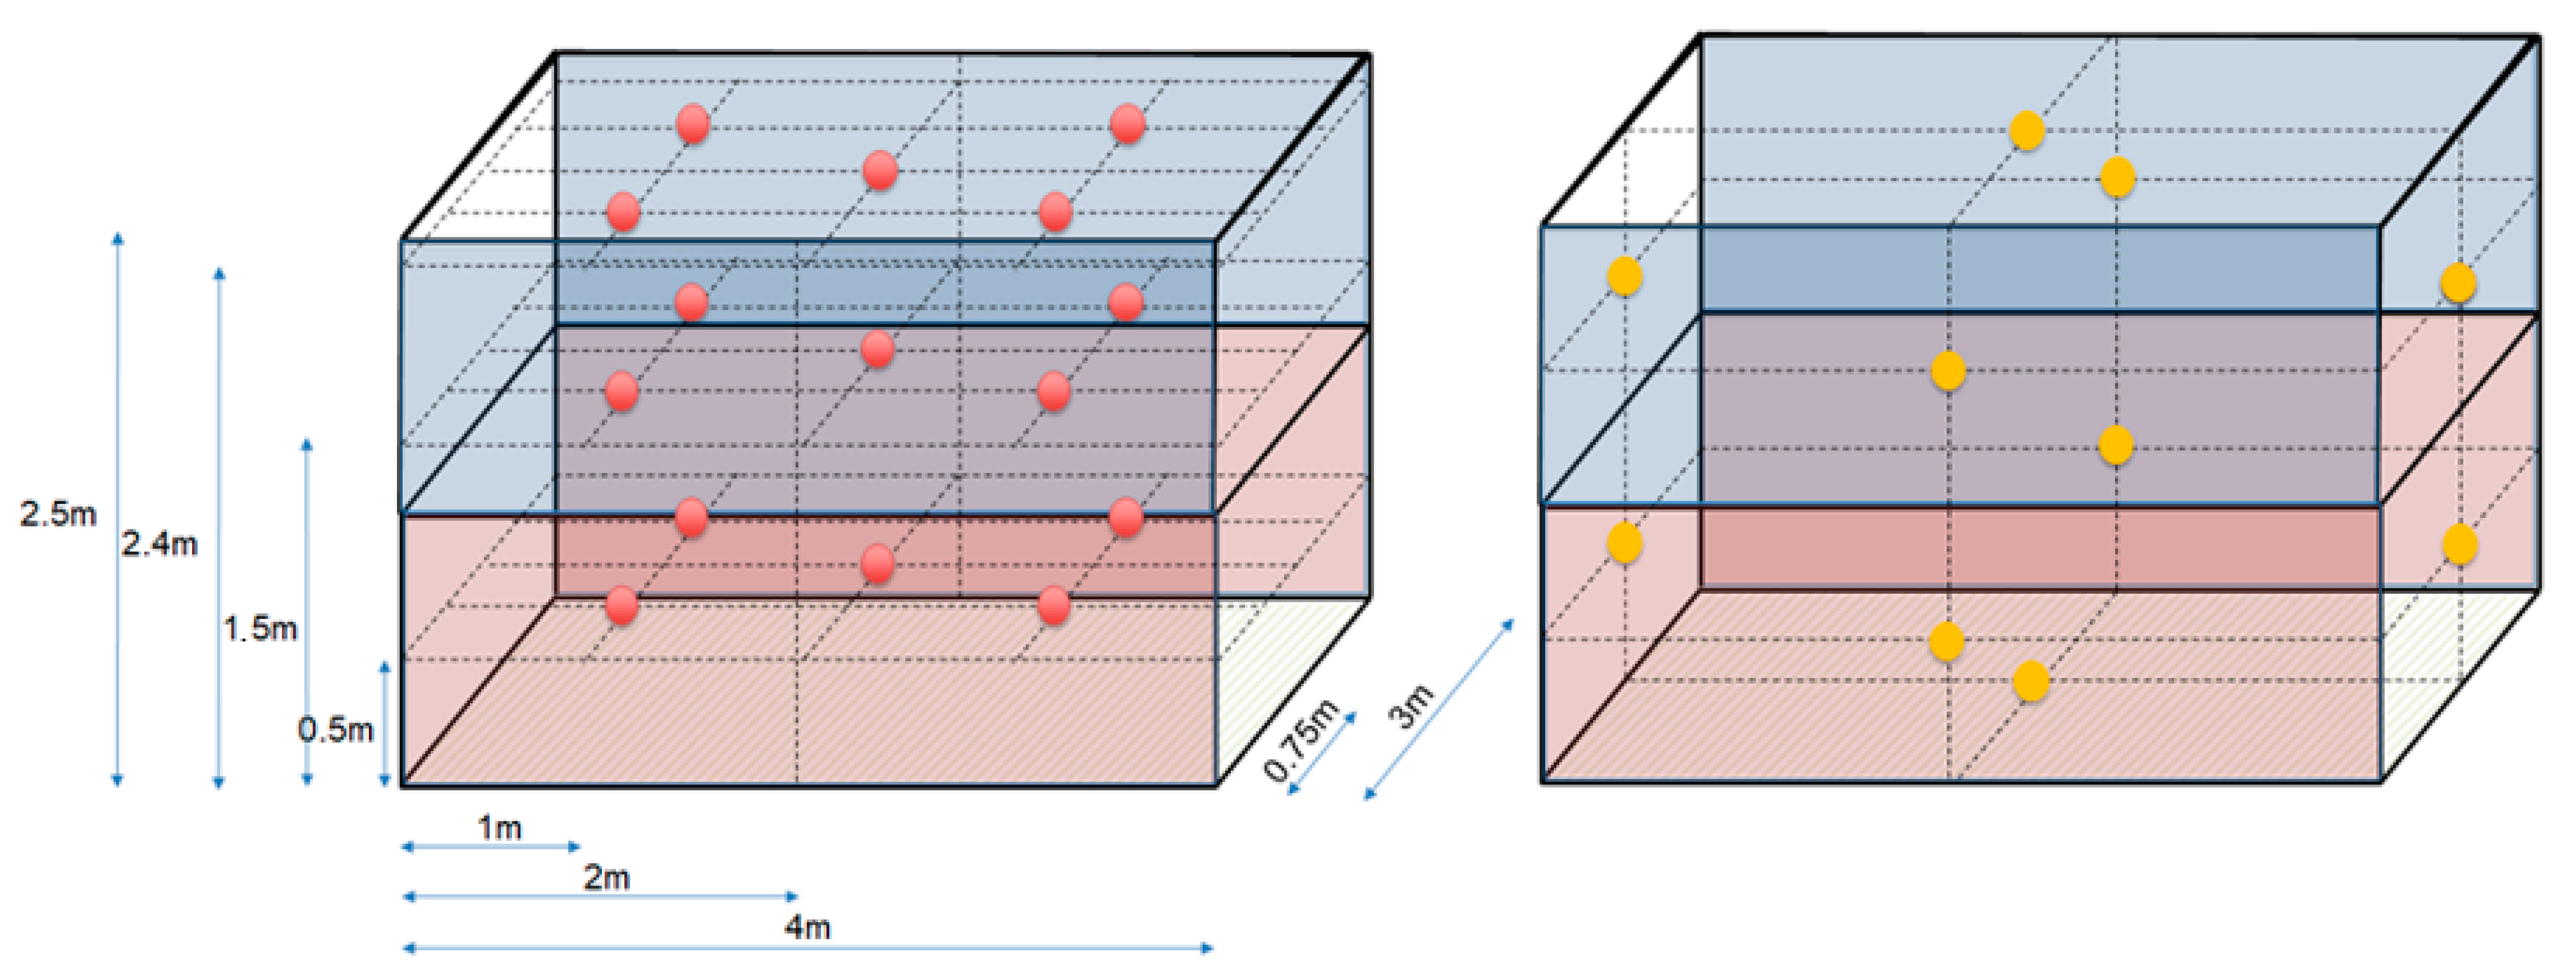
| Interior surface temperature (see Figure 5—right) | Type T thermocouples | 10 (one for each face glass surface, one for each wooden surface face, the ceiling, and the floor) |
| Interior ambient temperature (see Figure 5—left) | Type T thermocouples | 15 (5 for each height) |
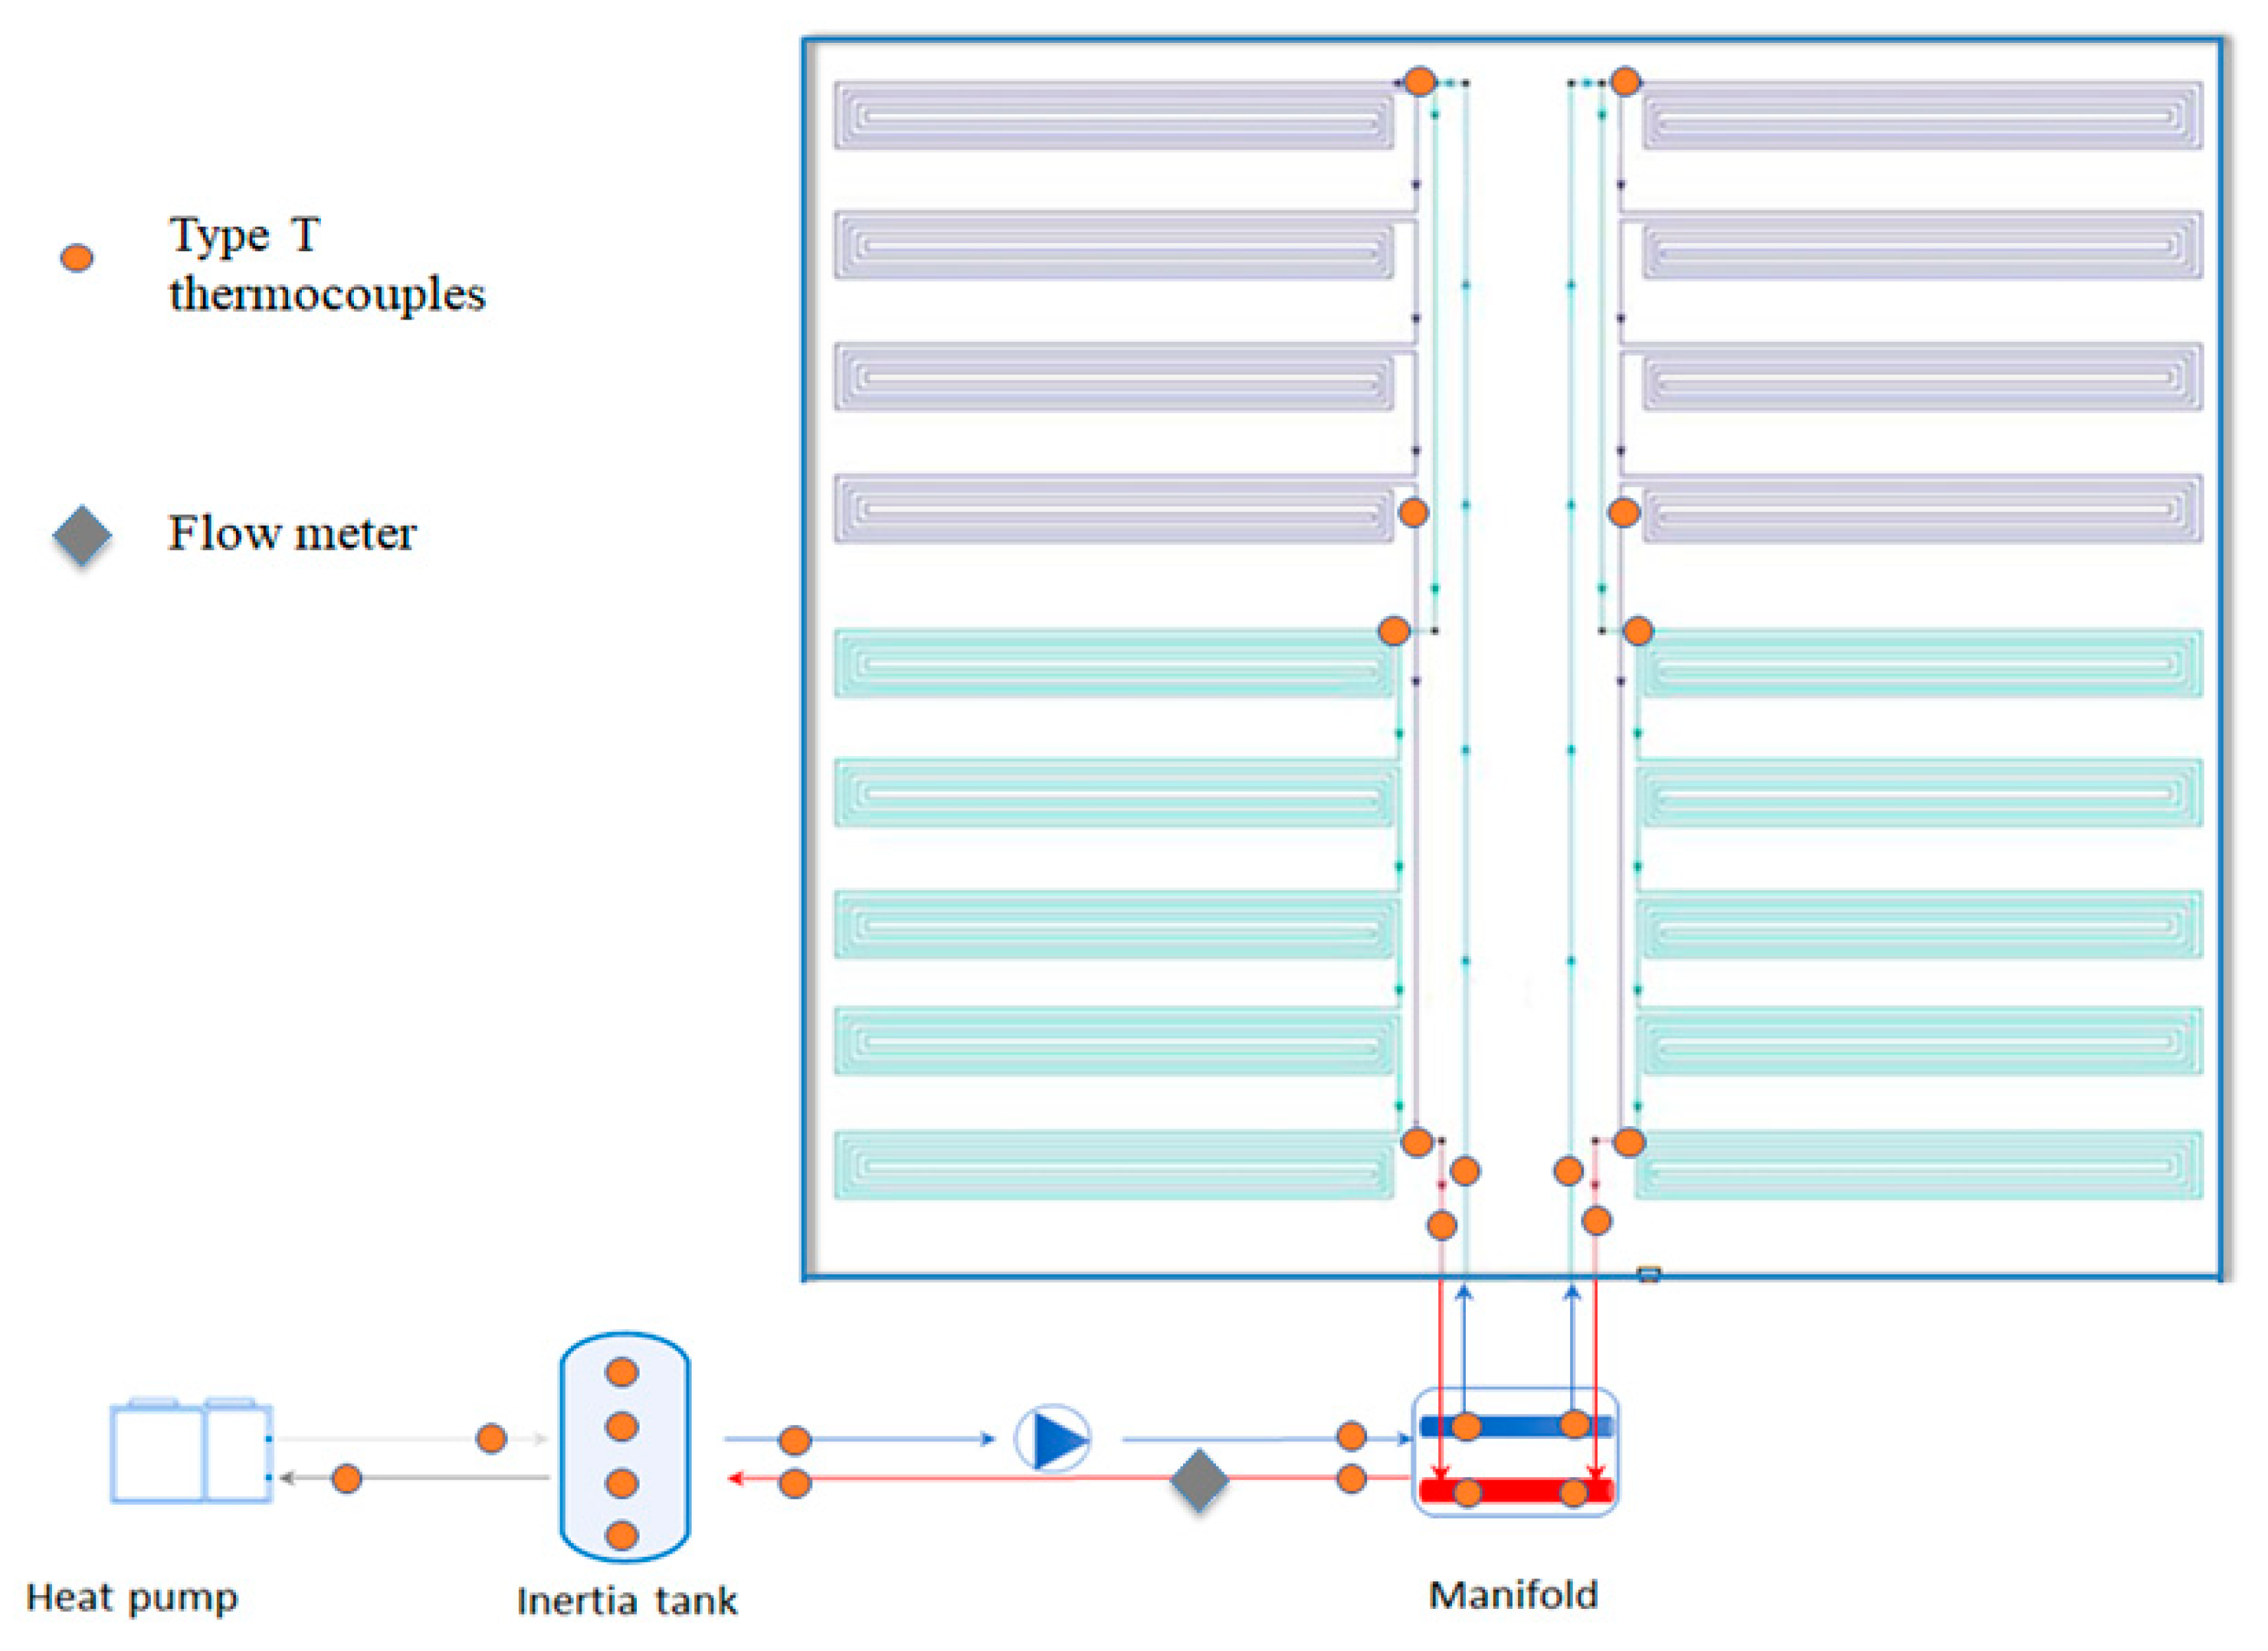
| Water temperature (see Figure 6) | Type T thermocouples | 22 (4 in the water tank, 1 inertial tank outlet, 1 manifold inlet, 2 module inlets, 4 module inlets, 4 module outlets, 2 collector returns, 1 collector outlet, 1 inertial tank inlet and 1 inertial tank inlet and outlet–heat pump) |
Publisher’s Note: MDPI stays neutral with regard to jurisdictional claims in published maps and institutional affiliations. |
© 2021 by the authors. Licensee MDPI, Basel, Switzerland. This article is an open access article distributed under the terms and conditions of the Creative Commons Attribution (CC BY) license (https://creativecommons.org/licenses/by/4.0/).
Share and Cite
Guerrero Delgado, M.; Castro Medina, D.; Sánchez Ramos, J.; Palomo Amores, T.R.; Álvarez Domínguez, S.; Tenorio Ríos, J.A. Adaptative Cover to Achieve Thermal Comfort in Open Spaces of Buildings: Experimental Assessment and Modelling. Appl. Sci. 2021, 11, 7998. https://doi.org/10.3390/app11177998
Guerrero Delgado M, Castro Medina D, Sánchez Ramos J, Palomo Amores TR, Álvarez Domínguez S, Tenorio Ríos JA. Adaptative Cover to Achieve Thermal Comfort in Open Spaces of Buildings: Experimental Assessment and Modelling. Applied Sciences. 2021; 11(17):7998. https://doi.org/10.3390/app11177998
Chicago/Turabian StyleGuerrero Delgado, MCarmen, Daniel Castro Medina, Jose Sánchez Ramos, Teresa Rocío Palomo Amores, Servando Álvarez Domínguez, and José Antonio Tenorio Ríos. 2021. "Adaptative Cover to Achieve Thermal Comfort in Open Spaces of Buildings: Experimental Assessment and Modelling" Applied Sciences 11, no. 17: 7998. https://doi.org/10.3390/app11177998
APA StyleGuerrero Delgado, M., Castro Medina, D., Sánchez Ramos, J., Palomo Amores, T. R., Álvarez Domínguez, S., & Tenorio Ríos, J. A. (2021). Adaptative Cover to Achieve Thermal Comfort in Open Spaces of Buildings: Experimental Assessment and Modelling. Applied Sciences, 11(17), 7998. https://doi.org/10.3390/app11177998