Article

Anatomical Characteristics of the Lateral Pterygoid Muscle in Mandibular Prognathism

Department of Oral and Maxillofacial Surgery, Daejeon Dental Hospital, Wonkwang University College of Dentistry, Daejeon 35233, Korea
*
Author to whom correspondence should be addressed.
Hwikang Kim and Dongsun Shin contributed equally to this study.
Appl. Sci. 2021, 11(17), 7970; https://doi.org/10.3390/app11177970
Submission received: 20 July 2021 / Revised: 19 August 2021 / Accepted: 26 August 2021 / Published: 28 August 2021
(This article belongs to the Special Issue Mandibular Characteristics in Dentofacial Dysmorphosis)

Abstract

:
Mandibular prognathism is one of the most concerning subjects in the oral and maxillofacial fields. In our previous studies, we attempted to clarify the etiology of mandibular prognathism. They revealed that one of the major characteristics of mandibular prognathism was the lower volume/length ratio of the mandibular condyle and body compared to normal, and the masseter muscle showed parallelism with this. This study aimed to evaluate the relationship between mandibular prognathism and the lateral pterygoid muscle by measuring the orientation and volume/length ratio of the lateral pterygoid muscle. Computed tomography was used to calculate the volume/length ratio of the lateral pterygoid muscle in 60 Korean individuals. Mimics 10.0 and Maya version 2018 were used to reconstruct the surface area and surface planes. The results showed that the prognathic group showed smaller lateral pterygoid volume/length ratios compared to the normal group (p < 0.05). In addition, the normal group displayed a larger horizontal angle (p < 0.05) to the mandibular and palatal planes than the prognathic group. This demonstrated that the mechanical drawback of the lateral pterygoid in the prognathic group is associated with mandibular prognathism.

1. Introduction

Mandibular prognathism, which brings about esthetic and functional problems, is one of the major issues in the oral and maxillofacial fields. In most adults, a surgical approach is the only method of proper treatment [1,2]. However, younger patients have other ways to manage mandibular prognathism, such as timing treatment options, predicting the mandibular growth, and regulating the growth pattern [3,4]. Therefore, many studies have attempted to investigate the relationship between mandibular growth and influence factors.
Several studies have showed a correlation between craniofacial shape and the chewing muscles [5,6,7]. A previous study has shown that the lateral pterygoid muscle plays a physiological role in regulating the growth rate of the condylar cartilage [8]. In our previous report, the quantitative characteristics of prognathic and normal jaws were revealed by skeletal unit and masseter muscle analyses [9,10]. Similar to the masseter muscle, which attaches to the mandibular body, the lateral pterygoid also attaches to the main part of the mandible, the condyle. It is possible to assume that the two muscles are the main muscles related with mandibular growth in prognathism.
The lateral pterygoid muscle is one of the four masticatory muscles, along with the medial pterygoid, temporalis, and masseter muscles. It is composed of two heads, lying superiorly to the medial pterygoid muscle. The superior head originates on the infratemporal surface of the sphenoid bone and inserts on the anterior side of the condyle. The inferior head originates on the lateral pterygoid plate and inserts onto the pterygoid fovea.
In our previous study, we found two important points related to the masseter muscle: (1) the volume/length ratio of the masseter for the normal group was larger than that for the prognathic group; (2) the orientation of both deep and superficial masseters of individuals in the normal group were more vertical [10]. In this study, we compared the lateral pterygoid muscles of healthy individuals with prognathic ones. As in a previous study, we evaluated the volume/length ratio of the lateral pterygoid muscle and its orientation to the jaw plane. The former revealed the magnitude of muscle quantity. The latter showed the direction of muscle in three planes: mandibular, occlusal, and palatal.

2. Materials and Methods

2.1. Participants

Sixty participants who called Wonkwang University, Daejeon Dental Hospital were included. All individuals were Korean (30 men and 30 women). Patients’ chief complaints were mandibular third molar evaluation, orthodontic diagnosis, and sinusitis. Accordingly, computed tomography (CT) images were taken for analysis and diagnosis. Three inclusion criteria were: (1) age between eighteen and twenty-nine years, (2) complete dentition apart from third molars, and (3) patient’s agreement to three-dimensional (3D) CT of the head. Analyses were done using the hemi-jaw of 3D CT results. Patients with severe asymmetry, congenital deformities, chronic periodontitis, trauma history relating to bilateral sides of the jawbone, or orthognathic procedures were excluded from this study. Participants with an asymmetry of more than a 2 mm menton shift from the mid-sagittal plane were also ruled out. Individuals with trauma were evaluated according to the condition of non-involved hemi-jaws. Sixty hemi-jaws were analyzed from sixty individuals. This study was approved by Institutional Review Board of Wonkwang University Daejeon Dental Hospital (W2106/001-001).

2.2. Group Classification

Individuals were classified into 2 groups by using Delaire’s analysis [11] and Steiner’s analysis. In Delaire’s analysis, we evaluated the angle between the C1 plane, which is the horizontal reference plane, and the Me-based F1 plane, which is the naso-fronto-maxillary point to the menton. In Steiner’s analysis, we measured the sella-nasion-A point angle, sella-nasion-B point angle (SNB), and A point-nasion-B point angle (ANB). These were analyzed on the midsagittal plane for 3D CT images. Individuals with normal C1-Me-based F1 values and normal SNB angles were categorized into the normal group (n = 30, 15 men and 15 women), and individuals with high C1-Me-based F1 values and high SNB angles were categorized into the prognathic group (n = 30, 15 men and 15 women). The normal group represented SNB values of 78.42° ± 0.76° and C1-Me-based F1 values of 86.82° ± 0.99° on average, while the prognathic group had average SNB and C1-Me-based F1 angles of 83.59° ± 1.07° and 92.63° ± 1.07°, respectively (mean ± standard deviation). The age distribution of normal group individuals was 18 to 29 years (mean age 22.4 ± 3.4 years), while that of the prognathic group was 18 to 27 years (mean age 21.0 ± 2.7 years).

2.3. 3D CT Segmentation

A SOMATOM Definition Dual Source CT (DSCT; Siemens, Forchhelm, Germany) was used to conduct a 3D analysis under the following imaging conditions: scanning time, 1 s; 100 kV; field of view, 20.8 cm; 76 mAs; and 0.5 mm thickness. For accurate evaluation, individuals were ordered that they maintain centric occlusion and remain still to avoid changes in lateral pterygoid volume. All CT cross-sections were saved as Digital Imaging Communications in Medicine format, and reconstruction was done by applying Mimics 10.0 (Materialize n.v., Leuven, Belgium). Sequentially, the skull and lateral pterygoid were outlined. Contours of the cranium were outlined by applying the “threshold” tool in Mimics. Contours for the lateral pterygoid were manually appointed for each individual. Each contour was described in coronal, sagittal, and horizontal planes independently, with 5 consecutive sections. As a result, each plane had approximately 20 outlines.

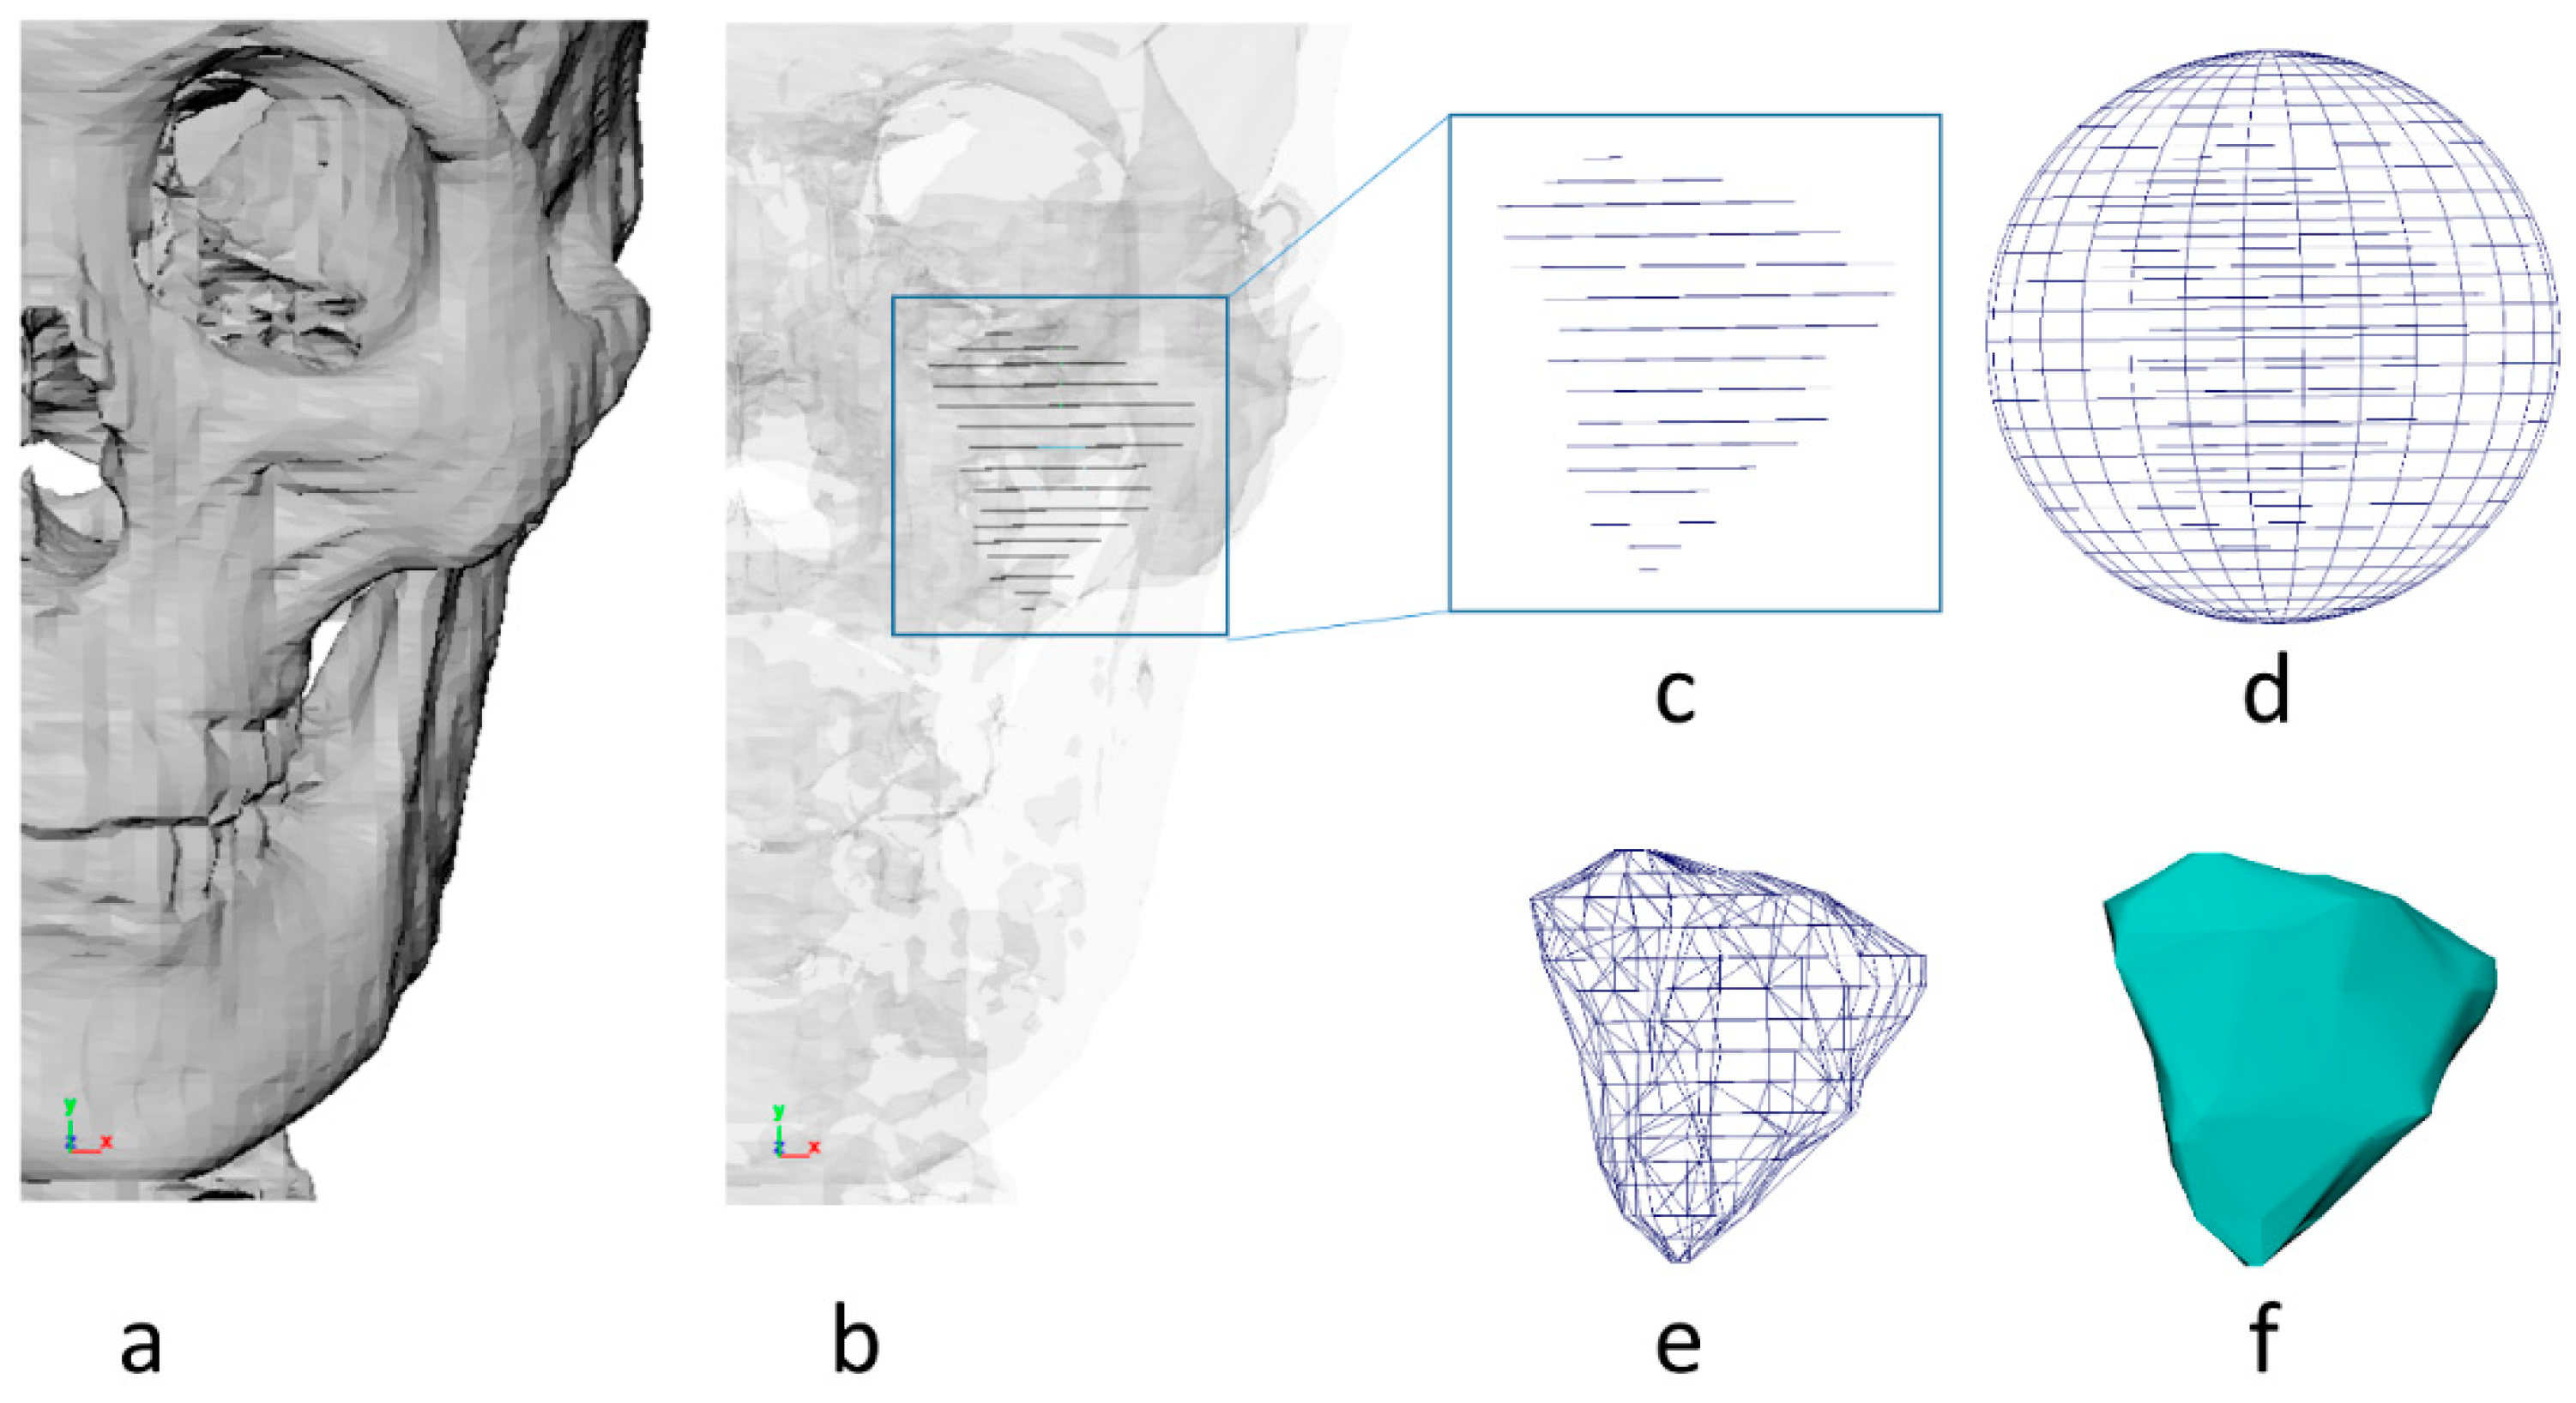
2.4. 3D Reconstruction and Correction

The Mimics software was applied as the tool for the surface reconstructions of the lateral pterygoid muscles and skull. Low-, middle-, and high-quality surface reconstruction options were available. However, because of the excessive file size, middle- and high-quality shapes were difficult to treat in the subsequent procedure. So, the alternative was to use a low-quality option. The surface models of the skulls were reorganized by undergoing an automatic whole segmentation process. However, initially, the surface models of the lateral pterygoid muscle were not smooth and realistic because segmentation was not done thoroughly. Therefore, each layer of the lateral pterygoid muscle was isolated and not connected. To make the surface models of the lateral pterygoid realistic and smooth, additional processing was done. Successively, a polyhedron was made and surrounded in the initial surface models of the lateral pterygoid by applying Maya version 2018 (Autodesk, Inc., San Rafael, CA, USA). Figure 1 describes the procedure for the surface reconstruction of the lateral pterygoid muscles.

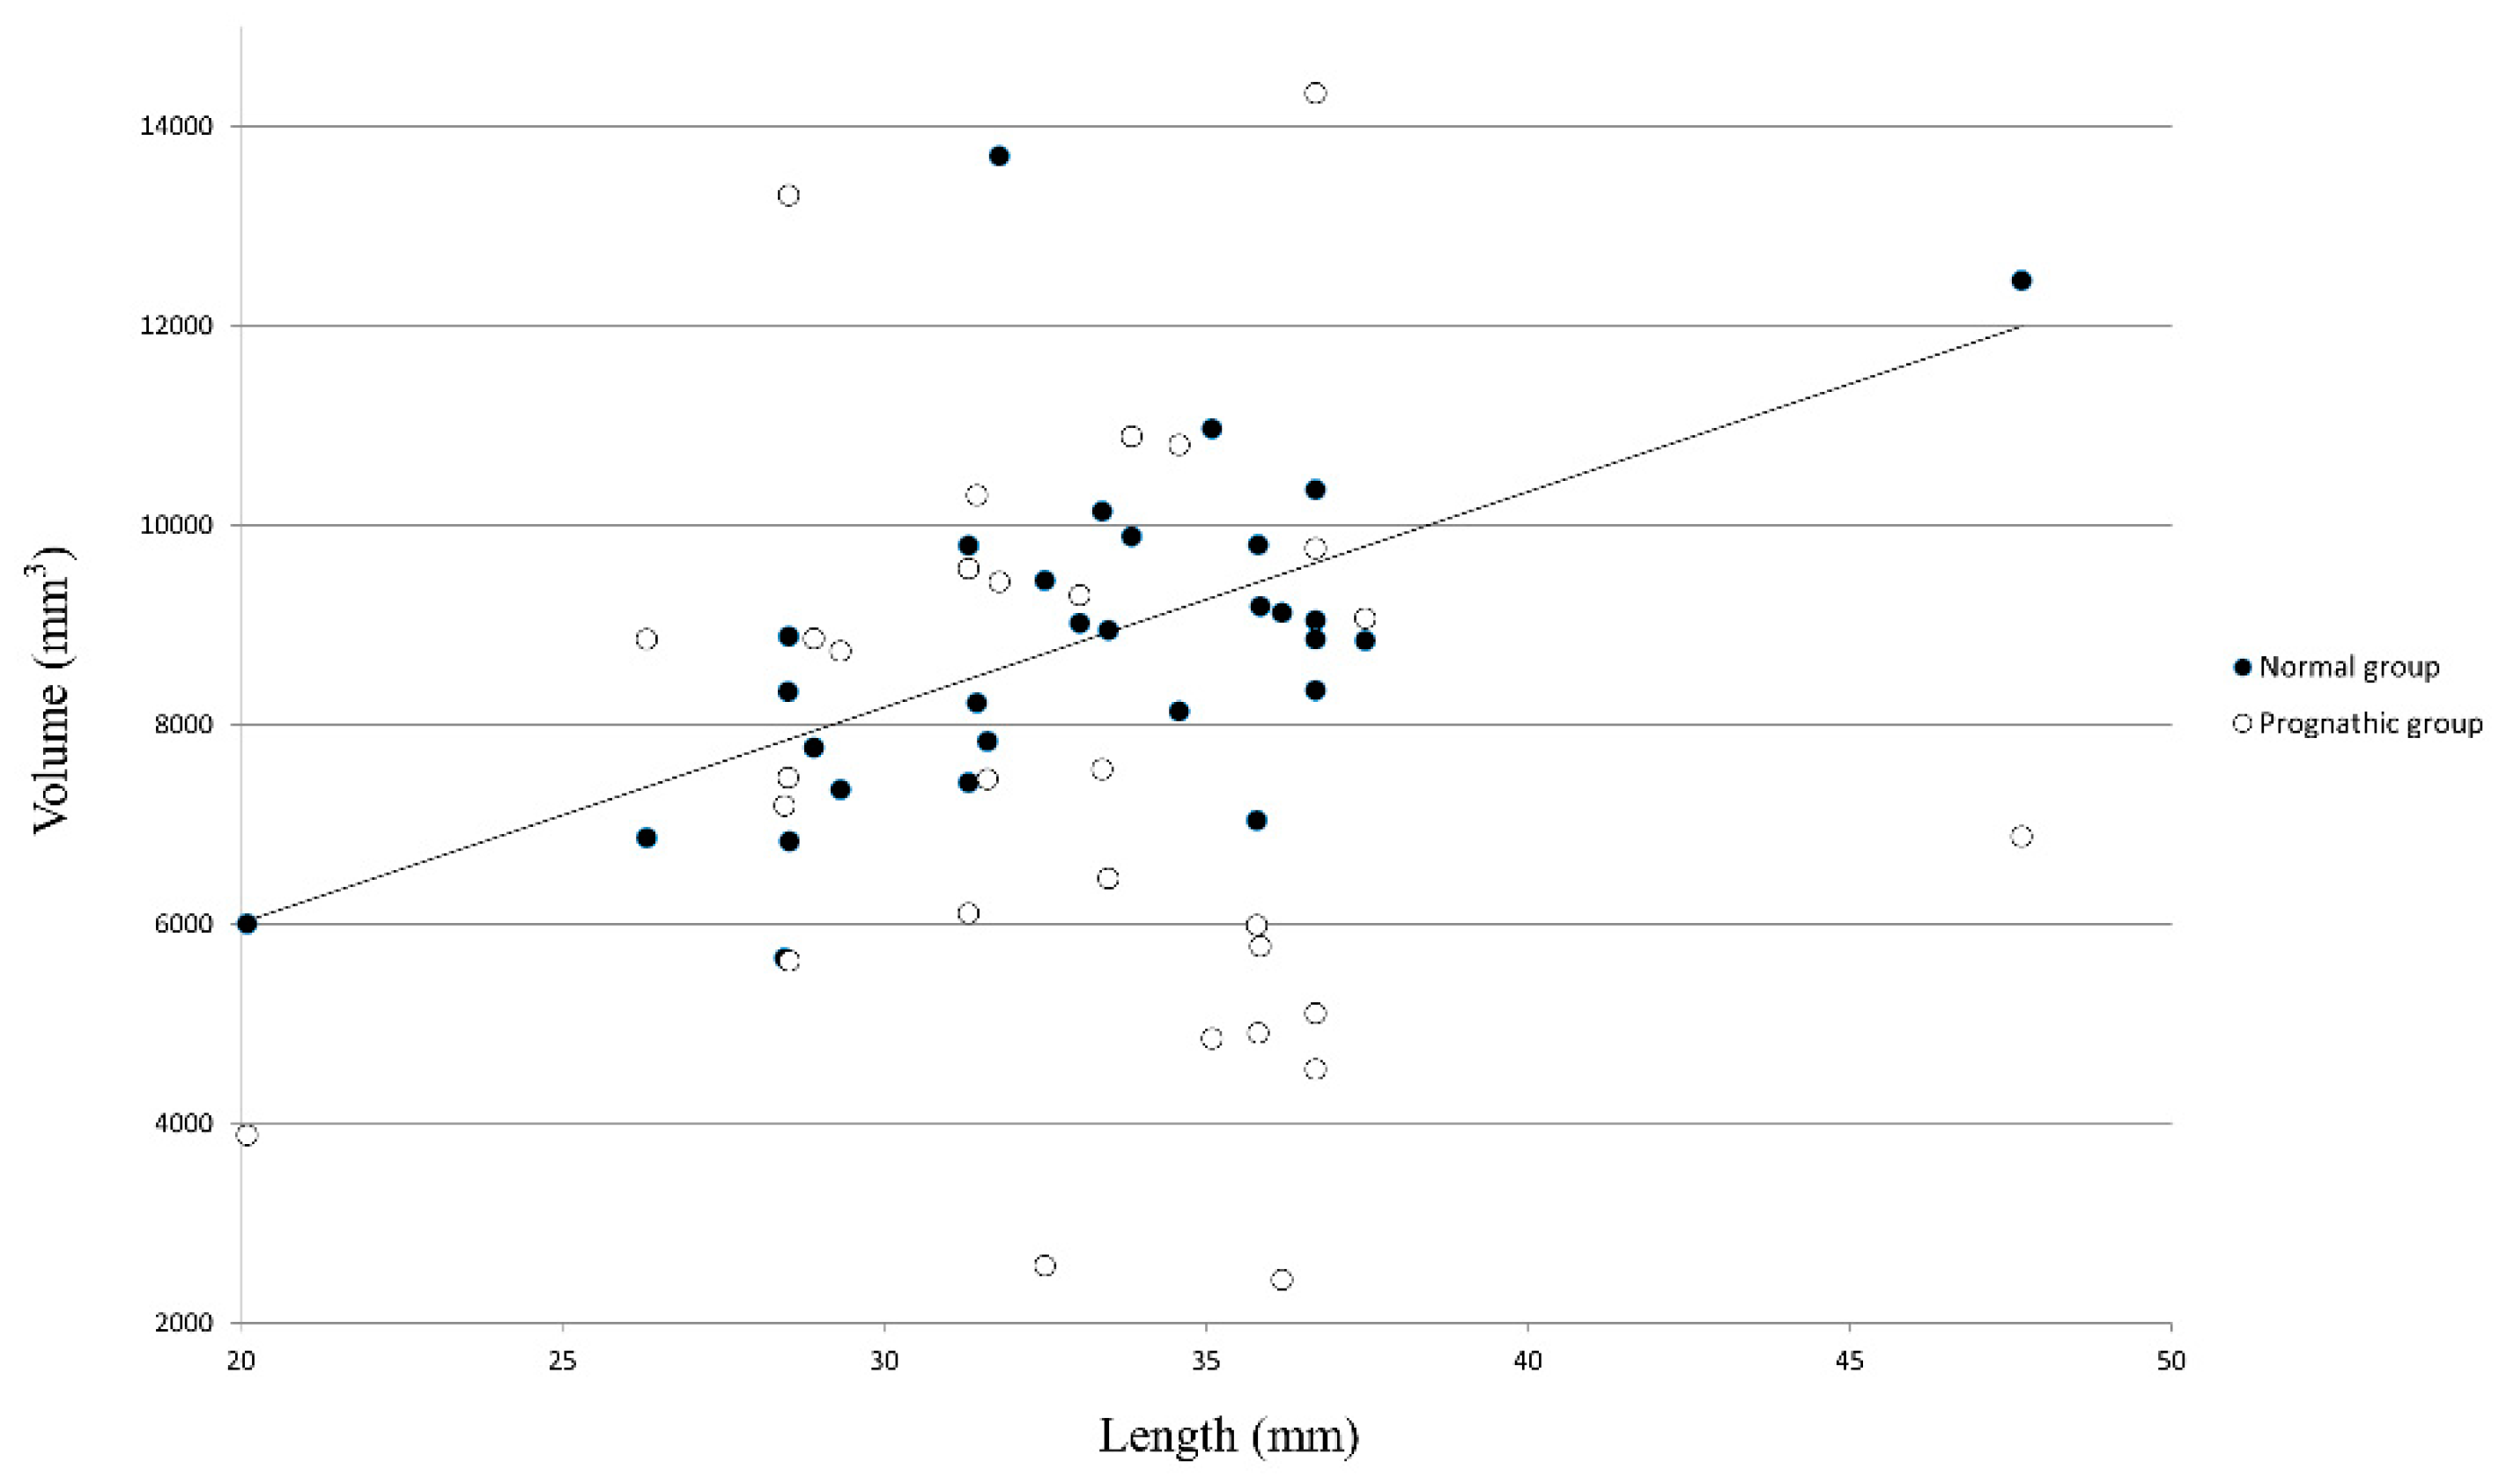
2.5. Volume and Length Calculation for Lateral Pterygoid

“The Poly Volume” tool and “Head-up Display” in Maya Bonus Tools were applied to evaluate the volumes of the lateral pterygoid muscles. A value-collecting procedure was done with the “script” window, which showed the volume value. The volume of lateral pterygoid was described (Figure 2). To calculate the lengths of the lateral pterygoid muscle, an original surface model ruler was added. The length of ruler was shown in “Transform Attributes”, and result was calculated. As the lateral pterygoid muscle shape attends individual differences, a characteristics ratio was gained by dividing lateral pterygoid volume by length; this ratio functioned as an analysis tool.

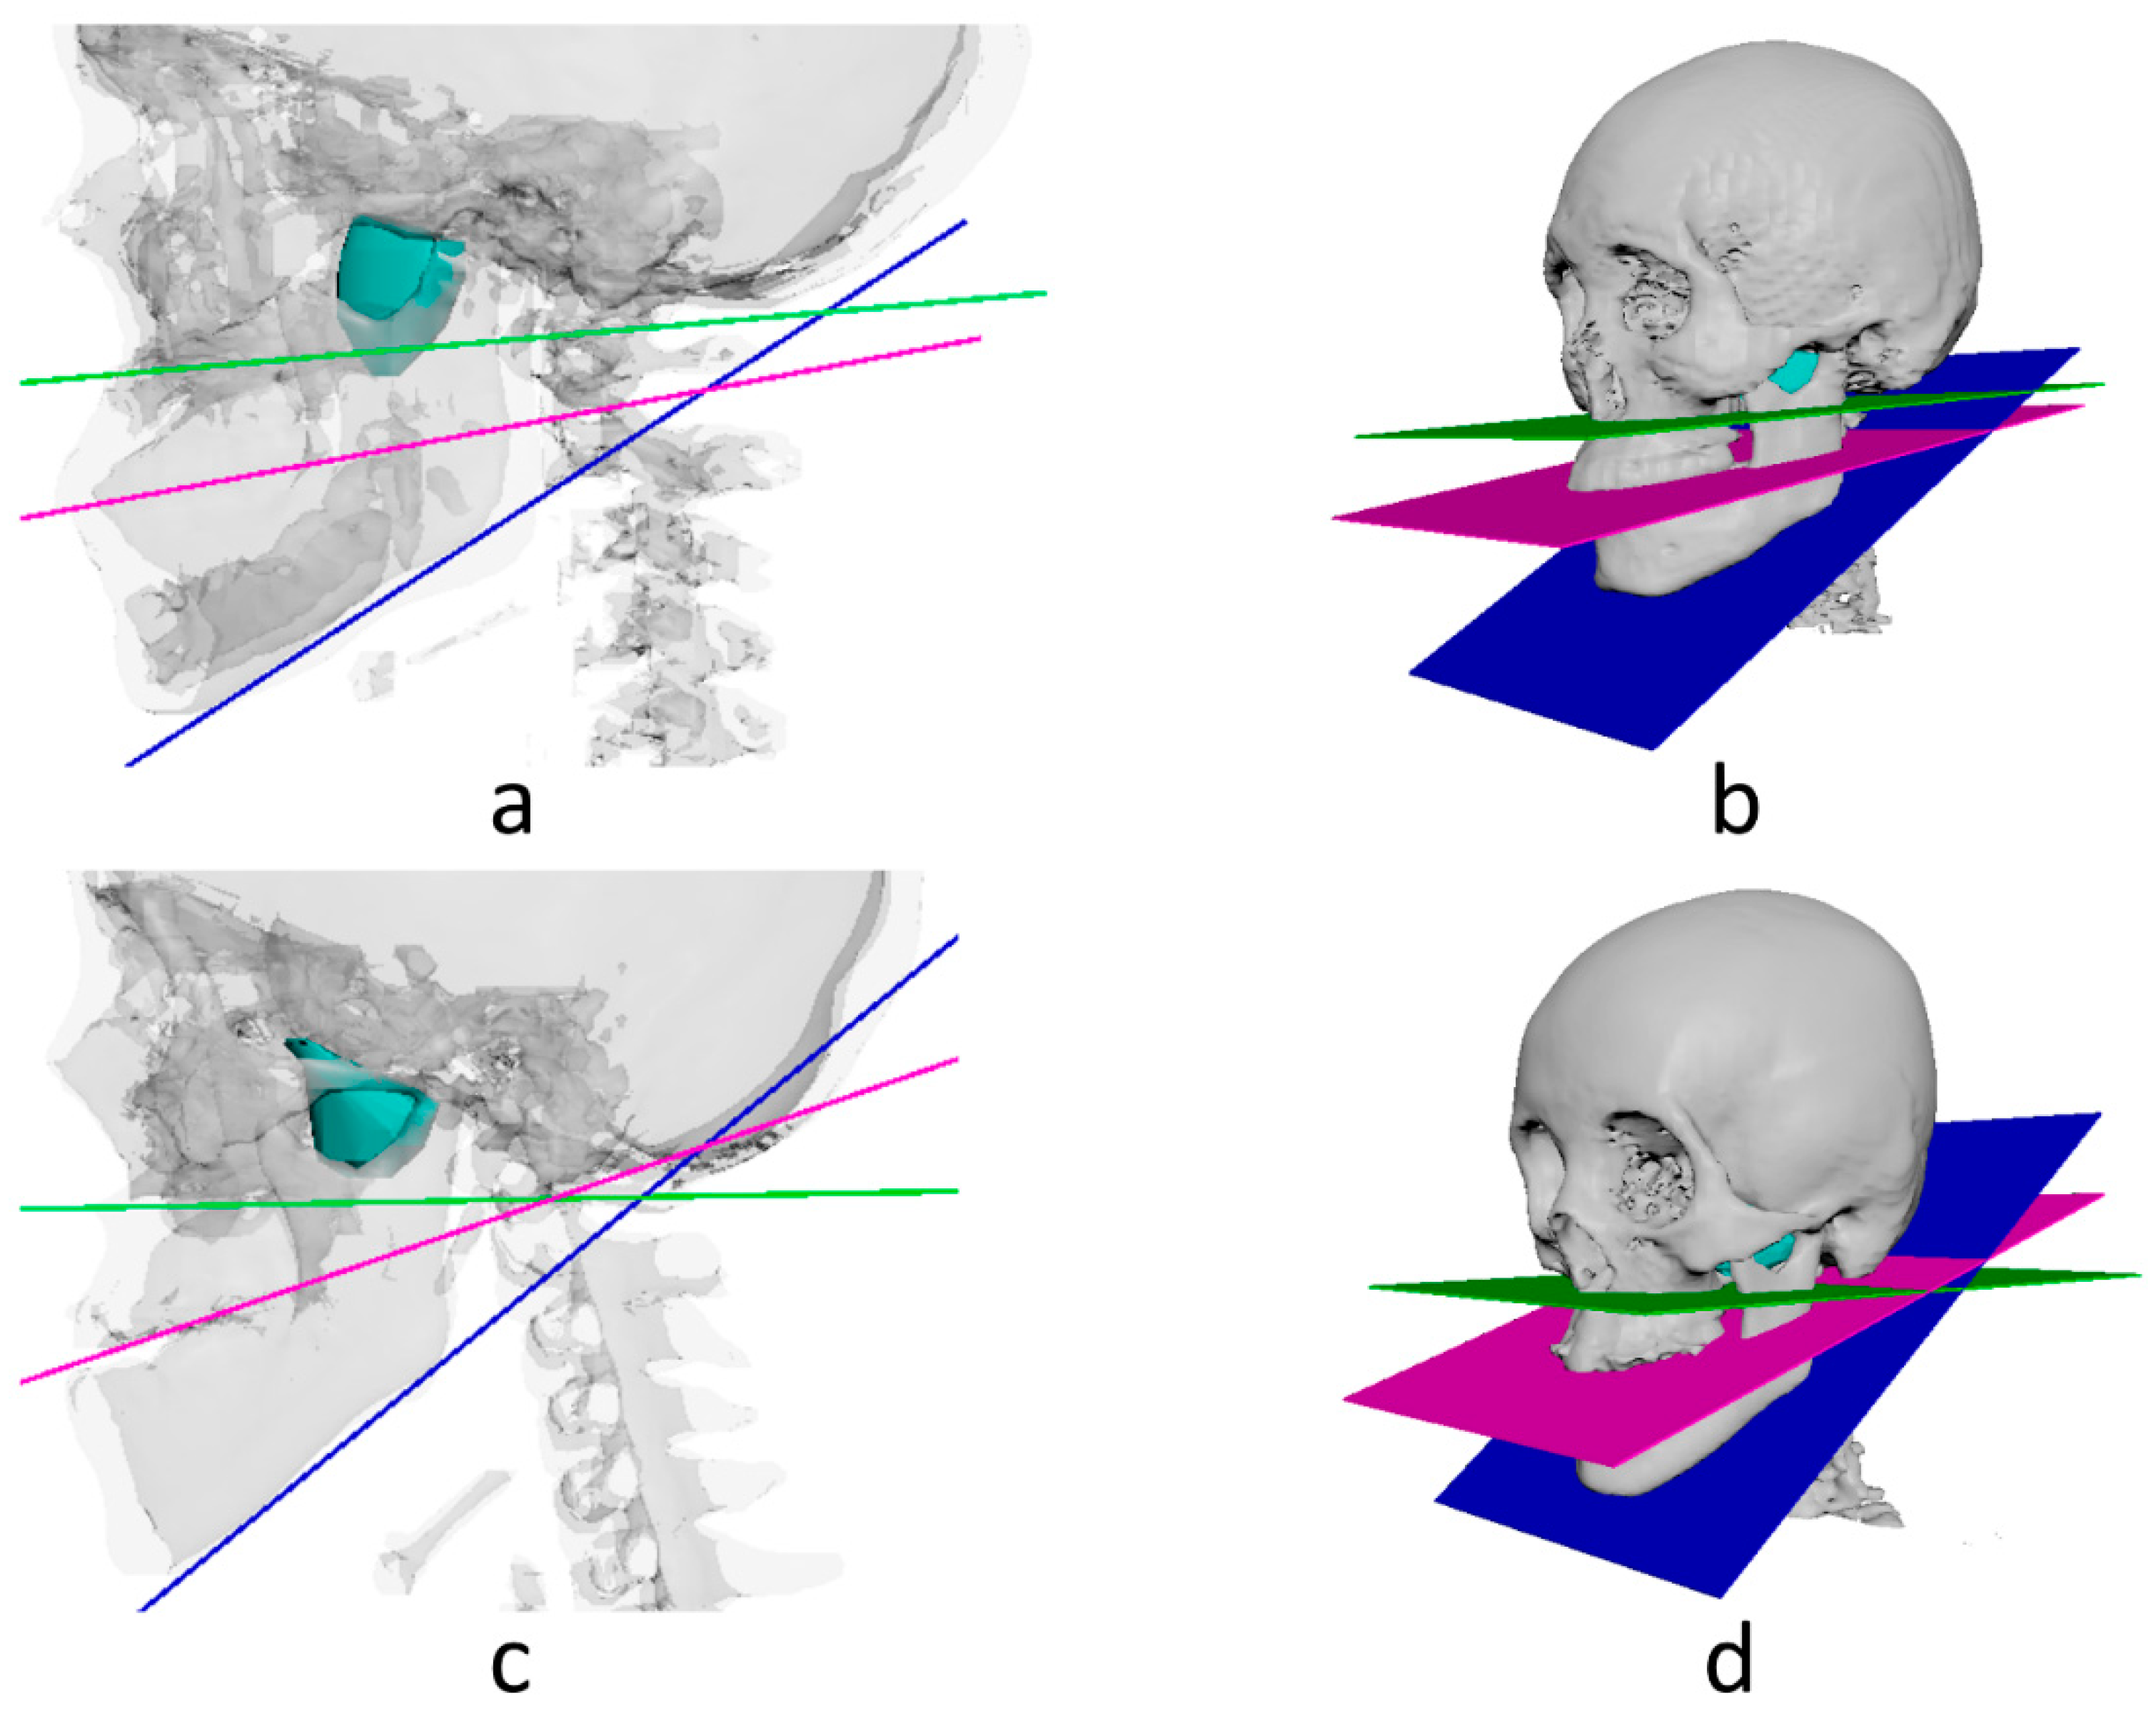
2.6. Angle Calculation between Lateral Pterygoid and Reference Planes

Angles between lateral pterygoid and reference planes were calculated using surface planes. First, the shapes of palatal, occlusal, and mandibular planes (horizontal plane) were made based on cranial shape.
The palatal plane appears parallel to the C1 plane in Delaire analysis and expresses a superior skull base plane. Second, an angled curve was described along the plane in the previously made model of the ruler on the midsagittal plane. Definitions for planes are as follows:
Midsagittal plane: the plane through falx cerebri, foramen cecum, and center of foramen magnum [12].
Horizontal plane: the plane through midpoints of both orbital canal and both eyeballs [13].
Palatal plane: plane perpendicular to midsagittal plane passing through posterior and anterior nasal spine [14].
Occlusal plane: a plane through the midpoint between incisal edges of upper/lower jaw incisors and mesio-buccal cusp tip of bilateral first molars on mandible [15].
Mandibular plane: plane perpendicular to midsagittal plane passing through Me (menton) and Go (gonion) [16].
Third, the angle of the curve was calculated by applying the “Measure Angle Tool”. Superior anterior and superior posterior areas for the lateral pterygoid were 2 reference points of the lateral pterygoid. On the sagittal plane, the angle between lateral pterygoid and reference planes was calculated. The result of the calculated angle was shown and assembled for investigation.

2.7. Method Error

The method error related to designating reference points in 3D CT (calculated as an inter-observer and intra-observer error) was assessed for twenty blindly designated reference points by 2 authors. Each author appointed twenty reference points in 3D CT 20 times at 14 day intervals. Measurements were evaluated by applying Dahlberg’s formulation and evaluated statistically with ICC as follows:
E(x or y, or z) = √∑[(xnxn−1)2 or (ynyn−1)2 or (znzn−1)2]/2N
where xn indicates locational result for point xn, and xn−1 is locational result for point xn−1 on x coordinate.

2.8. Statistic Verification

Results are described as the means ± standard deviations (SDs). Independent t-test was performed to analyze correlation between the prognathic group and the normal group. Statistical significance was set at p < 0.05. All analyses were done using IBM SPSS Statistics (version 23.0; IBM Corp., Armonk, NY, USA).

3. Results

3.1. Method Error

The intra-observer error was from 0.2 to 0.8 mm for reappearance of the reference points. The ICC with 95% confidence distances was 0.992 (p > 0.05) for intra-observer reliability and 0.929 (p > 0.05) for inter-observer reliability.

3.2. Comparison of Lateral Pterygoid Ratio between Prognathic and Normal Groups

The data expressed a distinct difference in the lateral pterygoid size between the prognathic and normal groups. The prognathic group demonstrated smaller lateral pterygoid volume-to-length ratios than the normal group. The independent t-test displayed a smaller lateral pterygoid ratio in the prognathic group (231.8 ± 58.5) than in the normal group (268.5 ± 42.6, p < 0.05) (Figure 3, Table 1).

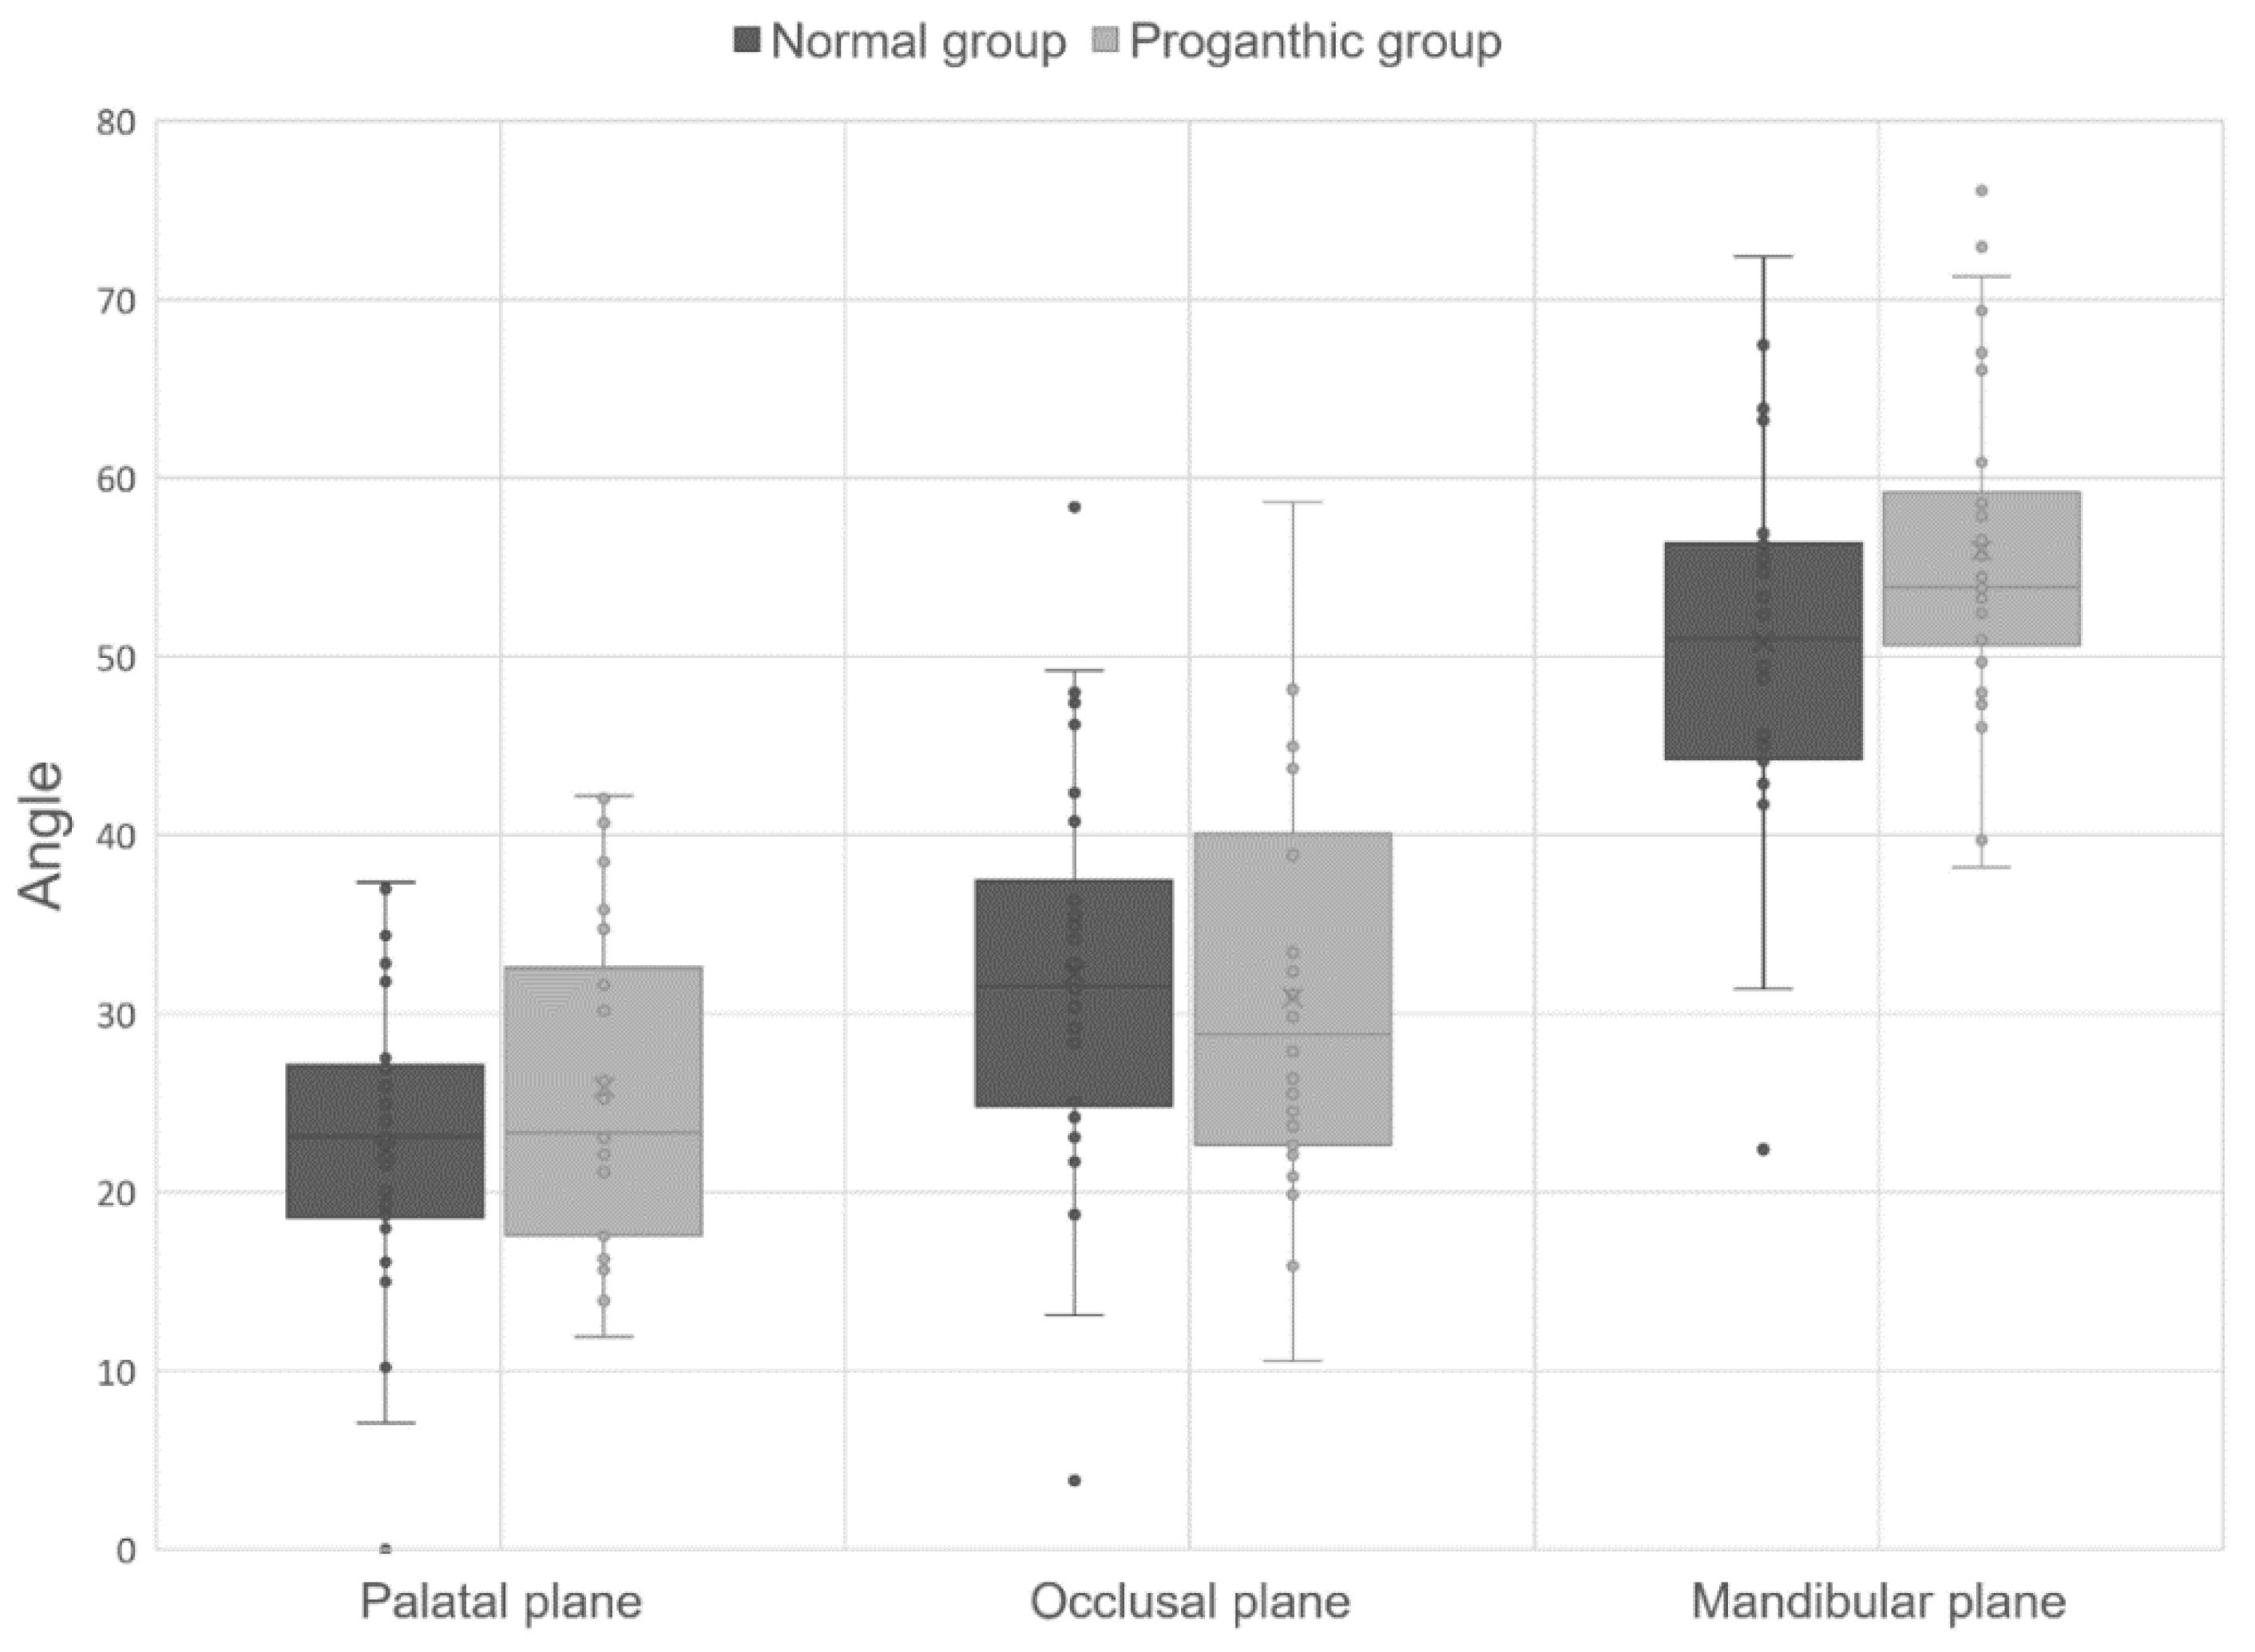
3.3. Comparison of Orientation Angles of Lateral Pterygoid to Three Reference Planes

There were significant differences in orientation for the lateral pterygoid and three reference planes between the prognathic and normal groups (Figure 4, Table 2). Although a difference was not surely found in the occlusal plane between the prognathic and normal groups, a significant difference existed between the mandibular and palatal planes of the prognathic group compared to that of the normal group. On the sagittal plane, the independent t-test showed a significantly larger angle between the mandibular plane for the prognathic group (56.0° ± 9.0°) compared to that for the normal group (50.8° ± 10.6°, p < 0.05). A larger angle was also observed between the palatal plane for the prognathic group (25.9° ± 8.8°) than for the normal group (22.4° ± 8.2°, p < 0.05), which reveals that the prognathic group individuals had lower horizontal angles compared to the reference planes.

4. Discussion

In our study, CT was applied to detect the relationship between the skeletal components of the lateral pterygoid and jawbone. Previous study has investigated the efficacy of digitally produced and CAD/CAM–fabricated mock-ups of masticatory muscle activity in patients [17]. However, they were impossible to use to survey the pterygoid muscle activity, which could reveal the efficacy of appliances on the position of the condyle. Although electromyography and ultrasonography were also used for analysis, the development of 3D CT enabled the accurate measurement and organization of prognathic muscle/skeletal volumes and orientations.
Our previous study reported the relationship between the masseter muscle and prognathic mandibular skeletal units [10]. The study showed significantly larger masseter volume/length ratios for participants in the normal group compared to the prognathic group. Considering that the difference in masseter thickness and contraction force contributes to differences in the mandible, it is natural to reason that the same logic could be applied to the lateral pterygoid. Volume/length ratio data of the lateral pterygoid are relevant to this theory. However, the difference was not as clear as in the case of the masseter muscle. It is possible to assume that, since the masseter muscle has a greater contact area with the mandible, the lateral pterygoid muscle would have less of an influence.
We also evaluated the orientation of the lateral pterygoid and calculated the values using three reference planes. The primary plane was the mandibular plane because it is the only plane that moves parallel to the mandibular movement. Among all the muscles involved in mastication, the lateral pterygoid is the only muscle with fibers running horizontally [18]. Angle data revealed that the normal group had a smaller average lateral pterygoid muscle angle with the palatal and mandibular planes, suggesting a greater horizontal tendency of the lateral pterygoid muscle. This indicates that participants in the normal group had physical predominance over those in the prognathic group, considering that lateral pterygoid is operated horizontally along the line of mandibular movement [19]. The value with the occlusal plane was less significant according to the p-value.
We have stressed that although a certain etiology between mandibular prognathism and muscle interaction has not yet been specified, it is clear that weak lateral pterygoids with ineffective orientations are strongly associated with mandibular prognathism. Masticatory muscles change the shape of the mandible and change continuously. Evaluation of the lateral pterygoid would help to understand the characteristics of mandibular prognathism, especially in the condylar area. However, the correlation between masticatory muscles was not considered. Further studies on the two remaining masticatory muscles, the medial pterygoid and temporalis muscles, are required for more information.

5. Conclusions

This retrospective study showed two distinct propositions:
(1)
The volume/length ratio of the lateral pterygoid in the normal group was larger than that in the prognathic group.
(2)
The orientation of the angle between the lateral pterygoid and palatal/mandibular plane showed a more horizontal tendency for the normal group than for the prognathic group.

Author Contributions

The study was proposed by B.K., who also set up the experiments. H.K. and D.S. performed the experiments. J.K., S.K., H.L., J.L. and B.K. produced data. All authors investigated and interpreted data. H.K., D.S. and B.K. drafted the manuscript. All authors have examined and agreed to published version of this manuscript.

Funding

This work was supported by a grant from the National Research Foundation of Korea (NRF) funded by the Korean government (MSIT) (No. 2020R1A2C1003792).

Institutional Review Board Statement

This study approved by the Institutional Review Board of Wonkwang University Daejeon Dental Hospital (W2106/001-001).

Informed Consent Statement

Patient consent was waived by the IRB because of the retrospective nature of this investigation and the use of anonymized patient data.

Data Availability Statement

The datasets generated and/or analyzed during the current study are available from the corresponding author on reasonable request, subject to the permission of the institutional review boards of the participating institutions.

Conflicts of Interest

The authors declare no conflict of interest.

References

  1. Kim, K.-J.; Park, J.H.; Chang, N.-Y.; Kim, B.C.; Chae, J.-M. Hemimandibular hyperplasia treatment with condylectomy and orthodontic camouflage treatment using miniplate. Am. J. Orthod. Dentofac. Orthop. Off. Publ. Am. Assoc. Orthod. Its Const. Soc. Am. Board Orthod. 2021, 159, 852–865. [Google Scholar]
  2. Park, J.C.; Lee, J.; Lim, H.J.; Kim, B.C. Rotation tendency of the posteriorly displaced proximal segment after vertical ramus osteotomy. J. Cranio-Maxillo-Facial Surg. Off. Publ. Eur. Assoc. Cranio-Maxillo-Facial Surg. 2018, 46, 2096–2102. [Google Scholar] [CrossRef] [PubMed]
  3. Woon, S.C.; Thiruvenkatachari, B. Early orthodontic treatment for class iii malocclusion: A systematic review and meta-analysis. Am. J. Orthod. Dentofac. Orthop. Off. Publ. Am. Assoc. Orthod. Its Const. Soc. Am. Board Orthod. 2017, 151, 28–52. [Google Scholar] [CrossRef] [PubMed]
  4. Ngan, P.; Moon, W. Evolution of class iii treatment in orthodontics. Am. J. Orthod. Dentofac. Orthop. Off. Publ. Am. Assoc. Orthod. Its Const. Soc. Am. Board Orthod. 2015, 148, 22–36. [Google Scholar] [CrossRef] [PubMed] [Green Version]
  5. Ginszt, M.; Zieliński, G.; Berger, M.; Szkutnik, J.; Bakalczuk, M.; Majcher, P. Acute effect of the compression technique on the electromyographic activity of the masticatory muscles and mouth opening in subjects with active myofascial trigger points. Appl. Sci. 2020, 10, 7750. [Google Scholar] [CrossRef]
  6. Costa, Y.M.; Exposto, F.G.; Castrillon, E.E.; Conti, P.C.R.; Bonjardim, L.R.; Svensson, P. Local anaesthesia decreases nerve growth factor induced masseter hyperalgesia. Sci. Rep. 2020, 10, 15458. [Google Scholar] [CrossRef] [PubMed]
  7. Heyat, M.B.B.; Akhtar, F.; Khan, A.; Noor, A.; Benjdira, B.; Qamar, Y.; Abbas, S.J.; Lai, D. A novel hybrid machine learning classification for the detection of bruxism patients using physiological signals. Appl. Sci. 2020, 10, 7410. [Google Scholar] [CrossRef]
  8. Stutzmann, J.J.; Petrovic, A.G. Role of the lateral pterygoid muscle and meniscotemporomandibular frenum in spontaneous growth of the mandible and in growth stimulated by the postural hyperpropulsor. Am. J. Orthod. Dentofac. Orthop. Off. Publ. Am. Assoc. Orthod. Its Const. Soc. Am. Board Orthod. 1990, 97, 381–392. [Google Scholar] [CrossRef]
  9. Mun, S.H.; Park, M.; Lee, J.; Lim, H.J.; Kim, B.C. Volumetric characteristics of prognathic mandible revealed by skeletal unit analysis. Ann. Anat.-Anat. Anz. Off. Organ Anat. Ges. 2019, 226, 3–9. [Google Scholar] [CrossRef] [PubMed]
  10. Yang, J.H.; Shin, D.S.; Yoo, J.-H.; Lim, H.J.; Lee, J.; Kim, B.C. Anatomical characteristics of the masseter muscle in mandibular prognathism. Appl. Sci. 2021, 11, 4444. [Google Scholar] [CrossRef]
  11. Lee, S.H.; Kil, T.J.; Park, K.R.; Kim, B.C.; Kim, J.G.; Piao, Z.; Corre, P. Three-dimensional architectural and structural analysis—A transition in concept and design from delaire’s cephalometric analysis. Int. J. Oral Maxillofac. Surg. 2014, 43, 1154–1160. [Google Scholar] [CrossRef] [PubMed]
  12. Kim, H.-J.; Kim, B.C.; Kim, J.-G.; Zhengguo, P.; Kang, S.H.; Lee, S.-H. Construction and validation of the midsagittal reference plane based on the skull base symmetry for three-dimensional cephalometric craniofacial analysis. J. Craniofacial Surg. 2014, 25, 338–342. [Google Scholar] [CrossRef] [PubMed]
  13. Kang, Y.H.; Kim, B.C.; Park, K.R.; Yon, J.Y.; Kim, H.J.; Tak, H.; Piao, Z.; Kim, M.K.; Lee, S.H. Visual pathway-related horizontal reference plane for three-dimensional craniofacial analysis. Orthod. Craniofacial Res. 2012, 15, 245–254. [Google Scholar] [CrossRef] [PubMed]
  14. Nahoum, H.I. Vertical proportions and the palatal plane in anterior open-bite. Am. J. Orthod. 1971, 59, 273–282. [Google Scholar] [CrossRef]
  15. Del Santo, M., Jr. Influence of occlusal plane inclination on anb and wits assessments of anteroposterior jaw relationships. Am. J. Orthod. Dentofac. Orthop. 2006, 129, 641–648. [Google Scholar] [CrossRef] [PubMed]
  16. Nelson, C.; Harkness, M.; Herbison, G.P. Mandibular changes during functional appliance treatment. Am. J. Orthod. Dentofac. Orthop. 1993, 104, 153–161. [Google Scholar] [CrossRef]
  17. Tecco, S.; Cattoni, F.; Darvizeh, A.; Bosco, F.; Sanci, V.; Nota, A.; Gastaldi, G.; Gherlone, E.F. Evaluation of masticatory muscle function using digital versus traditional techniques for mockup fabrication: A controlled prospective study. Appl. Sci. 2020, 10, 6013. [Google Scholar] [CrossRef]
  18. Stöckle, M.; Fanghänel, J.; Knüttel, H.; Alamanos, C.; Behr, M. The morphological variations of the lateral pterygoid muscle: A systematic review. Ann. Anat. 2019, 222, 79–87. [Google Scholar] [CrossRef] [PubMed] [Green Version]
  19. Rathee, M.; Jain, P. Anatomy, Head and Neck, Lateral Pterygoid Muscle. In StatPearls [Internet]; StatPearls Publishing: Treasure Island, FL, USA, 2021; Updated 13 February 2021; Available online: https://www.ncbi.nlm.nih.gov/books/NBK549799/ (accessed on 28 August 2021).
Figure 1. Surface reconstruction of a lateral pterygoid muscle and skull. The lateral pterygoid muscle and skull were initially surface reconstructed (a). The skull is transparent to reveal the initial surface models of the lateral pterygoid muscles (b). The initial surface models of the lateral pterygoid muscles (c). A polyhedron was made (d) and formed around the initial surface models of the lateral pterygoid (e). Then, the surface model of the lateral pterygoid was realistically and smoothly reconstructed (f). (Maya, version 2022, www.autodesk.com, accessed on 28 August 2021).
Applsci 11 07970 g001
Figure 2. The values between the lateral pterygoid muscle and 3 reference planes were calculated three-dimensionally using surface planes. The surface planes of the palatal (green), occlusal (violet), and mandibular planes (blue) were organized based on cranial shape. Lateral pterygoid and 3 reference planes for (a) sagittal view and (b) directional view of the normal group and (c) sagittal view and (d) directional view of the prognathic group (Maya, version 2022, autodesk.com, accessed on 28 August 2021).
Applsci 11 07970 g002
Figure 3. Distribution of lateral pterygoid volume/length ratios of prognathic and normal groups. Black and white points show normal and prognathic groups’ volume/length data, respectively. Blue dotted line represents trend line. Individuals of prognathic group are mainly located underneath trend line, while those in normal group are mainly located near and over trend line.
Applsci 11 07970 g003
Figure 4. Distribution of lateral pterygoid volume/length ratios of prognathic group and normal group on sagittal plane, with three reference planes: palatal, occlusal, and mandibular planes. Although the values of the normal group showed a wider distribution on the occlusal plane, these were not significantly different compared to those of the prognathic group. The individuals of the normal group showed greater horizontal angles to the mandibular and palatal plane than those in the prognathic group, particularly on the mandibular plane.
Applsci 11 07970 g004
Table 1. Lateral pterygoid volume/length ratios for prognathic and normal groups.
Prognathic Group
(n = 30)
Normal Group
(n = 30)
p Value
Ratio231.8 ± 58.5268.5 ± 42.60.000 *
Note: Results expressed as the mean ± SD. Ratio = volume (mm3)/length (mm). Abbreviation: SD, standard deviation. p: p-value of the paired t-test. * p < 0.05.
Table 2. Angle between lateral pterygoid and three reference planes.
Prognathic Group (n = 30)Normal Group (n = 30)p Value
Lateral pterygoidPalatal plane25.9 ± 8.8°22.4 ± 8.2°0.04 *
Occlusal plane30.9 ± 11.0°32.2 ± 11.3°0.34
Mandibular plane56.0 ± 9.0°50.8 ± 10.6°0.02 *
Note: Results are described as the mean ± SD. Abbreviation: SD, standard deviation. p: p-values of the paired t-test. * p < 0.05
Publisher’s Note: MDPI stays neutral with regard to jurisdictional claims in published maps and institutional affiliations.

