Article

Anatomical Characteristics of the Masseter Muscle in Mandibular Prognathism

Department of Oral and Maxillofacial Surgery, Daejeon Dental Hospital, College of Dentistry, Wonkwang University, Daejeon 35233, Korea
*
Author to whom correspondence should be addressed.
Ji Ho Yang and Dong Sun Shin contributed equally to this study.
Appl. Sci. 2021, 11(10), 4444; https://doi.org/10.3390/app11104444
Submission received: 7 April 2021 / Revised: 6 May 2021 / Accepted: 11 May 2021 / Published: 13 May 2021
(This article belongs to the Special Issue Mandibular Characteristics in Dentofacial Dysmorphosis)

Abstract

:
Mandibular prognathism causes functional and esthetic problems. Therefore, many studies have been conducted to understand its etiology. Following our previous study, which revealed that the major characteristic of the mandible with prognathism is the volume/length ratio of the mandibular body and condyle, we analyzed the volume and orientation of the masseter muscle, which inserts into the mandibular body, expecting that the difference in the size of the masseter muscle causes the difference in the mandibular size. This study compared the masseter muscle of the participants in the prognathic group to those in the normal group on the volume/length ratio and orientation. The masseter muscle ratios (volume/length); the angle between the superficial and deep head of the masseter muscle; and the three planes (the palatal, occlusal, and mandibular) were analyzed. A total of 30 participants constituted the normal group (male: 15, female: 15) and 30 patients, the prognathic group (male: 15, female: 15). The results showed that the volume/length ratio of the masseter of the normal group was greater than that of the prognathic group (p < 0.05). In addition, the orientation of both the superficial and deep head of the masseter of the participants in the normal group was more vertical with respect to the mandibular plane than that of the prognathic group (p < 0.05). We concluded that the mechanical disadvantage of the masseter muscle of the prognathic group is attributed to mandibular prognathism.

1. Introduction

In the oral and maxillofacial field, mandibular prognathism is considered to be one of the major issues since it causes functional and esthetic problems, which cannot be treated without surgery in most adults [1,2]. However, in young patients, it is possible to prevent or relieve mandibular prognathism by regulating the growth pattern, and predicting mandibular growth and the timing of treatment, which are considered to be the most important factors [3,4]. Therefore, many studies have been carried out to understand mandibular growth and factors that affect it.
In 1968, Moss first described the functional units of the mandible to be composed of symphysis, body, angle, coronoid, and dentoalveolus [5]. He proposed the concept of a functional matrix, which is the soft tissue surrounding the bone, and that a functional matrix regulates the growth of bone [6]. Several studies have reported the relationship between the masticatory muscles and craniofacial morphology [7,8,9]. Sella-Tunis et al. showed that wider mandibular shape is associated with larger masticatory muscle force [10]. Marques associated brachycephalic pattern with a strong bite force and the dolichocephalic pattern with a relatively weaker bite force [11]. Gionhaku and Kiliaridis described the relationship between brachycephalic morphology and large masticatory muscles [12,13]. Van Spronsen suggested that the combined action of the mandibular muscles can induce a specific stress pattern and mandibular remodeling [14].
In our previous study, the volumetric characteristics of normal and prognathic mandibles were demonstrated by skeletal unit analysis [15]. The results of the study showed that the mandibular body and condyle of prognathic mandibles had a statistically lower volume/length ratio than that of normal mandibles. As the masseter muscle attaches to the mandibular body and the lateral pterygoid muscle attaches to the condyle, we assumed that these two muscles are mainly associated with mandibular growth in prognathism.
There are four bilateral masticatory muscles, and the masseter muscle is one of them. It originates from the zygomatic arch and inserts into the angle of the mandible. It is derived from a single muscle mass at gestational day 11, matures with the branching of the trigeminal nerve, and establishes complexity before birth [16]. During this period, differentiation occurs during the 22nd week of gestation, following that of the skeletal muscles of the trunk and limb [17].
In this study, we compared the masseter muscle of the normal mandible with that of the prognathic one. To evaluate the force of the muscle, we investigated the volume/length ratio and the orientation to the mandibular plane, the former for the magnitude of the force and the latter for the direction of the force. We compared the orientation of the masseter muscle to three planes: palatal, occlusal, and mandibular. The palatal and mandibular planes indicate the origin and insertion of the masseter muscle, respectively. The occlusal plane indicates where upper and lower teeth meet. We assumed that the masseter muscle of the normal group would be thicker and more vertical with respect to the mandibular plane, which means that the masseter muscle of the participants in the normal group would have a mechanical advantage over those of the prognathic group.

2. Materials and Methods

2.1. Participants

The data of 60 Korean subjects (30 men and 30 women), who visited Wonkwang University Daejeon Dental Hospital, were evaluated. CT images were taken for various reasons according to the patient’s chief complaint such as orthodontic diagnosis, mandibular third molar assessment, and maxillary sinusitis. Skeletal and dental measurements were recorded using 3D CT scans. The inclusion criteria were as follows: age between 18 and 29 years, presence of full dentition except permanent third molars, and a willingness to undergo 3D CT of the skull. The hemi-mandible of the 3D CT was used for analysis. The exclusion criteria were chronic periodontitis, congenital deformities, severe asymmetry, history of trauma on both sides of the mandible, or orthognathic surgery. Participants with asymmetry, who had more than 2 mm of menton deviation from the mid-sagittal plane, were excluded. Among the participants with trauma, the non-involved hemi-mandibles were analyzed. A total of 60 hemi-mandibles from 60 participants were analyzed. This study was approved by the Institutional Review Board of Daejeon Dental Hospital, Wonkwang University (W1906/001-001).

2.2. Group Classification

The participants were divided into two groups according to the Steiner’s analysis and the Delaire’s analysis. In Steiner’s analysis, we calculated the sella-nasion-A point angle (SNA), sella-nasion-B point angle (SNB), and the A point-nasion-B point angle (ANB). In Delaire’s analysis, we calculated the angle between the C1 plane, which is a constructed horizontal reference plane, and the Me-based F1 plane, which is a naso-fronto-maxillary point to menton point [18]. These values were calculated on the midsagittal plane of the 3D CT image. The participants with normal SNB value and normal C1-Me-based F1 angle were classified into the normal group (n = 30, 15 men and 15 women) and participants with high SNB values and high C1-Me-based F1 angle were classified as the prognathic group (n = 30, 15 men and 15 women). The normal group showed 78.42° ± 0.76° of SNB, 86.82° ± 0.99° of C1-Me-based F1 in average, and the prognathic group showed 83.59° ± 1.07° of SNB and 92.63° ± 1.07° of C1-Me-based F1 on average (mean ± standard deviation). The age range of the normal group participants was 18 to 29 years (mean age 22.4 ± 3.4) while that for the prognathic group was 18 to 27 years (mean age 21.0 ± 2.7).

2.3. 3D CT and Segmentation

A 3D analysis was performed using a SOMATOM Definition Dual Source CT (DSCT; Siemens, Forchhelm, Germany) with the following imaging conditions: field of view, 20.8 cm; 100 kV; 76 mAs; scanning time, 1 s; and 0.5 mm thickness. The participants were instructed to be static and maintain centric occlusion to avoid changes in the masseter volume [19]. All cross-sectional CT images were stored in Digital Imaging Communication in Medicine (DICOM) format, and the reconstruction was performed using Mimics 10.0 (Materialize n.v., Leuven, Belgium). Subsequently, the superficial and deep layers of the masseter muscle and skull were outlined.
Outlines of the skull were automatically drawn using the ‘threshold’ method in Mimics. The outlines of the superficial and deep layers of the masseter muscle were drawn manually for each participant. Per five serial sections, one outline was drawn in the horizontal, sagittal, and coronal planes individually. As a result, approximately 20 outlines were drawn in each plane.

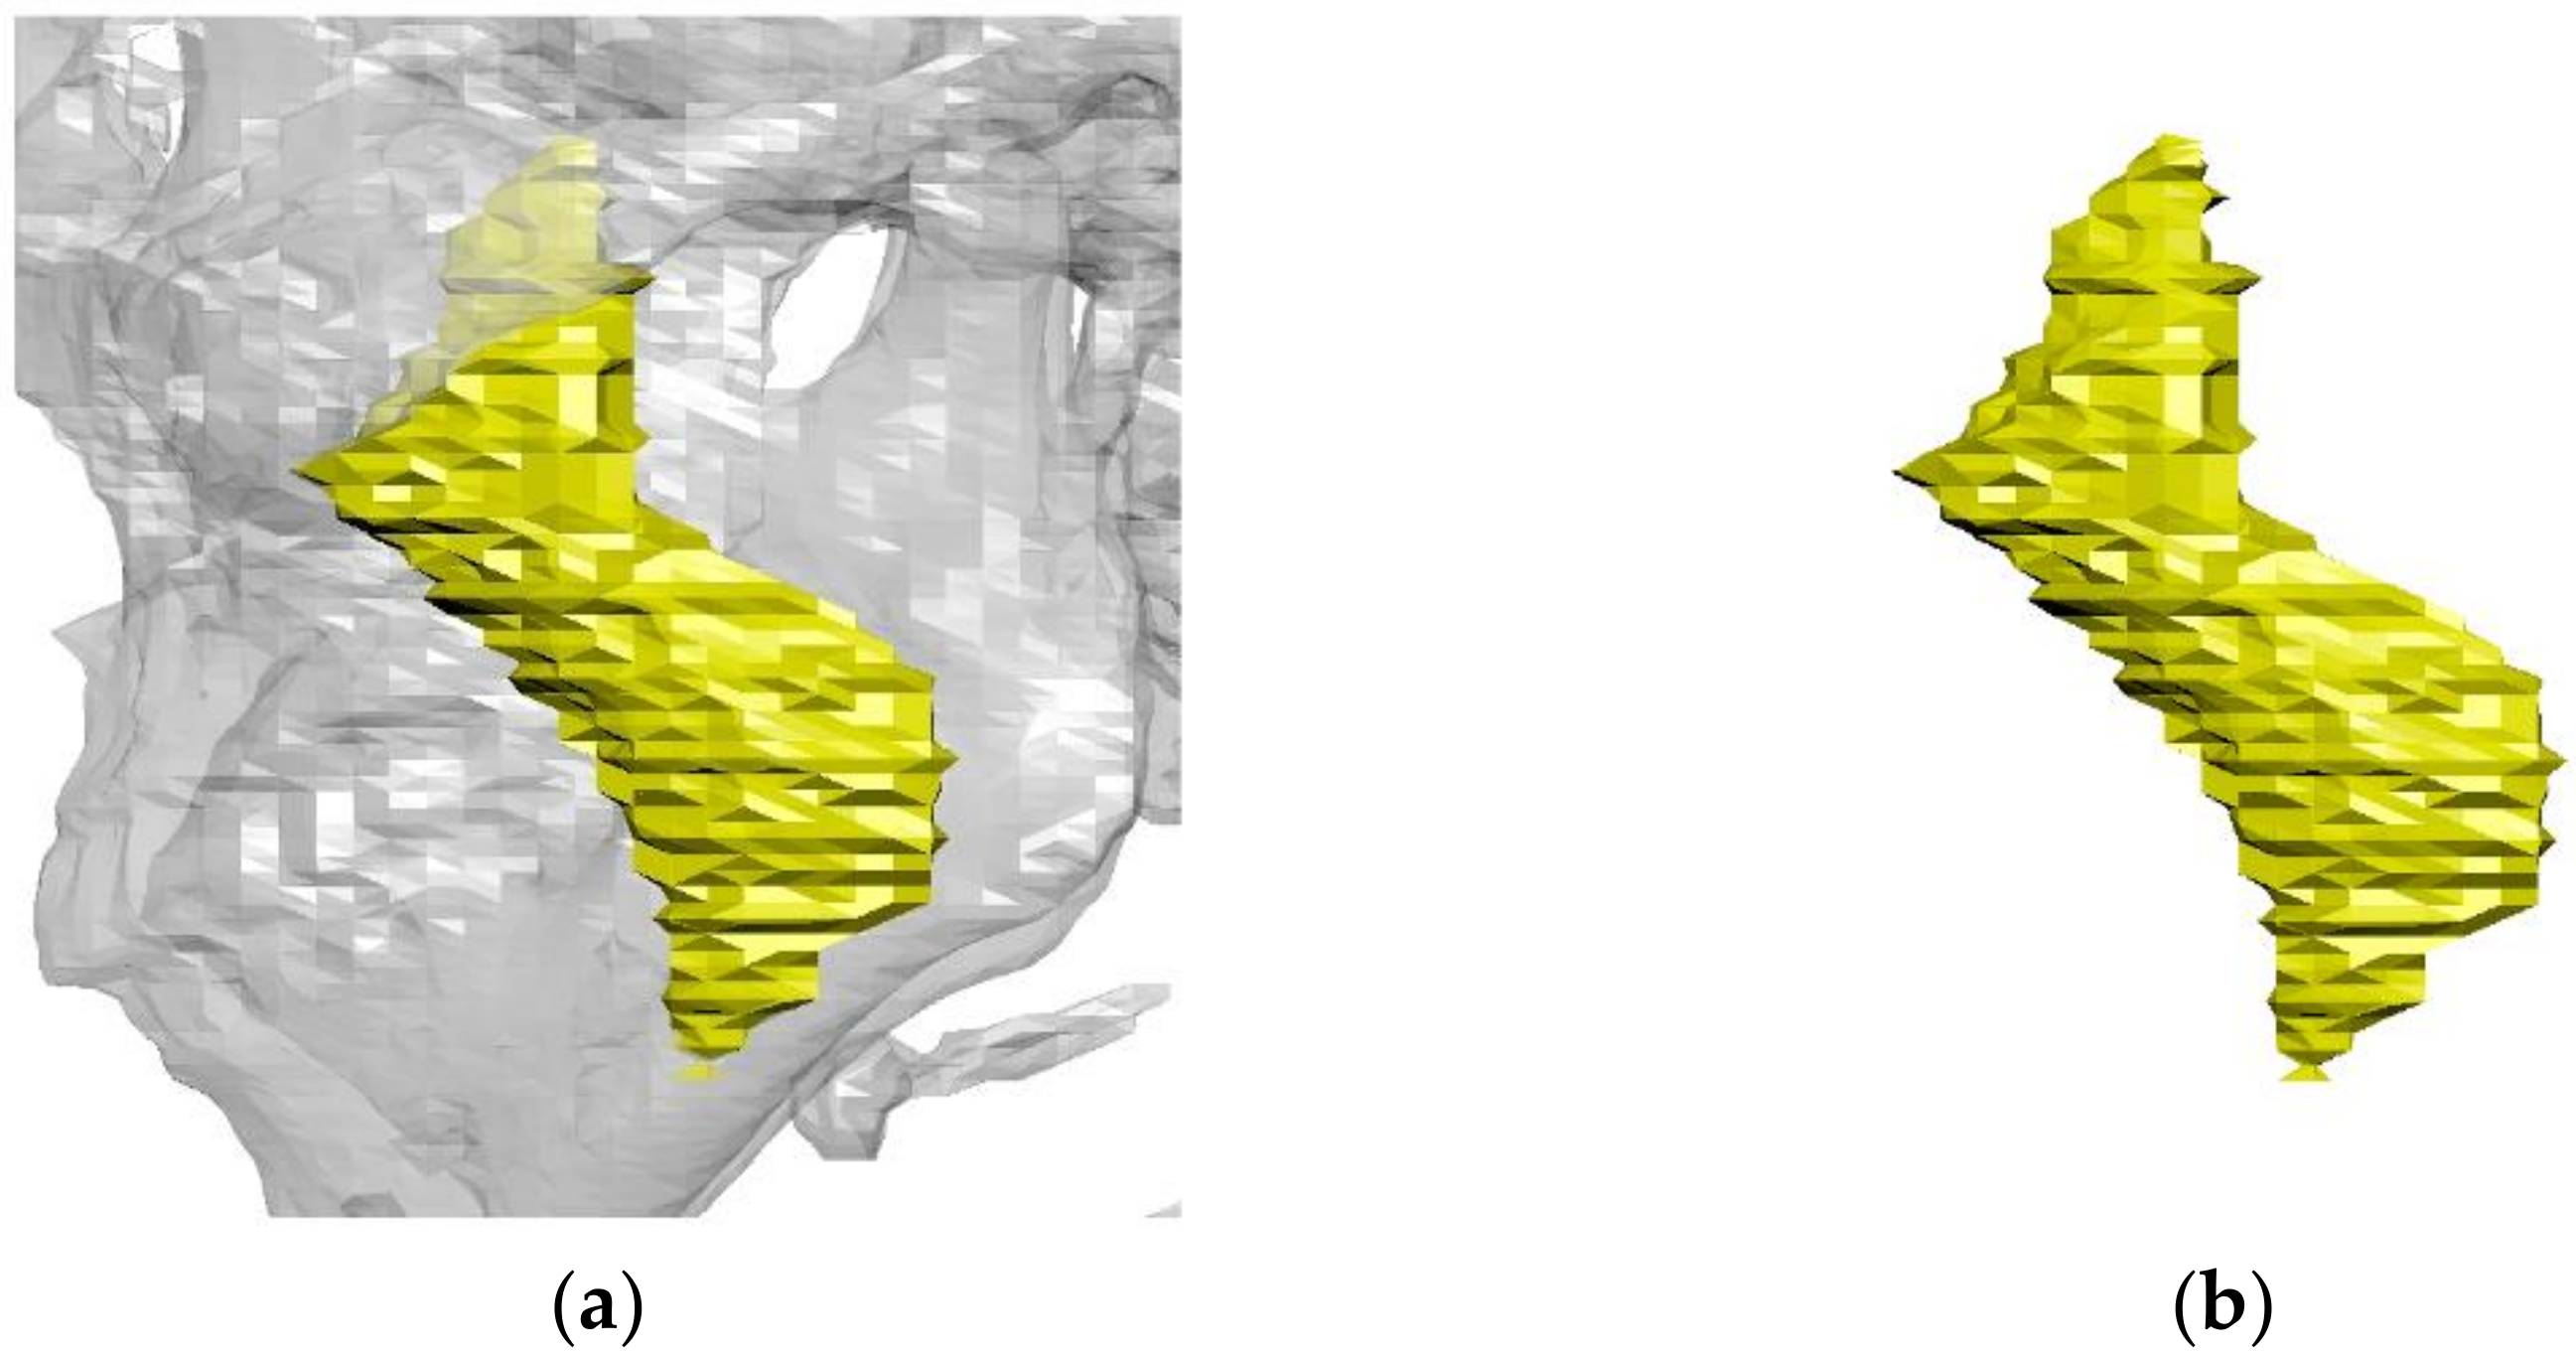
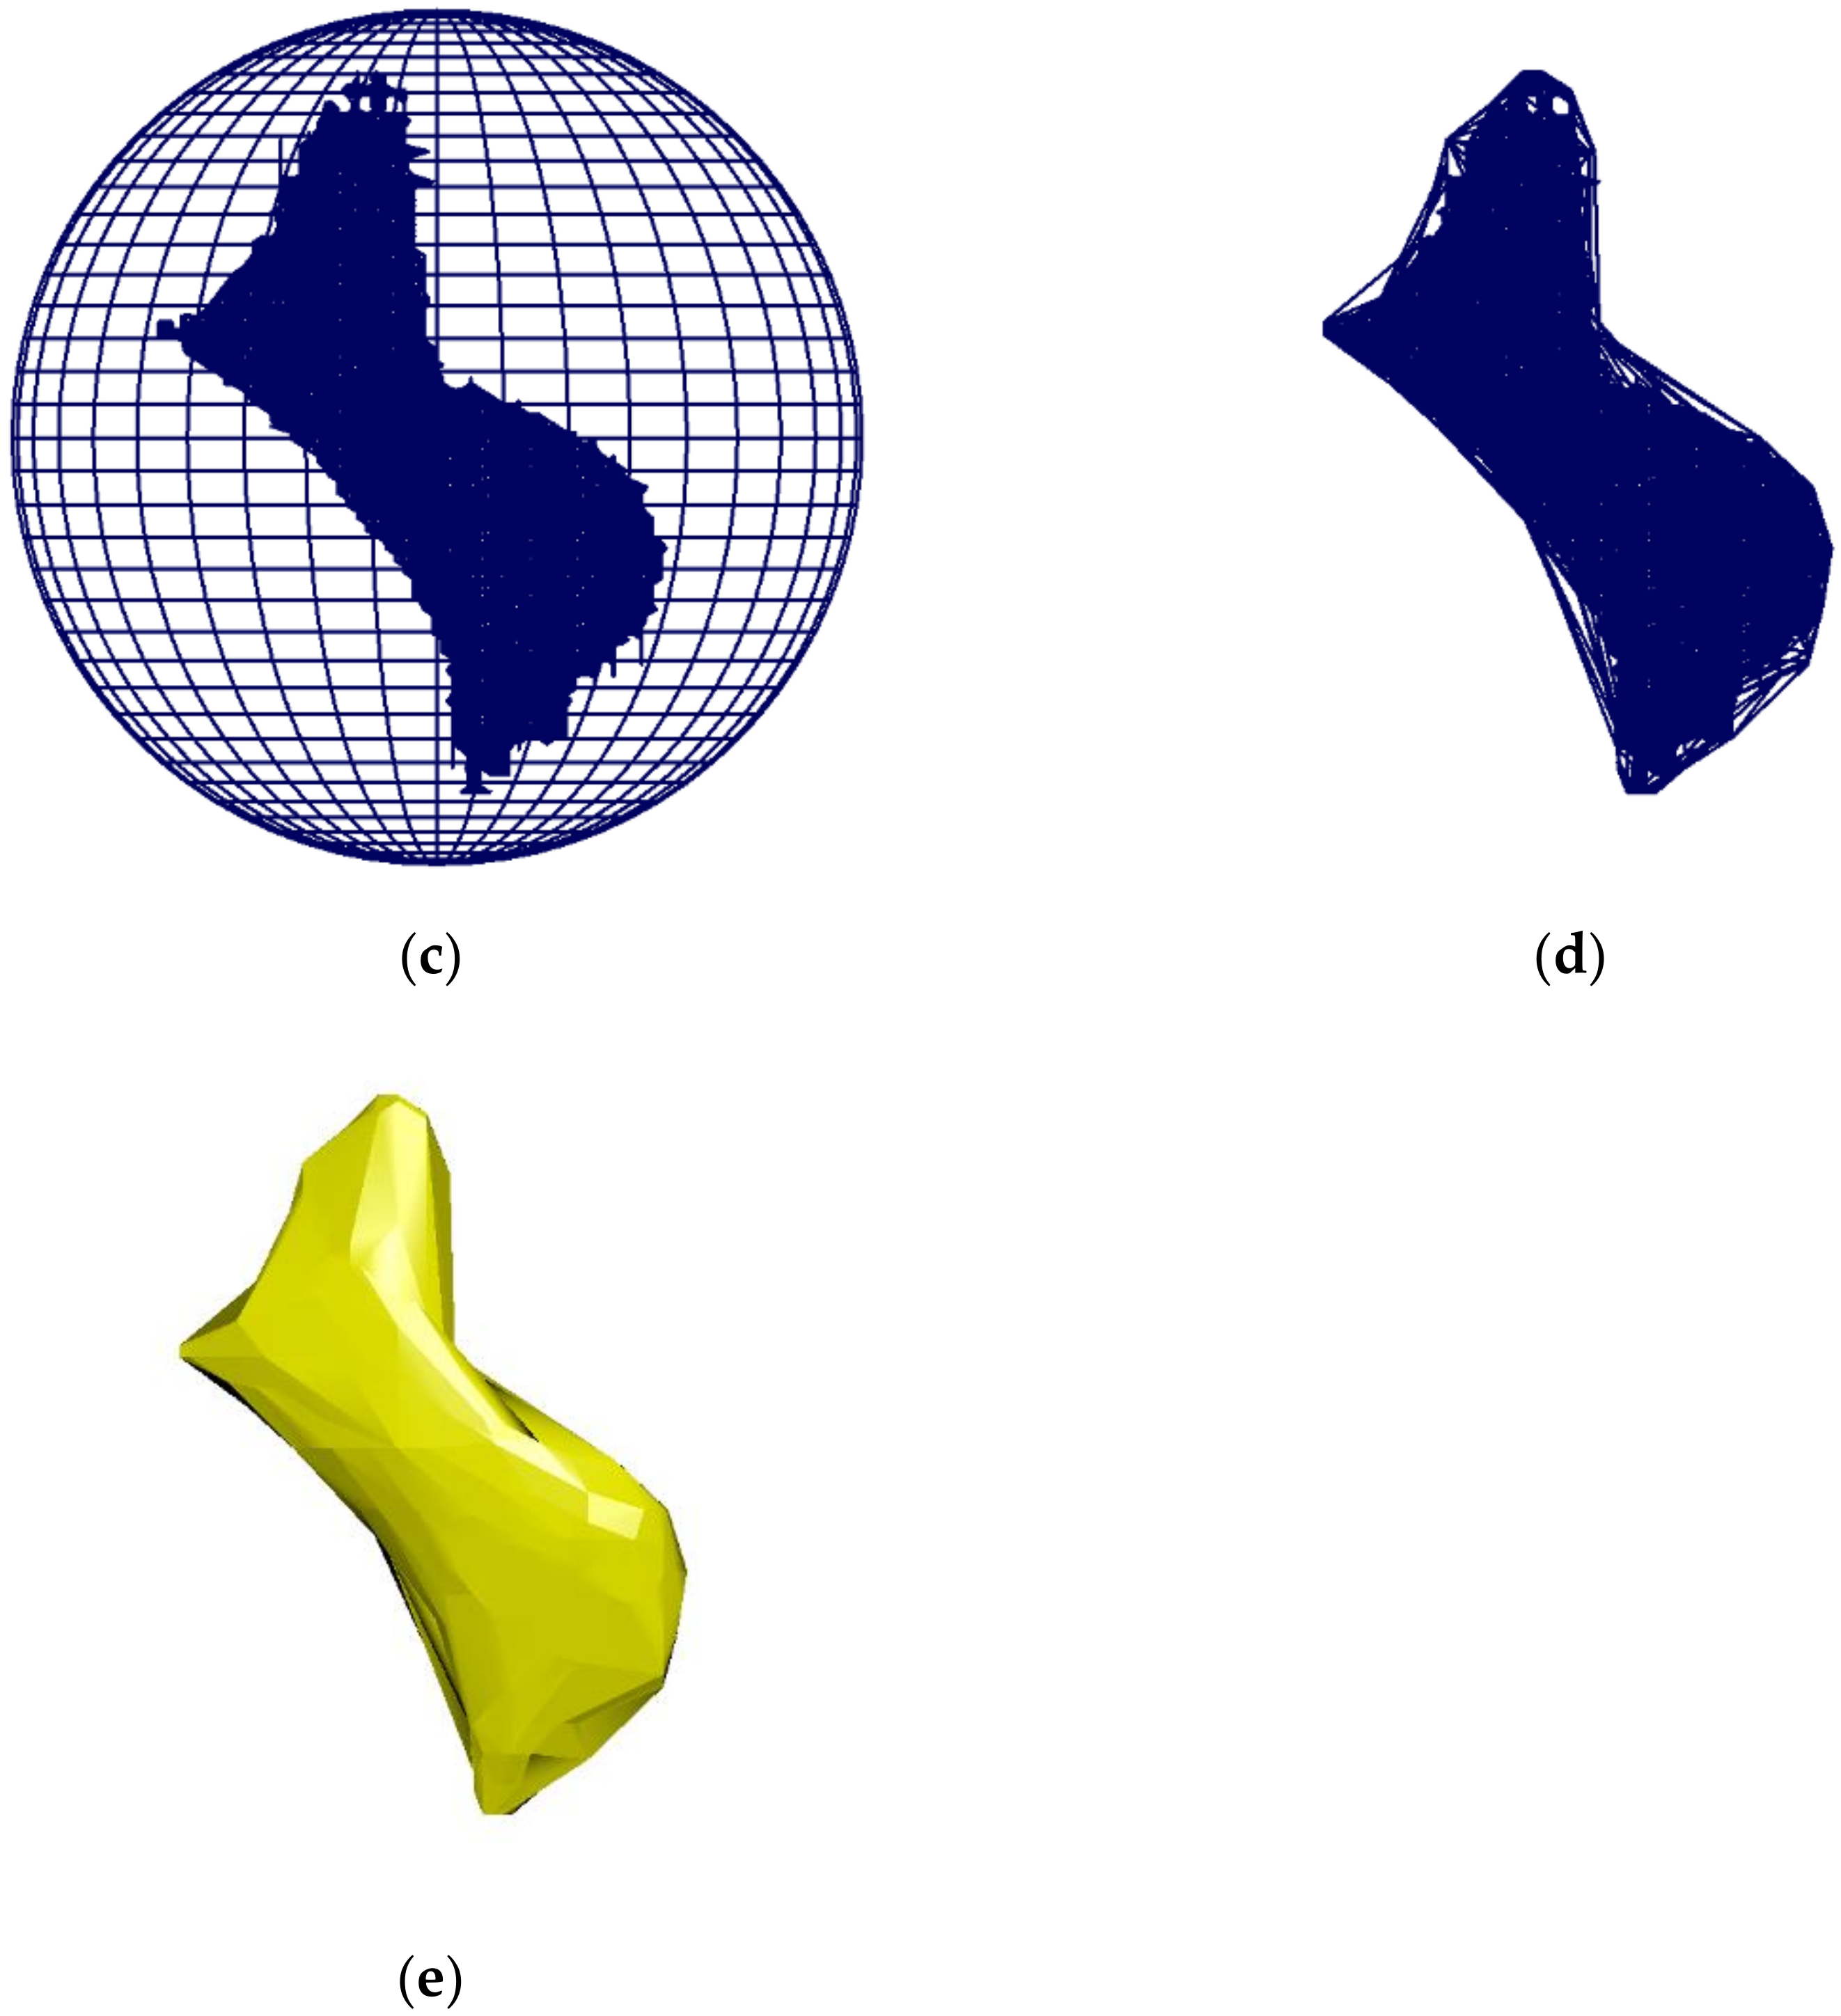
2.4. 3D Image Reconstruction and Revision

Surface outlines were reconstructed using Mimics. Among the high-, middle-, and low-quality surface reconstruction options, we used the low-quality option because high- and medium-quality surface models were difficult to handle in the next procedure owing to the file size.
Skulls were automatically reconstructed with a real shape owing to automatic whole segmentation. However, each layer of the masseter was not smoothly and realistically reconstructed because whole segmentation was not performed. The outlines were sparsely drawn. Therefore, using Maya version 2018 (Autodesk, Inc., San Rafael, CA, USA), surface models of the sphere were created and wrapped in each layer of the masseter. Thus, the layers of the superficial and deep masseter muscles were accurately reproduced (Figure 1).

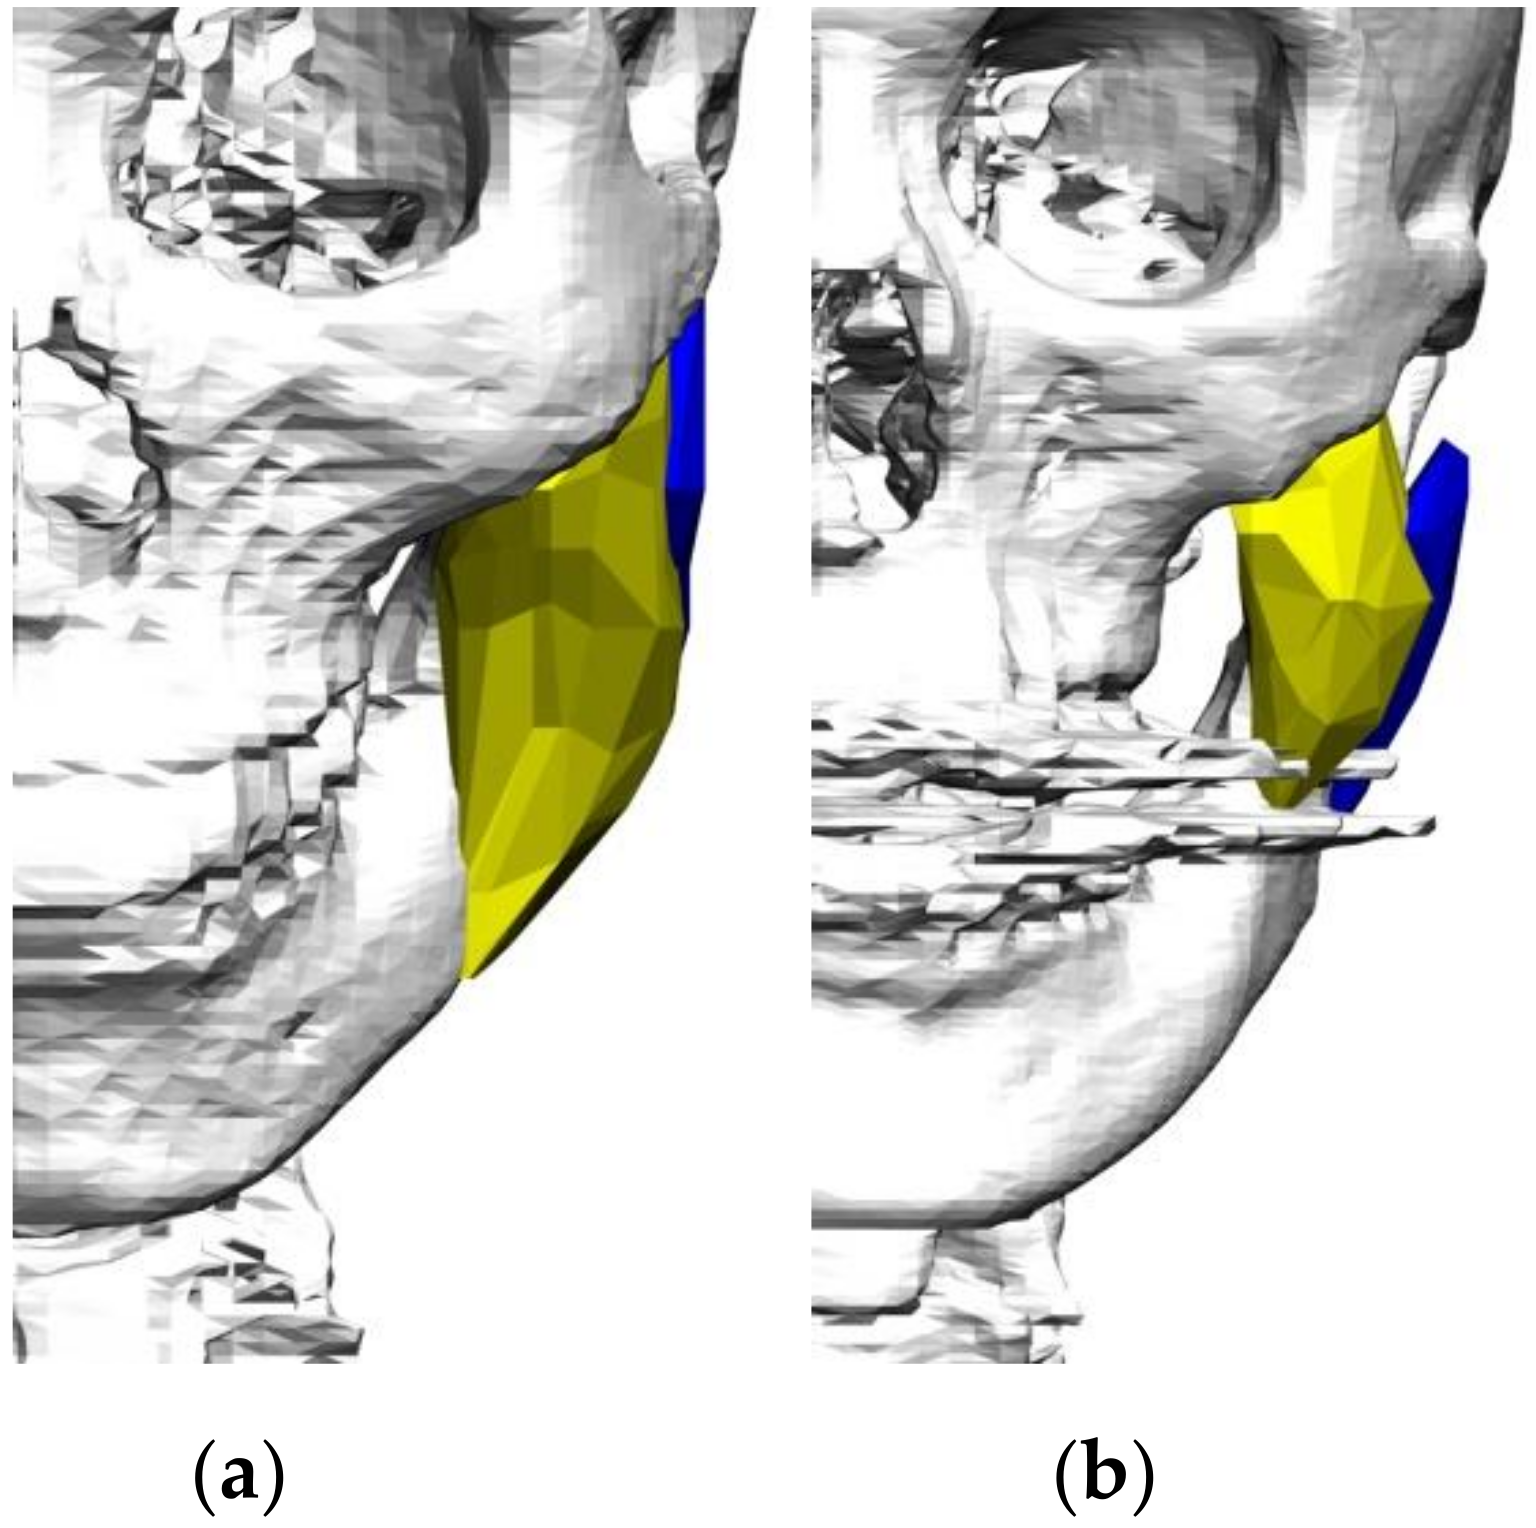
2.5. Volume and Length Measurement of the Masseter Muscle

The volumes of the two layers of masseter were measured using the ‘poly volume’ function in the ‘Head-up Display’ menu in Maya Bonus Tool. The value of volume displayed in the ‘Script’ window was collected. The volume of the masseter muscle is presented in Figure 2.
Surface models of the ruler were created to measure the lengths of the two layers of the masseter. The length of the ruler was displayed in the “Transform Attributes” window, and the value was obtained. Because of individual differences in masseter muscle morphology, a ratio was obtained by dividing the masseter muscle volume by its length; this ratio was analyzed.

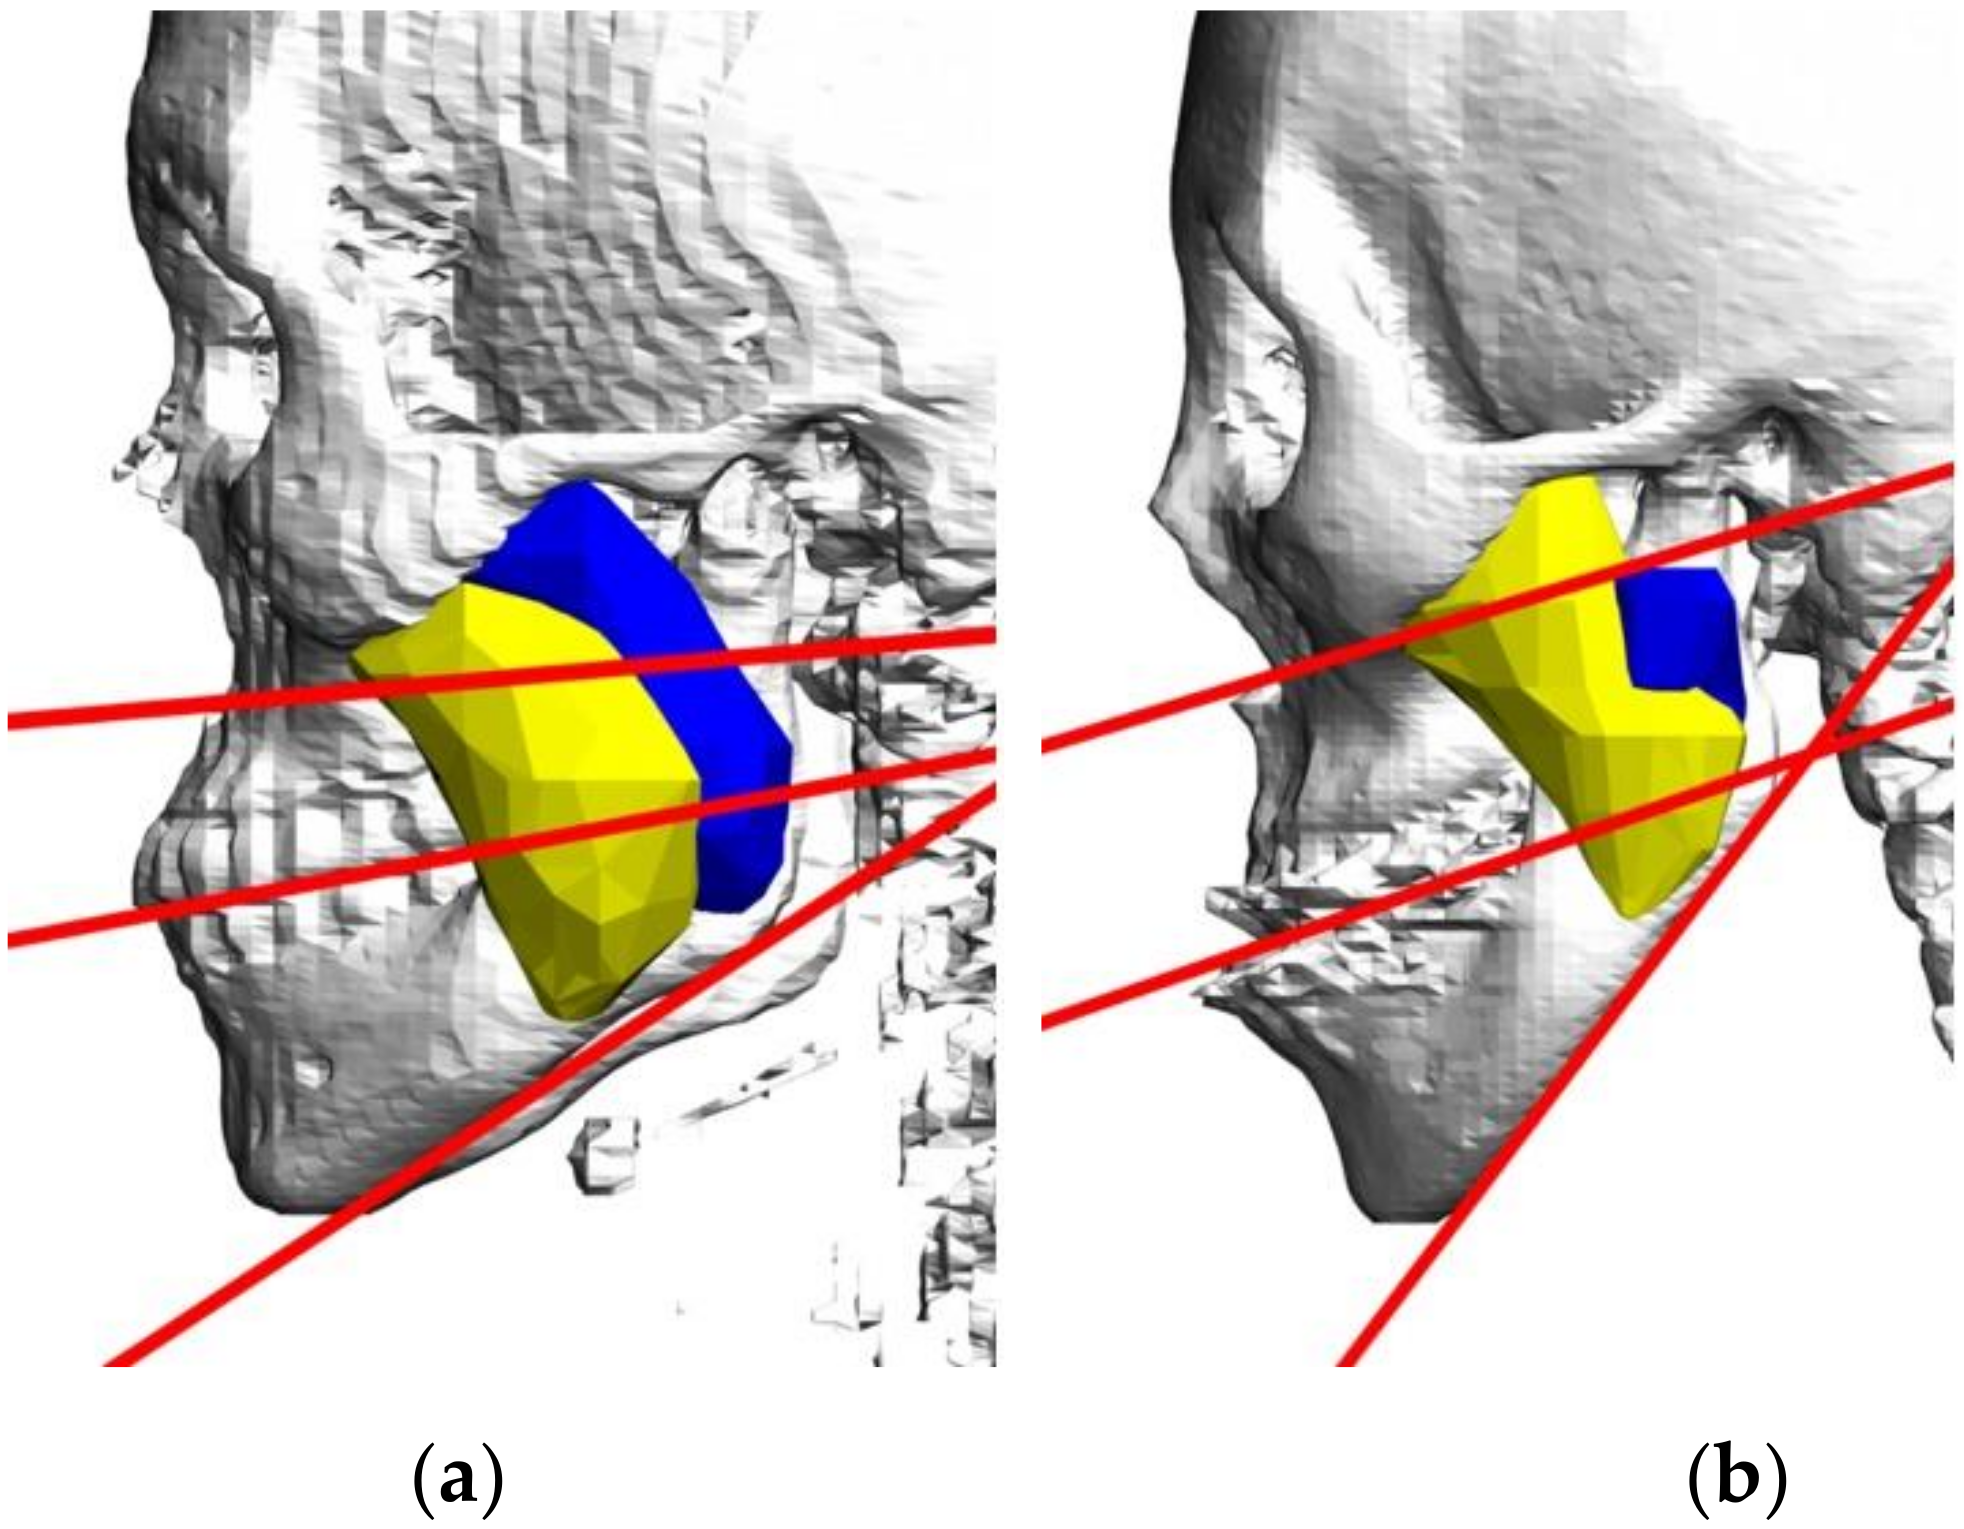
2.6. Measurement of Angles between the Masseter Muscle and the Reference Planes

The orientations of the two layers of masseter between the reference planes were measured using curves. Firstly, surface models of the palatal, occlusal, and mandibular planes (horizontal plane) were created based on the skull morphology. The palatal plane runs parallel to Plane C1 in Delaire’s analysis and represents the superior cranial base plane [18]. The reference planes are presented in Figure 3. Secondly, an angled curve was drawn along the plane in the previously created surface model of the ruler in the midsagittal plane. The definitions of the planes are as follows:
-
Midsagittal plane: Plane through the foramen cecum, falx cerebri, and center of the foramen magnum [20].
-
Horizontal plane: Plane through the midpoints of the bilateral eyeball and bilateral orbital canal [21].
-
Palatal plane: A plane perpendicular to the midsagittal plane passing through the anterior nasal spine and posterior nasal spine [22].
-
Occlusal plane: Plane through half distance point between the incisal edges of the maxillary and mandibular incisors and the mesial cuspid tips of the mandibular bilateral permanent first molars [23].
-
Mandibular plane: A plane perpendicular to the midsagittal plane passing through Go (Gonion) and Me (Menton) [24].
Thirdly, the angle of the curve was measured using the “Measure Angle Tool” script. The most inferior and superior anterior points of the masseter were the two reference points of two layers of the masseter muscle, respectively. In sagittal view, the angle between the masseter muscle and reference planes was measured. The value of the measured angle was displayed on a display view and collected for analysis.

2.7. The Reliability of Measurements

The method error associated with indicating the reference points on the 3D CT images (measured as an intraobserver and interobserver error) was evaluated for 20 randomly selected reference points by two authors. Each author digitized the 20 reference points on 3D CT images 20 times in 2-week intervals. The results were assessed using Dahlberg’s formula and analyzed statistically by ICC as follows:
E ( x or y , or z ) = [ ( x n x n 1 ) 2 or ( y n y n 1 ) 2 or ( z n z n 1 ) 2 ] / 2 N
where xn denotes the positional value of point xn, and xn–1 is the positional value of point xn–1 in the x coordinate.

2.8. Statistical Analysis

The results are shown as mean ± standard deviation (SD). An independent t-test was used to evaluate the relationship between normal group and prognathic group participants. A p-value < 0.05 was considered statistically significant. All analyses were performed using IBM SPSS Statistics 23.0 (IBM Corp., Armonk, NY, USA).

3. Results

3.1. Reliability of Measurements

The intraobserver error ranged between 0.2 and 0.8 mm for the reproducibility of the reference points. The intraclass correlation (ICC) with 95% confidence intervals was 0.992 (p > 0.0001) for intraobserver reliability and 0.929 (p > 0.0001) for interobserver reliability.

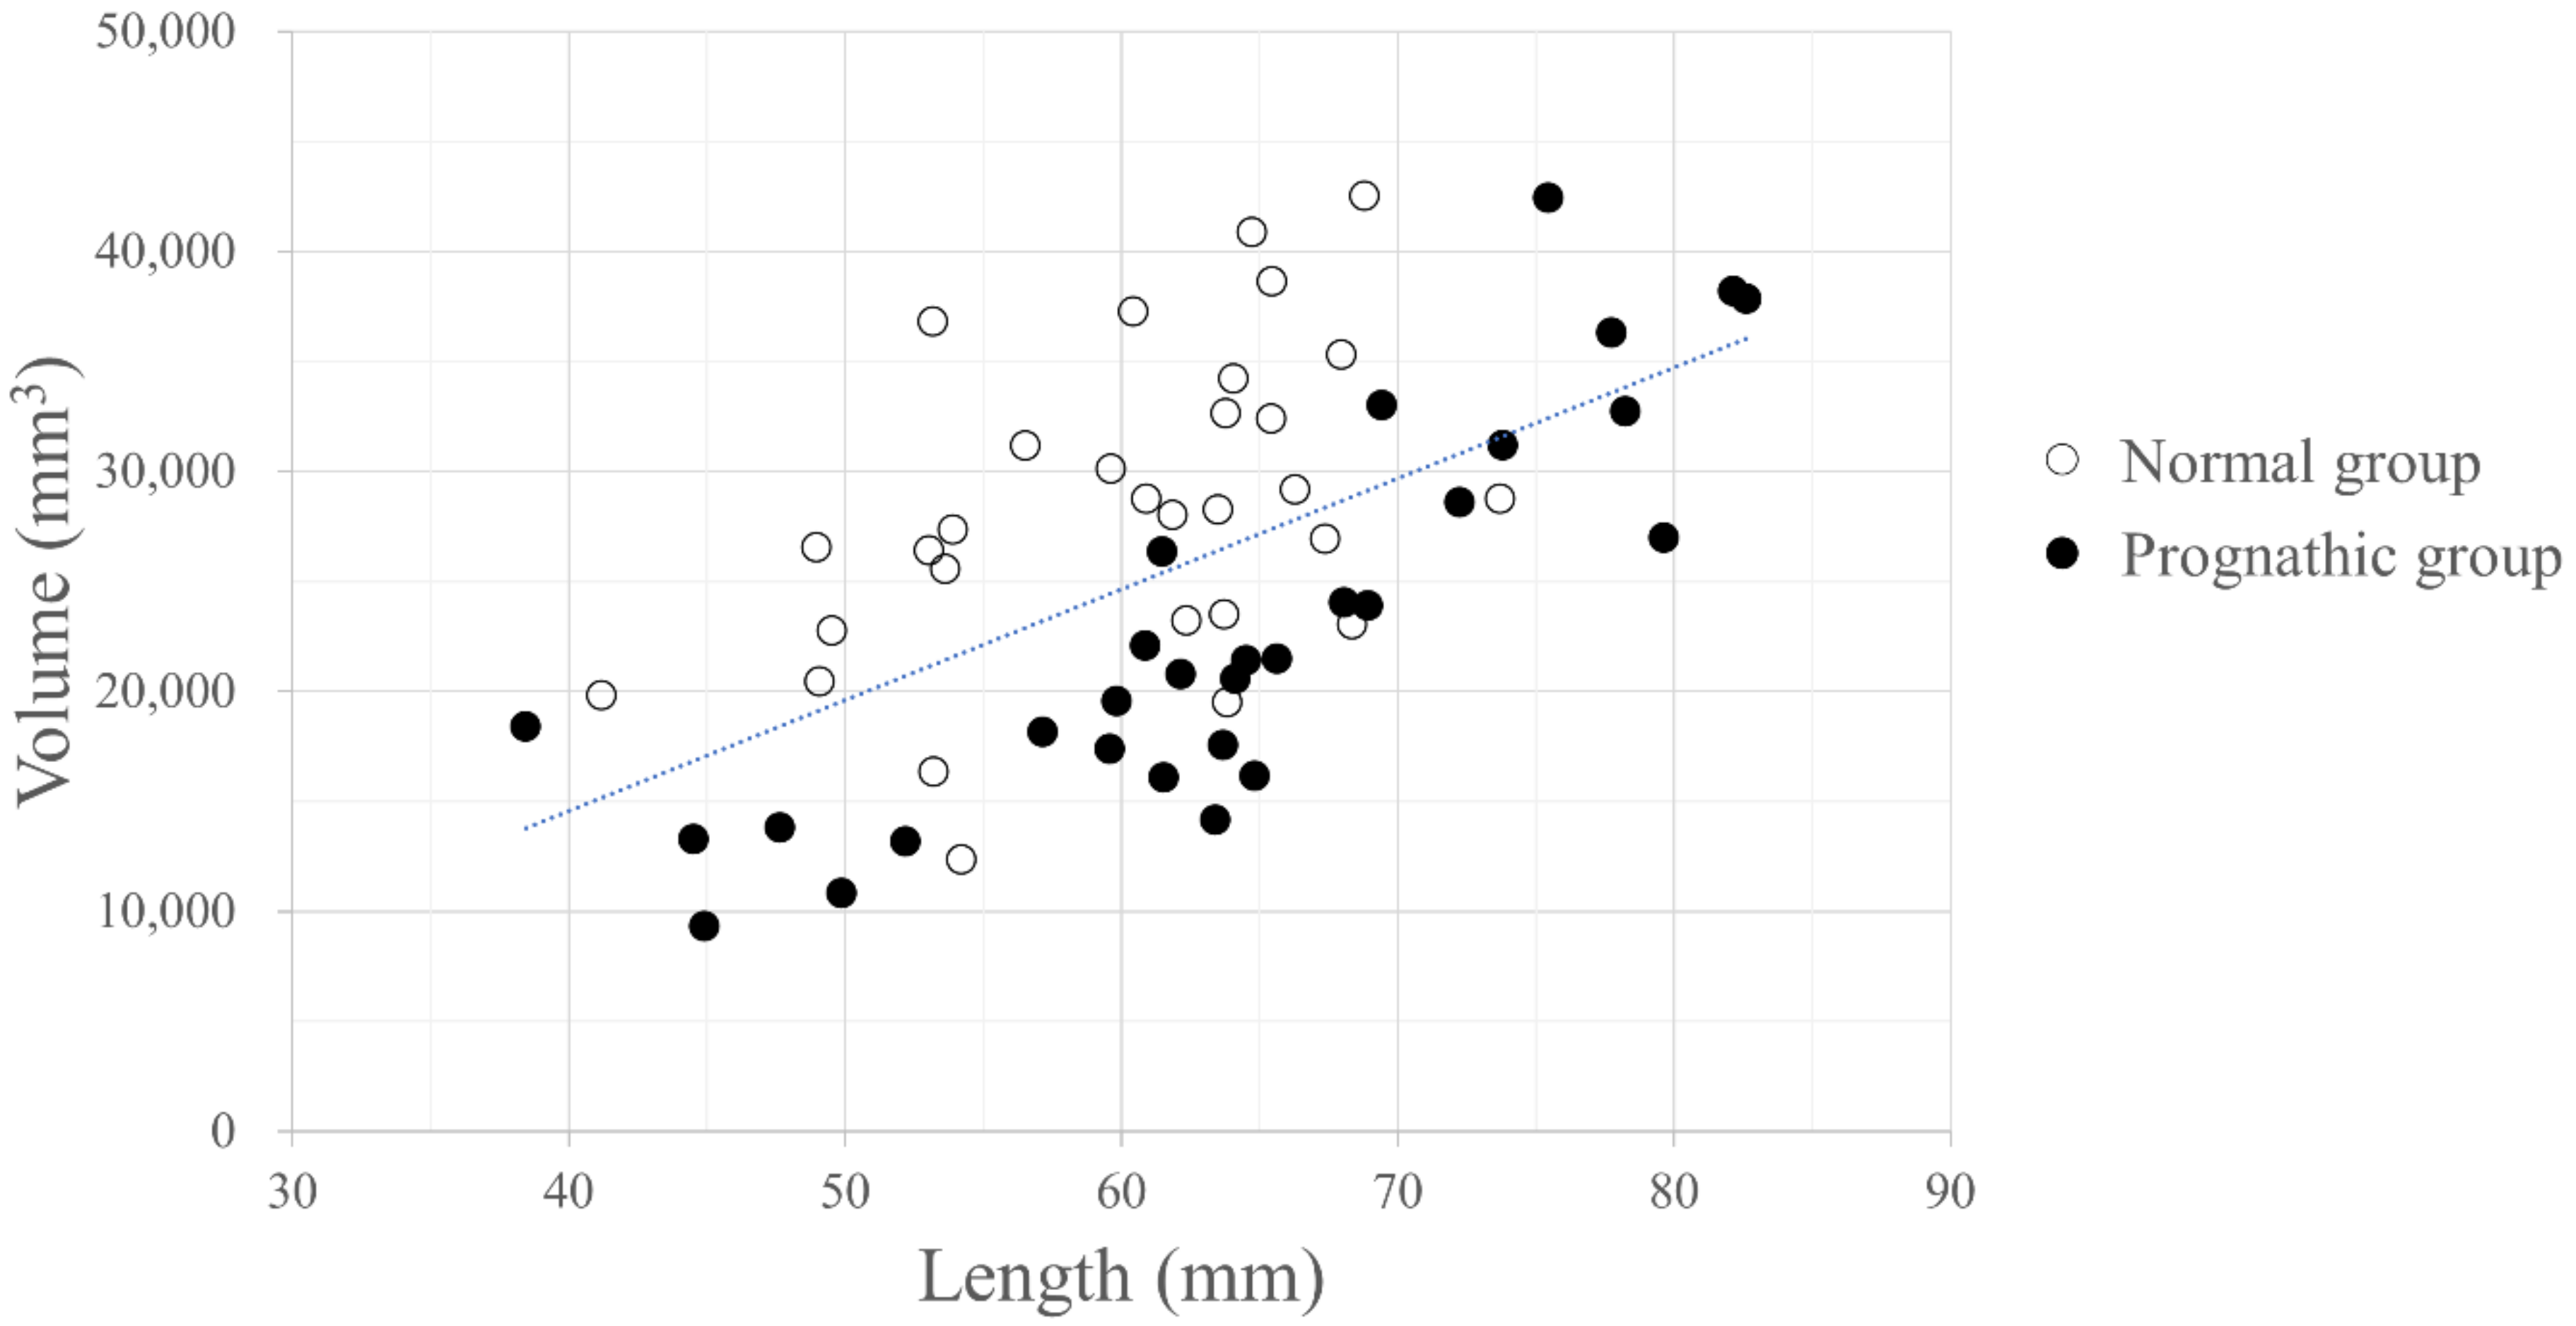
3.2. Comparison of the Masseter Muscle Ratio between the Normal Group and Prognathic Group

There was a significant difference in masseter size between normal and prognathic individuals. Prognathic individuals demonstrated a significantly smaller masseter volume-to-length ratio compared with individuals with normal face type. The independent t-test showed significantly smaller masseter muscle ratio in the prognathic group (350.0 ± 90.0) compared with the normal group (472.6 ± 105.6), p < 0.05 (Figure 4, Table 1).

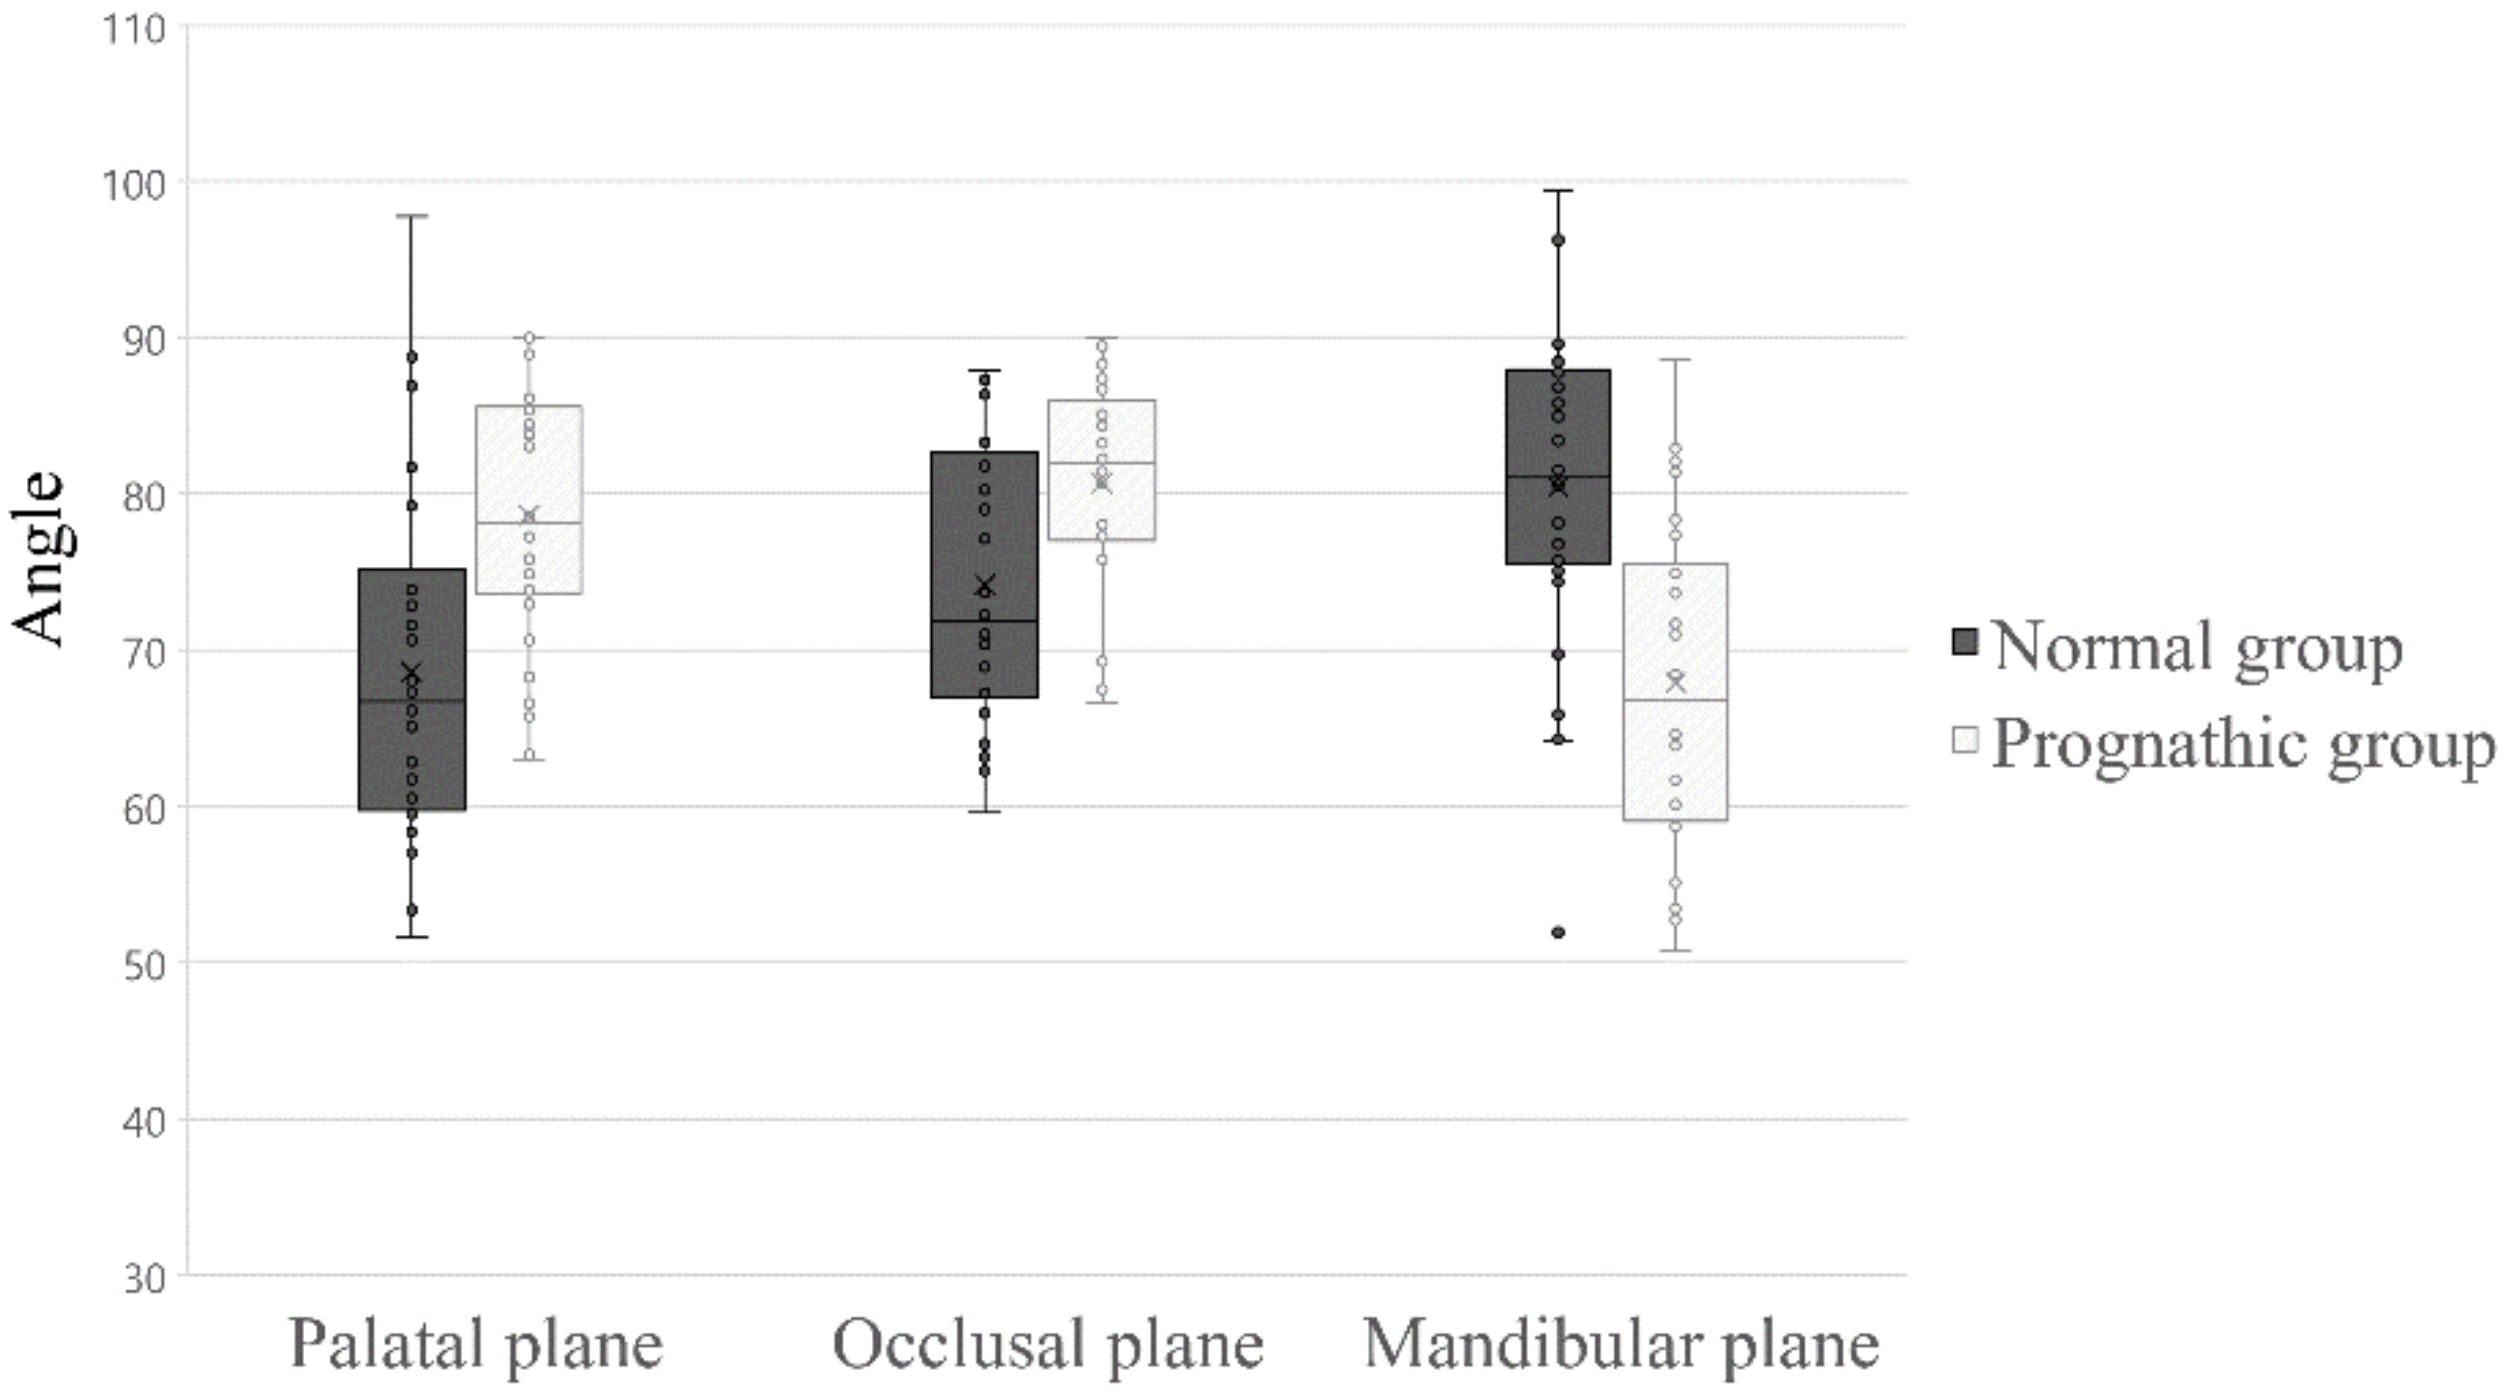
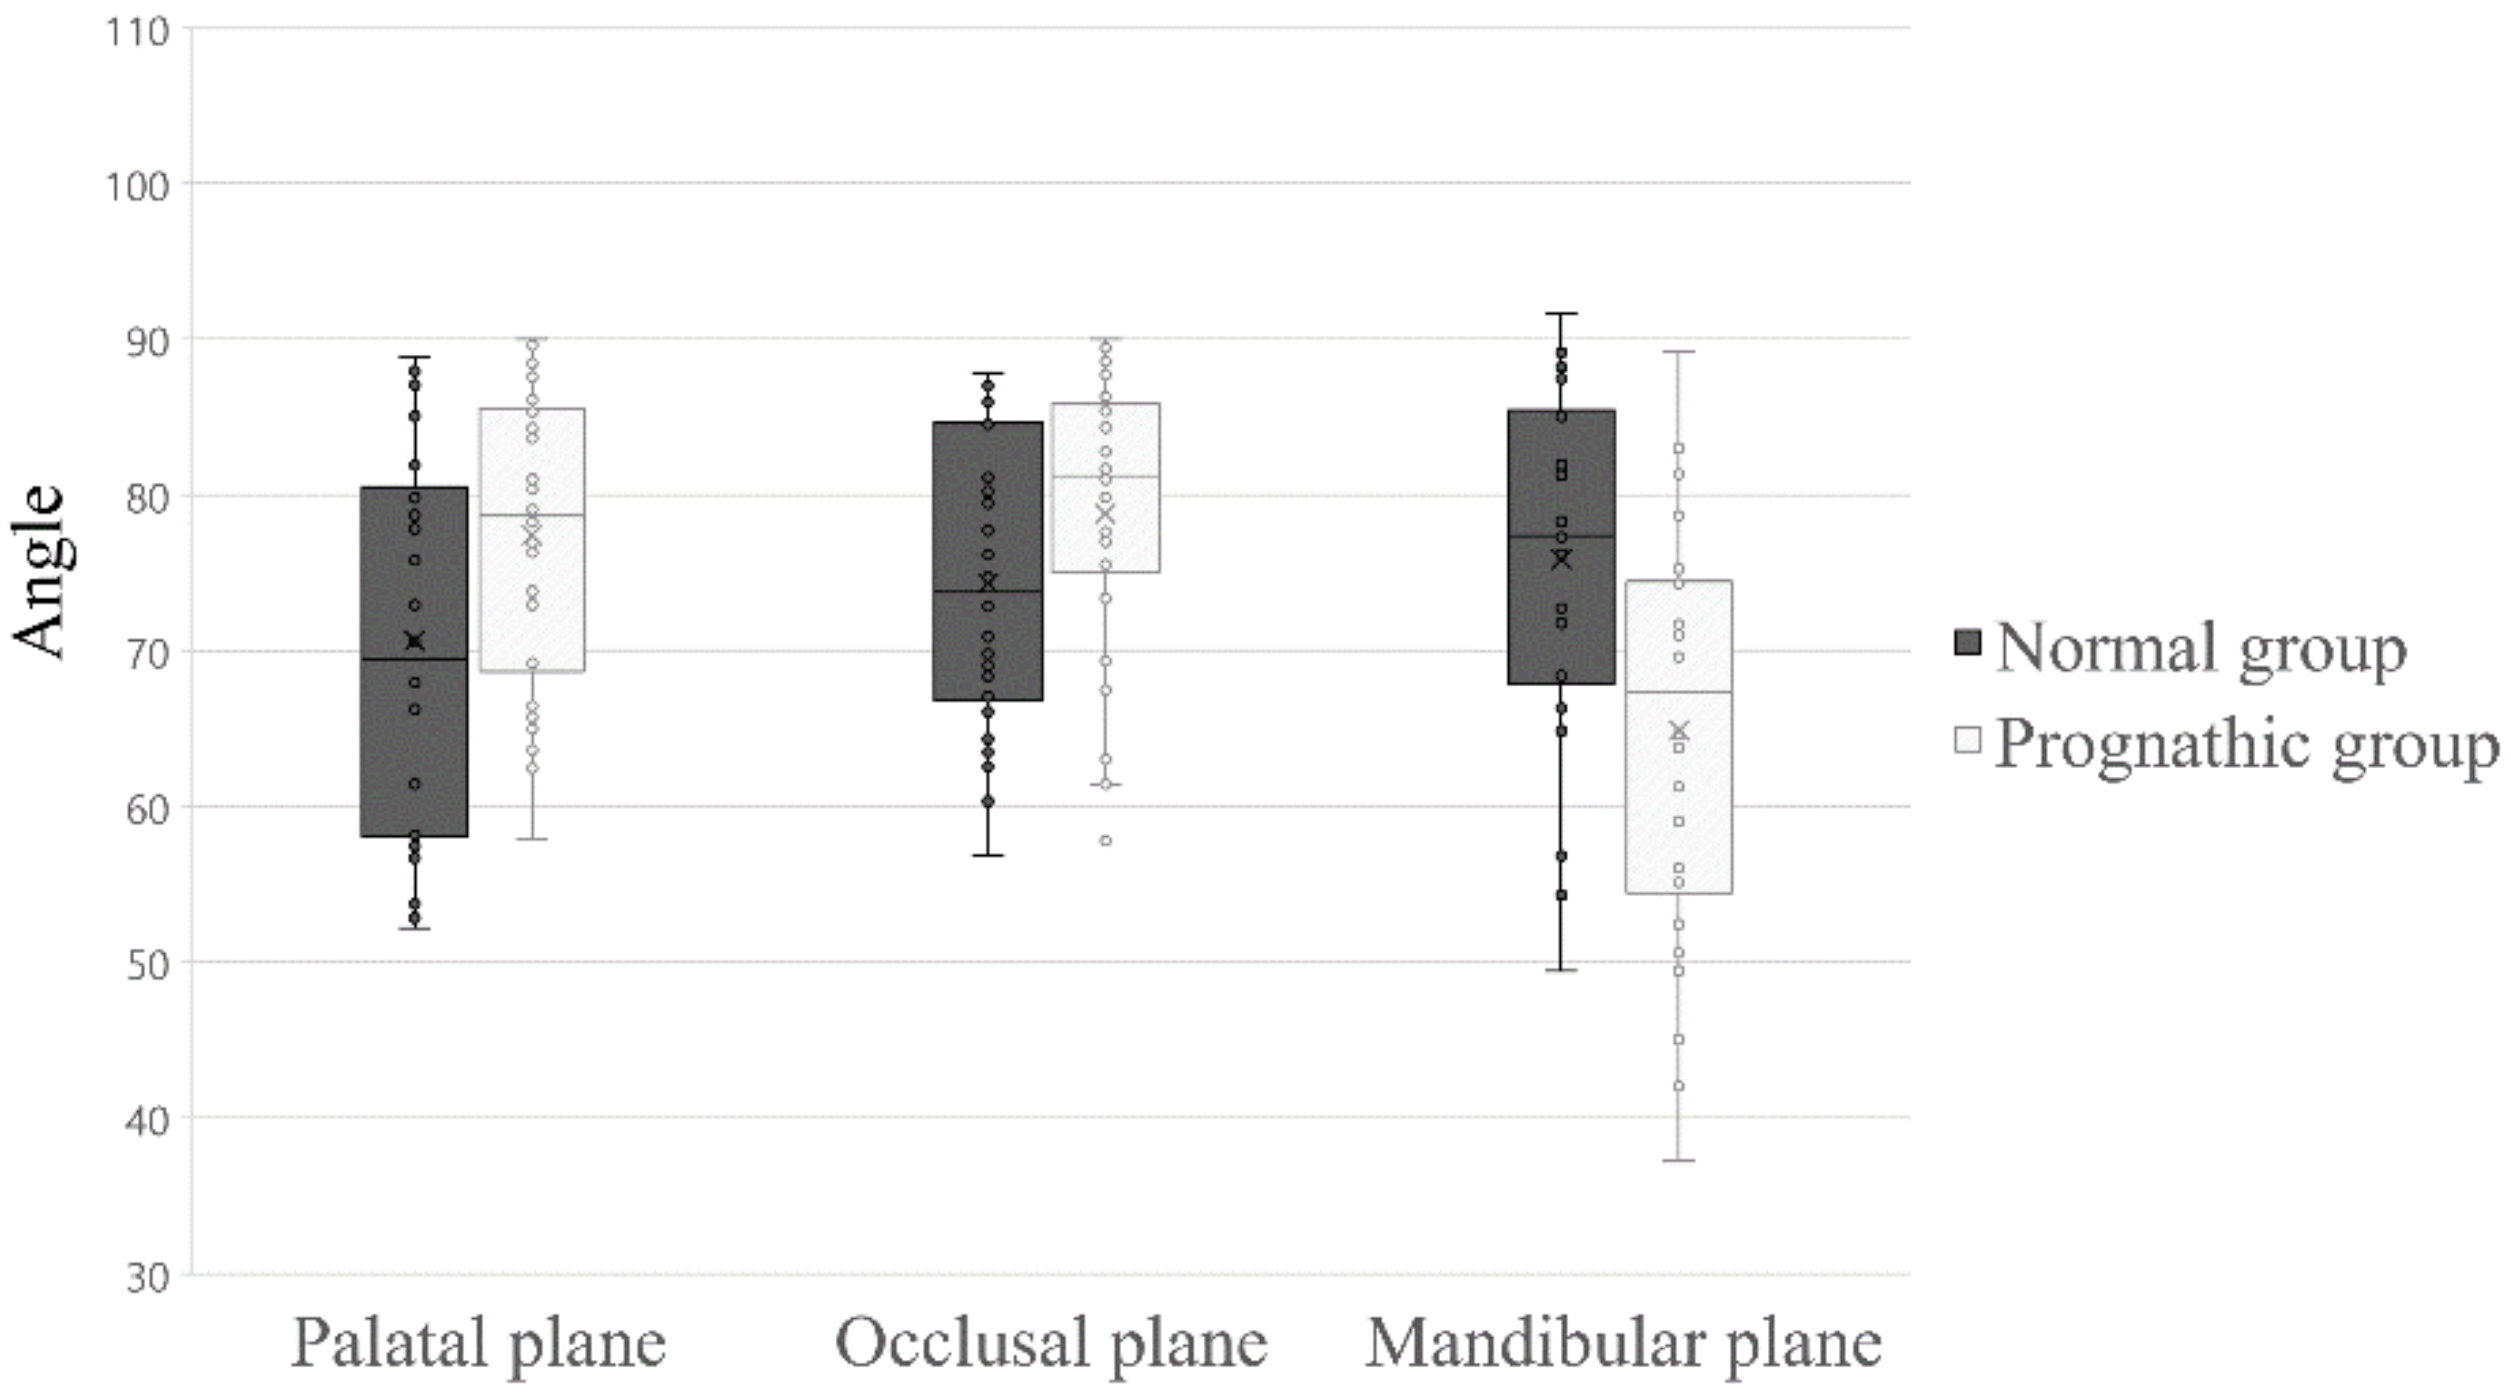
3.3. Comparison of the Angle of the Masseter Muscle Orientation to Three Reference Planes

There were significant differences in the orientation of the superficial masseter muscle and the three reference planes between the normal and prognathic groups (Figure 5, Table 2). The independent t-test revealed a significantly larger angle between the mandibular plane in the normal group (80.4° ± 10.2°) than in the prognathic group (68.0° ± 10.1°, p < 0.05). A greater angle was found between the palatal (78.7° ± 8.2°) and the occlusal planes (80.7° ± 7.0°) of the prognathic group than that of the palatal plane (68.6° ± 11.7°) and occlusal plane (74.2° ± 8.6°) in the normal group, with a significant difference (p < 0.05). The orientation of the deep masseter muscle to the palatal plane and mandibular plane showed significantly different data (Figure 6, Table 2). The independent t-test showed a significantly greater angle between the palatal plane (77.4° ± 9.3°) in the prognathic group than in the normal group (70.7° ± 12.0°, p < 0.05). Although the mean angle between the deep masseter muscle and the occlusal plane in the prognathic group was larger, there was no significant difference (p > 0.05). A significantly greater angle was found between the mandibular plane in the normal group (75.9° ± 11.0°) than those in the prognathic group (64.9° ± 13.1°, p < 0.05), which means that the normal-group participants had a more vertical angle to the mandibular plane.

4. Discussion

In our study, we used a three-dimensional computed tomography (3D CT) to analyze the relationship between the mandibular skeletal units and masseter muscle. Numerous studies in the past have described an association between craniofacial morphology and the surrounding muscles, but these studies were performed using electromyography or ultrasonography [25,26]. The development of 3D CT made it possible to measure the volume and orientation of the muscle and skeletal units.
Our previous study analyzed the differences in the mandibular skeletal unit volume/length ratio between a normal group and a prognathic group [15]. According to this study, the total mandible ratio and the condylar part and body part of the mandible ratio, which is the volume divided by length, were significantly smaller in the prognathic group, which implies that the condyle and body may be the key units underlying the etiology of mandibular prognathism. We aimed to evaluate the force of the masseter muscle that attaches to the body of the mandible.
Our study revealed significantly greater masseter muscle volume/length ratio in the participants of the normal group than in the prognathic group. As tension develops during muscle contraction, which correlates to muscle thickness, the muscle thickness of the masseter is significantly correlated to the bite force and occlusal tooth contact [25]. Therefore, the difference in masseter thickness may be attributed to the difference in muscle contraction force. This result corresponds to other studies that have elucidated that the masseter muscle is large in brachycephalic, short- faced, and narrow-mandibular-angled participants [27,28].
We studied the orientation of the masseter muscle and calculated the angles from the three reference planes. We chose these three planes because the palatal plane is related to the origin of the masseter muscle, the occlusal plane is where the maxillary and mandibular teeth meet, and the mandibular plane is related to the insertion of the masseter muscle. Among them, we focused on the mandibular plane because it is where the force actually acts and is the only plane that moves following the mandibular movement.
We found that the angles to the mandibular plane of both the superficial and deep masseter muscles of participants in the normal group were closer to the right angle than those of the prognathic group. This suggests that the participants in the normal group had a mechanical advantage over those in the prognathic group, since the masseter muscle is orientated vertically along the line of action of the mandible [11,29]. Additionally, studies revealed that the bite force and the occlusal contact area increases after surgical correction in prognathic participants, which supports our analysis [17,29,30].
We also thought about the possibility that the muscular difference is due to the secondary effect of mandibular difference. However, it is well-known that mandibular prognathism is affected by both heredity and environmental influences [31,32]. In addition, there are many studies or examples related to the action of soft tissue on hard tissue. Moss suggested the concept of a functional matrix, saying that all mandibular units are influenced by nearby soft tissue [5,6]. Muscular dystrophy, a neuromuscular disorder that results in a greater mandibular angle and excessive vertical growth of the mandible, is a good example of a muscle affecting craniofacial growth [33]. Another example is the decrease in mandibular bone quality after botulinum injection [34]. In addition, a study on the Foxc1 gene, which causes bony fusion of the maxilla and mandible and defects in the craniofacial musculature when missed, shows the relationship between bones and muscles during development [35]. Even though it is uncertain whether prognathism affects nearby muscles, it is certain that differences in the action of nearby muscles affect mandibular growth.
There are many studies on whether the vertical dimension affects the mandibular morphology and masticatory muscles. Kim et al. showed a positive correlation between the thickness of masticatory muscle and vertical dimension of the mandible [36]. Choi et al. suggested that the patients with higher mandibular plane angle showed an increase in the thickness of the soft tissue pogonion after bimaxillary surgery [37]. However, Lee et al. showed that the vertical facial types do not cause any differences in relapse after mandibular setback surgery [38]. Vertical dimension is one of the important topics in this field. However, in our study, we focused on the difference in masseter muscle between normal and prognathic group, following our previous study [15]. Further studies considering vertical dimension are needed.
This study is one of the first to analyze the differences in masseter muscle force between participants of normal and prognathic groups. Although the exact etiology of mandibular prognathism remains to be elaborated, it is certain that thin masseter muscles with inefficient orientation are closely related to mandibular prognathism. As remodeling of the mandible occurs throughout life, understanding masticatory muscles in relation to prognathism will be useful in regulating mandibular growth in young patients, surgical or non-surgical orthodontic treatment in adult patients, preventing relapse after orthognathic surgery, and even estimating the mandibular changes in the elderly. Further studies on lateral pterygoid muscle, which is another key muscle related to prognathism, are required.

5. Conclusions

In this retrospective study, the following conclusions were drawn:
(a)
The volume/length ratio of the masseter of the normal group was greater than that of the prognathic group.
(b)
The orientation of both the superficial and deep head of the masseter of the participants in the normal group was more vertical with respect to the mandibular plane than that of the prognathic group.

Author Contributions

The study was conceived by B.C.K., who also set up the experiment. J.H.Y. and D.S.S. conducted the experiments. J.-H.Y., H.J.L., J.L. and B.C.K. generated the data. All authors analyzed and interpreted the data. J.H.Y., D.S.S. and B.C.K. wrote the manuscript. All authors have read and agreed to the published version of the manuscript.

Funding

This work was supported by a grant from National Research Foundation of Korea (NRF) funded by the Korean government (MSIT) (No. 2020R1A2C1003792).

Institutional Review Board Statement

This study was conducted in accordance with the guidelines of the World Medical Association Helsinki Declaration for biomedical research involving human subjects and was approved by the Institutional Review Board of Daejeon Dental Hospital, Wonkwang University (W1906/001-001).

Informed Consent Statement

Patient consent was waived by the IRBs because of the retrospective nature of this investigation and the use of anonymized patient data.

Data Availability Statement

The datasets generated during and/or analyzed during the current study are available from the corresponding author on reasonable request, subject to the permission of the Institutional Review Boards of the participating institutions.

Conflicts of Interest

The authors declare no conflict of interest.

References

  1. Chang, H.P.; Tseng, Y.C.; Chang, H.F. Treatment of mandibular prognathism. J. Formos. Med Assoc. Taiwan Yi Zhi 2006, 105, 781–790. [Google Scholar] [CrossRef] [Green Version]
  2. Kim, D.; Choi, E.; Jeong, H.G.; Chang, J.; Youm, S. Expert system for mandibular condyle detection and osteoarthritis classification in panoramic imaging using r-cnn and cnn. Appl. Sci. 2020, 10, 7464. [Google Scholar] [CrossRef]
  3. Woon, S.C.; Thiruvenkatachari, B. Early orthodontic treatment for class iii malocclusion: A systematic review and meta-analysis. Am. J. Orthod. Dentofac. Orthop. 2017, 151, 28–52. [Google Scholar] [CrossRef] [PubMed]
  4. Ngan, P.; Moon, W. Evolution of class iii treatment in orthodontics. Am. J. Orthod. Dentofac. Orthop. 2015, 148, 22–36. [Google Scholar] [CrossRef] [PubMed] [Green Version]
  5. Moss, M.L. A theoretical analysis of the functional matrix. Acta Biotheoretica 1968, 18, 195–202. [Google Scholar] [CrossRef] [PubMed]
  6. Moss, M.L.; Simon, M.R. Growth of the human mandibular angular process: A functional cranial analysis. Am. J. Phys. Anthropol. 1968, 28, 127–138. [Google Scholar] [CrossRef]
  7. Ginszt, M.; Zieliński, G.; Berger, M.; Szkutnik, J.; Bakalczuk, M.; Majcher, P. Acute effect of the compression technique on the electromyographic activity of the masticatory muscles and mouth opening in subjects with active myofascial trigger points. Appl. Sci. 2020, 10, 7750. [Google Scholar] [CrossRef]
  8. Costa, Y.M.; Exposto, F.G.; Castrillon, E.E.; Conti, P.C.R.; Bonjardim, L.R.; Svensson, P. Local anaesthesia decreases nerve growth factor induced masseter hyperalgesia. Sci. Rep. 2020, 10, 15458. [Google Scholar] [CrossRef]
  9. Bin Heyat, M.B.; Akhtar, F.; Khan, A.; Noor, A.; Benjdira, B.; Qamar, Y.; Abbas, S.J.; Lai, D. A novel hybrid machine learning classification for the detection of bruxism patients using physiological signals. Appl. Sci. 2020, 10, 7410. [Google Scholar] [CrossRef]
  10. Sella-Tunis, T.; Pokhojaev, A.; Sarig, R.; O’Higgins, P.; May, H. Human mandibular shape is associated with masticatory muscle force. Sci. Rep. 2018, 8, 6042. [Google Scholar] [CrossRef] [PubMed] [Green Version]
  11. Marques, H.B.; Richter, F.F.; Heck, L.; Xavier, L.L.; de Campos, D. Biomechanical potential of the temporal muscle in brachyfacial and dolichofacial subjects: A study on dry mandibles. Orthod. Craniofac. Res. 2016, 19, 162–168. [Google Scholar] [CrossRef]
  12. Gionhaku, N.; Lowe, A. Relationship between jaw muscle volume and craniofacial form. J. Dent. Res. 1989, 68, 805–809. [Google Scholar] [CrossRef] [PubMed]
  13. Kiliaridis, S. Masticatory muscle influence on craniofacial growth. Acta Odontol. Scand. 1995, 53, 196–202. [Google Scholar] [CrossRef]
  14. Van Spronsen, P.H.; Koolstra, J.H.; van Ginkel, F.C.; Weijs, W.A.; Valk, J.; Prahl-Andersen, B. Relationships between the orientation and moment arms of the human jaw muscles and normal craniofacial morphology. Eur. J. Orthod. 1997, 19, 313–328. [Google Scholar] [CrossRef] [PubMed] [Green Version]
  15. Mun, S.H.; Park, M.; Lee, J.; Lim, H.J.; Kim, B.C. Volumetric characteristics of prognathic mandible revealed by skeletal unit analysis. Ann. Anat. Anatomischer Anzeiger 2019, 226, 3–9. [Google Scholar] [CrossRef] [PubMed]
  16. Widmer, C.G.; English, A.W.; Morris-Wiman, J. Developmental and functional considerations of masseter muscle partitioning. Arch. Oral Biol. 2007, 52, 305–308. [Google Scholar] [CrossRef] [Green Version]
  17. Ringqvist, M. Isometric bite force and its relation to dimensions of the facial skeleton. Acta Odontol. Scand. 1973, 31, 35–42. [Google Scholar] [CrossRef]
  18. Lee, S.H.; Kil, T.J.; Park, K.R.; Kim, B.C.; Kim, J.G.; Piao, Z.; Corre, P. Three-dimensional architectural and structural analysis—A transition in concept and design from delaire’s cephalometric analysis. Int. J. Oral Maxillofac. Surg. 2014, 43, 1154–1160. [Google Scholar] [CrossRef]
  19. Parker, W.S. Centric relation and centric occlusion—An orthodontic responsibility. Am. J. Orthod. 1978, 74, 481–500. [Google Scholar] [CrossRef]
  20. Kim, H.-J.; Kim, B.C.; Kim, J.-G.; Zhengguo, P.; Kang, S.H.; Lee, S.-H. Construction and validation of the midsagittal reference plane based on the skull base symmetry for three-dimensional cephalometric craniofacial analysis. J. Craniofacial Surg. 2014, 25, 338–342. [Google Scholar] [CrossRef]
  21. Kang, Y.; Kim, B.; Park, K.; Yon, J.; Kim, H.; Tak, H.; Piao, Z.; Kim, M.; Lee, S. Visual pathway-related horizontal reference plane for three-dimensional craniofacial analysis. Orthod. Craniofacial Res. 2012, 15, 245–254. [Google Scholar] [CrossRef]
  22. Nahoum, H.I. Vertical proportions and the palatal plane in anterior open-bite. Am. J. Orthod. 1971, 59, 273–282. [Google Scholar] [CrossRef]
  23. Del Santo, M., Jr. Influence of occlusal plane inclination on anb and wits assessments of anteroposterior jaw relationships. Am. J. Orthod. Dentofac. Orthop. 2006, 129, 641–648. [Google Scholar] [CrossRef]
  24. Nelson, C.; Harkness, M.; Herbison, P. Mandibular changes during functional appliance treatment. Am. J. Orthod. Dentofac. Orthop. 1993, 104, 153–161. [Google Scholar] [CrossRef]
  25. Bakke, M.; Tuxetv, A.; Vilmann, P.; Jensen, B.R.; Vilmann, A.; Toft, M. Ultrasound image of human masseter muscle related to bite force, electromyography, facial morphology, and occlusal factors. Eur. J. Oral Sci. 1992, 100, 164–171. [Google Scholar] [CrossRef] [PubMed]
  26. Kiliaridis, S.; Kälebo, P. Masseter muscle thickness measured by ultrasonography and its relation to facial morphology. J. Dent. Res. 1991, 70, 1262–1265. [Google Scholar] [CrossRef]
  27. Biondi, K.; Lorusso, P.; Fastuca, R.; Mangano, A.; Zecca, P.; Bosco, M.; Caprioglio, A.; Levrini, L. Evaluation of masseter muscle in different vertical skeletal patterns in growing patients. Eur. J. Paediatr. Dent. 2016, 17, 47–52. [Google Scholar]
  28. Kasai, K.; Richards, L.; Kanazawa, E.; Ozaki, T.; Iwasawa, T. Relationship between attachment of the superficial masseter muscle and craniofacial morphology in dentate and edentulous humans. J. Dent. Res. 1994, 73, 1142–1149. [Google Scholar] [CrossRef]
  29. Sondang, P.; Kumagai, H.; Tanaka, E.; Ozaki, H.; Nikawa, H.; Tanne, K.; Hamada, T. Correlation between maximum bite force and craniofacial morphology of young adults in indonesia. J. Oral Rehabil. 2003, 30, 1109–1117. [Google Scholar] [CrossRef] [Green Version]
  30. Iwase, M.; Ohashi, M.; Tachibana, H.; Toyoshima, T.; Nagumo, M. Bite force, occlusal contact area and masticatory efficiency before and after orthognathic surgical correction of mandibular prognathism. Int. J. Oral Maxillofac. Surg. 2006, 35, 1102–1107. [Google Scholar] [CrossRef]
  31. Kitai, N.; Fujii, Y.; Murakami, S.; Furukawa, S.; Kreiborg, S.; Takada, K. Human masticatory muscle volume and zygomatico-mandibular form in adults with mandibular prognathism. J. Dent. Res. 2002, 81, 752–756. [Google Scholar] [CrossRef]
  32. Park, J.C.; Lee, J.; Lim, H.J.; Kim, B.C. Rotation tendency of the posteriorly displaced proximal segment after vertical ramus osteotomy. J. Cranio-Maxillo-Facial Surg. 2018, 46, 2096–2102. [Google Scholar] [CrossRef] [PubMed]
  33. Katsaros, S.K.C. The effects of myotonic dystrophy and duchenne muscular dystrophy on the orofacial muscles and dentofacial morphology. Acta Odontol. Scand. 1998, 56, 369–374. [Google Scholar] [CrossRef]
  34. Hong, S.W.; Kang, J.H. Decreased mandibular cortical bone quality after botulinum toxin injections in masticatory muscles in female adults. Sci. Rep. 2020, 10, 3623. [Google Scholar] [CrossRef] [PubMed]
  35. Inman, K.E.; Purcell, P.; Kume, T.; Trainor, P.A. Interaction between foxc1 and fgf8 during mammalian jaw patterning and in the pathogenesis of syngnathia. PLoS Genet. 2013, 9, e1003949. [Google Scholar] [CrossRef] [Green Version]
  36. Kim, T.H.; Kim, C.H. Correlation between mandibular morphology and masticatory muscle thickness in normal occlusion and mandibular prognathism. J. Korean Assoc. Oral Maxillofac. Surg. 2020, 46, 313–320. [Google Scholar] [CrossRef] [PubMed]
  37. Choi, S.H.; Lee, H.; Hwang, J.J.; Jung, H.D.; Hwang, C.J.; Cha, J.Y. Differences in soft-tissue thickness changes after bimaxillary surgery between patients with vertically high angle and normal angle. Am. J. Orthod. Dentofac. Orthop. 2021, 159, 30–40. [Google Scholar] [CrossRef]
  38. Lee, Y.S.; Kim, Y.K.; Yun, P.Y.; Larson, B.E.; Lee, N.K. Comparison of the stability after mandibular setback with minimal orthodontics of class iii patients with different facial types. J. Oral Maxillofac. Surg. 2016, 74, e1461–e1464. [Google Scholar] [CrossRef]
Figure 1. Surface reconstruction of the skull and masseter muscle. The skull and superficial part of the masseter muscle were surface-reconstructed (a). The surface-reconstructed superficial part of the masseter muscle is not smooth and realistic due to a whole segmentation that was not performed (b). The surface model of the sphere is made (c) and wrapped (d) to the superficial part of the masseter. The superficial part of the masseter is accurately reproduced (e). (Maya, version 2018, www.autodesk.com accessed on 6 May 2021).
Applsci 11 04444 g001aApplsci 11 04444 g001b
Figure 2. Volume of the masseter muscle. Yellow represents the superficial part of the masseter muscle and blue represents the deep part. Masseter muscle volumes of the (a) normal group and (b) prognathic group. (Maya, version 2018, www.autodesk.com).
Applsci 11 04444 g002
Figure 3. The angle between the masseter muscle and reference planes measured in the sagittal view of computed tomography. Information on the masseter muscle is shown in Figure 1. The upper red line is the palatal plane (ANS-PNS). The middle red line is the occlusal plane (Half distance point between the incisal edges of the maxillary and mandibular incisors and the mesial cuspid tips of the mandibular bilateral permanent first molars). The lower red line represents the mandibular plane (Go-Me). The angles between the superficial and deep masseter muscle and the three reference planes were measured. Superficial and deep masseter muscles and three reference planes of the (a) normal group and (b) prognathic group (Maya, version 2018, www.autodesk.com).
Applsci 11 04444 g003
Figure 4. The distribution of masseter muscle volume/length ratios of the normal group and prognathic group. The normal group is dotted in white and the prognathic group is dotted in black. The blue dotted line indicates the trend line. Participants of the normal group are mostly distributed over the trend line, while those of the prognathic group are mostly distributed under the trend line.
Applsci 11 04444 g004
Figure 5. The distribution of the angle of superficial masseter muscle in three planes: palatal, occlusal, and mandibular. All three angles showed significant differences. The participants of the normal group had a greater vertical angle to the mandibular plane than those of the prognathic group.
Applsci 11 04444 g005
Figure 6. The distribution of the angle of deep masseter muscles to three planes: palatal, occlusal, and mandibular. Angles to palatal and mandibular planes showed significant differences. The participants of the normal group had a more vertical angle to the mandibular plane than those of the prognathic group.
Applsci 11 04444 g006
Table 1. Masseter muscle volume/length ratios of the normal and prognathic participants.
Normal Group
(n = 30)
Prognathic Group
(n = 30)
p Value
Ratio472.6 ± 105.6350.0 ± 90.00.000 *
Note: Values are presented as mean ± SD; Ratio = Volume (mm3)/Length (mm); Abbreviation: SD, standard deviation; p: p-value of paired t-test; * p < 0.05.
Table 2. Angle between the masseter muscle and the reference planes.
Normal Group
(n = 30)
Prognathic Group
(n = 30)
p Value
Masseter
(Superficial)
Palatal plane68.6 ± 11.778.7 ± 8.20.000 *
Occlusal plane74.2 ± 8.680.7 ± 7.00.002 *
Mandibular Plane80.4 ± 10.268.0 ± 10.10.000 *
Masseter
(Deep)
Palatal plane70.7 ± 12.077.4 ± 9.30.018 *
Occlusal plane74.3 ± 9.378.8 ± 9.10.066
Mandibular plane75.9 ± 11.064.9 ± 13.10.001 *
Note: Values are presented as mean ± SD; Abbreviation: SD, standard deviation; p: p-values of the paired t-test; *. p < 0.05.
Publisher’s Note: MDPI stays neutral with regard to jurisdictional claims in published maps and institutional affiliations.

