Article

Monitoring of Preload Variation of Linear Guide Positioning Stage Using Artificial Neural Network

1
Graduate Institute of Precision Manufacturing, National Chin-Yi University of Technology, Taichung 41130, Taiwan
2
Hiwin Technologies Corp., Taichung 41130, Taiwan
*
Author to whom correspondence should be addressed.
Appl. Sci. 2021, 11(17), 7902; https://doi.org/10.3390/app11177902
Submission received: 26 July 2021 / Revised: 13 August 2021 / Accepted: 23 August 2021 / Published: 27 August 2021
(This article belongs to the Section Mechanical Engineering)

Abstract

:
In this paper, we propose an artificial neural network (ANN) predictive model to identify the linear guide preload based on the measured vibration features of the feeding stage. In this study, the relationship between the contact stiffness and preload level of a linear guide was investigated by an experimental analysis. Furthermore, the stage was assembled with different linear guide preloads for the motion test to assess the vibrations. Vibration levels with changes in preload values and feeding rates were examined. The predictive models were established and verified based on a dataset collected from tests using an ANN approach. The ANN models were shown to have an excellent accuracy of 96.5% in the training datasets, which were collected from stages with sliding blocks rated at consistent preloads. The average percentage prediction error in the verification dataset was approximately 8.54–11.23%. This is probably because the stage with an unevenly distributed preload in the sliding blocks induces vibration with more fluctuation, which eventually affects the prediction accuracy. The results verify the feasibility of online preload identification for the condition monitoring of the feeding system.

1. Introduction

The linear guide is a sliding mechanism that uses re-circulating balls in the grooves between the rail and the sliding block. The ball groove was designed with a Gothic or circular surface forming a four-point contact geometry, which can sustain loads from all directions. In addition, owing to their low frictional characteristics and high precision in motion, linear guides are widely used in various feeding systems in automatic apparatus and machine tools. In practice, to enhance the loading capacity of the feeding stage, linear guides are appropriately preloaded by inserting the oversized balls in the ball groove.
The rolling interface between the steel ball and the rolling guide groove is the weak link between the linear positioning or feeding system. This interface shows a nonlinear characteristic of contact stiffness against the force and varies with the preload acting on the rolling balls [1]. Research studies [2,3,4] have shown that a rolling guide exhibits different vibration characteristics, depending on the preload applied on the rolling elements. The interface characteristic of mechanical components with rolling elements has been shown to be an important factor that affects the static and dynamic characteristics of the machine tool [5,6,7].
In addition, the rolling elements and raceways in the linear guides are prone to wear out during long-term operation. The wear amount was experimentally found to increase with an increase in the running distance, which further reduced the contact deformation and stiffness of the linear guides [8,9]. Further, the preload on the rolling element was evaluated as a decreasing trend from the measured friction during the run-in process [10]. Recently, Zhou et al. [11] illustrated the preload degradation behavior of the roller guide using an analytical approach and verified it experimentally. The results show that the preload loss rate is influenced by the external loading, running speed, and surface asperities. In addition, the wear of the linear guide was shown to affect certain vibration behaviors, such as resonant frequency and amplitude to different trends, depending on the wear progress with running distance [12]. Essentially, worn out contact surfaces will lessen the interference between the balls and the groove of the linear guide, and hence, reduce the preload from an initially higher amount to a lower amount. This causes the dynamic performance of the linear feeding system to deviate from the initial states [12,13,14]. Therefore, condition monitoring of the abnormality of a machine-based vibration analysis is an important task for preventing component failure or performance degradation of the feeding system.
Consequently, a data-driven methodology for prognostics and health management (PHM) has been widely employed in condition monitoring of the abnormality of a machine for maintaining the system performance during operation [15,16,17]. Vibration monitoring is an important tool for the fault diagnosis of a machine condition because it can be detected by accelerometers attached to the machine and directly compared with the values assessed under health conditions. Feature extraction from vibration signals is a prerequisite for the diagnosis of the failure or fault modes of rolling components. The main feature extraction methods include wavelet transformation, empirical mode decomposition (EMD), and Hilbert–Huang transformation (HHT) [18,19,20,21]. Basically, wavelet transformation is used to decompose the signal features in a high frequency region, which can help in differentiating the high frequency features from the defect-induced transient vibration of a rolling bearing. In the study by Peng et al. [19], wavelet transformation was used as a preprocessor of vibration signals to improve the performance of the Hilbert–Huang transform in detecting bearing defect-induced impact vibrations. Ensemble empirical mode decomposition (EEMD) was proven to have a better capability in decomposing the vibration signals of rotating machinery with defects and extracting features with better discriminability [18,20]. These resulting features are demonstrated as effective input vectors to the neural network to identify the fault situations of rotating machinery [18,20,21].
In addition, artificial intelligence algorithms, such as genetic algorithms, fuzzy theorems, and artificial neural networks (ANNs) are employed to develop a predictive model for the fault detection of rotary mechanisms with bearing components [22,23,24,25]. Samanta et al. [23] identified the fault conditions of rolling bearings based on the vibration features by using artificial neural networks with different architectures. It is shown that the multilayer perception (MLP) integrated with the genetic algorithm (GA) has a superior fault detection performance. Essentially, for defective bearings with localized damage in the inner or outer raceway and rolling elements, the featured frequency can be characterized from the measured vibration signals based on the bearing specifications and operating speed [26]. However, ambiguous features of abnormal vibration could be induced from rolling elements with multi-faults. To enhance prediction performance, Wang et al. [24] proposed an intelligent diagnosis method constructed on the basis of possibility theory and a fuzzy neural network. This method was demonstrated with high accuracy to distinguish fault types sequentially based on symptom parameters. Zarie et al. [25] presented a fault detection and classification algorithm. Vibration signals were first filtered by an intelligent filter to remove the non-bearing fault components before being fed into a classifier. The results showed that the new algorithm using a non-bearing fault component (RNFC) filter not only yields higher accuracy in fault classification as compared to an adaptive nero-fuzzy inference system (ANFIS), but also improves the reliability in the case of a low-quality measured signal. These studies clearly indicate that the accuracy of a fault diagnosis greatly depends on feature extraction and classification methods.
Similar to rolling bearings, linear guides are also susceptible to fault states or surface wear under long-term loading durations. A fault diagnosis can be conducted based on condition monitoring technology through a vibration signal analysis [27,28,29,30,31,32]. As demonstrated in a previous study [27], the vibration characteristics of the feeding stage can be significantly related to the linear guide preload. Based on this significance, the fault diagnosis of a linear guide can be effectively conducted by monitoring the variation in the featured vibration frequencies and acoustic characteristics of the stage in motion. Jin et al. [28] reported a study on the fault diagnosis of a ball screw system. In addition to health conditions, failure modes such as lubrication starvation, preload loss, ball nut wear, and re-circulation system failure were recognized based on the time and frequency domain features; these features were extracted from vibration signals on the ball screw, according to the multi-failure classification algorithms for each failure pattern. Bianchini et al. [29] proposed a diagnostic method based on the FFT vibration spectrum to identify linear motor bearing faults. The characteristic frequency and amplitude are the indicators of the fault modes, such as damage to rolling elements, carriage race, or plugging of the recirculation channel. Chommuangpuck et al. [30,31] developed an ANN classification model to analyze the cause of linear bearing faults in operational conditions, in which three different fault conditions, namely healthy bearing and ball bearing damage with and without starved lubricant, can be clearly identified based on the featured frequency by FFT spectrum data measured from tests. In a study by Feng et al. [32], the energy distribution was extracted as a feature from decomposed vibration signals with the application of wavelet package decomposition. The extracted feature was verified as a good classifier in an ANN to identify the lubrication conditions of the rolling guide, with an accuracy of 95%.
In conclusion, fault conditions with specific defects of the mechanism with rolling elements can be effectively classified by a classification model based on the vibration features associated with the failure pattern of components. However, it is noted that the selection of the vibration feature and its dependence on the failure pattern of components are the prerequisites to be examined for successfully establishing the diagnosis model [23,25]. For rolling bearing, featured frequencies are closely related to the defect type or damage patterns of components, but they cannot accurately reflect the severity of the defects. In addition, vibration features assessed by a time domain analysis are sensitive to change with fault development in size and location, which affect not only the feature selection but also the classification performance in the subsequent fault diagnosis [33,34]. Machine learning algorithms such as ANN and the support vector machine (SVM) are considered the appropriate tools for establishing the classification model [35]. The learning-based approaches can be incorporated with intelligent feature filter to find the optimum features for feeding into a fault classification model [26,33,36]. For example, Sharma et al. [33] compared the classification performance of the fault severity of a specific defect using two supervised machine learning techniques, SVM and ANN. The effective features were evaluated by three different attribute filters, which identified the dependence of features with the fault type. Zhang et al. [36] proposed a novel hybrid model for detection and classification of the fault type and severity of rolling bearing. In their study, support vector machines were optimized by inter-cluster distance in the feature space and employed to generate the fault feature vectors to identify the fault type.
It is apparent that classification models based on a machine learning approach are widely adopted in the fault diagnosis of rotary mechanisms with ball bearings. For linear bearing mechanisms, the rolling components are susceptible to multi-fault situations, as a consequence inducing complicated vibration behaviors because of the inherent nonlinear characteristics that interact with the internal preload, lubrication conditions, and external loading conditions [31,32,37]. However, previous studies were focused on the development of a classification model for fault identification of linear bearing. Instead, quantifications of the faults such as defect severity or surface wear are less concerned and investigated. In this study, considering the influence of linear guide preload on the dynamic characteristics of the linear positioning system, quantifications of preload variation and degradation of mechanical characteristics are crucial for maintaining system performance. For this purpose, a machine learning based neural network was regarded as an appropriate approach for developing a monitoring system to quantify the degradation behavior of linear bearings. In the study, the relationship between the contact stiffness and preload level of the linear guide was first investigated through an experimental analysis. Furthermore, the stage with different linear guide preloads was assembled for the motion test to assess the vibration in motion. Vibration features with a change of preload state and feeding rate were examined to ensure the dependence among these variables. The predictive models were established and verified based on a dataset collected from tests using a neural network approach. Finally, some scenarios were presented to demonstrate the application of the proposed model.

2. Preload and Rigidity of Linear Guide

2.1. Preload Amount

Applications of linear guides in the positioning mechanisms often require a proper preload to increase the rigidity of the load-carrying capacity and to eliminate internal clearance between assembled components. The preload is commonly generated by the interference between balls and raceways, which is achieved by loading oversized balls in ball grooves. To prevent any damage to the linear guides, the preload is also limited to values of a percent of the dynamic load capacity, depending on the design and manufacturing in the factory. To facilitate the selection of a linear guide, manufacturers usually define the preload at different levels by fine-tuning the ball diameter, such as light preload (Z0 = 0.0–0.02 C), medium preload (Z1 = 0.05–0.07 C), and heavy preload (Z2 = 0.10–0.12 C), where C is the dynamic rated load of the slide rail [38].
In this study, the linear guide was designed with four rows of rolling balls in a back-to-back contact configuration (DB configuration), as shown in Figure 1. Details of the specifications are presented in Table 1. Three different preload amounts were generated by inserting the oversized rolling balls into the ball grooves, which induced interface interference in the range of 0–2 µm for light preloads (Z0), 4–7 µm for medium preloads (Z1), and 8–10 µm for heavy preloads (Z2).

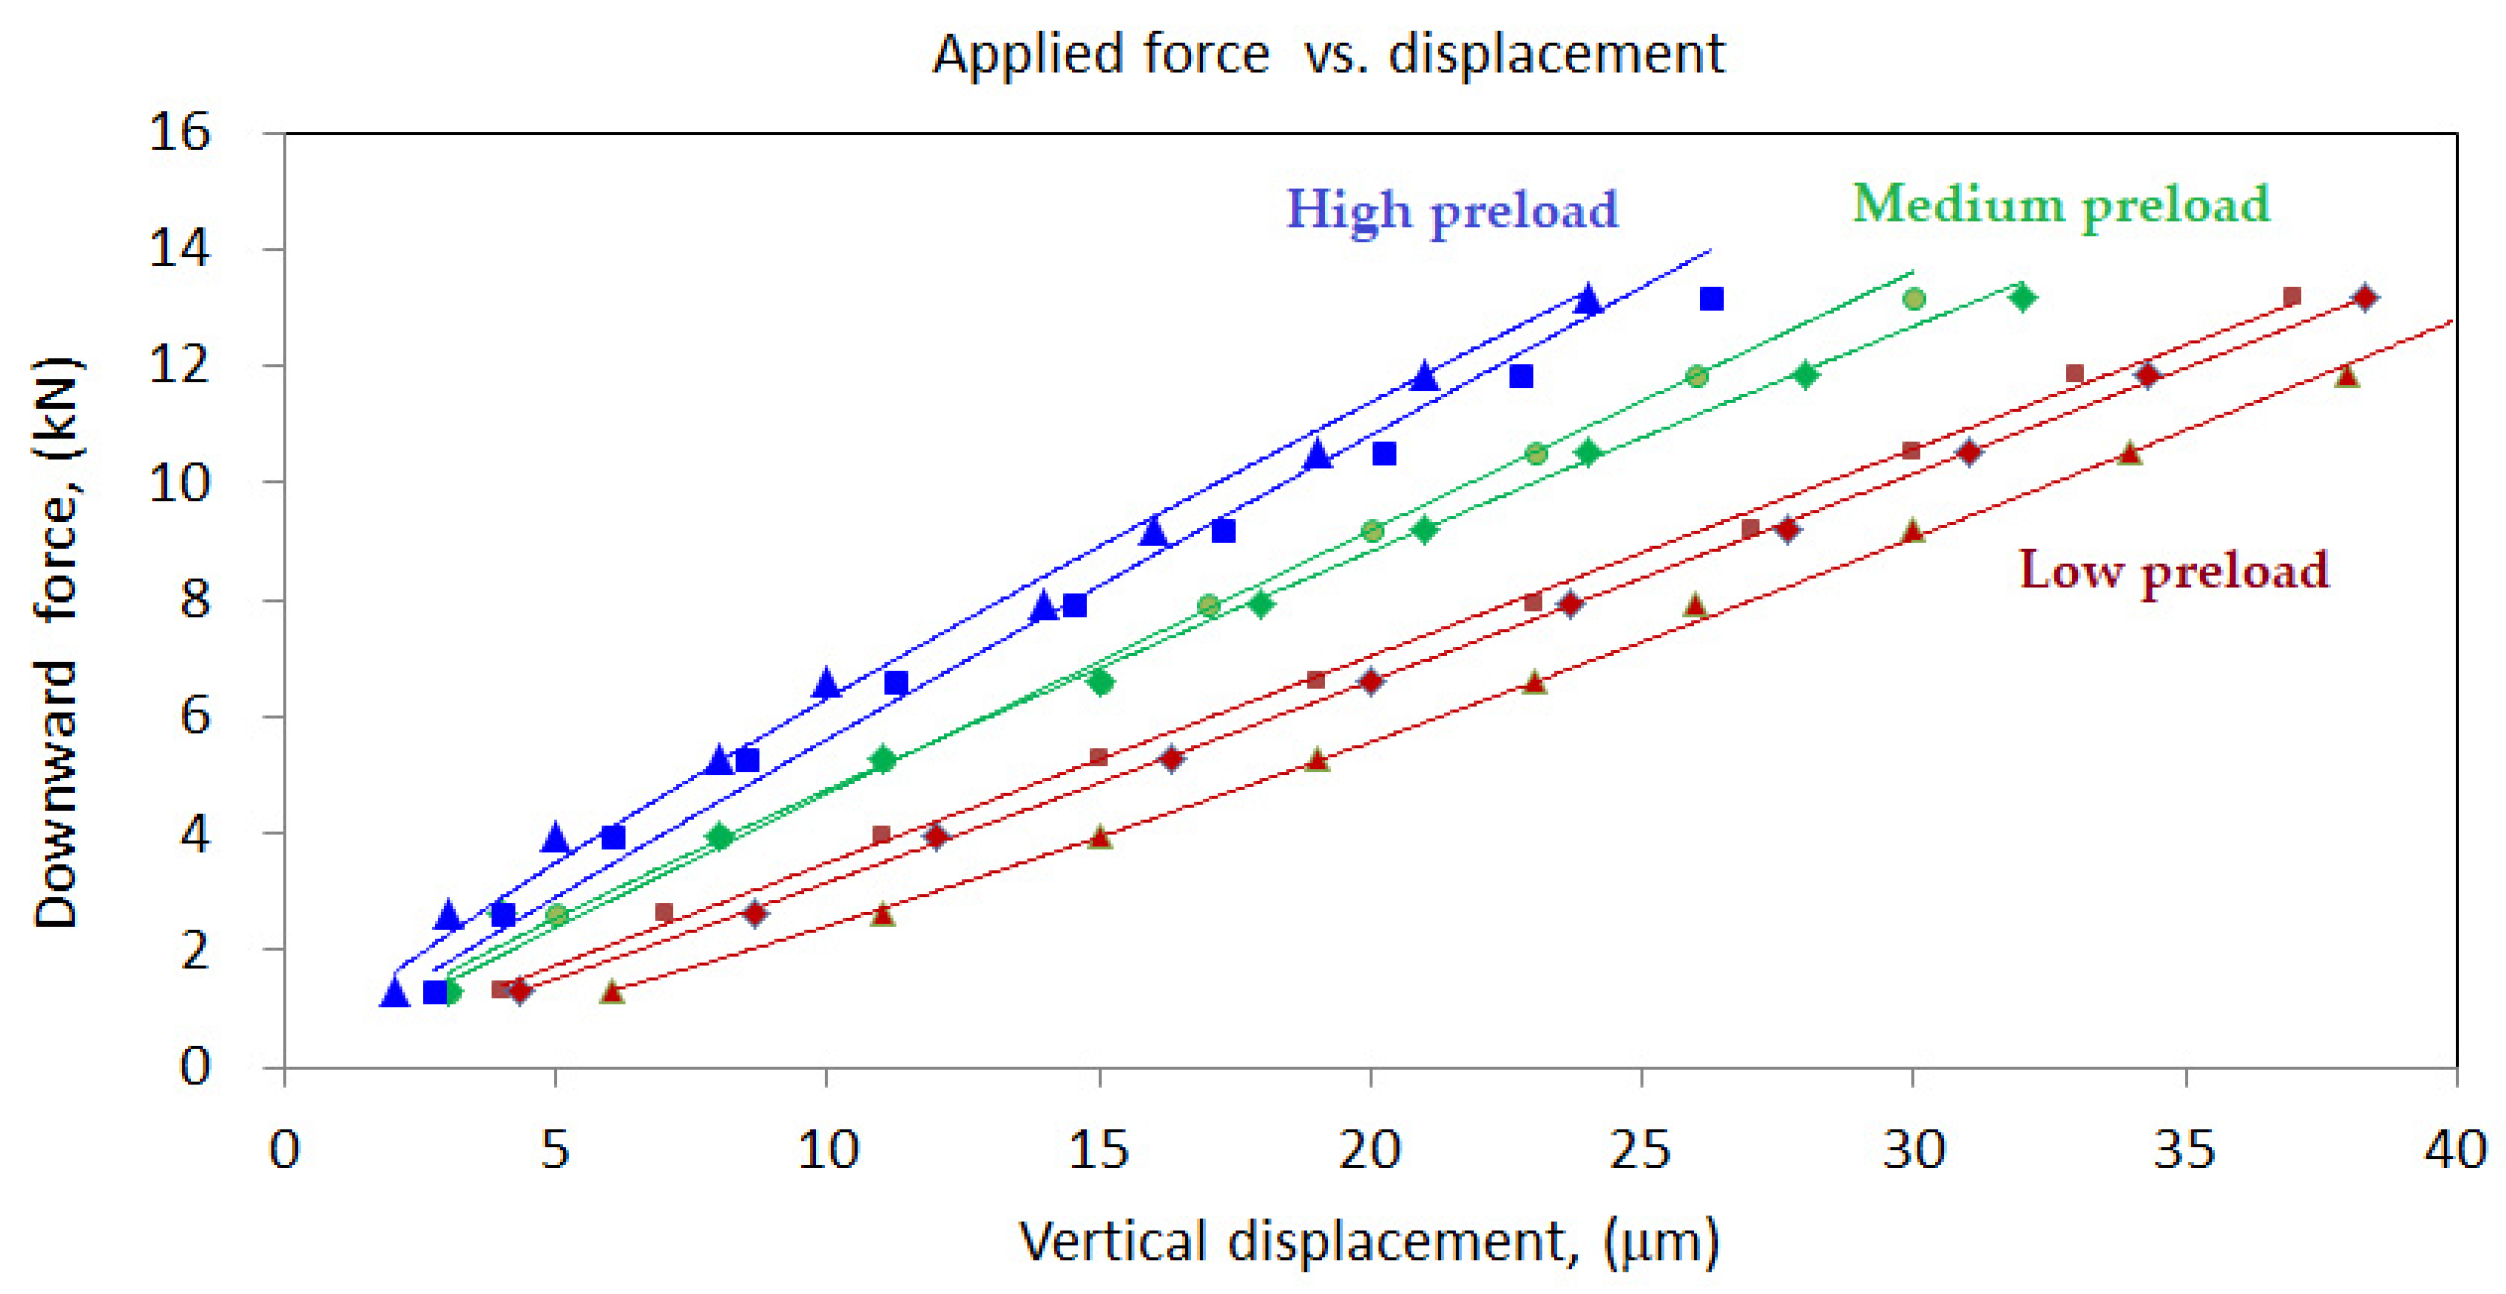
2.2. Static Radial Compressive Tests

To assess the rigidity of the linear guides, we established a test platform for conducting the compressive experiments, as shown in Figure 2. The platform was constructed with structural steel, on which the linear rail was bolted, in accordance with the technical guidelines, to ensure mounting accuracy and parallel precision. In the experiment, a static load was gradually applied to the sliding block using a hydraulic jack with a 1.318 kN loading interval. The magnitude of the force was recorded by a load cell (LPU-5000, Transducer Technique). The vertical deflections of the block were measured using two dial gauges with a resolution of 1 µm. The output information, including the load-displacement behavior of linear guides with different preloads, was obtained for comparison. The linear guides used for the compression tests were assembled with rolling balls of different diameters. These samples were categorized into three groups: light, medium, and high preloads.

2.3. Rigidity of Linear Guide

Figure 3 illustrates the relationship between the applied load and vertical deflection of the linear guides. As observed in the figure, the high-preloaded linear guides showed less deflection than those with a lower preload under the same force. In addition, even though the linear guides are rated at the same preload levels, for example, low preload (Z0), the three samples showed little differences in the load–deflection curve. This difference can be ascribed to the fact that the interference between rolling balls and grooves is mainly determined by the oversized rolling balls, which normally have a tolerance in diameters in the range of 0–2 µm. In addition, the interference can be partly affected by internal clearance, the geometric tolerance of components, and assemblage precision. The rigidity or stiffness against vertical loading can be obtained from the load–deflection relationship. For example, for a high-preloaded linear guide, the force Fv can be related to the deflection δv, and can be expressed as a power-low function by a curve fitting technique:
F v = 0.515515 × δ v 0.98465
The rigidity or stiffness Kv can be obtained by taking a derivative of Equation (1) with respect to the deflection δv,
K v = d F v d δ v = 0.50768 × δ v 0.01535
K v = 0.50238 × F v 0.01559
The above equations show that the stiffness of the linear guide is dependent on the force acting on the linear guide, with nonlinear characteristics. At the initial preload state, the rigidity of the linear guide can be calculated according to the experimentally measured stiffness formula, as listed in Table 2. It was found that the rigidity of the linear guide changes with the preload induced in the rolling balls. It can be expected that a slight variation in the interference may affect the rigidity of the linear guide deviating from the initial setting during operation.

3. Dynamic Characteristics of Positioning Stage

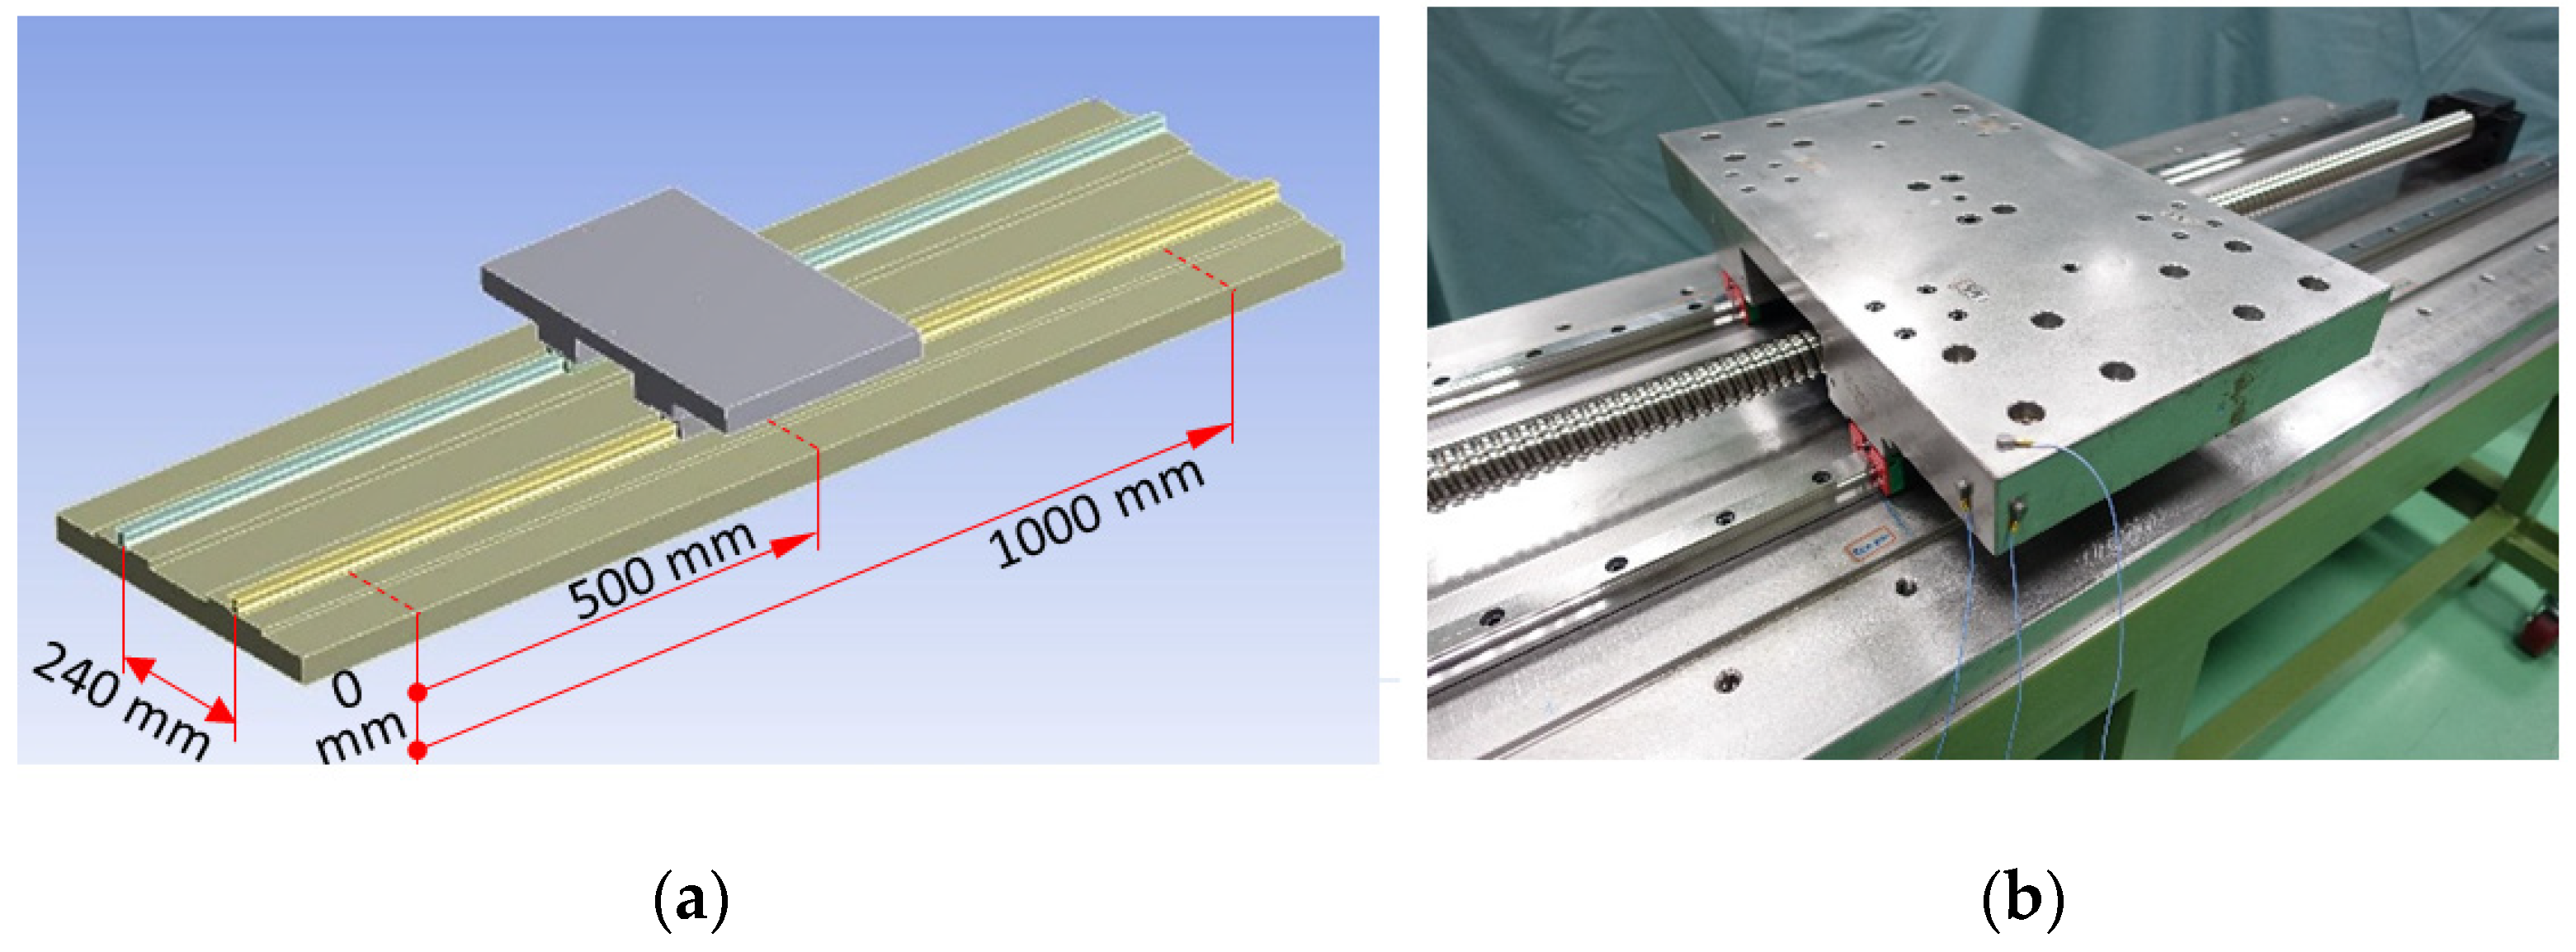
3.1. Structure Rigidity of the Stage

A single-axis positioning stage was constructed to investigate the effect of the linear guide preload on the dynamic characteristics of the stage. As shown in Figure 4, the main components consisted of one pair of linear guides, a single ball screw, bearing supports, a stage or platform, and a test bed. The stage and tested base were made of carbon steel S45-C. The structural rigidity of the stage in the vertical loading direction was determined by the preloading of the sliding blocks on the rails. The rigidity of the stage was 1176, 1696, and 2020 N/μm, when mounted on sliding blocks with a light preload (Z0), medium preload (Z1), and high preload (Z2), respectively.

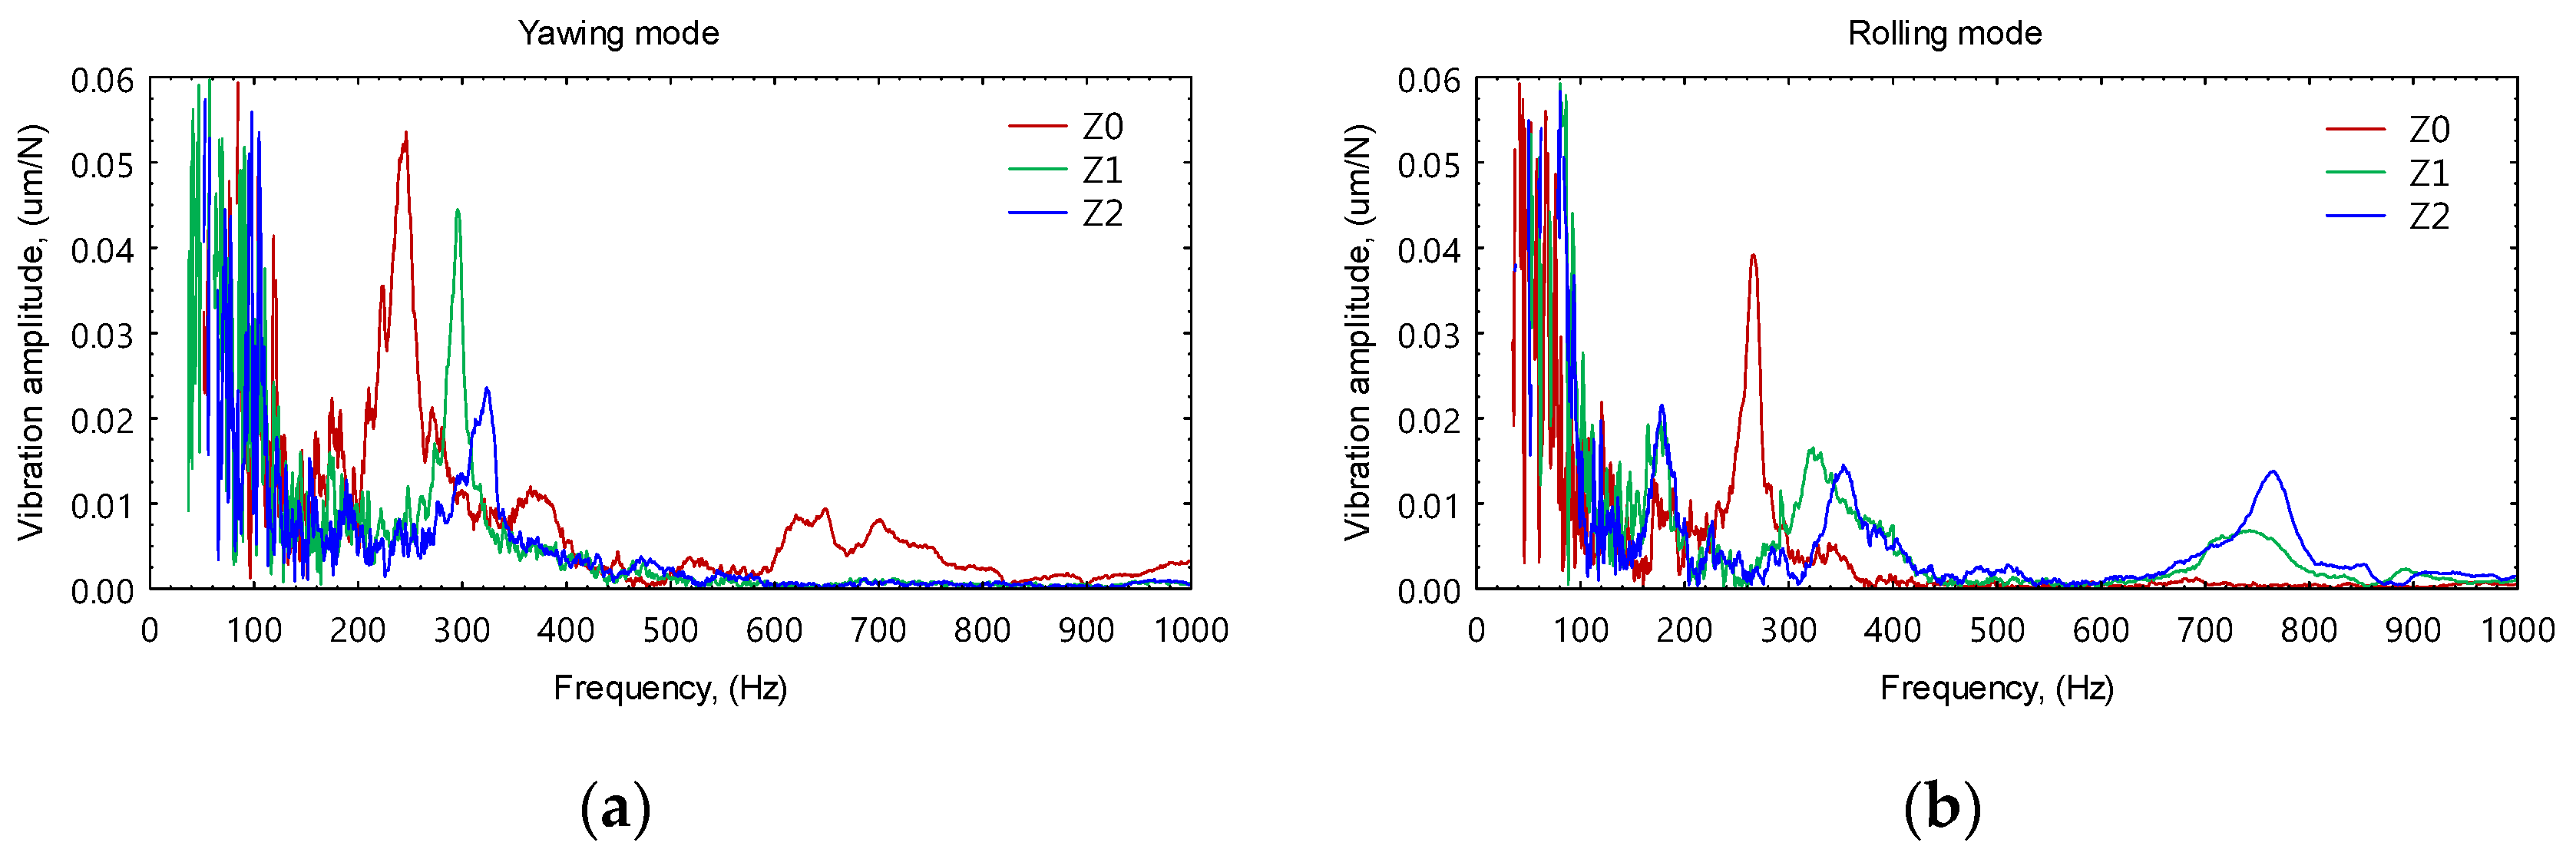
3.2. Fundamental Vibration Modes of Stage

Theoretically, stage rigidity is closely related to the stiffness of the linear guide, which has an important influence on the dynamic behavior of the structure. The dynamic characteristics of the stage were assessed by conducting a vibration test, as shown in Figure 5. In the tests, the stage was excited using an impact hammer applied at a properly selected position. The vibration signals in the time domain were assessed using accelerometers and converted into frequency response functions by a fast Fourier transformation (FFT analyzer). The modal parameters, such as vibration frequency, dynamic compliance, and rigidity of the positioning stage structure were also obtained.
Moreover, the vibration characteristics of the stage could be predicted using the finite element analysis approach. As shown in Figure 6, a finite element model of the stage was created and used to determine the vibration frequency associated with the vibration mode. Details of the creation and modeling of the feeding components, such as ball screws and linear guides, are available in [5,6]. In the modeling of the linear guide, the four ball grooves or raceways were simplified into rolling interfaces, with neglect of the balls. The contact stiffness at each rolling interface can be determined by the contact geometry and preload of the linear guides, based on the Hertz contact theory [39,40]. For the linear guides used in this study, the contact stiffness was calculated as 194, 280, and 332 N/um, when they were preloaded at small, medium, and high amounts, respectively.
According to the modal analysis, the fundamental vibration modes of the stage are illustrated in Figure 7, including the yawing, rolling, and pitching motions. These vibration modes were directly determined by the vibration of the sliding blocks on the rails. The mode shapes also indicate the points for mounting the accelerometer and the excitation point in the vibration tests. For example, when measuring the rolling mode, accelerometers were attached at the middle and side positions of the stage, and the other side was impacted by a hammer in the vertical direction to trigger stage vibration in the rolling mode.

3.3. Variation of Modal Frequency with Preload

Figure 8 shows the frequency responses of the stage assessed at different positions, which are associated with the vibration motion of pitching, rolling, and yawing modes, respectively. It was found from the frequency responses that the stage with different preloads exhibited different vibration frequencies and amplitudes. For stages with low, medium, and high rigidity, the vibration frequencies of the yawing mode were measured as 246, 295, and 323 Hz, respectively. A similar phenomenon was also observed in rolling and pitching motions.
Table 3 compares the vibration frequencies of the positioning stage obtained by the vibration test and finite element modeling. This shows that the positioning stage with high preload linear guides had a higher modal frequency. The frequencies of the three vibration modes increased by approximately 20% and 31%, respectively, when the linear guide preload was adjusted from lower to medium and higher amounts, respectively, equivalent to an increase in the stage rigidity by 44% and 72%. In addition, according to the measured frequency responses, the stage with lower preload exhibited higher modal amplitude compared with the higher preloaded stage. Moreover, the modal amplitude could be affected to different extents according to the linear guide preload.
The finite element modeling predictions agreed well with the measured values, with a maximum difference of 6.5%. The influences of the linear guide preload on the vibration characteristics of the stage were also observed from the finite element prediction. The variations in the predicted frequencies ranged from 16% to 35% when the preload of the stage was changed from low preload to medium and high preloads. This indicates that the modeling of the linear guide plays an important role in describing the mechanical characteristics of a physical feeding stage, particularly the contact stiffness of the rolling elements, which is a vital factor in determining the rigidity of the linear guide and the stage.
As demonstrated in the radial compressive tests, the linear guide preload is caused by the interference between the rolling elements and raceways. A high preload is induced in the sliding blocks with a larger interference at the rolling interface. The interference decreases once the rolling elements or the raceways wear out during long-term service, which will decrease the preload of the sliding block, and hence reduce the rigidity of the stage as well as its natural vibration frequency. Observing the frequency response function of the stage clearly demonstrates the tendency that the preload not only affects the vibration frequency but also the modal amplitude.

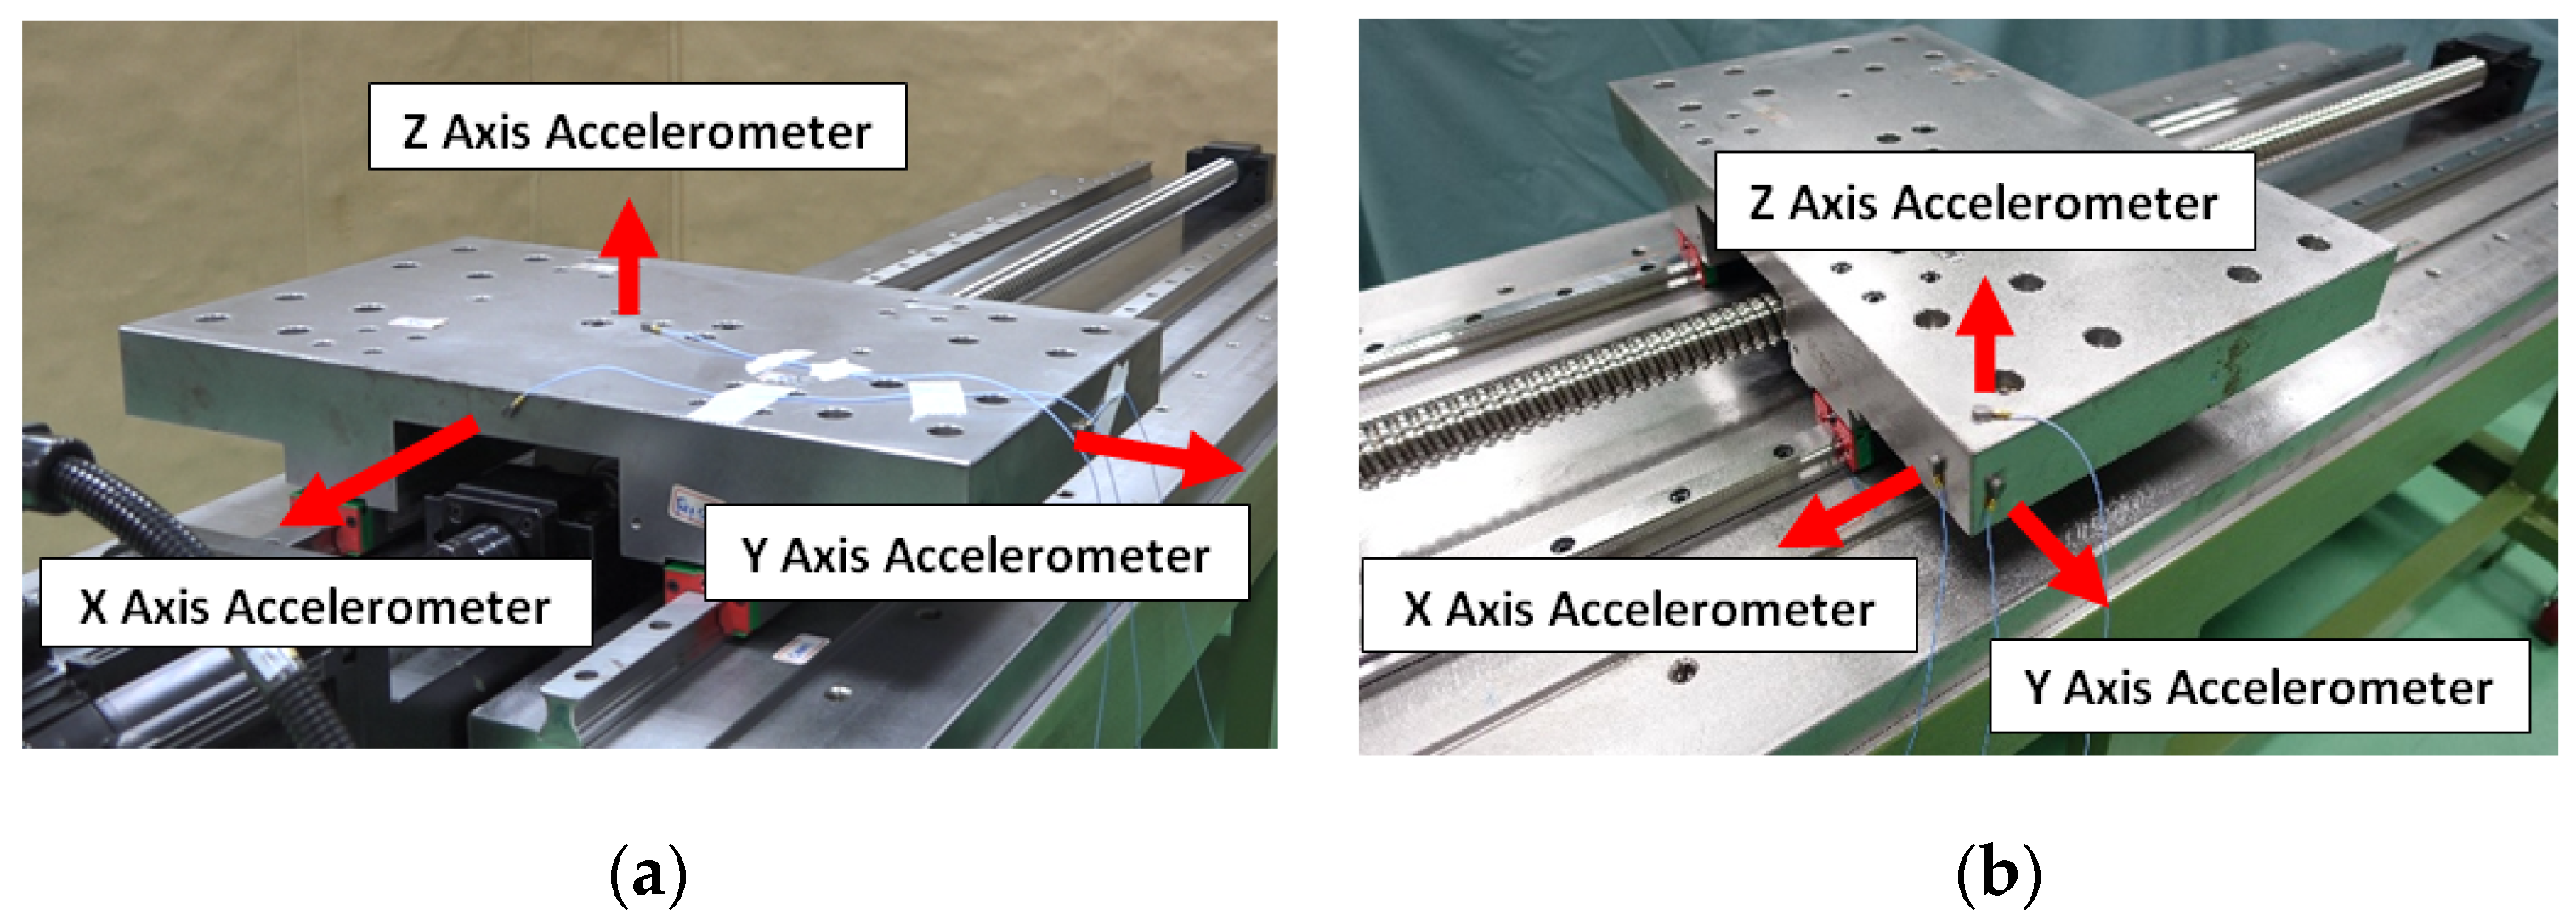
3.4. Vibration of Stage in Motion

In this experiment, the vibration level generated by the stage during the movement was measured within a stroke length of 1000 mm. The variables controlled in the experiments were the preload state of the linear guide and the feed rate, thereby allowing the evaluation of the change in the vibration response on the positioning stage during the movement when the preload changed or an abnormality occurred in motion. To mimic the change in the structural rigidity of the stage, the four slide blocks on the linear rails were preloaded at different amounts, as shown in Table 4. In the first three cases, stages were assembled with the linear guide modules with different preloaded sliding blocks, which were rated in the factory at high, medium, and low preload amounts, respectively. The other two cases were mixed with a combination of high- and low-preloaded guides. The stage rigidity was rated in order from high to low: cases I, IV, II, V, and II.
In the experiments, the stage was driven to move along the rails at different feed rates, from 2000, 4000, 6000, and 8000 mm/min. In addition, the vibrations of the stage in the X, Y, and Z directions were simultaneously measured by three single-axis accelerometers, which were attached at the mid-points of the two edges and the center of the stage, as shown in Figure 9a. In addition, the vibration responses were also measured by three accelerometers attached at the corner in three axial directions (Figure 9b).

3.5. Relationship between Stage Rigidity and Vibration Level

Figure 10 illustrates the typical vibration signals measured at the center of the stage during the traveling movement from 0 to 1000 mm. To illustrate the difference in the vibration levels measured at different placement of sensors, we first conducted several tests on the stage assembled with specific preload conditions. For each case, the stage was driven along a stroke of 1000 mm at different feed rates of 2000, 4000, 6000, and 8000 mm/min. Each test was repeated thrice. The root mean square (RMS) values of the vibration signals in three directions (X, Y, and Z axes) were calculated to compare the vibration levels measured under different conditions.
Figure 11 shows the vibration RMS values of stages with different rigidities under different motion speeds, in which the vibrations were obtained from sensors at different placements, (a) and (b), as illustrated in Figure 9. As shown in Figure 11a,b, for each stage preload condition, the vibration induced in motion increased with an increase in the feed rate. A higher feed rate generated higher vibrations. The influence of stage rigidity on vibration was further examined. Unfortunately, this tendency is not observed in Figure 11a, where the vibration sensors were mounted on the center point of the edge and top surface of the stage. This implies that the sensor placements did not capture the main vibration modes generated from the movement of the positioning stage. However, in another case in Figure 11b, the vibrations of the stage were clearly affected by the preload state of the stage. There was a negative relationship between the stage rigidity and vibration level, with a correlation coefficient R of around 0.74–0.79. A stage equipped with high-preloaded linear guides induced lesser vibration than the lower preloaded stage. Comparisons of the results in Figure 11a,b show that the sensor placement will affect the measurement of the vibration of the stage as well as the significance between the stage rigidity or linear guide preload and vibration. Therefore, this experiment implies that the sensor placement on the corner of the stage is more favorable for assessing the vibration of the stage in subsequent investigations.
According to the study [41], vibrations associated with the angular motion of the stage can be described in terms of the angular displacement of the stage with respect to the linear axes, X, Y, and Z axes, as shown in Figure 12a, in which the angular motion (ϕ) about the X axis is rolling vibration, the angular motion (θ) about the Y axis is pitching vibration, and the angular motion (ψ) about the Z axis is the yawing vibration. Considering the contribution of the natural modes to the vibration of the feeding stage in motion, the angular vibrations were introduced in a subsequent analysis. In practice, it is difficult to measure angular vibration directly. Therefore, a simplified estimation based on trigonometry was employed to calculate the vibration of angular motion [42]. As shown in Figure 12b, rolling, pitching, and yawing vibrations due to the instant variation of the angular displacements with time were approximately obtained from the linear acceleration Ax, Ay, and Az in the X, Y, and Z axes, respectively, which were measured by accelerometers on the stage.

3.6. Stage Vibration against Linear Guide Preload and Feed Rate

As demonstrated in the previous section, the vibration behavior of the stage in motion can be appropriately related to the structural rigidity, which is determined by the preload state of the linear guides. This also implies that the preload state of the linear guide can be examined by observing the variation in the vibration of the stage. Based on the data collected from the motion tests of stage, the distribution of vibration RMS values and the raw data points are depicted by a response surface methodology, as shown in Figure 13. The response surface plots clearly show the dependence of the RMS vibration levels on the stage rigidity and feed rate.
In addition, the vibration level continued to increase as the feed rate increased. This indicates that the vibration caused by increasing the feed rate was more dominant in affecting the RMS vibration level. The RMS vibration levels of the highest preloaded stage (case I) decreased significantly as compared to the lowest preload stage (case III). However, for stages II and IV with different combinations of sliding carriages at low and high preload amounts, the rigidity of the stage was lower than that of the highest preload stage (case I), and higher than the lowest preload stage (case III). The results of this vibration analysis indicate that the RMS vibration level of the positioning stage generated during movement is related to the preloaded status of the linear guides.

4. Prediction of Linear Guide Preload—ANN Modeling

The previous experiments roughly showed the correlation between the vibration magnitude and structural rigidity of the positioning stage. The stage was found to vibrate at different levels of motion owing to the change in the preload status of the linear guides. A statistical analysis further shows that the RMS vibration level from the moving stage is sensitive to changes in stage rigidity. This implies that the preload status of the linear guides can be predicted based on the vibration of the stage. In practice, a preload is normally generated by the interference between the rolling elements and raceways. The surface worn out of these components will lessen the interference and hence reduce the preload amount. It further enables the stage to exhibit different static and dynamic characteristics. This concept can initialize the development of a monitoring system to predict the change in the linear guide preload during operation.

4.1. Preload Variation of Linear Guide

In this section, the vibration signals assessed from the dynamic motion tests of the stages were used to establish the preload prediction model. The preload conditions of the linear guides and the rigidity of the stage are listed in Table 2. As mentioned above, all the linear guides used in the tests were newly assembled in a factory with preload rates at low, medium, and high amounts.
(1)
Case I: Stage assembled with four sliding blocks or carriages preloaded at heavy or high levels. Essentially, the interference at the rolling interface was about 8 μm for achieving high preload and the initial positioning stage rigidity was 2020 N/μm.
(2)
Case II: Stage with four sliding carriages preloaded at the medium level, which was generated by making an interference of 5 μm in the ball grooves of the linear guide. The stage rigidity was rated as 1696 N/μm.
(3)
Case III: Stage with four sliding carriages with low or light preloads. A light preload linear guide could be achieved by reducing the interference at the rolling interface to 1–2 μm. The structural rigidity of the stage was rated as 1176 N/μm.
The dataset for establishing the predictive model was taken from the motion tests associated with the three preloaded conditions, totaling 242 records.

4.2. Artificial Neural Network Model

4.2.1. ANN Architecture

A neural network algorithm was used to establish the correlation between the vibration of the feeding stage in motion and the preloaded status of the linear guides, and to develop a prediction model to identify the preload state or failure of the linear guides. The basic structure of a typical neural network is shown in Figure 14, which includes an input layer, a hidden layer, an output layer, and neurons inside a layer. For a simple neural network model, weights (w), bias (b), and activation functions exist in each layer. The weight indicates a correlation or multiplier value between adjoining neurons. A weight value on the neural network is significantly higher than other weights if the input parameter, which is given to the weight, has a greater influence on the output value.
In this analysis, the input neurons were RMS vibration levels in each axial and rotational direction, initial preload level, and initial stage rigidity. The output was the current rigidity or preload variation of the positioning stage. In addition, the activation function was responsible for counting or conditioning the output layer value and transmitting signals to the next layer in a neural network. To obtain a smooth continuous function system, the activation function commonly used in a neural network can be tan-sigmoid, log-sigmoid, linear, and others. In this analysis, tan-sigmoid was selected as the activation function for all neurons in the hidden layer, and a linear function was used as the output layer activation function.
In this neural network analysis model, the predicted variable was positioning stage rigidity. The input parameters included the vibration features, such as RMS values in three linear axes and the vibration RMS values in three angular axes (yawing, pitching, and rolling). The input parameters were labeled as X-RMS, Y-RMS-, Z-RMS, XYZ-RMS, YA-RMS, PI-RMS, and RO-RMS. In addition, the initial preload could also serve as an indicator of the preload state of linear guides at the initial assemblage of the stage. It could be assumed to have the same preload level, such as a high or medium level, depending on the scenarios to be simulated in application modeling. Stage rigidity was the target to be predicted from the measured vibrations. In the establishment of the predictive model, this rigidity value was given as the preload amount of linear guides assembled with the stage for motion tests. The data samples are listed in Table 5.

4.2.2. Determination of the Effectiveness of Prediction Models

In the current study, a qualitative relationship between the input and output parameters was established by a neural network analysis. The prediction performance of the selected ANN model was evaluated based on the root mean square error (RMSE), determination coefficient (R), and mean absolute percentage error (MAPE) as follows:
RMSE = 1 N i = 1 N | t i y i | 2 1 / 2
R 2 = 1 i = 1 N ( t i y i ) 2 1 N ( y i ) 2
MAPE = i = 1 N ( ( t i y i ) / t i ) × 100 ) N
where t is the target value, y is the predicted value, and N is the number of samples in the analysis.

4.3. ANN Predictive Models

In the ANN modeling, input data were collected from the dynamic motion tests of the stage with high, medium, and low preloads. All 242 records were divided into three groups, of which 75% were randomly selected for neural network training, 15% for testing, and the remaining 15% for validation. Several sample data for the ANN modeling are listed in Table 5.
The architecture of the neural network included one input layer, one hidden layer, and one output layer. The ANN modeling was conducted using multilayered perception (MLP) through Statistica Neural Networks software [43]. After many attempts, four different ANN models were selected based on the prediction performance and correlation coefficients. Each ANN model was labeled with a specific number, including the number of neurons in each layer, and the number of neurons in the hidden layer was optimized. For example, MLP 8-16-1 had 8 and 16 neurons in the input and hidden layers, respectively, and one neuron in the output layer. The models MLP 8-18-1 and MLP 8-30-1 were optimized with 28 and 30 neurons in the hidden layer, respectively.
Table 6 shows the sensitivity level of the constructed ANN input parameters. A larger value has less influence on the output parameter; conversely, the smaller the value, the greater the influence. It was found that in these models, the sensitivity values of all the input neurons had no significant differences, which means that the selected variables were suitable for input neurons. In addition, the initial preload state did not serve as the input neuron, but it could be employed as a reference to evaluate the degradation of the linear guide preload when compared with the output target, that is, stage rigidity predicted from the ANN model.
The statistical values for the selected ANN models, such as the correlation coefficient (R), RMSE, and MAPE, were used as the basis for determining the performance of the neural network modeling solutions, as summarized in Table 7. The value of R represents the extent of agreement between the predicted and measured values. The values of R for all the ANN models within all datasets were in the range of 0.958–0.980. Figure 15 shows a comparison of the measured and predicted values of the stage rigidity for all data, which indicates that a high agreement of the prediction results with a correlation coefficient is achieved by neural network models.
In addition, the RMSE values for prediction were less than 3.50%, which indicates that the average percentage prediction accuracy of all datasets was approximately 96.5%. This implies that the rigidity of the stage can be accurately predicted from the measured vibration signals based on the proposed ANN models. In addition, the root mean square error between the predicted stage rigidity and actual stage rigidity ranged from 59 to 90 N/μm, which means that the error of the ANN model for predicting preload failure was approximately 3.0–5.0% when compared with the initial rigidity value of 2020 N/μm.

4.4. Evaluation of ANN Model

Previously, predictive ANN models were successfully established based on a dataset that was assessed from motion experiments for stages with specific preload conditions. Subsequently, the ANN predictive models were validated by employing another dataset as the input variable to predict rigidity. The dataset for validation was collected from experiments conducted on stages with different combinations of linear guides with different preloads. Details of the preload setting of the stages for the motion tests are described in the following cases.
(1)
Case IV: Stage with three high preload and one low preload sliding blocks. This condition simulated one of the linear guide blocks subjected to severe wear at the rolling interfaces, and hence the preload decreased owing to the reduction of interference. This was also regarded as a moderate abnormal state, and the overall rigidity of the stage was 1809 N/μm, which was reduced by approximately 10% from an initially high preloaded stage.
(2)
Case V: Stage with two high preload and two low preload sliding blocks. This condition simulated two linear guides in a severe failure state with uneven wear at the rolling interface, which greatly reduced the preload of the two carriages from high to low values. In this severely abnormal state, the overall rigidity of the stage was 1598 N/μm, which was reduced by approximately 21%, from an initially high preloaded stage.
(3)
Case VI: Stage with three sliding blocks at medium preload and one low preload. This was intended to simulate the failure of the linear guide blocks subjected to severe wear at the rolling interfaces, yielding a preload loss of approximately 10%. In this case, in a moderately abnormal state, the overall rigidity of the stage was 1566 N/μm, which was reduced by approximately 10% from an initially medium preloaded stage.
Again, there were 38 records of vibration signals obtained from the tests conducted at a feed rate of 2000–8000 mm/min. The dataset was fed into the selected ANN models with a better performance. The statistical values of the ANN models are listed in Table 8. For cases (IV) and (VI), the average percentage prediction error of the stage rigidity was approximately 5.96–8.6%. The prediction error for case (V) was approximately 15–17%. The average prediction accuracy of the stage rigidity for the three evaluation cases was approximately 8.54–11.23%. It was found that the prediction performance of the selected ANN models in the model evaluation phase was slightly inferior to those demonstrated in the model training phase. In the training phase, all the data were measured from the stage with a specific preload. However, each stage was assembled with sliding blocks rated at the same preload level, which enabled all rolling interfaces in sliding blocks with consistent characteristics. This ensured that the stage vibrated at a consistent level, with less fluctuation. Therefore, the stage rigidities predicted from the vibration signals measured by the ANN models are comparable to the rated values, with a better prediction accuracy of approximately 96.5–97.8%. However, the stage for data collection in the evaluation phase was assembled with sliding blocks rated at different preloads. For example, the stage in case (V) was equipped with two high preload blocks on one rail and two low preload blocks. For the stage in case (VI), three blocks were medium preloaded, and one was at a lower preload. Compared with case (VI), the dynamic characteristics of the sliding blocks in stage case V were incontinent, which may affect the stage vibrating with more fluctuation. As shown in Figure 16, the data points of the vibration occurring in case (V) scattered in a wider range without a significant tendency with the feed rate, which probably caused the predicted stage rigidity to deviate more from the rated values. Consequently, it yielded lesser accuracy in prediction as compared to the other cases.

4.5. Application Scenario of ANN Model

Currently, this study has demonstrated that (1) the vibration characteristics of the feeding stage are affected by the linear guide preload with a significant correlation between them, and (2) the variation in the vibration level of the stage in motion is closely related to the change in the linear guide preload. With these phenomena, ANN models for predicting the preload state of the linear guide were developed, which were also shown to achieve good prediction accuracy based on the vibration signals measured on the stage.
The application of the preload predictive model can be schematically illustrated by means of a three-axis milling machine, which is initially equipped with four high preload linear guides (Z2). As shown in Figure 17, a human–machine interface with a simple graphical user interface (GUI) display combining the ANN prediction method is proposed in this study. Using this figure, the scenarios of preload degradation of linear guides in three-axis feeding mechanisms can be illustrated as follows:
(1)
Scenario 1, a normal preload condition is predicted for the X axis linear guide with green signs. The ANN models predict the rigidity at the value of 2020 N/um without preload decay in a short-term operation.
(2)
Scenario 2, a moderate preload degradation of the Y axis linear guide is predicted based on the measured vibration features. In this case, the linear guide is preloaded at the medium level (Z1), as in case (II), which is also considered to have a preload loss of 18% from the highest preload stage with a yellow sign.
(3)
Scenario 3, a severe preload degradation of the Z axis linear guide is predicted based on the measured vibration features, with a red sign. In this case, the linear guide is preloaded at a low level (Z0), as in case (III), which can be caused by the surface wear of the rolling elements or ball grooves. The decrease in the interference at the rolling interface reduces the preload by 30% or 42% from the initial medium (Z1) or the highest preload state (Z2).
Prior to the implementation of this application, a method for monitoring the stage rigidity or preload from a linear guide was established. However, to be put in the real world, a user-friendly and interactive display of the ANN output value needs to be designed for the end user, as shown in Figure 17. The workflow for processing the data is shown in Figure 18. The entire process begins with the acquisition of vibration data from the physical system. Subsequently, the signal is processed until the feature can be extracted from the raw signal. This feature extraction is a step toward identifying the condition indicator block before the prediction model is built. After training the model, the ANN is deployed and tested for a new dataset from the user. The new dataset output prediction is integrated with the GUI from the SQL server, as shown in Figure 16. The display user easily interprets the output prediction of the current preload that represents the condition or health status of the linear guide in the system. The interactive layout with the color given in the half-doughnut indicator shows a warning or message to the user, indicating whether the linear guide in the system needs to be replaced.
However, currently the monitoring system is still under development. It is expected that in the near future, the workflow will be automated, thus providing more convenience for the user to obtain the actual rigidity or health status of the linear guide. This is possible because the GUI can be connected to a real-time up-to-date dataset in the server.

5. Conclusions

In this study, an artificial neural network was employed to establish a prediction model for the rigidity of the positioning stage. The dynamic vibration signal was measured during the movement of the positioning stage, which was processed and fed into the ANN models to predict the linear guide preload degradation. Based on the results of the comprehensive study, the following conclusions can be drawn:
  • The vibration characteristics of the positioning stage structure in the static state and in motion are closely related to the linear guide preload. This shows that the vibration level of the high preload positioning stage is higher than that of the low preload positioning stage. The variation in the linear guide preload was determined and affected by the change in the interference between the rolling balls and the raceway. Basically, interference can be reduced by wearing out the rolling interface, which further causes a preload loss in linear guides with service time. This concept provides the basic knowledge for monitoring the degradation of a linear guide preload.
  • The ANN predictive models were shown to have good prediction performance in all training datasets collected from experiments, with an accuracy of 96.5%. This implies that the ANN models perform well in predicting the preload conditions of linear guides with consistent sliding blocks. In the verification dataset, the average percentage prediction error of the stage rigidity is approximately 8.54–11.23%, which is slightly higher than that in the training phase. This can be ascribed to the fact that the stage with an unevenly distributed preload in the sliding blocks easily induces vibration with more fluctuation, which ultimately affects the prediction accuracy.
  • The results of this study can provide a reference basis for the future development of a positioning stage preload intelligent monitoring system. The monitoring system output display was established using GUI from an SQL Server. In the current study, a monitoring system has been designed so that the prediction results from the ANN and the rest of the process are easily interpreted by the user to maintain the positioning stage in optimum performance. Future work in this field would entail incorporating online monitoring concepts to obtain real-time prediction values, that are updated and displayed quickly.

Author Contributions

W.-C.S.; conceptualization, software validation, and writing—original draft preparation. F.F.; investigation and data curation. P.-L.L.; investigation and funding acquisition. J.-P.H.; conceptualization, methodology, supervision, and writing—review and editing. All authors have read and agreed to the published version of the manuscript.

Funding

This research received no external funding.

Institutional Review Board Statement

Not applicable.

Informed Consent Statement

Not applicable.

Conflicts of Interest

The authors declare no conflict of interest.

References

  1. Datta, J.; Farhang, K. A nonlinear model for structural vibrations in rolling element bearings: Part I—Derivation of governing equations. J. Tribol. 1997, 119, 323–331. [Google Scholar] [CrossRef]
  2. Ohta, H.; Hayashi, E. Vibration of linear guideway type recirculating linear ball bearings. J. Sound Vib. 2000, 235, 847–861. [Google Scholar] [CrossRef]
  3. Chang, J.C.; Wu, J.S.S.; Hung, J.P. Characterization of the dynamic behavior of a linear guideway mechanism. Struct. Eng. Mech. 2007, 25, 1–10. [Google Scholar] [CrossRef]
  4. Sun, W.; Kong, X.; Wang, B.; Li, X. Statics modeling and analysis of linear rolling guideway considering rolling balls contact. Proc. Inst. Mech. Eng. C J. Mech. Eng. Sci. 2015, 229, 168–179. [Google Scholar] [CrossRef]
  5. Hung, J.P.; Lai, Y.L.; Lin, C.Y.; Lo, T.L. Modeling the machining stability of a vertical milling machine under the influence of the preloaded linear guide. Int. J. Mach. Tools Manuf. 2011, 51, 731–739. [Google Scholar] [CrossRef]
  6. Hung, J.P.; Lin, W.Z.; Chen, Y.J.; Luo, T.L. Investigation of the machining stability of a milling machine with hybrid guideway systems. Appl. Sci. 2016, 6, 76. [Google Scholar] [CrossRef] [Green Version]
  7. Deng, C.; Yin, G.; Fang, H.; Meng, Z. Dynamic characteristics optimization for a whole vertical machining center based on the configuration of joint stiffness. Int. J. Adv. Manuf. Technol. 2015, 76, 1225–1242. [Google Scholar] [CrossRef]
  8. Tao, W.; Zhong, Y.; Feng, H.; Wang, Y. Model for wear prediction of roller linear guides. Wear 2013, 305, 260–266. [Google Scholar] [CrossRef]
  9. Zou, H.T.; Wang, B.L. Investigation of the contact stiffness variation of linear rolling guides due to the effects of friction and wear during operation. Tribol. Int. 2015, 92, 472–484. [Google Scholar] [CrossRef]
  10. Wang, X.Y.; Zhou, C.G.; Ou, Y. Experimental analysis of the wear coefficient for the rolling linear guide. Adv. Mech. Eng. 2019, 11. [Google Scholar] [CrossRef]
  11. Zhou, C.G.; Ren, S.H.; Feng, H.T.; Shen, J.W.; Zhang, Y.S.; Chen, Z.T. A new model for the preload degradation of linear rolling guide. Wear 2021, 482–483, 203963. [Google Scholar]
  12. Wei, W.; Yimin, Z.; Changyou, L.; Hao, W.; Yanxun, Z. Effects of wear on dynamic characteristics and stability of linear guides. Meccanica 2017, 52, 2899–2913. [Google Scholar] [CrossRef]
  13. Li, C.; Xu, M.; He, G.; Zhang, H.; Liu, Z.; He, D.; Zhang, Y. Time-dependent nonlinear dynamic model for linear guideway with crowning. Tribol. Int. 2020, 151, 106413. [Google Scholar] [CrossRef]
  14. Wang, W.; Shen, G.; Zhang, Y.; Zhu, Z.; Li, C.; Lu, H. Dynamic reliability analysis of mechanical system with wear and vibration failure modes. Mech. Mach. Theory 2021, 163, 104385. [Google Scholar] [CrossRef]
  15. Lee, J.; Wu, F.; Zhao, W.; Ghaffari, M.; Liao, L.; Siegel, D. Prognostics and health management design for rotary machinery systems—reviews, methodology and applications. Mech. Syst. Signal Process. 2014, 42, 314–334. [Google Scholar] [CrossRef]
  16. Pellegrino, J.; Justiniano, M.; Raghunathan, A.; Weiss, B.A. Measurement science road map for prognostics and health management for smart manufacturing systems. In NIST Advanced Manufacturing Seriess (AMS); National Institute of Standards and Technology: Gaithersburg, MD, USA, 2016. [Google Scholar]
  17. Vogl, G.W.; Weiss, B.A.; Helu, M. A review of diagnostic and prognostic capabilities and best practices for manufacturing. J. Intell. Manuf. 2019, 30, 79–95. [Google Scholar] [CrossRef] [PubMed]
  18. Bin, G.F.; Gao, J.J.; Li, X.J.; Dhillon, B.S. Early fault diagnosis of rotating machinery based on wavelet packets—Empirical mode decomposition feature extraction and neural network. Mech. Syst. Signal Process. 2012, 27, 696–711. [Google Scholar] [CrossRef]
  19. Peng, Z.K.; Peter, W.T.; Chu, F.L. A comparison study of improved Hilbert–Huang transform and wavelet transform: Application to fault diagnosis for rolling bearing. Mech. Syst. Signal Process. 2005, 19, 974–988. [Google Scholar] [CrossRef]
  20. Zhang, X.; Zhou, J. Multi-fault diagnosis for rolling element bearings based on ensemble empirical mode decomposition and optimized support vector machines. Mech. Syst. Signal Process. 2013, 41, 127–140. [Google Scholar] [CrossRef]
  21. Ali, J.B.; Fnaiech, N.; Saidi, L.; Chebel-Morello, B.; Fnaiech, F. Application of empirical mode decomposition and artificial neural network for automatic bearing fault diagnosis based on vibration signals. Appl. Acoust. 2015, 89, 16–27. [Google Scholar]
  22. Lawbootsa, S.; Chommaungpuck, P.; Srisertpol, J. Linear bearing fault detection in operational condition using artificial neural network. In ITM Web of Conferences; EDP Sciences: Les Ulis, France, 2019; Volume 24, p. 01004. [Google Scholar]
  23. Samanta, B.; Al-Balushi, K.R.; Al-Araimi, S.A. Artificial neural networks and genetic algorithm for bearing fault detection. Soft Comput. 2006, 10, 264–271. [Google Scholar] [CrossRef]
  24. Wang, H.; Chen, P. Intelligent diagnosis method for rolling element bearing faults using possibility theory and neural network. Comput. Ind. Eng. 2011, 60, 511–518. [Google Scholar] [CrossRef]
  25. Zarei, J.; Tajeddini, M.A.; Karimi, H.R. Vibration analysis for bearing fault detection and classification using an intelligent filter. Mechatronics 2014, 24, 151–157. [Google Scholar] [CrossRef]
  26. Rai, A.; Upadhyay, S.H. A review on signal processing techniques utilized in the fault diagnosis of rolling element bearings. J. Tribol. 2016, 96, 289–306. [Google Scholar] [CrossRef]
  27. Hung, J.P.; Lin, C.Y.; Luo, T.L. Fault detection of linear guide preload of a positioning stage with vibration–acoustic analysis. J. Fail. Anal. Prev. 2011, 11, 684–692. [Google Scholar] [CrossRef]
  28. Jin, W.; Chen, Y.; Lee, J. Methodology for ball screw component health assessment and failure analysis. In International Manufacturing Science and Engineering Conference; American Society of Mechanical Engineers: New York, NY, USA, 2013; Volume 55461, p. V002T02A031. [Google Scholar]
  29. Bianchini, C.; Immovilli, F.; Cocconcelli, M.; Rubini, R.; Bellini, A. Fault diagnosis of linear bearings in brushless ac linear motors. In Proceedings of the 2009 IEEE International Symposium on Diagnostics for Electric Machines, Power Electronics and Drives, Cargese, France, 31 August–3 September 2009; pp. 1–6. [Google Scholar]
  30. Chommaungpuck, P.; Lawbootsa, S.; Srisertpol, J. Fault detection of linear bearing in auto core adhesion mounting machine using artificial neural network. WSEAS Trans. Syst. Control 2019, 14, 31–42. [Google Scholar]
  31. Chommuangpuck, P.; Wanglomklang, T.; Srisertpol, J. Fault detection and diagnosis of linear bearing in auto core adhesion mounting machines based on condition monitoring. Syst. Sci. Control Eng. 2021, 9, 290–303. [Google Scholar] [CrossRef]
  32. Feng, H.; Chen, R.; Wang, Y. Feature extraction for fault diagnosis based on wavelet packet decomposition: An application on linear rolling guide. Adv. Mech. Eng. 2018, 10. [Google Scholar] [CrossRef] [Green Version]
  33. Sharma, A.; Amarnath, M.; Kankar, P.K. Feature extraction and fault severity classification in ball bearings. J. Vib. Control 2016, 22, 176–192. [Google Scholar] [CrossRef]
  34. Cui, L.; Jin, Z.; Huang, J.; Wang, H. Fault severity classification and size estimation for ball bearings based on vibration mechanism. IEEE Access 2019, 7, 56107–56116. [Google Scholar] [CrossRef]
  35. Kankar, P.K.; Sharma, S.C.; Harsha, S.P. Fault diagnosis of ball bearings using machine learning methods. Expert Syst. Appl. 2011, 38, 1876–1886. [Google Scholar] [CrossRef]
  36. Zhang, X.; Liang, Y.; Zhou, J. A novel bearing fault diagnosis model integrated permutation entropy, ensemble empirical mode decomposition and optimized SVM. Measurement 2015, 69, 164–179. [Google Scholar] [CrossRef]
  37. Sakai, Y.; Tanaka, T. Influence of lubricant on nonlinear vibration characteristics of linear rolling guideway. J. Tribol. 2020, 144, 106124. [Google Scholar] [CrossRef]
  38. Hiwin Technologies Corp. Linear Guideway Technical Information. Available online: https://www.hiwin.com/pdf/linear_guid.eway.pdf (accessed on 15 January 2020).
  39. Brewe, D.E.; Hamrock, B.J. Simplified solution for elliptical-contact deformation between two elastic solid. J. Lubr. Technol. 1997, 99, 485–487. [Google Scholar] [CrossRef]
  40. Greenwood, J.A. Analysis of elliptical Herztian contacts. Tribol. Int. 1997, 30, 235–237. [Google Scholar] [CrossRef]
  41. Chang, J.C.; Hung, J.P. Analytical and finite element modeling of the dynamic characteristics of a linear feeding stage with different arrangements of rolling guides. Math. Probl. Eng. 2014, 2014, 454156. [Google Scholar] [CrossRef]
  42. Pedley, M. Tilt sensing using a three-axis accelerometer. Free. Semicond. Appl. Note 2013, 1, 2012–2013. [Google Scholar]
  43. TIBCO Software Inc. TIBCO Statistica. Available online: http://www.statsoft.com/Products/STATISTICA/Automated-Neural-Networks (accessed on 11 November 2018).
Figure 1. Schematic of linear rolling guide: (a) internal constructions and (b) arrangements of ball grooves [38].
Applsci 11 07902 g001
Figure 2. Experimental setup of compression test of linear guide.
Applsci 11 07902 g002
Figure 3. Load–deflection curves of the sliding blocks in radial direction.
Applsci 11 07902 g003
Figure 4. A single-axis positioning stage: (a) solid model and (b) stage prototype for test.
Applsci 11 07902 g004
Figure 5. Schematics of vibration test of stage: (a) rolling mode and (b) yawing mode.
Applsci 11 07902 g005
Figure 6. Finite element model of the stage with simplified linear guide.
Applsci 11 07902 g006
Figure 7. Fundamental vibration modal shapes of stage: (a) yawing mode; (b) rolling mode; and (c) pitching mode.
Applsci 11 07902 g007
Figure 8. Frequency responses of the stage with different preloads: (a) yawing mode; (b) rolling mode; and (c) pitching mode.
Applsci 11 07902 g008aApplsci 11 07902 g008b
Figure 9. Measurement of the vibration of the stage in feeding motion using three-axial accelerometers: (a) sensors at mid-points and center of stage; and (b) sensor at corner of stage.
Applsci 11 07902 g009
Figure 10. Vibration signals measured at the center of the stage under different preloaded conditions: (a) case I—highest rigidity; (b) case II—medium rigidity; (c) case III—lowest rigidity; (d) case IV—high-medium rigidity; (e) case V—medium-low rigidity.
Applsci 11 07902 g010
Figure 11. Relationship between the stage rigidity and vibration level at different feed rates: (a) sensors at mid-point of edge and center of the stage; and (b) sensors at corner of the stage.
Applsci 11 07902 g011
Figure 12. Schematic of dynamic model and angular motion of stage: (a) dynamic model of stage [41] and; (b) derivation of angular acceleration [42].
Applsci 11 07902 g012
Figure 13. Response surfaces of vibration RMS levels against the stage rigidity and feed rate.
Applsci 11 07902 g013
Figure 14. Architecture of neural network model.
Applsci 11 07902 g014
Figure 15. Comparisons of the stage rigidity between rated values and ANN predictions: (a) MLP 8-16-1; (b) MLP 8-18-1; (c) MLP 8-26-1; (d) MLP 8-30-1.
Applsci 11 07902 g015aApplsci 11 07902 g015b
Figure 16. Scatters of vibration level against feed rate for stages with different preloads.
Applsci 11 07902 g016
Figure 17. Application scenarios of predictive model with graphical user interface for monitoring rigidity decay of feeding mechanisms in milling machine: (a) X axis linear guide; (b) Y axis linear guide; and (c) Z axis linear guide.
Applsci 11 07902 g017
Figure 18. Data processing workflow of the preload prediction system.
Applsci 11 07902 g018
Table 1. Specifications of linear guide used in this study.
ItemDescription
Contact configurationDB type
The size of block (length, width, height)61 × 48 × 34 mm
Nominal diameter of steel ball, Db4.76 mm
Contact angle, β45°
Number of grooves4
Dynamic load capacity, C34.96 kN
Light preload, Z0(0–0.02 C)
Medium preload, Z1(0.05–0.07 C)
Heavy preload, Z2(0.10–0.12 C)
Static load capacity, Co43.94 kN
Table 2. Preload and rigidity of the linear guides.
Preload LevelPreload Amount (N)Radial Rigidity (kN/µm)
Hertz TheoryExperiments
Low, Z00.02 C699295308
Medium, Z10.07 C2447448472
High, Z20.12 C4195536536
Table 3. Modal frequencies of positioning stage with different preloads.
Vibration ModeStage Modal Frequency (Hz)
Low PreloadMedium PreloadHigh Preload
FEMExperimentFEMExperimentFEMExperiment
Yawing249246314295345323
Rolling279266354323393352
Pitching501626653671730781
Table 4. Preload conditions of stage for motion tests.
Stage ConditionStage Rigidity
(N/μm)
Preload Amount of the Sliding Blocks
Case I2020All the four blocks were preloaded at highest level (Z2)
Case II1696All the four blocks were preloaded at medium level (Z1)
Case III1176All the four blocks were preloaded at medium level (Z0)
Case IV1809Three blocks with high preload and one with low preload
Case V1598Two blocks with high preload and the other two with low preload
Table 5. Sample data for ANN modeling.
Input Variables
X-RMSY-RMSZ-RMSXYZ
-RMS
Pitching
RMS
Rolling
RMS
Yawing
RMS
Feed
Rate
Stage
Rigidity
Initial
STATE *
0.03280.02980.03340.05550.58870.54920.593140002020Case I
0.03090.02860.03340.05370.57730.54690.606320001696Case II
0.04010.04350.06510.08790.50320.51600.693260001696Case II
0.04400.05340.03140.07600.57180.66120.485680001176Case III
* Initial state: a remark of the stage rigidity at initial assemblage; here, cases I, II, and III are stages with high, medium, and low preload guides, respectively.
Table 6. Sensitivity levels of the input variables.
ANN
Model
X-RMSY-RMSZ-RMSXYZ
-RMS
Pitching
RMS
Rolling
RMS
Yawing
RMS
Feed
Rate
MLP 8-16-13.9756.6744.2722.9882.7033.5844.0152.456
MLP 8-18-13.4252.4825.3242.9762.8751.8021.9761.422
MLP 8-28-13.1139.6266.5908.3922.7375.6535.2122.737
MLP 8-30-110.1155.69624.0562.0573.7122.5685.9273.712
Table 7. Statistical values of neural network models.
DatasetTraining DatasetTesting DatasetValidation Dataset
ANN ModelRRMSEMAPERRMSEMAPERRMSEMAPE
MLP 8-16-10.97569.42.19%0.95988.22.95%0.97177.42.65%
MLP 8-18-10.96778.52.74%0.96482.82.68%0.96286.32.95%
MLP 8-28-10.98159.52.38%0.95987.43.40%0.97076.23.50%
MLP 8-30-10.97174.32.56%0.96778.92.64%0.96490.02.91%
Table 8. Statistical values of neural network models for verification dataset.
ANN ModelTest Cases of Stage
Case IVCase VCase VI
RMSEMAPERMSEMAPERMSEMAPE
MLP 8-16-1122.55.96%257.815.0%133.96.83%
MLP 8-18-1140.67.55%326.915.4%138.67.37%
MLP 8-28-1117.05.74%326.916.8%180.89.68%
MLP 8-30-1181.08.6%333.016.8%180.87.78%
Publisher’s Note: MDPI stays neutral with regard to jurisdictional claims in published maps and institutional affiliations.

