Abstract
Fingerprint recognition systems have been widely deployed in authentication and verification applications, ranging from personal smartphones to border control systems. Recently, the biometric society has raised concerns about presentation attacks that aim to manipulate the biometric system’s final decision by presenting artificial fingerprint traits to the sensor. In this paper, we propose a presentation attack detection scheme that exploits the natural fingerprint phenomena, and analyzes the dynamic variation of a fingerprint’s impression when the user applies additional pressure during the presentation. For that purpose, we collected a novel dynamic dataset with an instructed acquisition scenario. Two sensing technologies are used in the data collection, thermal and optical. Additionally, we collected attack presentations using seven presentation attack instrument species considering the same acquisition circumstances. The proposed mechanism is evaluated following the directives of the standard ISO/IEC 30107. The comparison between ordinary and pressure presentations shows higher accuracy and generalizability for the latter. The proposed approach demonstrates efficient capability of detecting presentation attacks with low bona fide presentation classification error rate (BPCER) where BPCER is 0% for an optical sensor and 1.66% for a thermal sensor at 5% attack presentation classification error rate (APCER) for both.
1. Introduction
Fingerprint recognition provides sustained and secured recognition since the fingerprint is assumed to be unique, collectible, convenient, long term, universal, and acceptable [1]. Despite all these attractive features, it has been shown that latent impressions can be captured by an attacker and used to create a duplicate with the objective of claiming someone’s identity [2,3,4]. This type of attack is standardized as presentation attack (PA) [5].
In order to eliminate or mitigate the risk of PAs, researchers have been investigating automatic presentation attack detection (PAD) mechanisms that determine whether the presented biometric trait is a bona fide (i.e., genuine) or attack presentation [6]. Marasco and Ross [7] classified fingerprint PAD mechanisms into software and hardware mechanisms. The main difference between the two classes is that hardware-based mechanisms require additional hardware conjunction with the sensor to capture additional distinguishing signals. Moreover, we classified PAD mechanisms in our previous work [8] based on the investigated PAD features as these PAD features might be caused by natural phenomena or collateral means. Based on the design of the mechanism, the PAD subsystem may investigate the static or dynamic capture of the fingerprint impression.
Although recent PAD mechanisms, based on the static fingerprint image, provide promising performance results, it is still questionable whether the static differences occur due to distinctions between genuine and fake fingerprints or due to the attack potential, which is characterized by the attacker’s expertise, motivation, and resources. Toward this end, Casula et al. [3] performed a comparison between the most efficient static PAD mechanisms using two datasets: (1) LiveDet 2019, and (2) a special dataset called “ScreenSpoof” that was collected assuming expert attacks. Interestingly, the evaluation results showed that expert attackers reduce the full system accuracy. The impostor attack presentation match rate (IAPMR) increased by 14.1% for the ZJUT mechanism and by 5.5% for the JLW mechanism. Another study was carried out by Goicoechea-Telleria [9] to evaluating the resistance of fingerprint systems in mobile devices to attacks performed by low and high levels of expertise. Interestingly, the study proved that expert attackers are more likely to be authenticated to the mobile device with a significant difference in IAPMR compared to novice attackers.
The design of PAD solutions should rely on genuine distinctions which segregate bona fide from attack presentations. Ideally, genuine fingerprints are supposed to produce good ridge quality, which is characterized by the following attributes: (1) sufficiently wide dynamic range, (2) even density distribution, (3) linearity, (4) no black or white saturation, (5) no significant blur or smudge, and (6) sufficient separation between ridges and valleys [10]. However, multiple behavioral and physical factors, such as inadequate fingerprint presentation and skin conditions, may impact the quality of the acquired image. This effect could be interpreted as a result of the fingerprint’s inherent phenomenon. For instance, considering the internal bone position and skin elasticity, applying additional pressure during the fingerprint placement often cause linear and non-linear distortions in the resulting ridge and valley pattern [11]. That can be perceived in the acquired image by thicker ridges, ridge flow distortion, black saturation, and less clarity.
In this paper, we investigate the difference between genuine and fake fingerprints through analyzing videos of fingerprint presentation while the capture subject applies additional pressure during the biometric presentation. The dynamic variations in the finger impression reflect the reaction of the natural fingerprint attributes (e.g., elasticity, 3-D shape, perspiration) and the physical characteristics of the different PAI species on the acquired fingerprint video. Accordingly, the dynamic features under finger pressure are assumed to provide reliable and distinguishing features that segregate bona fide from attack presentations.
In this sense, the main contribution of this paper are summarized as follows:
- Data collection of fingerprint videos considering the scenario wherein the capture subject applies pressure during the presentation. The dataset includes bona fide and attack presentations performed using seven PAI species;
- Performing subjective and objective analysis of the dynamic differences between genuine and fake fingerprints;
- A dynamic PAD scheme is introduced based on the defined differences between bona fide and attacks.
The remaining of this paper is organized as follows. Section 2 presents the related works focusing on the effect of pressure on fingerprint impressions. In Section 3, the proposed PAD subsystem is presented. Section 4 explains the data collection process and the evaluation method. In Section 5, we conduct a subjective analysis on bona fide and attack presentations by showing the visual differences from the fingerprint videos. Section 6 reports the experimental results. Finally, our conclusions are drawn in Section 7.
2. Related Work
2.1. Fingerprint Presentation Attack Detection
As mentioned previously, PAD mechanisms are categorized as hardware and software mechanisms. Hardware-based mechanisms are designed to capture signals, such as blood pressure, pulse oximetry, temperature, etc. [12,13,14], assuming that these signals represent natural finger characteristics. Although this category imposes additional hardware cost, it can detect presentation attacks with remarkable accuracy. Tolosana et al. [15] used multispectral imaging within the short-wave infrared (SWIR) spectrum and fine tuned convolutional neural networks (CNNs) to study a small dataset of bona fide and 12 presentation attack instrument (PAI) species. In their experiment, the authors reported 100% classification accuracy. The investigation was extended later using a larger dataset that includes 35 PAI species showing that a combination of two CNNs achieves attack presentation classification error rate (APCER) of 7% at 0.1 bona fide presentation classification error rate (BPCER). Goicoechea-Telleria et al. [16] proposed using microscope imaging with special lighting conditions to acquire fingerprint presentations then investigated the scale invariant feature transform (SIFT) through the bag of words approach in order to extract the PAD features; the experiment reported an APCER of 1.78 at 1.33% BPCER. Norbert and Kowalski [17] used time domain spectroscopy setup in the reflection configuration to study the interaction of terahertz radiation with the friction ridge skin of the finger. A deep learning model was implemented to classify attacks and bona fide presentation achieving 98.8% classification accuracy.
On the other hand, software-based methods seek to define discriminative features from static or dynamic fingerprint captures. In 2014, Galbally et al. [18] proposed an image quality-based PAD mechanism for fingerprint, face, and iris modalities with APCER = 13% and BPCER = 14%. Gonzalez-Soler et al. [19] analyzed the SIFT using the bag of words (BoW) approach. The mechanism was evaluated using the LivDet 2011 dataset and reported APCER = 5% at BPCER = 4.3%. In [20], Gonzalez-Soler et al. extended their work by proposing a PAD mechanism based on the combination of local dense-SIFT image descriptors and three different feature encoding approaches: Fisher vector (FV), vector locally aggregated descriptors (VLAD), and BoW, reporting the best results in the LivDet 2019 competition with an overall accuracy of 96.17%. The challenge of detecting PAI species that were not considered in the training phase was discussed by Rattani et al. [21] where the investigation proposed a scheme for the automatic detection and adaptation of a PAD mechanism to PAIs fabricated using novel materials. The latter scheme was reported to be robust to detect novel PAI with a limitation of potentially misclassifying low quality genuine fingerprints.
Moreover, in the context of dynamic PAD mechanisms, we analyzed in our previous work [22] the variation of first order statistics in fingerprint videos of different sensing technologies where the mechanism achieved 18.1% BPCER for the thermal sensing and 19.5% BPCER for the optical sensing at 5% APCER for both. We extended the experiment by utilizing spatio-temporal feature extractors that consolidate the spatial fingerprint features with the temporal variations, which improved the accuracy to 3.89% BPCER for the thermal sensing and 1.11% BPCER for the optical sensing at 5% APCER for both [23].
Additionally, deep learning has received much attention over the last decade due to its capability of extracting deep features that achieve significant accuracy improvement over the handcrafted features. In 2016, Nogueira et al. [24] proposed one of the first deep learning models in the context of fingerprint PAD using three CNNs. The authors concluded that their mechanism achieved the highest classification accuracy (97.1%) when compared to previous investigations. More recently, Chugh et al. [25] proposed a CNN based on MobileNet [26] that is applied to minutiae centered patches. The PAD mechanism was evaluated assuming different scenarios where the overall accuracy was 99.03% over different sensors. The generalizability of the latter mechanism was assessed later by testing the deep model with unseen PAI species where the experiment showed that it is more challenging to detect unseen attacks [27]. Uliyan et al. [28] proposed a PAD mechanism that utilizes a deep Boltzmann machine (DBM) to extract deep features from the regions of interest (RoI) of fingerprint images, then uses a K-nearest neighbors to classifier achieving 3.6% average classification error (ACR).
An open-set comparative study on handcrafted v/s deep features was conducted by Agarwal et al. [29] concluding that deep features obtained a better accuracy in the cross-sensor environment, handcrafted features obtained a lower classification error rate in the cross-dataset environment, and handcrafted features outperformed their deep counterparts under the within-dataset environment.
2.2. Previous Studies on Fingerprint Pressure
The influence of pressure on the fingerprint impression has been attracting researchers from biometrics and forensics fields. Hefetz et al. carried out an experiment studying the quality of latent fingermarks under pressure [30]. The experiment was conducted by deposing the finger on different surfaces under a range of weights from 0.1 to 10 kg. The study confirmed that the size of the impression increases with increasing pressure while the impression quality varies differently on the different surfaces. Moreover, Gu et al. [31] proposed a fingerprint rectification system that estimates the center and the direction of the fingerprint, then it detects the distorted fingerprint, discovers the distorted pattern, and applies image transformation. Although this method proved a significant enhancement in the speed, the authors revealed some limitations related to the accuracy of pose estimation. From a practical perspective, An et al. proposed a capacitive fingerprint sensor array with multiplexed, simultaneous detection of tactile pressure and finger skin temperature for mobile smart devices [32]. The proposed fingerprint sensor array can be integrated with all transparent forms of tactile pressure sensors and skin temperature sensors to enable the detection of a finger pressing on the display.
Initial studies in fingerprint PAD using the dynamic distortion followed the conclusions of Cappelli [33]. A systematic study on skin distortion was conducted to analyze the distortion caused by the elasticity of human skin [34]. Based on the research observations, the experiment initially suggests that genuine fingerprints and PAIs cause different distortions since artificial fingerprints are more rigid, consequently cause lower distortion compared to genuine fingerprints. In their paper, the authors argue that even when a high elastic PAI species is used to attack the system, it is very difficult to precisely emulate the distortion of genuine fingerprints since the behavior is identified with the manner in which the outside skin is anchored to the underlying derma and impacted by the position and state of the finger bone. In order to validate those assumptions, a dynamic dataset was collected using an optical sensor (high frame rate), with user instructions on presenting the fingerprint with rotation and pressure. The evaluation included presentations from bona fide capture subjects and five PAI species (Table 1). For each presentation, the method computes the optical flow, distortion map, and distortion code consecutively, and afterward compares the distortion codes to detect attacks.

Table 1.
Dynamic PAD mechanisms based on fingerprint deformation analysis.
Different from the latter technique, Zhang et al. used a thin-plate spline (TPS) model to globally characterize fingerprint distortion and utilize this model to detect malicious presentations performed by PAI species [35]. The experiment relied on the same assumptions in [33], which state that genuine fingerprints produce a unique distortion pattern that is very difficult to be emulated by attack presentations. A different database was collected to assess the method including genuine fingerprint and silicon attack presentations. The database was collected under controlled presentation instructions where the fingerprint/PAI is placed on the sensor’s surface, then pressure is applied in different directions. Under those conditions, the minutia movement represents the global distortion, and a sequence of paired minutia before and after distortion is used to calculate the parameters of the TPS model. The bending energy vector of the TPS model is utilized to distinguish bona fide from attack presentations.
Further analysis of fingerprint elasticity was performed by Jia et al. [36], analyzing the variations in the fingerprint area, intensity, and standard deviation. The variations in area and intensity were justified by the applied pressure and skin’s moistness. The experiment had shown that genuine fingerprints have an increased size and intensity in the sequence, while artifacts demonstrate a random fluctuation in intensity with increasing size for the area. On the other hand, the standard deviation feature characterizes the skin extension in x and y directions within the deformation process of the fingerprint pattern. The evaluation was reported using a dynamic dataset that was collected by a high frame rate capacitive sensor, while only a gelatin attack was performed. Fisher linear discriminant analysis is used to classify bona fide and attack presentations.
Table 1 shows a PAD comparison for the aforementioned methods by highlighting the methods’ accuracy, sensing technologies, and used PAI species.
There is still considerable ambiguity with regard to the generalizability of some of the previous conclusions. First, dynamic fingerprint patterns comprise all of the natural phenomena of genuine fingerprints and not only an individual characteristic, such as elasticity. Second, experiments in [35,36] were conducted using one PAI species, so conclusions are limited to those attacks and might not apply to other PAI species. Finally, even though the different PAI species have demonstrated different behaviors, other factors, such as attacking tools and attacker’s level of expertise, must be taken into account to completely characterize the interaction over the sensor’s surface.
3. Proposed Presentation Attack Detection Method
In this section, we demonstrate a fingerprint PAD mechanism that is designed to investigate the dynamic variation of fingerprint impression considering additional pressure during the presentation. The method relies on the fact that adding extra pressure during a genuine fingerprint presentation produces certain distortion, which differs from that produced by various attack species.
3.1. The Elements of the PAD Scheme
The proposed PAD solution is segmented into two folds (Figure 1): (i) instructed data acquisition: the participants are given sufficient information about the style of performing a presentation by adding pressure while placing the fingertip at the sensor’s surface, and (ii) software mechanism: used in the PAD subsystem to extract discriminative features that classify bona fide and attack presentations. These segments are explained as follows.
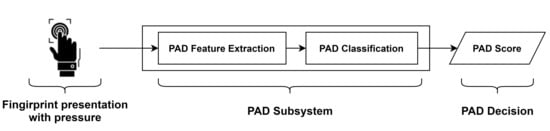
Figure 1.
The segments of the generic PAD scheme.
3.1.1. Presentation Instruction
Presentation instructions, which might be referred to as challenge-response in the context of PAD, are used to trigger the biometric trait aiming to obtain a unique reaction pattern(s) that, ideally, cannot be achieved by attacks. In this paper, we investigate the influence of pressure on the fingerprint ridge/valley pattern by instructing the subjects to perform additional pressure during the fingerprint placement on the sensor’s surface. The acquired presentation corresponds to the complete interaction between the finger and the sensor and is eventually captured as an uncompressed video. With this intention, different PAI species are selected to investigate their dynamic features under the defined instructions. The different attack species have been chosen to show different physical characteristics, such as elasticity. The selected species includes very elastic material (e.g., gelatin and Play-Doh), very rigid materials (e.g., white glue and nail polish), and average elasticity materials (latex, spray rubber) so that the dynamic variation and distortion are analyzed in distinct cases.
3.1.2. Software PAD Subsystem
After introducing additional information to the acquired fingerprint videos, a software PAD subsystem is required to extract decisive and interpretable features that validate the experiment’s assumption and succeed in the task of attack detection. The proposed PAD algorithms in this paper explore the dynamic texture in fingerprint videos so that the spatial fingerprint pattern is consolidated with the temporal changes. By exploiting these features in the proposed scenario, the PAD subsystem presents a countermeasure with significant efficiency, as reported in the results.
The next subsection explains the details of the PAD subsystem components.
3.2. Presentation Attack Detection Subsystem
In the context of this study, the PAD mechanism concerns the dynamic texture in the volumetric fingerprint pattern. After that, different machine learning algorithms are tested to select the classification algorithm with the highest accuracy.
3.2.1. PAD Feature Extractor
In order to investigate the dynamic features, we utilize five feature extraction methods that consolidate the spatial and temporal features aiming to investigate the influence of pressure on the fingerprint impression. In our previous work [23], dynamic texture has shown high capacity to provide discriminative descriptions for dynamic fingerprint presentations considering ordinary finger presentations. In this paper, we revisit the used methods in [23] and utilizes them as PAD feature extractors.
Table 2 summarizes a comparison between the feature extraction methods.
Table 2.
Summary of the bona fide visits.
3.2.2. PAD Classification
Different classification methods were examined in a pre-experiment step to define the most efficient classifier. Specifically, we tested the following machine learning techniques: classification trees, logistic regression, SVM classification, nearest neighbors, and classification ensembles. Support Vector Machine (SVM) classification has been chosen for our experiments due to its highest accuracy. Moreover, the impact of changing the SVM kernel was examined, whereas the second-degree polynomial kernel demonstrated the best accuracy. A binary classification scheme is used to evaluate the PAD subsystem performance and to assess the influence of specific PAI species on system security and ease of use.
4. Experiment Setup
This section provides a framework to verify the validity of the proposed PAD mechanism. First, we explain the process of data collection and the details of the collected data; attacks and bona fide. Secondly, the evaluation method is presented, defining the used metrics that are used to assess the technical competence of the PAD mechanism. The evaluation is performed following the recommendations of the standard ISO/IEC 30107-3.
4.1. The Database
The presented database consists of two portions: (1) dynamic presentations with ordinary presentations. This portion was introduced in our previous works [22,23] to analyze the dynamic fingerprint pattern in the typical use case; (2) Dynamic presentations where the capture subject applies additional pressure during the presentation. The latter portion is collected seeking to extend the state-of-the-art (SoA) investigations on dynamic fingerprint features, also to study the fingerprint’s dynamic-reaction to pressure. The complete database (Table 3) consists of 7128 fingerprint videos that correspond to bona fide and attack presentations. The data were collected from 66 statistically independent fingerprints of eleven capture subjects.
Table 3.
The database.
The dynamic database contains uncompressed fingerprint videos of bona fide and attack presentations. Data acquisition, storage, and management were carried out through a systematic study following the general data protection regulation (GDPR) directive. Data were collected from genuine fingerprints and seven PAI species using two commercial fingerprint sensors. Since the sensors do not support a video acquisition mode, a customized acquisition tool is developed using the sensors’ SDKs in order to capture the sequence of frames (video) instead of acquiring a single image.
The description of the main components of the database is as follows:
Participants
Eleven capture subjects, four females and seven males, have participated in the data collection. Each subject donated his or her biometric samples from 6 fingers: thumb, index, and middle of both hands. With this in mind, we ended up with a total of 66 statistically independent fingerprints.
Presentation scenario
Initially, the participants were given a brief overview of the typical use cases of fingerprint sensors. They then were asked to present their fingerprints to the sensors, knowing that each sensor acquires the complete placement over its surface as a video. The presentations were collected assuming two operational scenario:
- Ordinary presentation: which is the typycal placement of the fingertip over the sensor’s surface;
- Pressure presentation: the participants perform additional pressure during the presentation on the sensor’s surface.
Sensors
Two sensing technologies with different capabilities are utilized to collect the data. The sensors produce different characteristics for the captured videos due to their distinctions in Table 4.
Table 4.
Comparison of the used sensors in the data collection.
Bona fide visits
Capture subjects were required to fulfill two visits, at least two weeks apart, to donate their fingerprint characteristics. The visits are conducted as illustrated in Table 5.
Table 5.
Summary of the bona fide visits per scenario.
Attacks
The attacks are conducted in cooperation with the subjects. The 3D silicon molds were collected from the selected 66 fingerprints. Only one mold was collected from each fingerprint. Accordingly, the attacker performed attack presentations using seven PAI species, specifically: Play-Doh, white glue, spray rubber, nail polish, nail hardener, gelatin, and latex. Table 6 lists the details of the attacks following the recommendations of ISO/IEC 30107-3.
Table 6.
Summary of attack sessions per scenario.
Attacker
The attacker has extensive knowledge in biometric recognition, fingerprint sensing technologies, PAs, and PAD methods. Additionally, the attacker has previous practical experiences in attacking fingerprint sensors. During this experiment, the attacker has unlimited access to the fingerprint sensors and has the opportunity to apply attacks without restrictions.
4.2. PAD Evaluation
As provided in the standard ISO/IEC 30107 part 3: Testing and reporting [40], the goal of PAD subsystem evaluations is to determine the PAD mechanism’s ability to correctly classify attacks and bona fide presentations. Nonetheless, PAD subsystems are subject to classification errors, i.e., false positive and false negative. The conducted evaluation should report sufficient description which characterizes the influence of those error rates on the security and ease-of-use attributes of the biometric systems.
4.2.1. PAD Security
The security of PAD subsystem is impaired by the false negatives where attack presentations are misclassified as bona fide presentations. Thus, the security of a PAD subsystem is characterized by the metric attack presentation classification error rate (APCER), which represents the proportion of misclassified attacks as bona fide presentations.
Total APCER () is used to measure the PAD subsystem security when different PAI species are used to evaluate the system. In this case, all attacks are labeled as an attack. This metric does not demonstrate the strengths and weaknesses of the different PAI species. is calculated by [40]:
where, N is the total number of attack presentations and is 1 if the attack ith presentation is classified as bona fide and 0 otherwise.
APCER for a given PAI () is used to analyze the strength of a certain PAI species and is calculated by [40]:
where, is the total number of attack presentations for the given PAI, and is 1 if the attack ith presentation is classified as bona fide and 0 otherwise.
4.2.2. PAD Ease of Use
The PAD subsystem evaluation should report approximate guidance to illustrate the influence of PAD mechanism on the system’s ease-of-use. False-positive errors caused by the PAD subsystem have a negative effect on the user experience where bona fide presentations are incorrectly classified as attacks. The proportion of those misclassified bona fide presentation, i.e., bona fide presentation classification error rate (BPCER), is calculated by [40]:
where is the total number of bona fide presentations and is 1 if the ith presentation is classified as attack and 0 otherwise.
4.2.3. Security vs. Ease of Use
The choice of reporting PAD accuracy is crucial to provide comparable results that would help to contrast one mechanism with another or to make a comparison with the SoA investigations. The PAD subsystem accuracy can be determined in a single figure as BPCER at a fixed APCER. This allows determining the ease-of-use measures at certain levels of security, making the comparison between different mechanisms more evident and accurate. For example, BPCER can be computed when APCER = 5% and then reported as BPCER20. Moreover, the graphical representation for APCER versus BPCER (Detection Error Trade-offs (DET) curve) describes the trade-off between security and ease-of-use, and helps to define a decision threshold that suits the security/ease-of-use requirements.
Some studies refer to the measure where APCER = BPCER as the equal error rate (EER). In order to avoid confusion with the classical EER we refer to this measure in the context of presentation attack as the trade-off equal error rate (TEER).
5. Observations on the Dataset
In this section, we seek to interpret the influence of pressure on the presented fingerprint trait based on the physical characteristics of genuine and fake fingerprints. The interpretation is conducted by subjectively analyzing the ridge/valley pattern in the sequence of frames for the different presentation types (Figure 2).
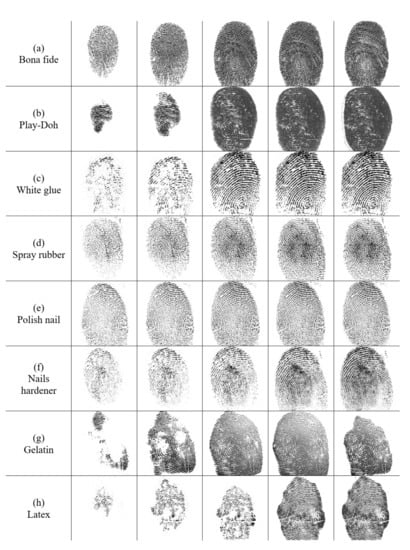
Figure 2.
The influence of pressure in genuine and attack presentations. Frames are taken to demonstrate the variations at the beginning, mid, end of the presentation (left to right). The videos were captured by an optical sensor.
Consequently, assuming that each fingerprint presentation is a sequence of n frames , i.e., , the following observations are perceived:
- In bona fide presentations, the image intensity is consistently increased as i increases. Specifically, once the pressure is performed, the image intensity starts to increase very rapidly, resulting in a darker pattern (Figure 2a). Although pressure causes the rapid increment in the image intensity, it is equally important considering the other fingerprint’s phenomena, such as perspiration and elasticity;
- Each PAI species shows a specific behavior during the PAI placement at the sensor. Therefore, each species demonstrates a different reaction to the pressure depending on the PAI characteristics, which are implied by the preparation recipe and used materials (Figure 2b–h);
- A slight shift takes place in the central region of the fingerprint pattern of genuine users after pressure (Figure 3a). Considering elastic and rigid PAI species, Figure 3b,c demonstrate how the ridges/valley shift might be extreme in the gelatin presentation whilst excessively unnoticed in the polish nail attack;
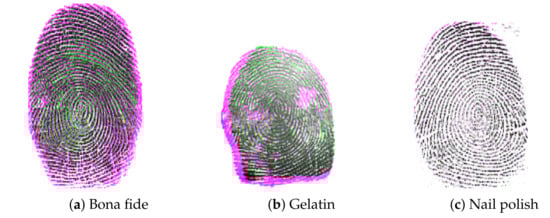 Figure 3. The impact of pressure on the pattern shape. Each sub-image demonstrates two frames taken from a video and matched. Colors are: initial frame in green, later frame in magenta, and the matching pattern in black. (a) Bona fide, (b) Gelatin, (c) Nail polish.
 - As successive frames in the fingerprint presentation represent the development of ridge/valley pattern, it is subjectively noticed that the similarity between the successive frames of bona fide presentations slightly varies when pressure is performed. On the contrary, using elastic materials, such as Play-Doh and gelatin, the fingerprint pattern vanishes or degrades after applying pressure (Figure 2b–g). On the other hand, rigid material, such as white glue and polish nails, are likely to demonstrate consistent pattern while i increases, and contrary to bona fide and elastic materials, pressure may enhance the visual pattern in those attacks Figure 2c–e;
- In order to conduct an objective comparison based on the previous point, we calculate the structural similarity index (SSIM) between the successive frames for each presentation type. Figure 4 demonstrates the SSIM vector for each presentation class;
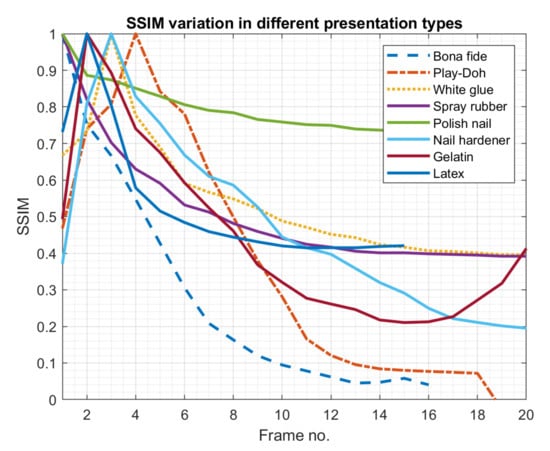 Figure 4. Illustration of for a bona fide and 7 attack presentations. The presentations are acquired using the optical sensor.
 - Despite the fact that attacks may imitate the fingerprint pattern at later frames in the presentation, it is noticed that the early frames show an anomalous development in the ridges/valley pattern (Figure 2c,d,g,h); and,
- Contrary to the latter observation, the size, ridges continuity, and contour’s shape of bona fide presentations are developed homogeneously (Figure 2a).
6. Experimental Results
This section aims to verify the validity of the proposed PAD mechanisms. In the following subsections, the distortion-based and spatio-temporal features are analyzed through a set of experiments that illustrate the effectiveness of each approach. Accordingly, the next subsection explains the experimental protocols and highlights the used databases at each experiment. Subsequently, the following five experiments were carried out to examine and assess the PAD mechanisms:
- Experiment I investigates the spatio-temporal features as explained in Section 2, considering the same database used in Experiment I;
- Experiment II carries out a PAD subsystem comparison when considering ordinary presentations and presentations with additional pressure;
- Experiment III highlights the influence of sensing technology on the PAD mechanism;
- Experiment IV demonstrates a comparison to the related works.
6.1. Experimental Protocols
In order to carry out the proposed experiments, the following protocols are provided to ensure obtaining reliable and comparable results.
Protocol I
The purpose of this protocol is to evaluate the proposed PAD mechanisms by conducting Experiments I. We thus utilize the database portion which consider the pressure scenario. This portion was collected to investigate the influence of pressure on bona fide and attack presentations. In all of the experiments, each sensor’s data are studied individually because of the differences between the acquired data, i.e., frame rate, image size, resolution, noise, etc. Then sensors’ data are divided into 55% training set and 45% testing set. The division is performed by randomizing capture subjects, such that all the presentations (bona fide and attacks) of an independent capture subject are either in the training or testing data. The randomization of partitioning is performed to ensure that the machine learning model has never seen presentations that correspond to the tested capture subjects in the training phase. Finally, the PAD subsystem is evaluated through performing the PAD feature extraction, training/testing the PAD classifier, and assessing the obtained results following the evaluation methodology.
Protocol II
The aim of the second protocol is to compare the PAD performance of the proposed mechanisms in the scenarios of ordinary presentations and presentations with pressure. The comparison is performed in two parts: (i) Accuracy comparison: we apply the steps of protocol I to the database portion which includes ordinary fingerprint presentations, then we compare the results to those obtained in Experiments I; (ii) Generalizability comparison: in order to test the mechanisms’ generalizability, we perform ‘leave-one-out’ cross-validation to the machine learning model. The cross-validation is performed for each sensor individually for the reason mentioned in protocol I. Then, each sensor’s data are split into k folds, where k represents the number of individual capture subjects. The learning algorithm is performed k times by taking one capture subject as a testing set and all other capture subjects as a training set. At each testing phase, the PAD subsystem is evaluated, and results are reported. Once the cross-validation is done, results are demonstrated.
Table 7 summarizes the proposed experiments, the corresponding protocol and database, and the experiment objective.
Table 7.
Summary of the proposed experiments.
6.2. Experiment I: Fingerprint Dynamic Texture
This experiment aims to investigate the dynamic fingerprint texture, specifically caused by pressure, as PAD features. The experiment is conducted following Table 7.
The classification accuracy of the proposed PAD mechanism, using all feature extractors and different parameters, is reported as BPCER at APCER = 5% and APCER = 2.5% in Figure 5. Moreover, The PAD testing scores are expressed as functions of the decision threshold, i.e., DET curves, considering all feature extraction algorithms in Figure 6 and Figure 7.
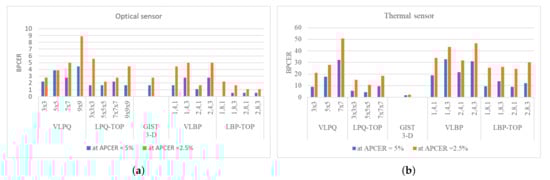
Figure 5.
BPCER (%) results for the five feature extractors. The scale of y-axis is adjusted for each figure for better visualization to the obtained error rates.
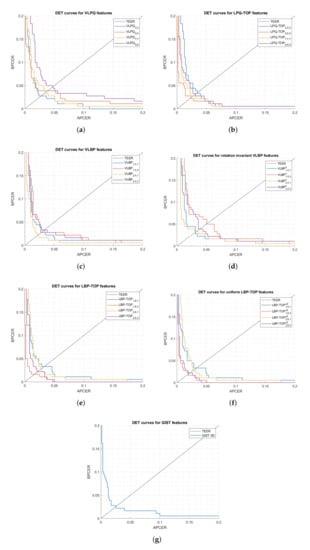
Figure 6.
Detection Error Trade-offs (DET) curves for the five feature extractors (optical sensor).
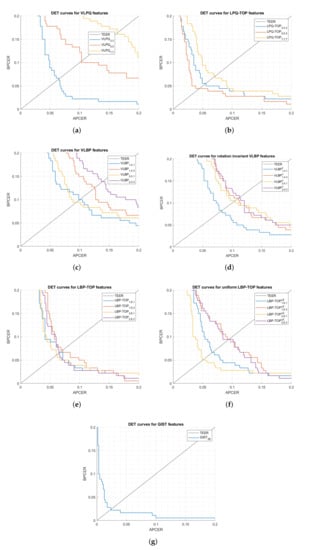
Figure 7.
DET curves for the five feature extractors (optical sensor).
The most desirable result to emerge from the figures is achieving low values for the pair (APCER|BPCER). For instance, at 5% APCER, BPCER values are 0% for the optical sensor using , and 1.66% for the thermal sensor using . While at 2.5% APCER, BPCER values are: 1.11% for the optical sensor using and 2.22% for the thermal sensor using .
In order to examine the PAD subsystem capability of detecting different PAI species, for the seven attack species is reported at = 5% in Table 8 and Table 9. The tables list the distribution of the 5% on the seven PAI species. It is interesting to note that despite the similarity in DET curves, the distribution might differ notably. For example, considering the optical sensor, the spray rubber species has an APCER = 2.22% when is used, however, APCER raises to 18.89% using .
Table 8.
PAD subsystem performance for the optical sensor.
Table 9.
PAD subsystem performance for the thermal sensor.
The distribution confirms a significant difference in the PAD subsystem vulnerability to the different attack species. Meaning that the PAD subsystem, at a certain threshold, might have the capacity of eliminating some PAI species, as shown in Table 8 and Table 9, nevertheless, the results demonstrate its vulnerability to other species.
For both sensing technologies, the PAD mechanism had been able to obtain BPCER values lower than 2.5% at APCER = 2.5%. This implies that both security and ease of use aspects have been achieved without the need to compromise one over the other. The following experiments further investigate the effectiveness and generalizability of spatio-temporal features.
6.3. Experiment II: The Influence of Pressure on the PAD Subsystem Accuracy
6.3.1. PAD Subsystem Accuracy: Pressure versus Ordinary Presentations
In order to identify the influence of pressure on the PAD subsystem accuracy, BPCER20 is used to compare the PAD subsystem accuracy considering the scenarios of ordinary presentations and presentations with pressure. The error rates, reported in [23] for ordinary presentation and in the previous experiment for presentations with pressure, are shown in Figure 8 to compare the PAD subsystem accuracy for both scenarios.
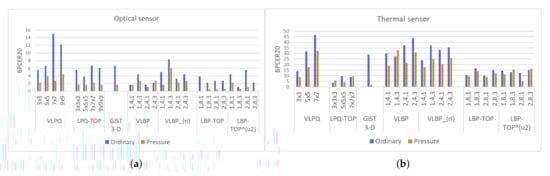
Figure 8.
Scenario comparison for the proposed PAD subsystem considering the 5 feature extractors.
The majority of tests in Figure 8 reveal that additional finger pressure during the presentation results in a reduction in BPCER20. This reduction could be significantly large, as noticed when examining the PAD subsystem using GIST 3-D descriptor, where the BPCER was reduced over 80% when compared with ordinary presentations for both sensors. On the other hand, a few tests in the figure show an advantage for ordinary presentations. Those scenarios are further investigated in the next subsection.
The most intriguing observation to emerge from Figure 8 is the significant accuracy enhancement when using for the optical sensor and for the thermal sensor. Thus, Figure 9 and Figure 10 demonstrate the score distributions for bona fide and attack presentations considering both cases. The influence of pressure can be simply noticed by comparing the median values for attacks, and the median values for bona fide. Considering the optical sensor, the median of attacks dropped from −1.34 to −2.28 and the median of bona fide increased from 0.21 to 0.30. On the other hand, the thermal sensor does not show a noticeable change in the median of attacks but the median of bona fide increased from 0.21 to 0.37. Another interpretation can be seen by the decreased misclassified presentations when pressure is considered.
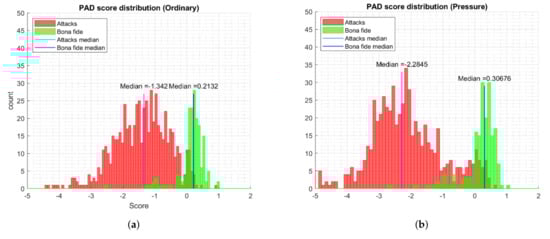
Figure 9.
PAD scores distribution for the optical sensor using VLPQ7×7 features.
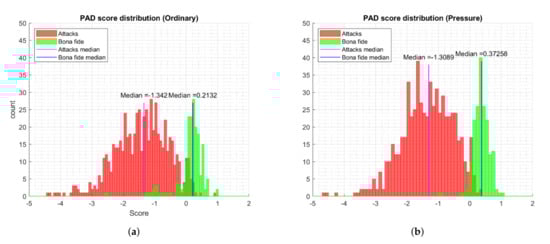
Figure 10.
PAD scores distribution for the thermal sensor using GIST 3-D features.
6.3.2. PAD Subsystem Generalizability: Pressure versus Ordinary Presentations
To assess the PAD subsystem generalizability, the second part of Protocol II is applied. Accordingly, leave-one-out cross-validation model is applied for each scenario considering all feature extractors. Considering the data division, each combination between a scenario and feature extraction method is evaluated 11 times; once for each fold. To describe each cross-validation model from 11 testing sets, let us assume that is the sequence of error rates, where i is the fold number. The vector is analyzed by showing: (i) minimum, (ii) maximum, (iii) mean, (iv) median, and (v) standard deviation values.
Figure 11 highlights the differences between those statistics by showing BPCER20 for the best (i.e., min. BPCER20) and worst (i.e., max. BPCER20) testing folds, and how the BPCER20 is distributed with respect to the average value using the median value. Moreover, the stability of a model is implied by the standard deviation values. In other words, a low average with low disparity confirms higher generalizability for the tested model.
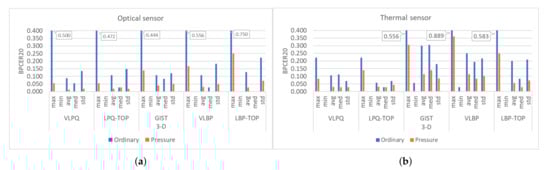
Figure 11.
The influence of pressure on the PAD subsystem efficiency (Unshown bars on the refer to the value 0.).
As can be seen from Figure 11, the differences between the max BPCER20 values are remarkable when comparing the pressure and ordinary scenarios. The best improvement is achieved considering VLPQ for the optical sensor, where BPCER20 is reduced from 50% to approximately 5%, i.e., BPCER20 is 10 times less for the pressure scenario. In addition, the average, median, and standard deviation values are reduced for all feature extractors for the pressure scenario. This implies a lower range of disparity at a lower average value for BPCER20.
The findings of this experiment emphasize the validity of the proposed model when it is compared to ordinary dynamic presentations. Primarily, significant enhancement in the PAD subsystem accuracy was obtained using the same sensors, feature extractors, and evaluation methodology. Furthermore, the proposed model illustrated lower error rate variance when each independent captured subject was tested individually, demonstrated in Figure 11.
The observed enhancement in the accuracy, shown in Figure 9 and Figure 10, is in line with the initial assumption which claims that fingerprint pressure produces more distinctive dynamic features that allow differentiating bona fide from attack presentations. On the other hand, the stability of the PAD model, which was confirmed by the leave-one-out cross validation, could be interpreted as being a result of obtaining more generic features that are less dependent on certain differences between capture subjects.
6.4. Experiment III: The Influence of Sensing Technology
This experiment points out the influence of the tested sensing technologies on the proposed PAD subsystem efficiency. The comparison focuses on two main aspects:
I. The overall PAD mechanism accuracy is determined using BPCER at fixed APCER values. Hence, the most effective feature extractors are selected, then the sensors are compared using BPCER20 (Figure 12);
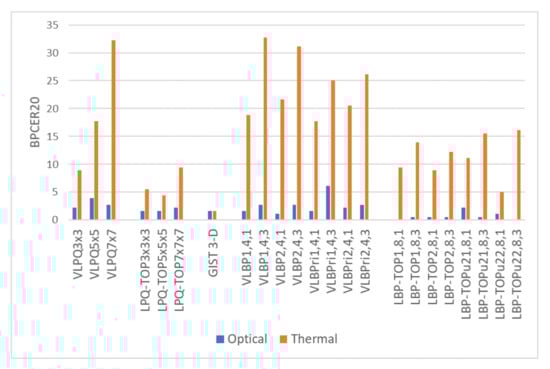
Figure 12.
PAD accuracy for the two sensors in terms of BPCER20.
II. The mechanism’s capability of eliminating specific PAI species. The comparison is carried out by determining the number of eliminated PAI species considering the different sensors and feature extractors (Figure 13).
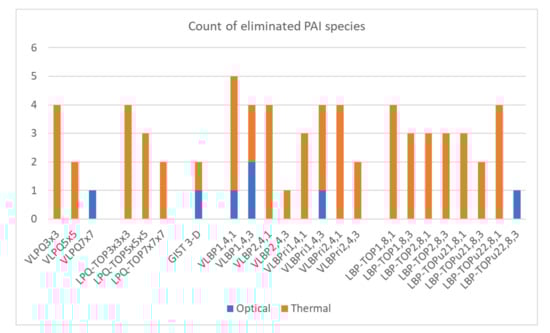
Figure 13.
PAD mechanisms capability of eliminating PAI species.
The comparison here is not as straightforward as it seems. Even though the optical sensor is demonstrating a higher accuracy in part of the DET curves, the PAD mechanism has shown the vulnerability to all attack species, and in its best case, the PAD mechanism rejected two species. On the other hand, utilizing the PAD mechanism at the thermal sensor had proven a higher capability to reject more attack species, where four PAI species were rejected using VLBP, LBP-TOP, VLPQ, and LPQ-TOP features.
6.5. Experiment IV: Comparison with SoA Mechanisms
Literature studies had aimed to evidence the assumption that under certain presentation instruction, genuine fingerprints produce unique variation or distortion patterns that assist the process of detecting attacks. The aforementioned assumption counts on the natural structure of the human finger and its phenomena, such as elasticity, internal bone position, etc. Moreover, previous studies had attempted to define some characteristics of different PAI species. For instance, Antonelli et al. [34] had studied five PAI species and concluded that artificial artefacts are more rigid than genuine fingerprints. Thus, the produced distortion while rotating and pressuring the finger during a presentation is higher for genuine users.
In this experiment, we compare our results with previous studies on static and dynamic PAD (Table 10). We find that the obtained results are significantly improved compared to the SoA methods based on fingerprint distortion features. In addition, a wider set of attack species were used in this investigation.
Table 10.
Comparison with fingerprint-deformation-based PAD mechanisms.
We find that the obtained results are significantly improved compared to the SoA results, even though a wider set of attack species were used in our experiments.
7. Conclusions
In this paper, we examined the influence of pressure in fingerprint presentations and utilized this influence for the purpose of PAD. We studied the dynamic characteristics of genuine and attack presentations through a subjective and objective analysis. Based on those analyses on genuine fingerprints and seven PAI species, we concluded that the reaction to pressure in fingerprint patterns depends on the characteristics of the presented trait, genuine or attack. Bona fide presentations had shown a consistent variation in the pattern, which is highlighted by a homogeneous degradation in the structural similarity in the consequent frames. On the other hand, elastic species (e.g., Play-Doh and gelatin) had shown an extreme variation in the pattern, sometimes the pattern vanishes and a dark region is obtained after pressure. Differently, rigid species (e.g., polish nail and white glue) had shown that pressure might improve the fingerprint pattern and result in high contrast between the ridges and valleys.
Fingerprint dynamic features were investigated using different dynamic texture descriptors. The utilized feature extractors had demonstrated a significant capability to detect presentation attacks and low false reject rates at the same time. Statistically speaking, when the PAD subsystem is evaluated at 2.5% APCER, i.e., 16 successful attacks out of 630 attacks, BPCER values are 1.11% for the optical sensor, i.e., 2 rejected bona fide presentations out of 180 total, and 2.22% for the thermal sensor, i.e., 4 rejected bona fide presentations out of 180 total.
In this investigation, we compared the dynamic features of fingerprint presentations under pressure with our previous study on dynamic ordinary presentations [23]. The comparison was carried out by studying the impact of pressure on the classification accuracy of five spatio-temporal features. The initial phase of our experiment confirmed that applying additional pressure triggers the presented fingerprint/PAI manifests distinguishing attributes which significantly improve the PAD subsystem accuracy. Moreover, the comparison analyzed the generalization of each presentation scenario by applying hold-one-out cross validation in order to validate the obtained results on unseen capture subjects. The results confirmed that applying pressure improves the generalizability of the model by reducing the error rates for the unseen subjects. Additionally, the proposed method has illustrated high accuracy for the different sensing technologies where the pros and cons of each sensor were discussed in the previous section.
This study contributes to the SoA investigation with a deeper understanding of the fingerprint dynamic features and the dynamic characteristics of different attack species.
Future work should concentrate on studying larger datasets that include a larger number of independent capture subjects. Moreover, the selection of participant/PAI species should include a wide spectrum of skin/materials categories, that is to include very dry skin to very sweaty skin for bona fide and different features for PAIs. From another perspective, the attacker’s expertise should be taken into account for conducting a larger-scale evaluation. Meaning that multiple attackers with different capabilities should participate to produce PAs. Finally, we suggest studying fingerprint-specific dynamic features, such as contours development and region of interest variations.
Author Contributions
A.H. set the experimental protocol, performed the experiment, and wrote the paper. The experimental results and the paper were analyzed and reviewed by J.L.-J. and R.S.-R. All authors have read and agreed to the published version of the manuscript.
Funding
This work was supported by the European Union’s Horizon 2020 for Research and Innovation Program under Grant 675087 (AMBER).
Institutional Review Board Statement
Not applicable.
Informed Consent Statement
Informed consent was obtained from all subjects involved in the study.
Data Availability Statement
Not applicable.
Conflicts of Interest
The authors declare no conflict of interest.
References
- Nelson, J. Biometrics Characteristics. In Effective Physical Security; Elsevier Inc.: Amsterdam, The Netherlands, 2013; pp. 255–256. [Google Scholar] [CrossRef]
- Goicoechea-Telleria, I.; Garcia-Peral, A.; Husseis, A.; Sanchez-Reillo, R. Presentation Attack Detection Evaluation on Mobile Devices: Simplest Approach for Capturing and Lifting a Latent Fingerprint. In Proceedings of the 2018 International Carnahan Conference on Security Technology (ICCST), Montreal, QC, Canada, 22–25 October 2018; pp. 1–5. [Google Scholar] [CrossRef]
- Casula, R.; Orrù, G.; Angioni, D.; Feng, X.; Marcialis, G.L.; Roli, F. Are spoofs from latent fingerprints a real threat for the best state-of-art liveness detectors? arXiv 2020, arXiv:2007.03397. [Google Scholar]
- Blanco Gonzalo, R.; Corsetti, B.; Goicoechea-Telleria, I.; Husseis, A.; Liu-Jimenez, J.; Sanchez-Reillo, R.; Eglitis, T.; Ellavarason, E.; Guest, R.; Lunerti, C.; et al. Attacking a Smartphone Biometric Fingerprint System: A Novice’s Approach. In Proceedings of the 2018 International Carnahan Conference on Security Technology (ICCST), Montreal, QC, Canada, 22–25 October 2018. [Google Scholar] [CrossRef]
- ISO/IEC 30107-1:2016—Information Technology—Biometric Presentation Attack Detection—Part 1: Framework; ISO: Geneva, Switzerland, 2016.
- Nixon, M.S. Handbook of Biometric Anti-Spoofing; Springer: Cham, Switzerland, 2019; pp. 207–228. [Google Scholar] [CrossRef] [Green Version]
- Marasco, E.; Ross, A. A Survey on Antispoofing Schemes for Fingerprint Recognition Systems. ACM Comput. Surv. 2014, 47, 1–36. [Google Scholar] [CrossRef]
- Husseis, A.; Liu-Jimenez, J.; Goicoechea-Telleria, I.; Sanchez-Reillo, R. A survey in presentation attack and presentation attack detection. In Proceedings of the International Carnahan Conference on Security Technology, Chennai, India, 1–3 October 2019. [Google Scholar] [CrossRef]
- Goicoechea Telleria, I. Evaluation of Presentation Attack Detection under the Context of Common Criteria. Ph.D. Thesis, Universidad Carlos III de Madrid, Madrid, Spain, 2019. [Google Scholar]
- Hara, M. Thoughts on Fingerprint Image Quality and Its Evaluation Thoughts on Fingerprint Image Quality and Its Evaluation Fingerprint Image Quality and Its Evaluation Fingerprint Image Quality and Its Evaluation; NIST Biometric Quality Workshop II; NIST: Gaithersburg, MD, USA, 2007. [Google Scholar]
- Hicklin, R.A. Improving the Rigor of the Latent Print Examination Process. Ph.D. Thesis, University of Lausanne, Lausanne, Switzerland, 2017. [Google Scholar]
- Tan, B.; Schuckers, S. Spoofing protection for fingerprint scanner by fusing ridge signal and valley noise. Pattern Recognit. 2010, 43, 2845–2857. [Google Scholar] [CrossRef]
- Chang, S.; Larin, K.; Mao, Y.; Flueraru, C.; Almuhtadi, W. Fingerprint Spoof Detection Using Near Infrared Optical Analysis; Books on Demand: Norderstedt, Germany, 2011. [Google Scholar] [CrossRef]
- Busch, C.; Sousedik, C. Presentation attack detection methods for fingerprint recognition systems: A survey. IET Biom. 2014, 3, 219–233. [Google Scholar] [CrossRef] [Green Version]
- Tolosana, R.; Gomez-Barrero, M.; Kolberg, J.; Morales, A.; Busch, C.; Ortega-Garcia, J. Towards Fingerprint Presentation Attack Detection Based on Convolutional Neural Networks and Short Wave Infrared Imaging. In Proceedings of the 2018 International Conference of the Biometrics Special Interest Group, BIOSIG, Darmstadt, Germany, 26–28 September 2018. [Google Scholar] [CrossRef]
- Goicoechea-Telleria, I.; Kiyokawa, K.; Liu-Jimenez, J.; Sanchez-Reillo, R. Low-Cost and Efficient Hardware Solution for Presentation Attack Detection in Fingerprint Biometrics Using Special Lighting Microscopes. IEEE Access 2019, 7, 7184–7193. [Google Scholar] [CrossRef]
- Pałka, N.; Kowalski, M. Towards Fingerprint Spoofing Detection in the Terahertz Range. Sensors 2020, 20, 3379. [Google Scholar] [CrossRef] [PubMed]
- Galbally, J.; Marcel, S.; Fierrez, J. Image Quality Assessment for Fake Biometric Detection: Application to Iris, Fingerprint, and Face Recognition. IEEE Trans. Image Process. 2014, 23, 710–724. [Google Scholar] [CrossRef] [PubMed] [Green Version]
- González-Soler, L.J.; Chang, L.; Hernández-Palancar, J.; Pérez-Suárez, A.; Gomez-Barrero, M. Fingerprint Presentation Attack Detection Method Based on a Bag-of-Words Approach. In Progress in Pattern Recognition, Image Analysis, Computer Vision, and Applications; Mendoza, M., Velastín, S., Eds.; Springer International Publishing: Cham, Switzerland, 2018; pp. 263–271. [Google Scholar]
- Gonzalez-Soler, L.J.; Gomez-Barrero, M.; Chang, L.; Perez-Suarez, A.; Busch, C. Fingerprint Presentation Attack Detection Based on Local Features Encoding for Unknown Attacks. IEEE Access 2021, 9, 5806–5820. [Google Scholar] [CrossRef]
- Rattani, A.; Scheirer, W.J.; Ross, A. Open set fingerprint spoof detection across novel fabrication materials. IEEE Trans. Inf. Forensics Secur. 2015, 10, 2447–2460. [Google Scholar] [CrossRef]
- Husseis, A.; Liu-Jimenez, J.; Goicoechea-Telleria, I.; Sanchez-Reillo, R. Dynamic Fingerprint Statistics: Application in Presentation Attack Detection. IEEE Access 2020, 8, 95594–95604. [Google Scholar] [CrossRef]
- Husseis, A.; Liu-Jimenez, J.; Sanchez-Reillo, R. Fingerprint Presentation Attack Detection Utilizing Spatio-Temporal Features. Sensors 2021, 21, 2059. [Google Scholar] [CrossRef] [PubMed]
- Nogueira, R.F.; de Alencar Lotufo, R.; Campos Machado, R. Fingerprint Liveness Detection Using Convolutional Neural Networks. IEEE Trans. Inf. Forensics Secur. 2016, 11, 1206–1213. [Google Scholar] [CrossRef]
- Chugh, T.; Cao, K.; Jain, A.K. Fingerprint Spoof Buster: Use of Minutiae-Centered Patches. IEEE Trans. Inf. Forensics Secur. 2018, 13, 2190–2202. [Google Scholar] [CrossRef]
- Howard, A.G.; Zhu, M.; Chen, B.; Kalenichenko, D.; Wang, W.; Weyand, T.; Andreetto, M.; Adam, H. MobileNets: Efficient Convolutional Neural Networks for Mobile Vision Applications. arXiv 2017, arXiv:1704.04861. [Google Scholar]
- Chugh, T.; Jain, A.K. Fingerprint Presentation Attack Detection: Generalization and Efficiency. In Proceedings of the 2019 International Conference on Biometrics, ICB 2019, Crete, Greece, 4–7 June 2019. [Google Scholar] [CrossRef] [Green Version]
- Uliyan, D.M.; Sadeghi, S.; Jalab, H.A. Anti-spoofing method for fingerprint recognition using patch based deep learning machine. Eng. Sci. Technol. Int. J. 2020, 23, 264–273. [Google Scholar] [CrossRef]
- Agarwal, S.; Rattani, A.; Chowdary, C.R. A comparative study on handcrafted features v/s deep features for open-set fingerprint liveness detection. Pattern Recognit. Lett. 2021, 147, 34–40. [Google Scholar] [CrossRef]
- Hefetz, I.; Einot, N.; Faerman, M.; Horowitz, M.; Almog, J. Touch DNA: The effect of the deposition pressure on the quality of latent fingermarks and STR profiles. Forensic Sci. Int. Genet. 2019, 38, 105–112. [Google Scholar] [CrossRef]
- Gu, S.; Feng, J.; Lu, J.; Zhou, J. Efficient Rectification of Distorted Fingerprints. IEEE Trans. Inf. Forensics Secur. 2018, 13, 156–169. [Google Scholar] [CrossRef]
- An, B.W.; Heo, S.; Ji, S.; Bien, F.; Park, J.U. Transparent and flexible fingerprint sensor array with multiplexed detection of tactile pressure and skin temperature. Nat. Commun. 2018, 9, 1–10. [Google Scholar] [CrossRef]
- Cappelli, R.; Maio, D.; Maltoni, D. Modelling Plastic Distortion in Fingerprint Images; Springer: Berlin/Heidelberg, Germany, 2001; pp. 371–378. [Google Scholar] [CrossRef]
- Antonelli, A.; Cappelli, R.; Maio, D.; Maltoni, D. Fake Finger Detection by Skin Distortion Analysis. IEEE Trans. Inf. Forensics Secur. 2006, 1, 360–373. [Google Scholar] [CrossRef] [Green Version]
- Zhang, Y.; Tian, J.; Chen, X.; Yang, X.; Shi, P. Fake Finger Detection Based on Thin-Plate Spline Distortion Model. In Advances in Biometrics; Springer: Berlin/Heidelberg, Germany, 2007; pp. 742–749. [Google Scholar] [CrossRef] [Green Version]
- Jia, J.; Cai, L.; Zhang, K.; Chen, D. A New Approach to Fake Finger Detection Based on Skin Elasticity Analysis. In Advances in Biometrics; Springer: Berlin/Heidelberg, Germany, 2007; pp. 309–318. [Google Scholar] [CrossRef] [Green Version]
- Solmaz, B.; Assari, S.M.; Shah, M. Classifying web videos using a global video descriptor. Mach. Vis. Appl. 2013, 24, 1473–1485. [Google Scholar] [CrossRef]
- Zhao, G.; Pietikäinen, M. Dynamic texture recognition using local binary patterns with an application to facial expressions. IEEE Trans. Pattern Anal. Mach. Intell. 2007, 29, 915–928. [Google Scholar] [CrossRef] [Green Version]
- Päivärinta, J.; Rahtu, E.; Heikkilä, J. Volume local phase quantization for blur-insensitive dynamic texture classification. In Lecture Notes in Computer Science (Including Subseries Lecture Notes in Artificial Intelligence and Lecture Notes in Bioinformatics); Springer: Berlin/Heidelberg, Germany, 2011; Volume 6688, pp. 360–369. [Google Scholar] [CrossRef] [Green Version]
- ISO/IEC 30107-3:2017—Information Technology—Biometric Presentation Attack Detection—Part 3: Testing and Reporting; ISO: Geneva, Switzerland, 2017.
Publisher’s Note: MDPI stays neutral with regard to jurisdictional claims in published maps and institutional affiliations. |
© 2021 by the authors. Licensee MDPI, Basel, Switzerland. This article is an open access article distributed under the terms and conditions of the Creative Commons Attribution (CC BY) license (https://creativecommons.org/licenses/by/4.0/).