
A Subjective and Behavioral Assessment of Affordances in Virtual Architectural Walkthroughs


Abstract
:1. Introduction
2. Background
2.1. Plausibility in Virtual Environments
2.2. Affordances and Perceived Quality in Virtual Environments
- Manipulation Affordances: The directly perceived affordances that speak to the physical/sensorial compatibility between the user and the object.
- Effect Affordance: It describes the functioning of the object due to manipulation. It is also directly perceived based on cause-and-effect knowledge of the user.
- Use Affordance: It relates to the physical and mental skills of the user utilizing the right cognitive or usage plans.
- Experience Affordances: They are related to the psychological and biological needs of the user and are perceived only with correct knowledge and usage modes.
2.3. Measuring User Behavior and Experience
3. Materials and Methods
- Passive-walkthrough (PW), an immersive environment with navigation affordances but no interactive features;
- Interactive-walkthrough (IW), an immersive-interactive environment with navigation affordances and a few manipulation and effect affordances.
manipulation and effect affordances in the immersive-interactive (IW) scenario would result in higher perceived experiential quality and higher behavioral activity compared to the non-interactive scenario (PW).
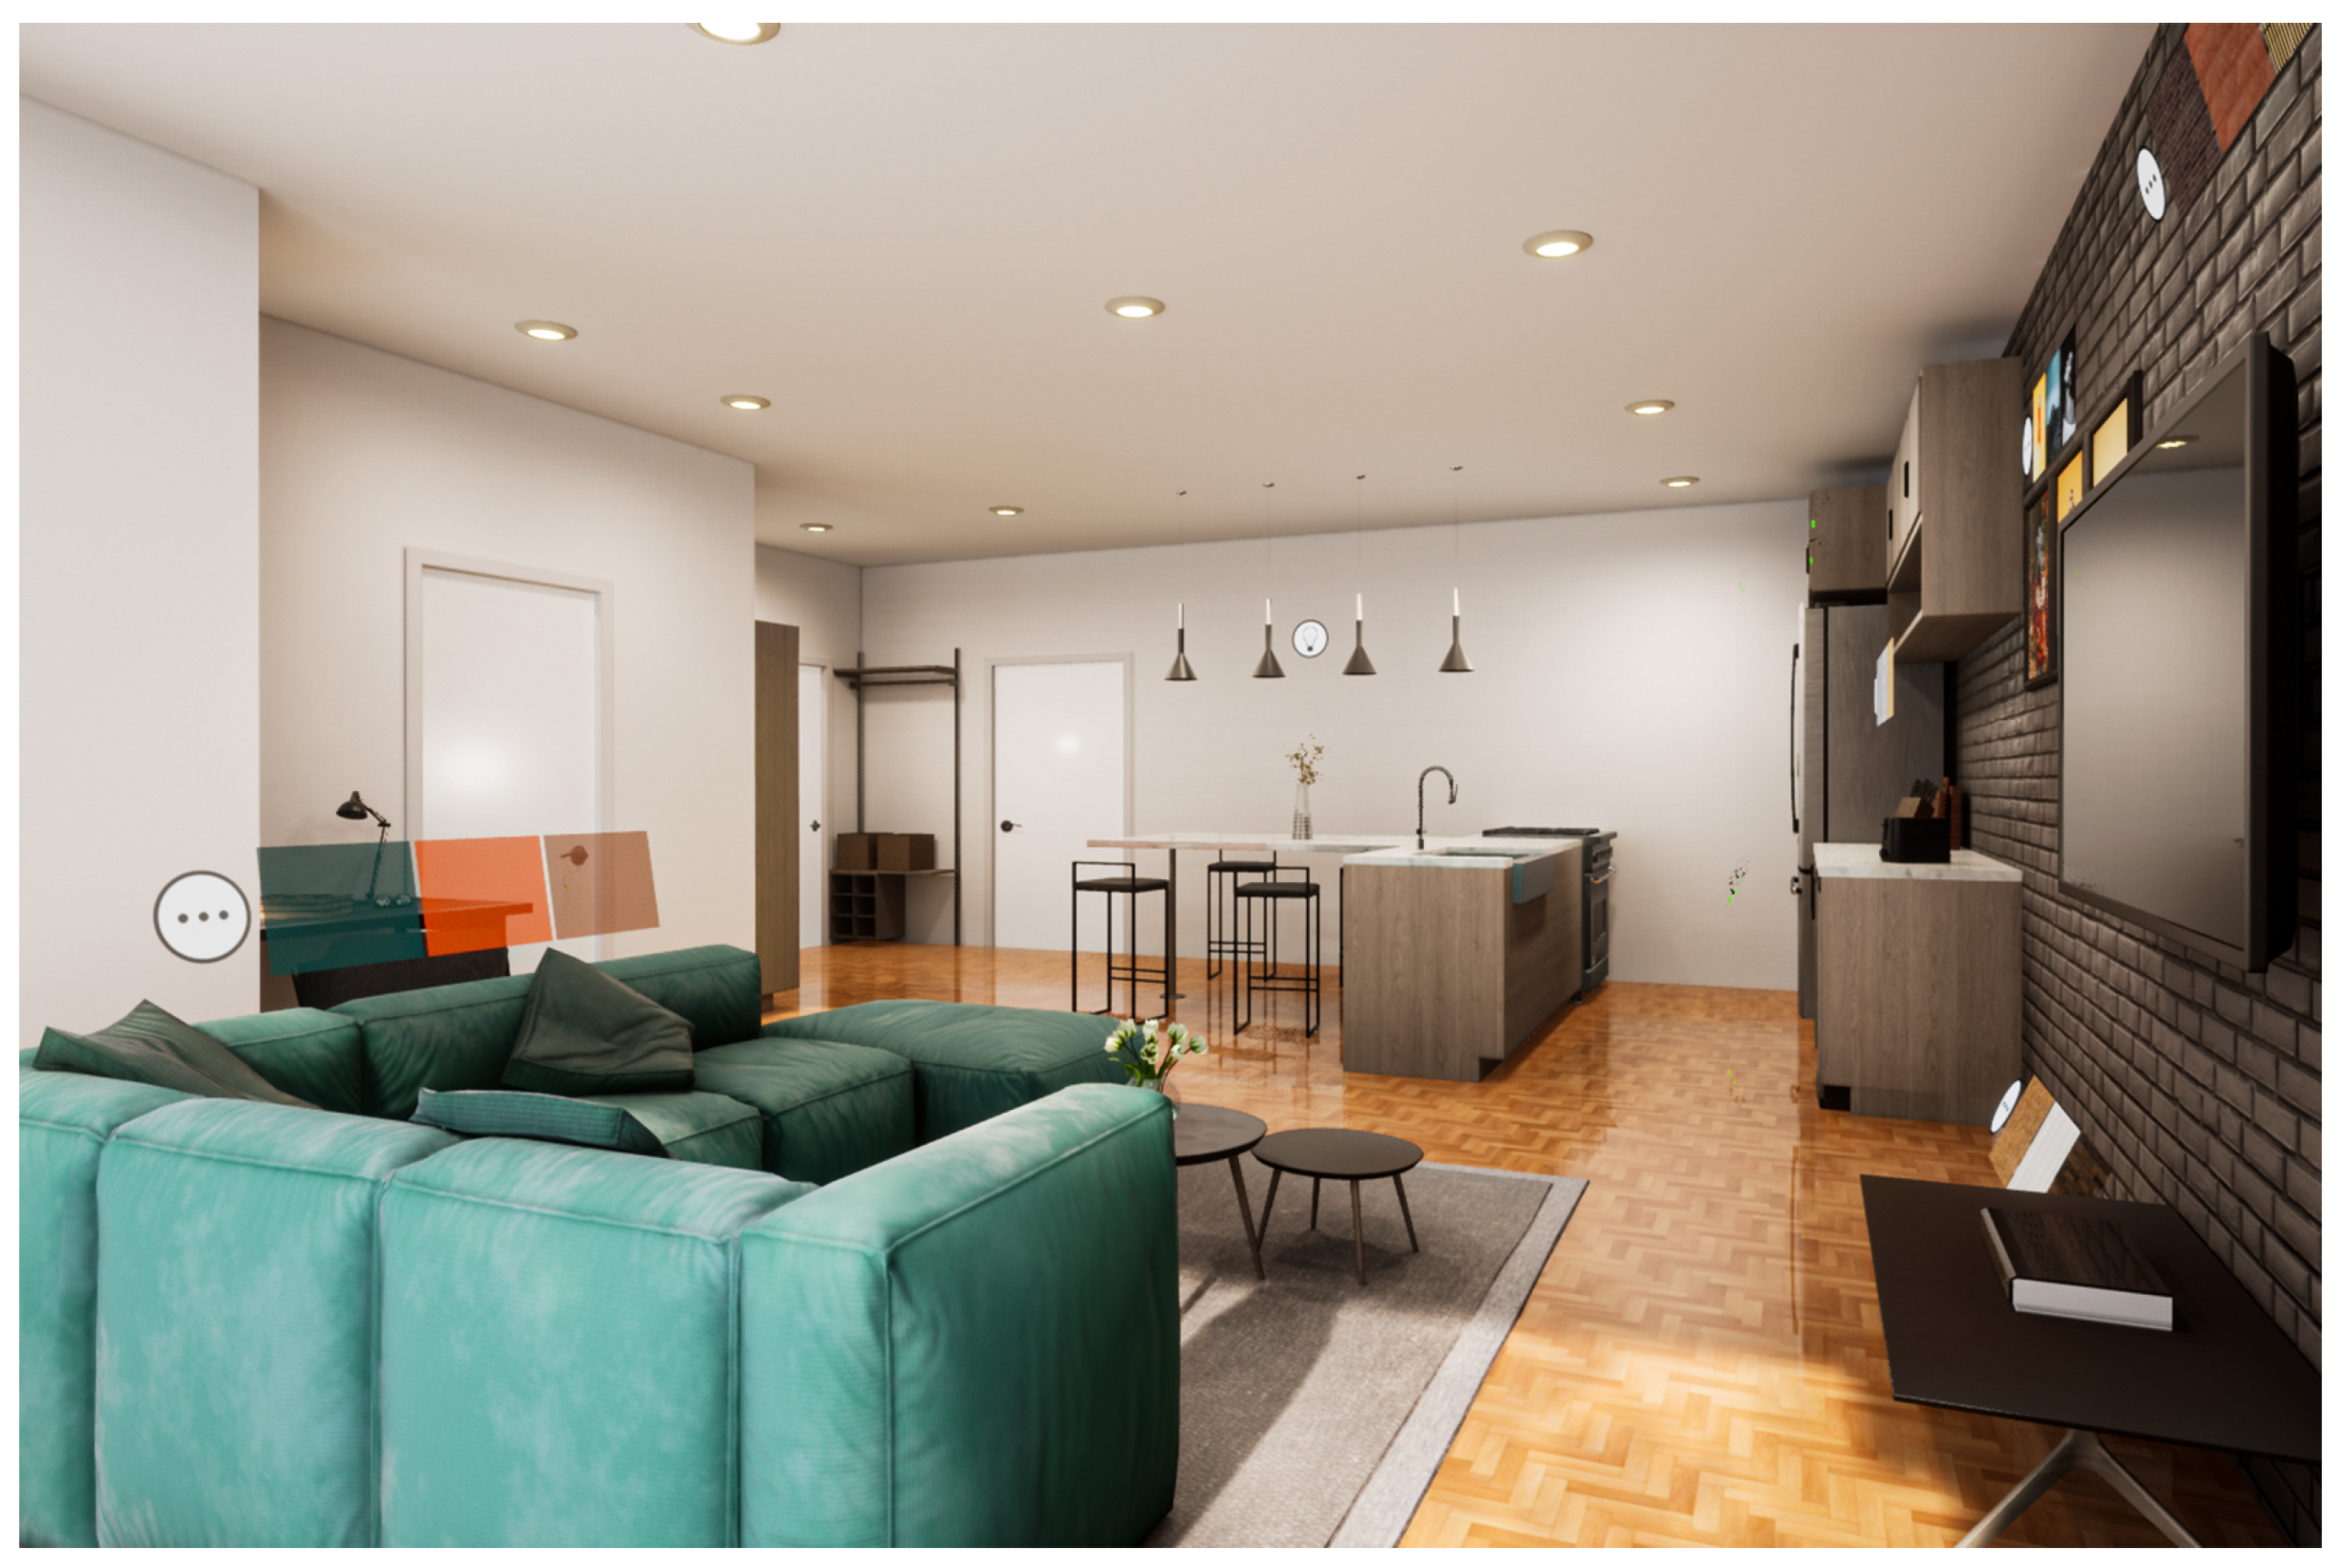
3.1. Environment
- Passive Walkthrough (PW): This model uses high-poly assets from the UE Marketplace, and high-resolution images from an online repository. The model was prepared using datasmith in Unreal Engine 4. In order to simulate real-world materials, we used PBR-texturing (physically based rendering), realistic lighting and a spatial soundscape to enhance the immersive experience. The environment was optimized for used with HTC Vive Pro. Both handheld controllers can be used to exploit the navigation affordance of point-and-teleport. Additionally, hidden affordances in the form of collider components were also applied to surfaces in the model. They were activated to discourage teleportation or natural/free walking through surfaces (such as walls) to avoid unrealistic perforation effects of virtual surfaces.All doors in this environment were open by default to allow users free movement through the interior space.
- Interactive Walkthrough (IW): This model has all the features from the PW. In addition, the IW scenario also uses additional manipulation and effect affordances. While one handheld controller was used for point-and-teleport, the second was used for the interactivity features that include:
- Two light toggles around the average eye-level: A familiar design feature, a button (with a light-bulb icon) provided the required cognitive affordance and the opportunity for manipulation using the handheld controller. A laser pointer (similarly to real-life pointers) could be directed at the button to toggle on–off. The explicit manipulation affordance was immediately satisfied with the effect affordance, as the user should notice their actions resulting in additional scene lighting.
- Six operable doors around the average waist height: Interaction with doors was communicated via metaphorical affordance, i.e., the imitation of real-life door handles. The familiar and explicit affordance of hold-and-twist was, however, not present; instead, their manipulation was possible through a hidden affordance activated when a user clicked the handheld controller closer to the handle. The effect and pattern affordances were revealed to the user through successive movements resulting in learning how to open a virtual door.
- Six cabinets and drawers at various heights: Different height levels were used to assess the naturalness of the user’s behavioral response. The cabinets used the same manipulation and effect affordances as the doors.
All doors in this scenario were closed by default so that users had to open them using the handheld controllers in order to access different spaces.
3.2. Participants
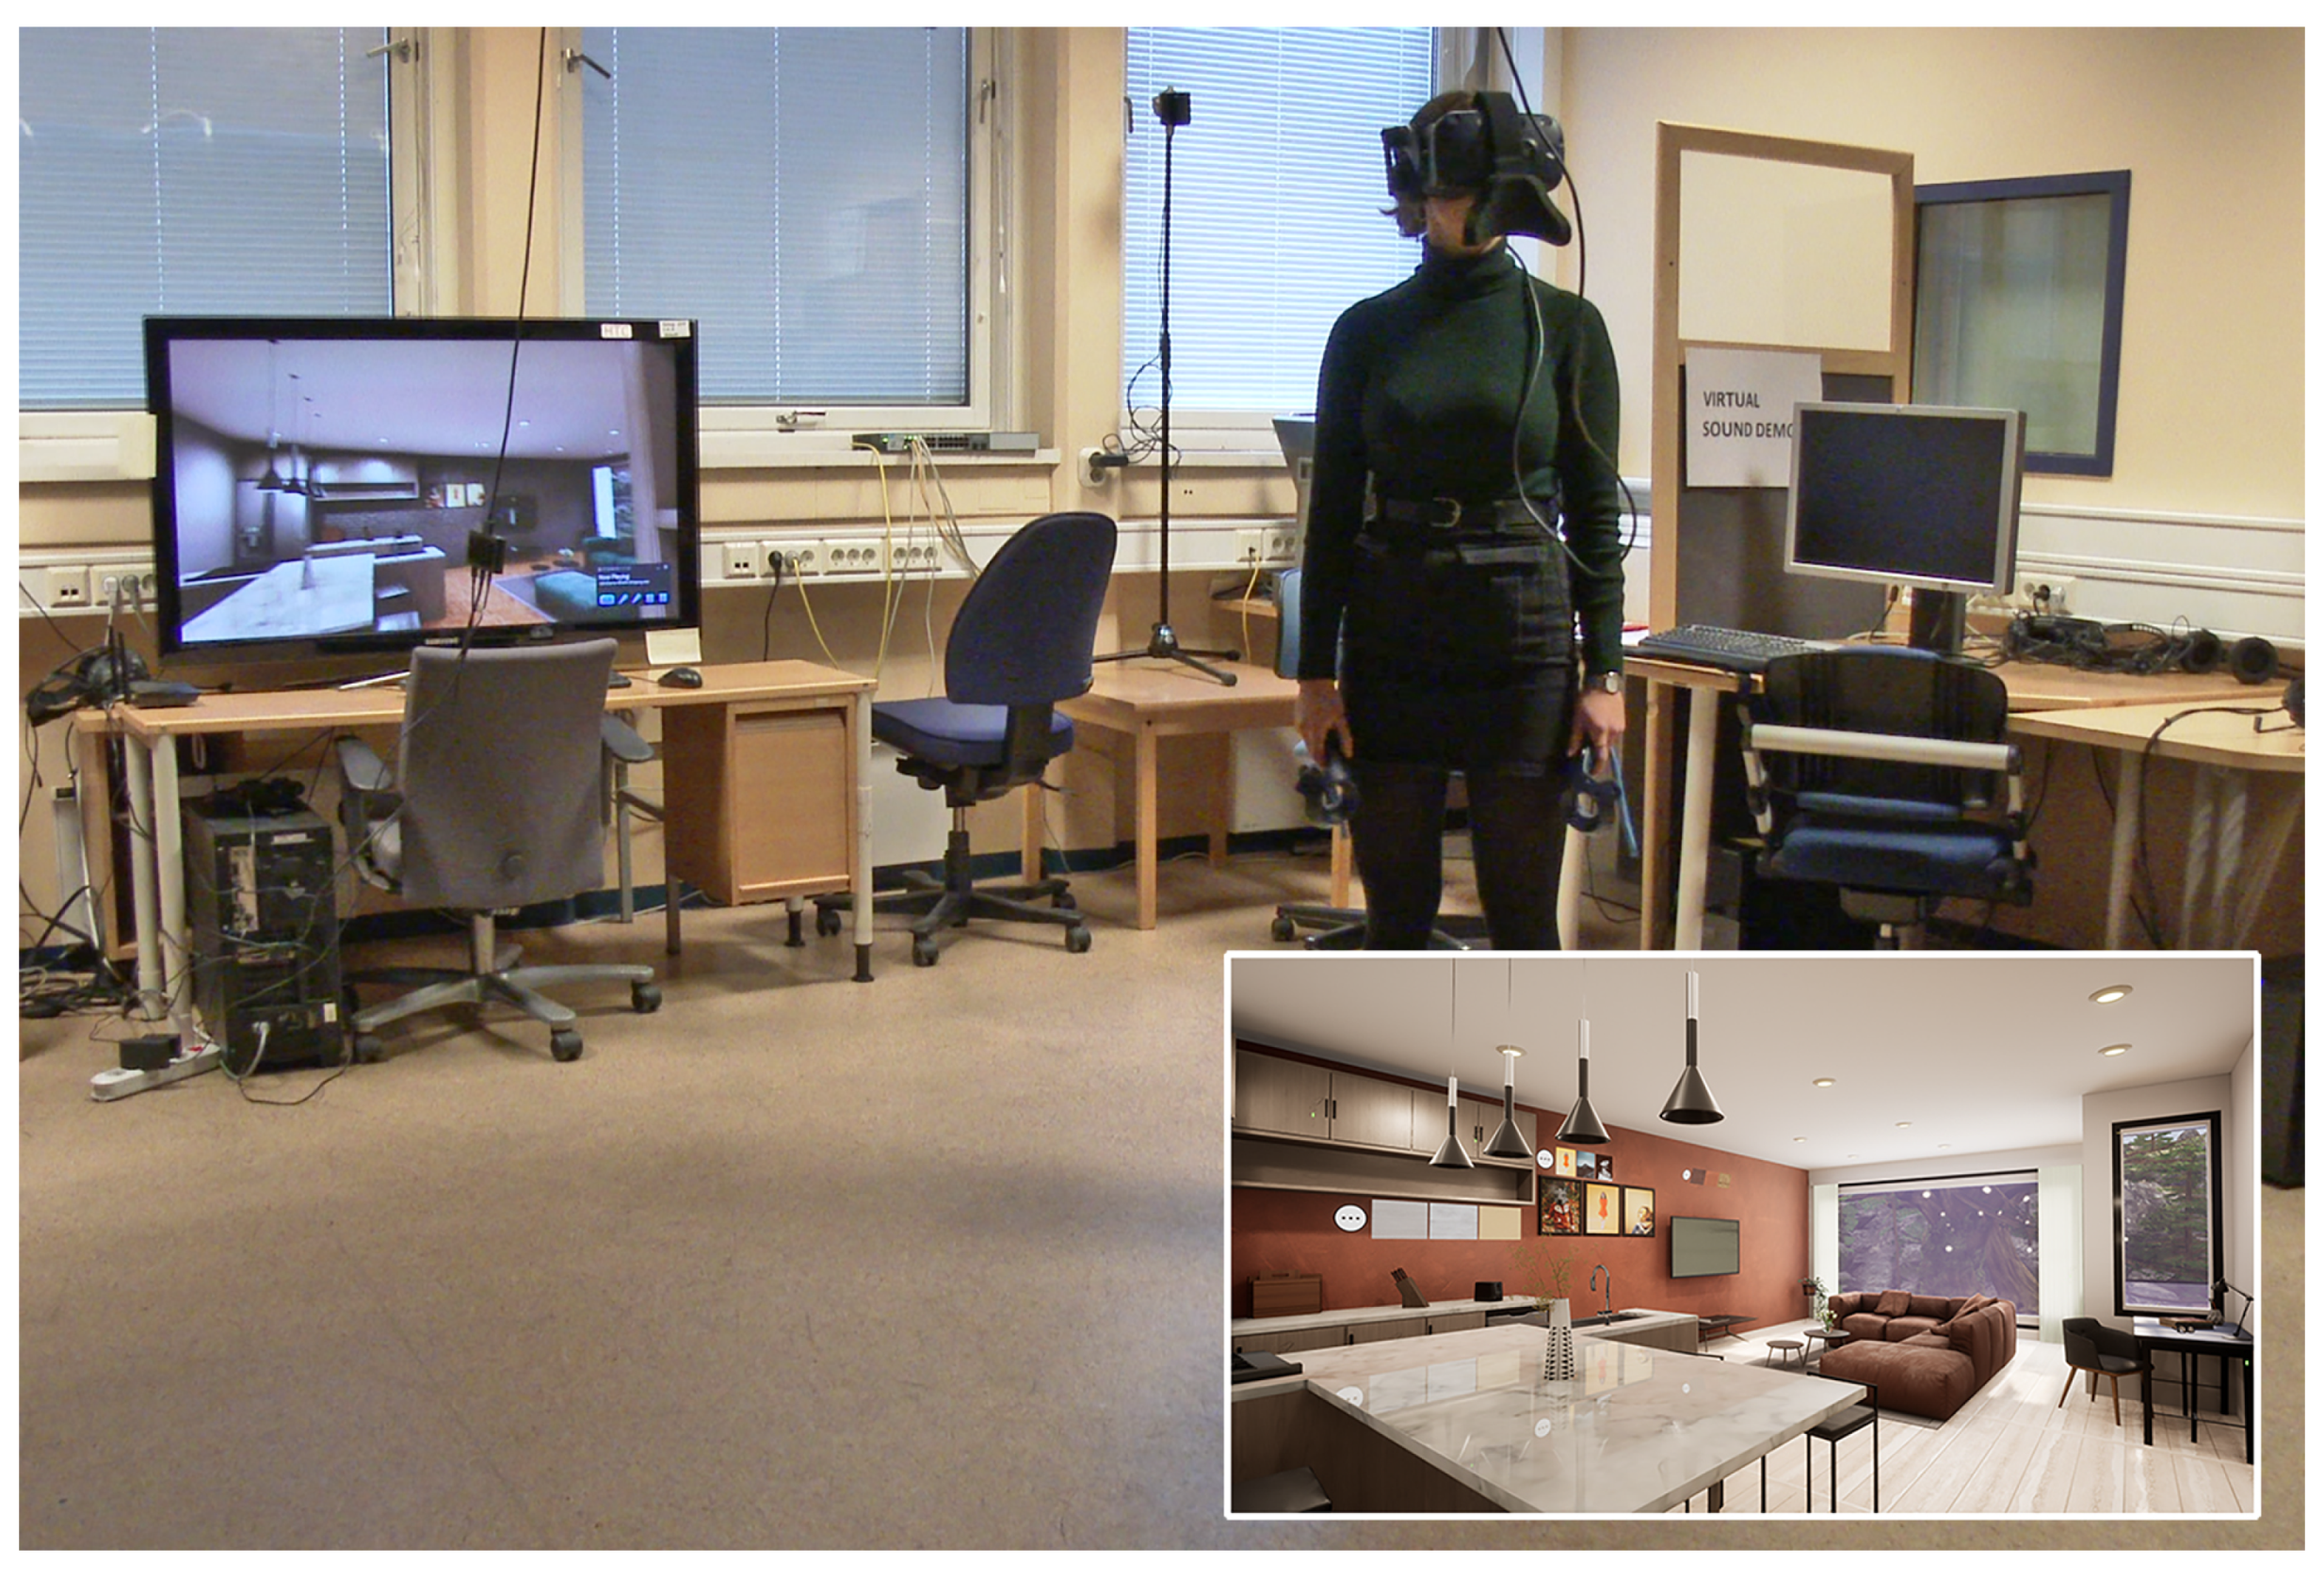
3.3. Setup
3.3.1. Laboratory and Equipment:
3.3.2. Procedure
3.4. Instruments
3.4.1. Subjective Measure
- Spatial presence (SP)—a sense of being there and/or encapsulated by a space.
- Engagement (EN)—feeling psychologically involved in, feeling moved by and/or enjoying the content.
- Ecological validity, or naturalness (NV)—perceiving the mediated environment as lifelike and/or natural.
- Negative effects (NE)—an adverse psychological reaction towards the mediated environment.
3.4.2. Behavioral Observations
- State Events: durational events that have beginnings and ends.
- Still: The subject remains stationary in one position in the physical space. They might sway, bend or rotate while on the same point without an intentional step.
- Stride: The subject moves intentionally in a forward or backward direction from their stationary position. This can be one complete stride or more.
- Sit: The subject assumes a sitting position.
- Point Events: non-durational events that are generally momentary only.
- Click or Point: The subject clicks the controller in space either close to the body or away from it.
- Turn: The subject rotates 90-degrees to 180-degrees about an axis either in a stationary position or during movement.
- Bend: The subject bends forwards or backwards.
- Extend: The subject extends their limbs or part of their body outward to touch, kick or peek at objects inside the virtual environment.
- Shrink: The subject draws their limbs or part of their body inwards as a gesture of cautiousness or alertness inside the virtual environment.
4. Results
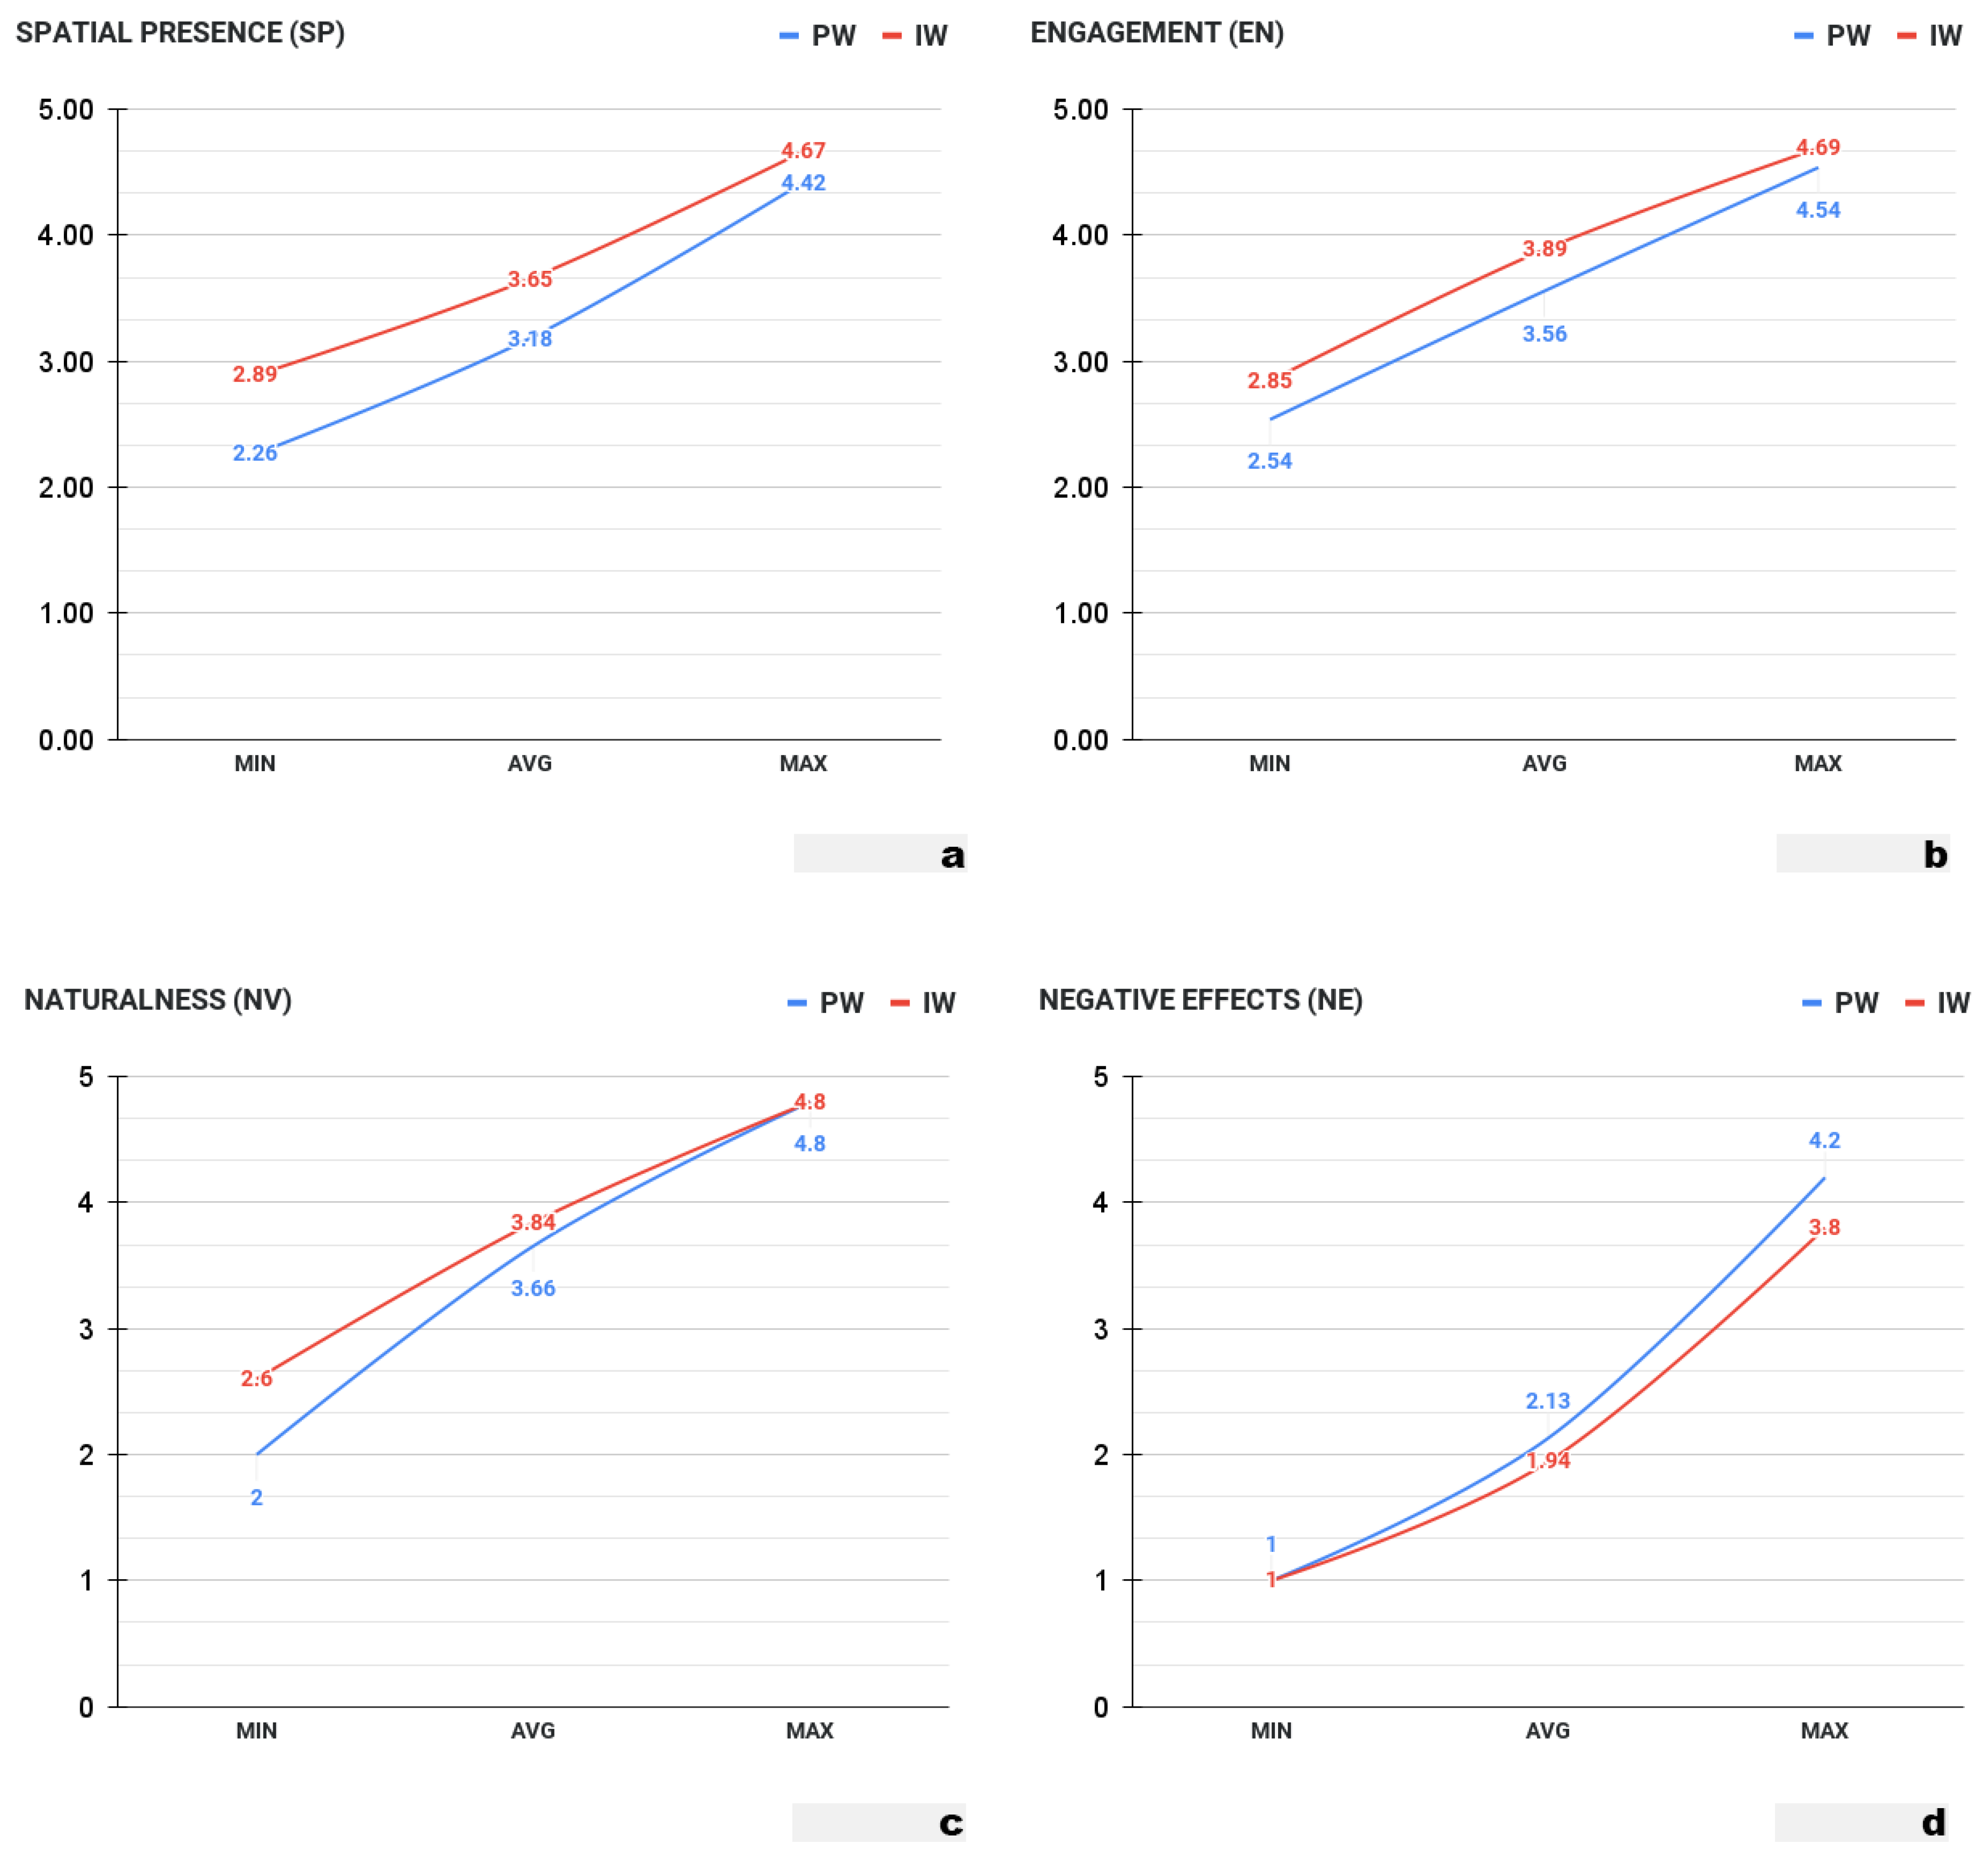
4.1. From ITC-SOPI
- Spatial presence (SP: F(1, 62) = 43.50, p = 0.001, = 0.166.
- Engagement (EN): F(1, 62) = 26.00, p = 0.017, = 0.089.
- Naturalness (NV): F(1, 62) = 133.0, p = 0.279, = 0.019.
- Negative Effects (NE): F(1, 62) = 75.40, p = 0.383, = 0.012.
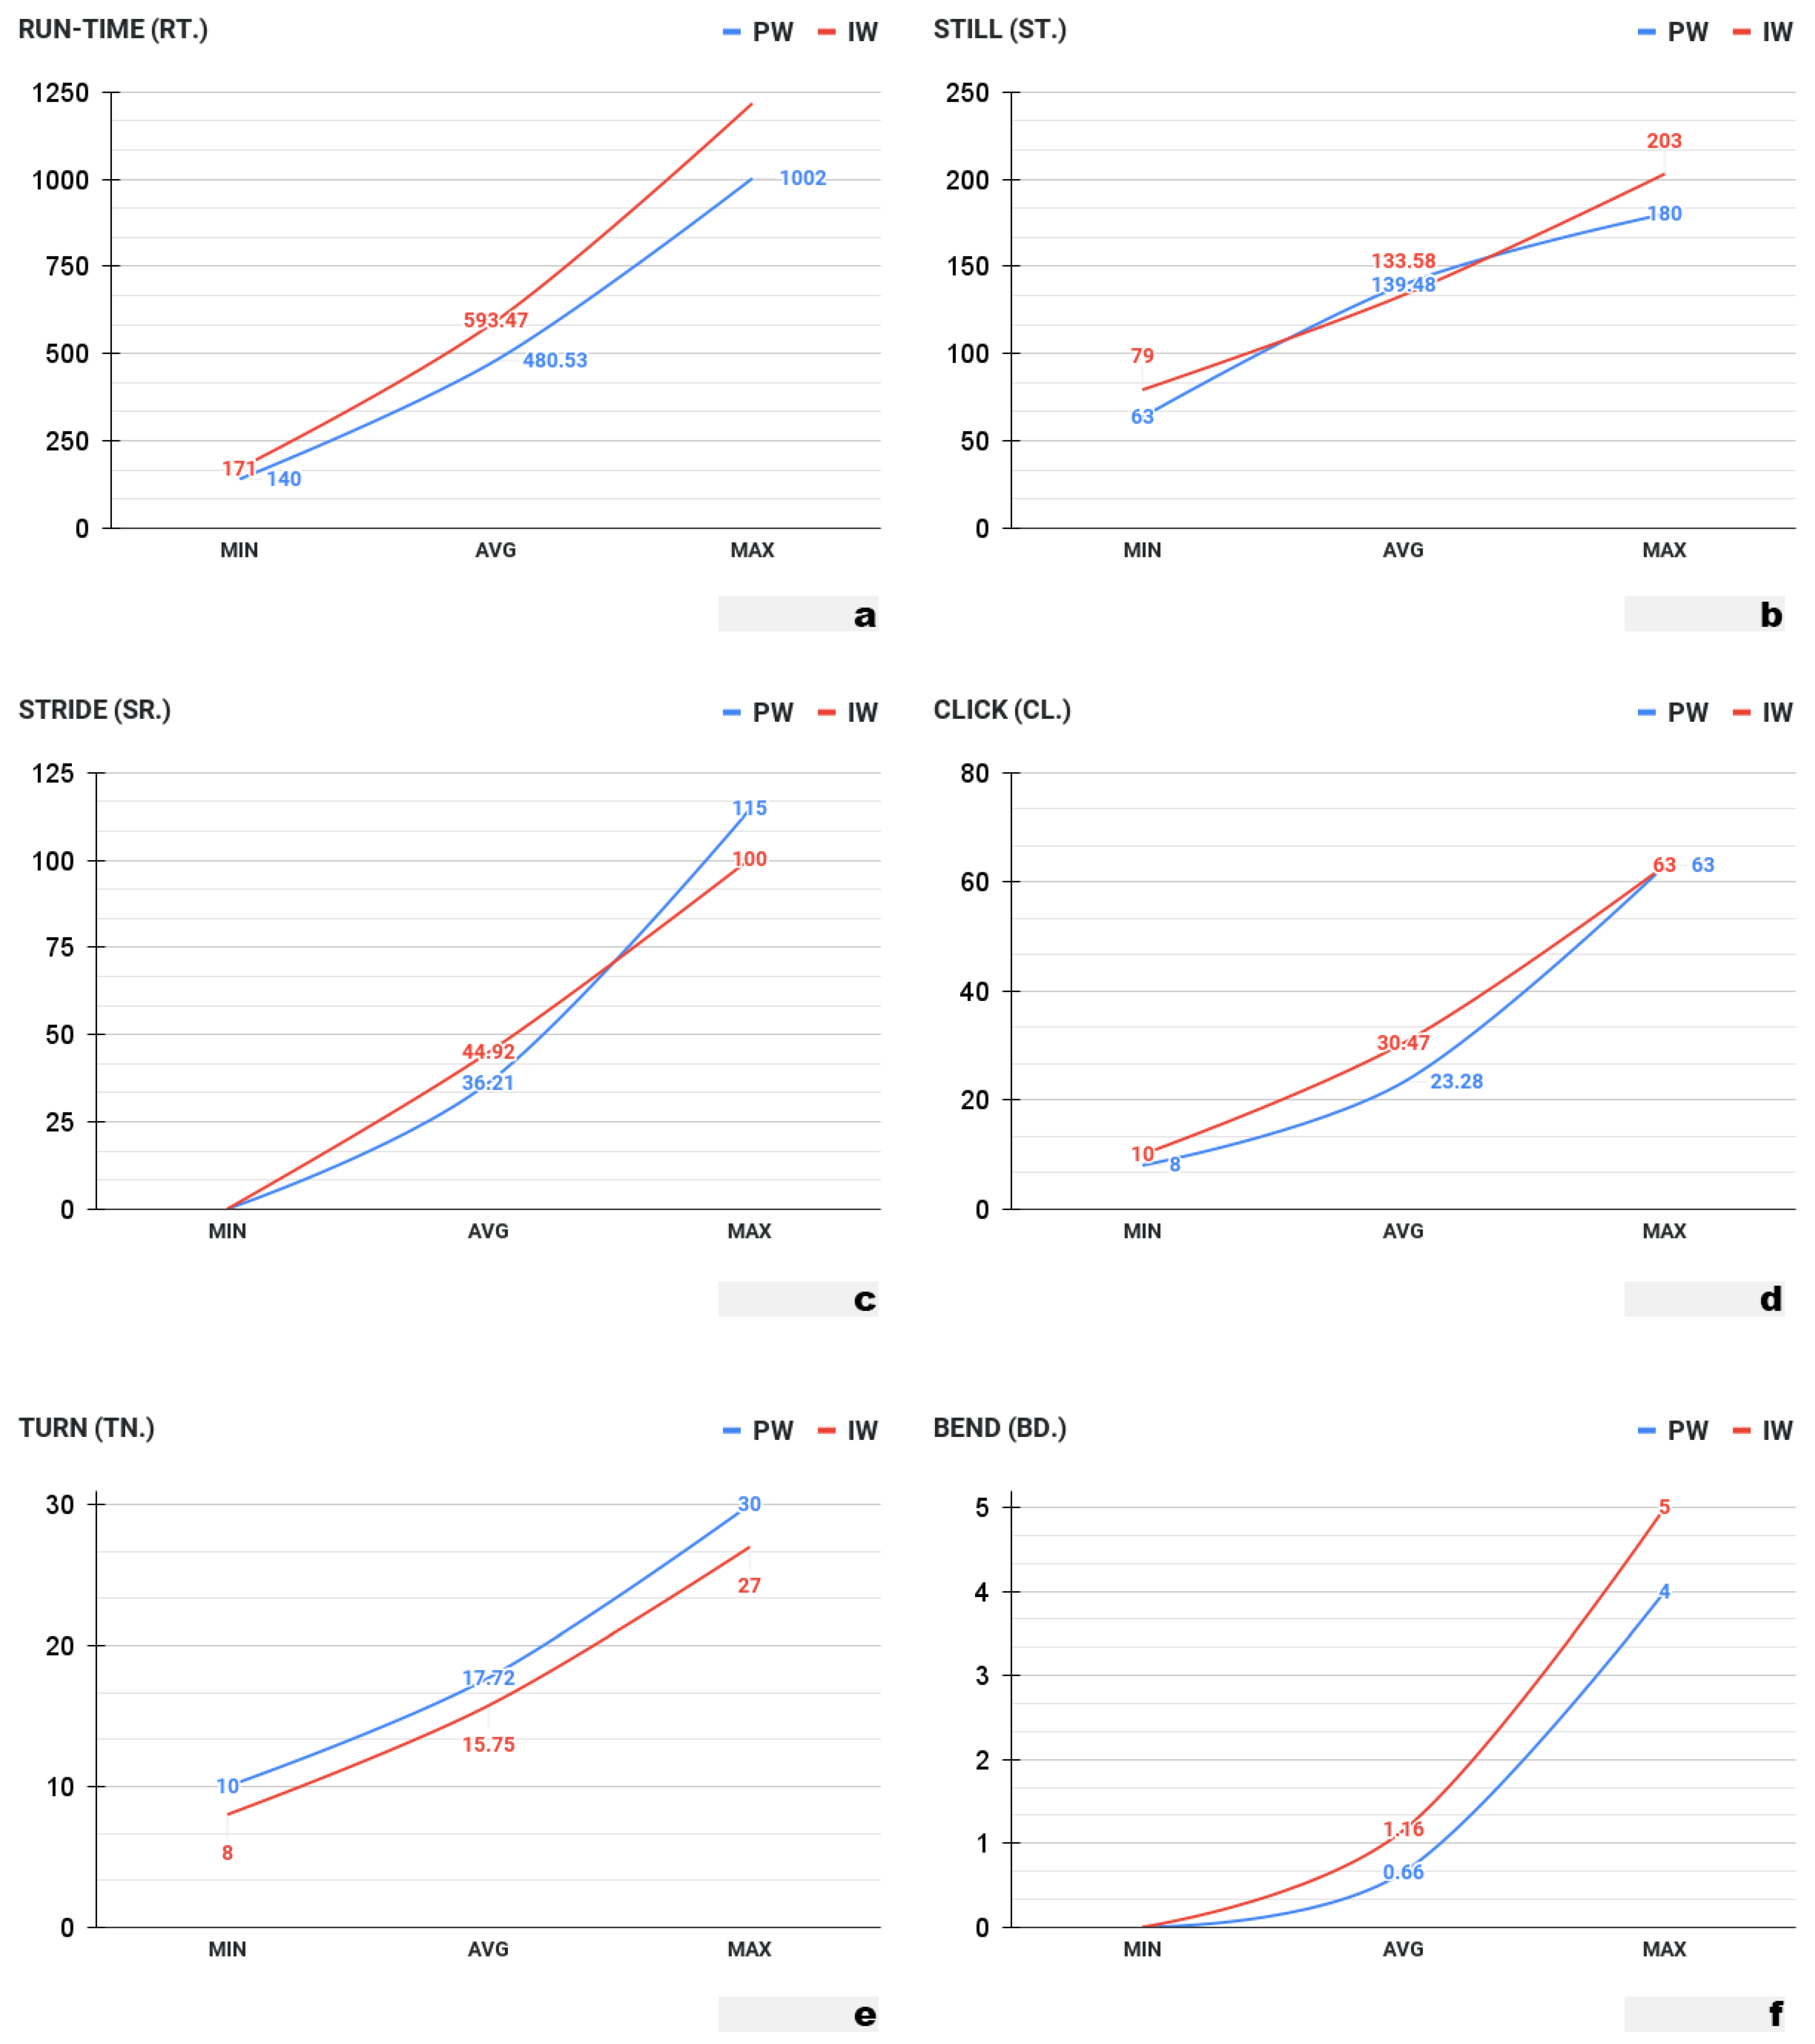
4.2. From the Time-Log and Observations
- Run-Time: F(1, 62) = 3.71, p = 0.06, = 0.056
- Stride State: F(1, 62) = 1.70, p = 0.19, = 0.027
- Still State: F(1, 62) = 0.61, p = 0.44, = 0.01
- Turn Event: F(1, 62) = 2.21, p = 0.14, = 0.034
- Bend Event: F(1, 62) = 2.0, p = 0.16, = 0.031
- Click Event: F(1, 62) = 4.77, p = 0.033, = 0.071
5. Discussion
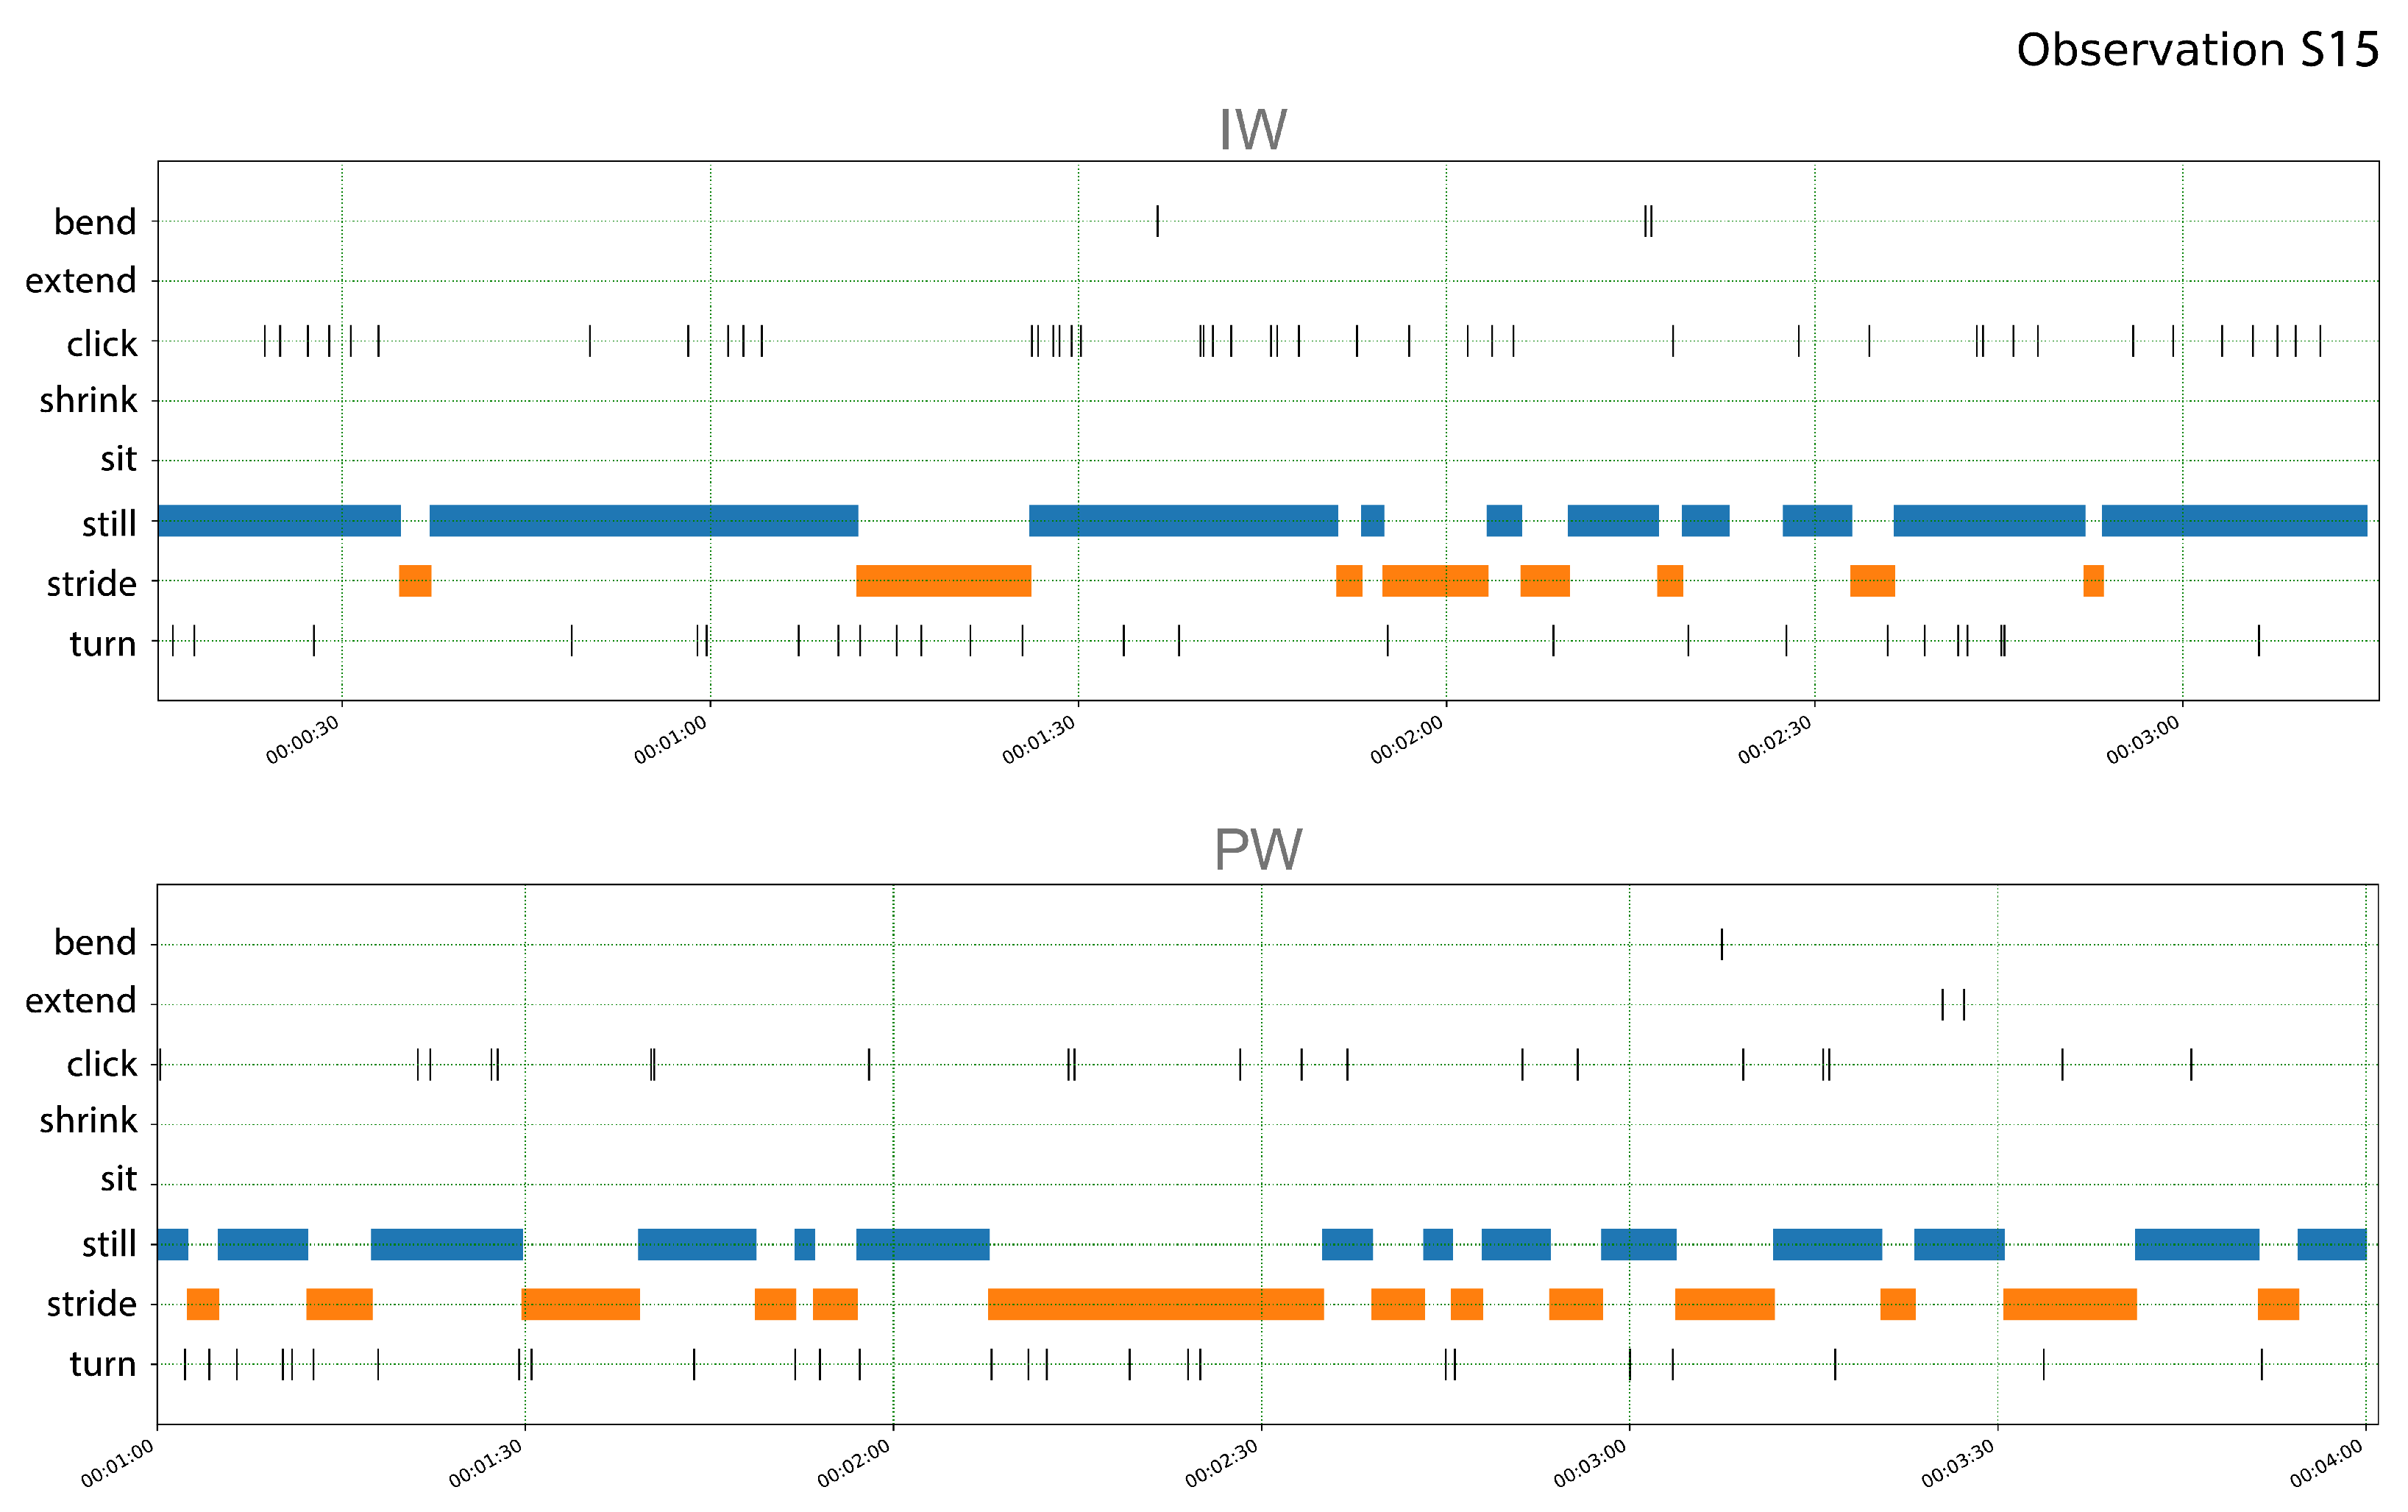
5.1. Subject S15
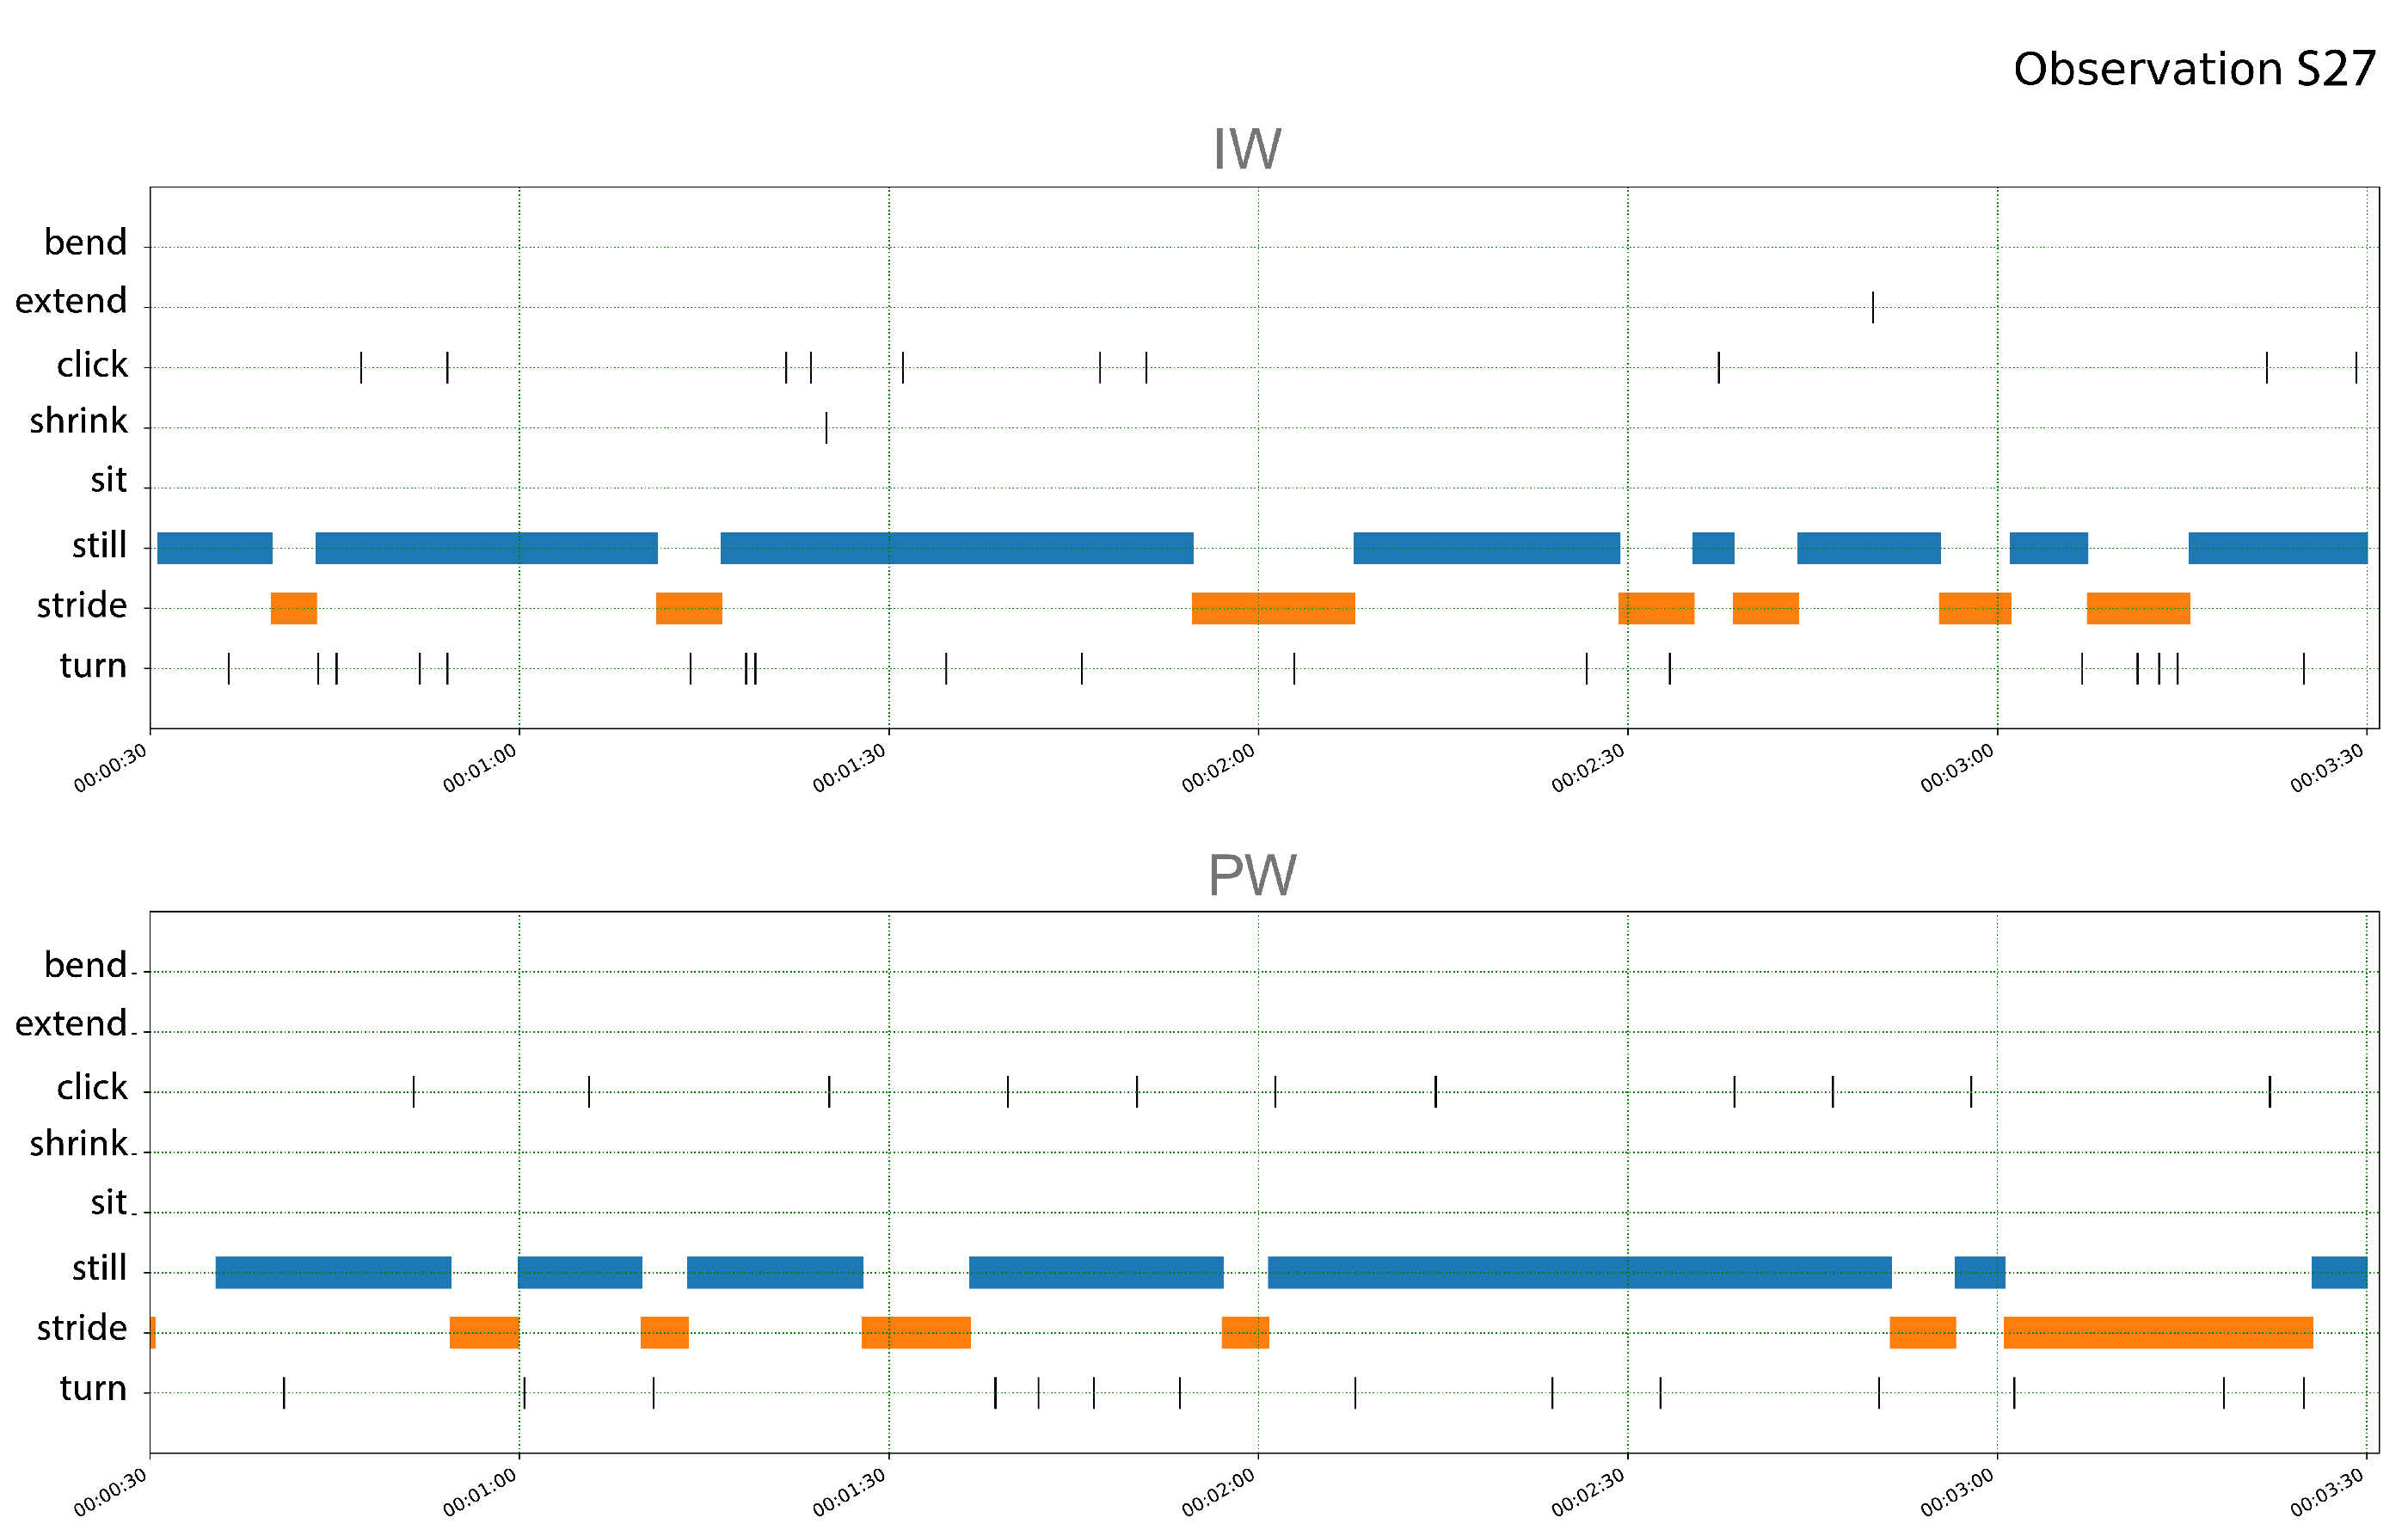
5.2. Subject S27
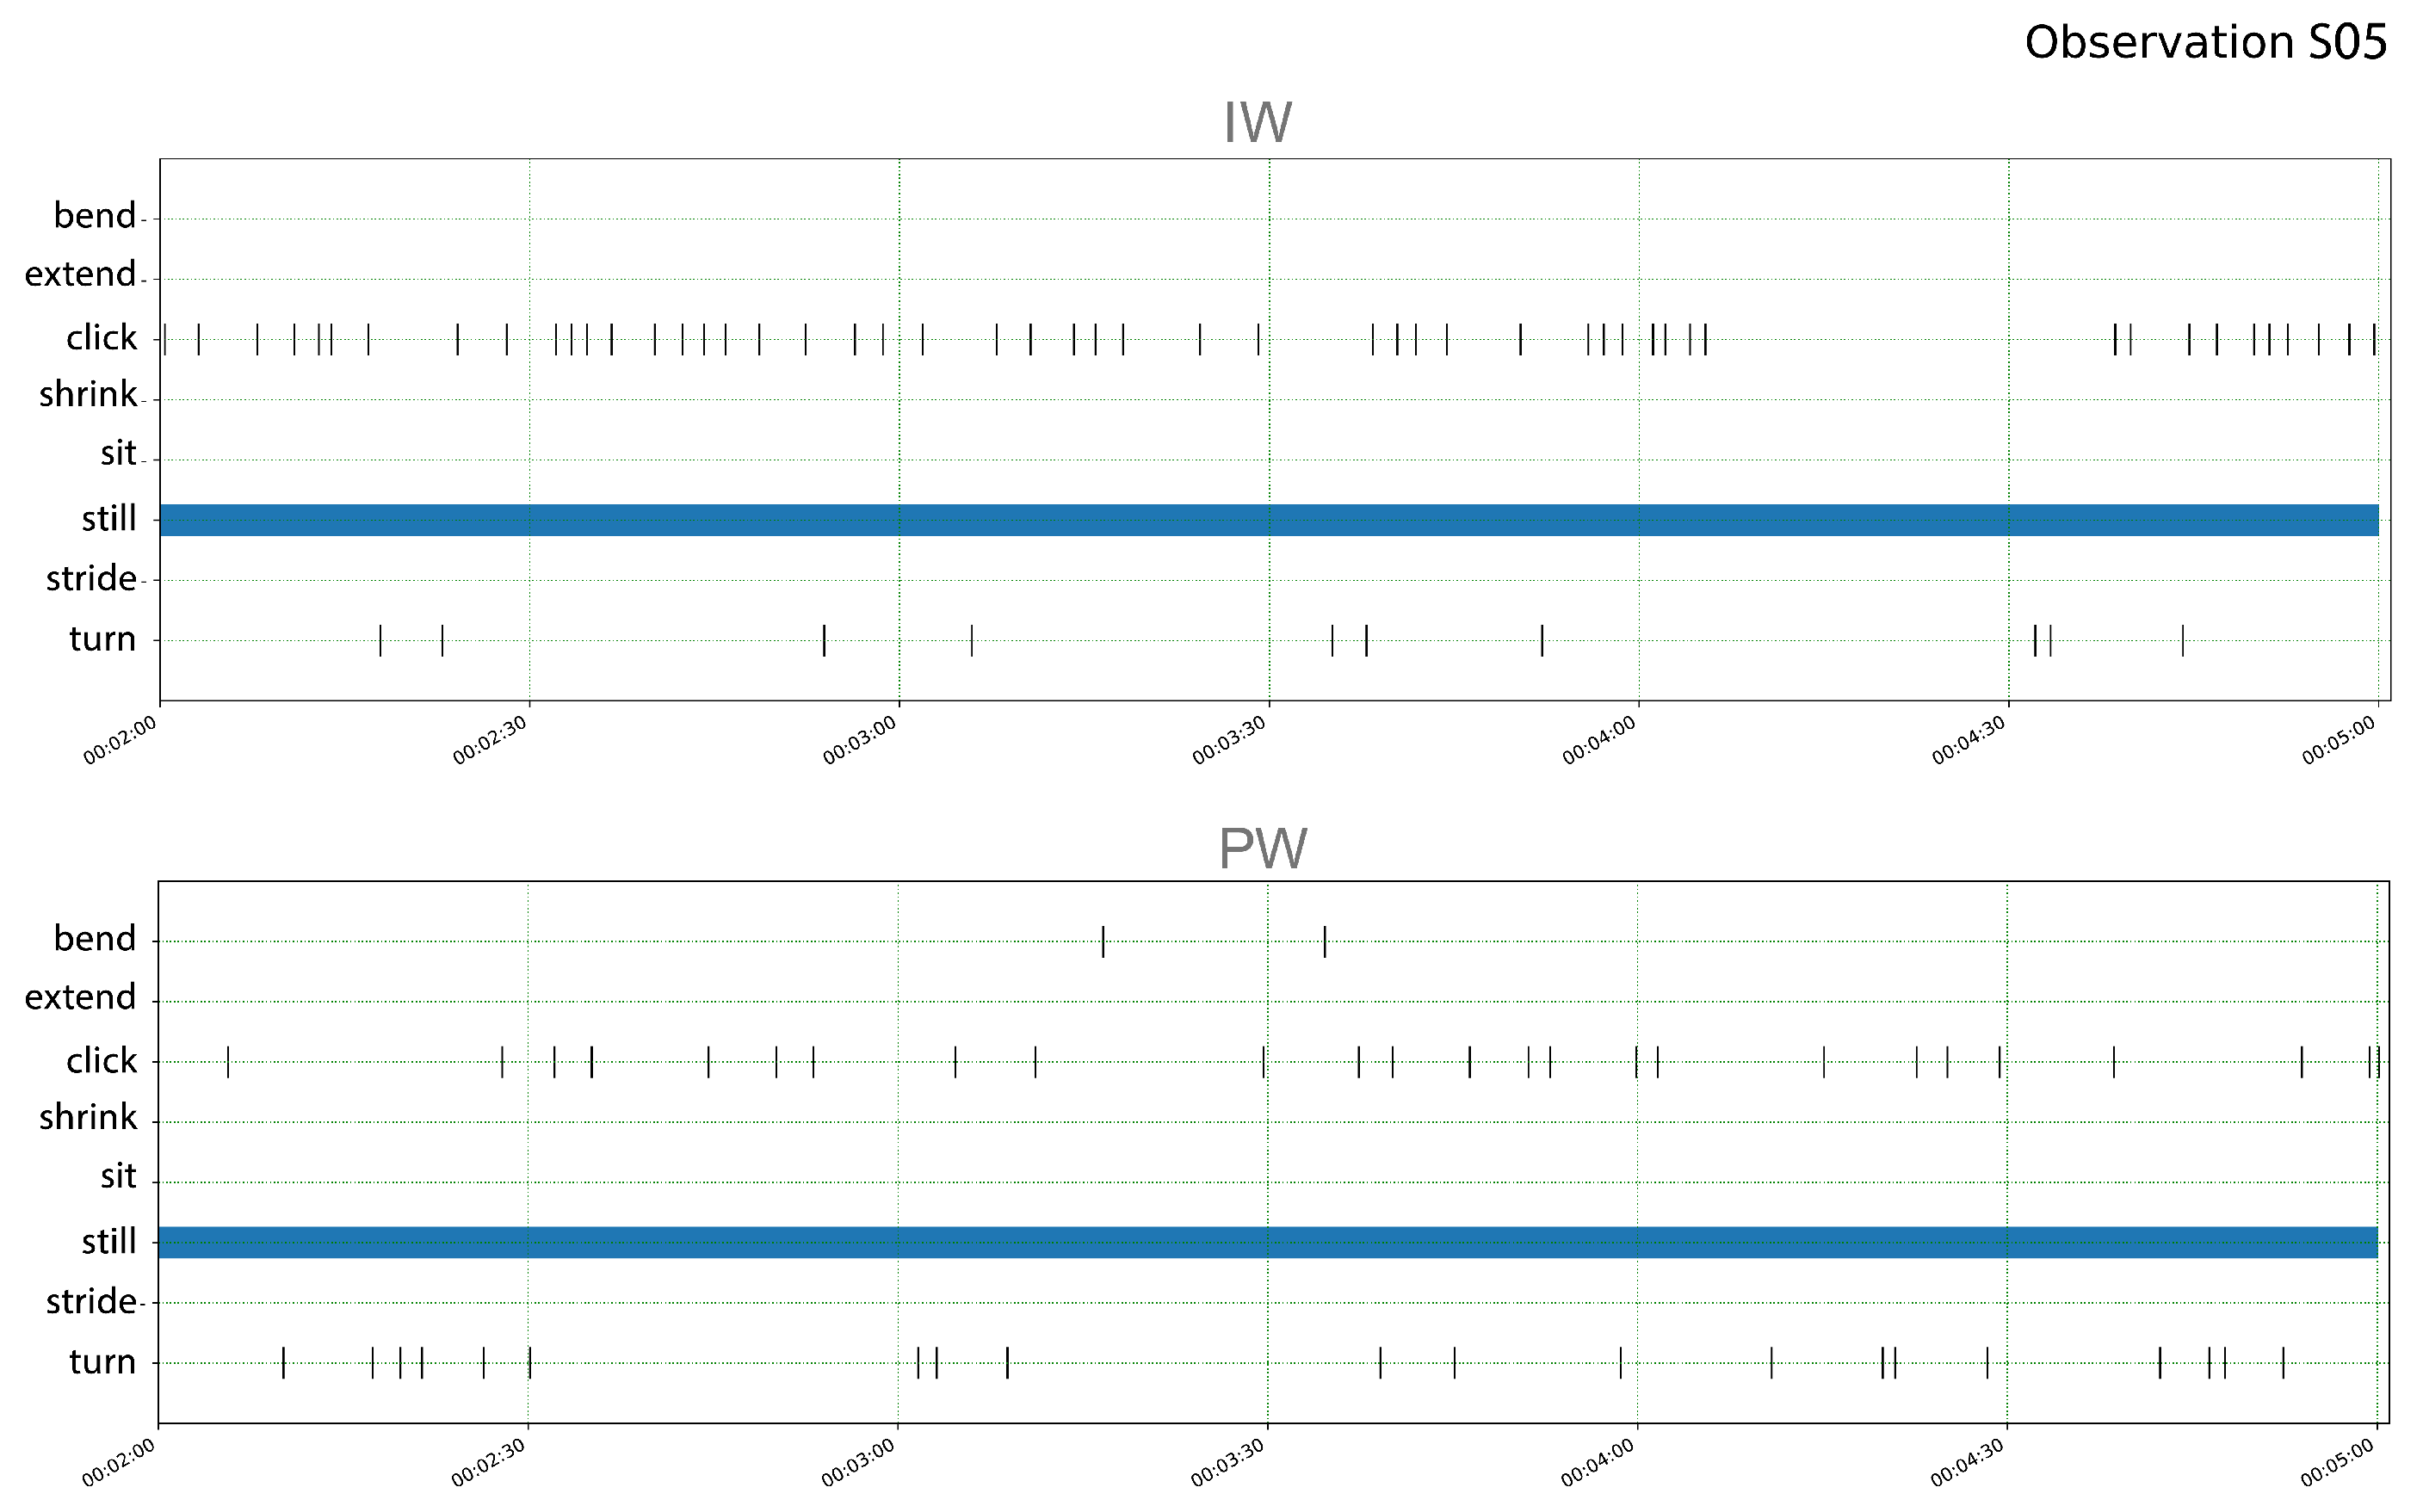
5.3. Subject S05
6. Conclusions
- The representationalism (metaphorical affordance) of virtual environments in its imitation of real-life objects creates expectations that can not be physically met, e.g., the door handle.
- Affordance mismatches resulted in the users appropriating the ready-at-hand tool (i.e., the handheld controller) in a manner most familiar to them.
- While VR creates an illusion of real-life behavior with objects, users did not use spatial literacy; instead, they felt more comfortable relying on familiar digital literacies (like the pointing and clicking of a mouse).
- Metaphorical affordances can be useful when the emphasis is on physical exploration, and one-on-one imitation of a function may not be preferred—e.g., when designing immersive-interactive architectural or exhibition tours.
- Explicit affordances will help when a realistic one-on-one imitation of a function is required in VEs—design prototyping support, test fixture solutions, etc.
Author Contributions
Funding
Institutional Review Board Statement
Informed Consent Statement
Data Availability Statement
Conflicts of Interest
References
- Burdea, G.C.; Coiffet, P. Virtual Reality Technology; MIT Press: Cambridge, MA, USA, 2003; pp. 663–664. [Google Scholar] [CrossRef]
- Slater, M. Immersion and the illusion of presence in virtual reality. Br. J. Psychol. 2018, 109, 431–433. [Google Scholar] [CrossRef] [PubMed]
- Cross, N. Designerly ways of knowing: Design discipline versus design science. Des. Issues 2001, 17, 49–55. [Google Scholar] [CrossRef] [Green Version]
- Skarbez, R.; Brooks, F.P., Jr.; Whitton, M.C. A survey of presence and related concepts. ACM Comput. Surv. (CSUR) 2017, 50, 1–39. [Google Scholar] [CrossRef]
- Insko, B.E. Measuring Presence: Subjective, Behavioral and Physiological Methods. In Being There: Concepts, Effects and Measurements of User Presence in Synthetic Environments; IOS Press: Amsterdam, The Netherlands, 2003; pp. 109–119. [Google Scholar]
- Schuemie, M.J.; Van Der Straaten, P.; Krijn, M.; Van Der Mast, C.A. Research on presence in virtual reality: A survey. CyberPsychol. Behav. 2001, 4, 183–201. [Google Scholar] [CrossRef] [PubMed]
- Witmer, B.G.; Singer, M.J. Measuring presence in virtual environments: A presence questionnaire. Presence 1998, 7, 225–240. [Google Scholar] [CrossRef]
- Nilsson, N.C.; Nordahl, R.; Serafin, S. Immersion Revisited: A review of existing definitions of immersion and their relation to different theories of presence. Hum. Technol. 2016, 12, 108–134. [Google Scholar] [CrossRef] [Green Version]
- McRoberts, J. Are we there yet? Media content and sense of presence in non-fiction virtual reality. Stud. Doc. Film. 2018, 12, 101–118. [Google Scholar] [CrossRef]
- Biocca, F. The evolution of interactive media. Narrat. Impact. Soc. Cogn. Found. 2003, 97–130. [Google Scholar] [CrossRef]
- Lee, K.M. Presence, explicated. Commun. Theory 2004, 14, 27–50. [Google Scholar] [CrossRef]
- Hameed, A.; Perkis, A. Spatial storytelling: Finding interdisciplinary immersion. In Proceedings of the International Conference on Interactive Digital Storytelling; Springer: Berlin/Heidelberg, Germany, 2018; pp. 323–332. [Google Scholar]
- Hameed, A.; Irshad, S.; Perkis, A. Towards a Quality Framework for Immersive Media Experiences: A Holistic Approach. In Proceedings of the International Conference on Interactive Digital Storytelling; Springer: Berlin/Heidelberg, Germany, 2019; pp. 389–394. [Google Scholar]
- Baños, R.M.; Botella, C.; Alcañiz, M.; Liaño, V.; Guerrero, B.; Rey, B. Immersion and emotion: Their impact on the sense of presence. Cyberpsychol. Behav. 2004, 7, 734–741. [Google Scholar] [CrossRef]
- Schubert, T.W. The sense of presence in virtual environments: A three-component scale measuring spatial presence, involvement, and realness. Z. Medien. 2003, 15, 69–71. [Google Scholar] [CrossRef]
- Dorta, T.; Lesage, A.; Pérez, E.; Bastien, J.C. Signs of collaborative ideation and the hybrid ideation space. In Design Creativity 2010; Springer: Berlin/Heidelberg, Germany, 2011; pp. 199–206. [Google Scholar]
- Gu, N.; Kim, M.J.; Maher, M.L. Technological advancements in synchronous collaboration: The effect of 3D virtual worlds and tangible user interfaces on architectural design. Autom. Constr. 2011, 20, 270–278. [Google Scholar] [CrossRef]
- Yan, W.; Culp, C.; Graf, R. Integrating BIM and gaming for real-time interactive architectural visualization. Autom. Constr. 2011, 20, 446–458. [Google Scholar] [CrossRef]
- Carassa, A.; Morganti, F.; Tirassa, M. A situated cognition perspective on presence. In Proceedings of the Annual Meeting of the Cognitive Science Society, Stresa, Italy, 21–23 July 2005; Volume 27. Available online: https://escholarship.org/uc/item/7sm3n3bj (accessed on 17 June 2021).
- Steuer, J. Defining virtual reality: Dimensions determining telepresence. J. Commun. 1992, 42, 73–93. [Google Scholar] [CrossRef]
- Hofer, M.; Hartmann, T.; Eden, A.; Ratan, R.; Hahn, L. The role of plausibility in the experience of spatial presence in virtual environments. Front. Virtual Real. 2020, 1, 2. [Google Scholar] [CrossRef]
- Skarbez, R. Plausibility Illusion in Virtual Environments. Front. UNC-Chapel Hill Libraries Catalog. 2016. Available online: https://catalog.lib.unc.edu/catalog/UNCETDv118rf14z (accessed on 17 June 2021).
- Skarbez, R.; Neyret, S.; Brooks, F.P.; Slater, M.; Whitton, M.C. A psychophysical experiment regarding components of the plausibility illusion. IEEE Trans. Vis. Comput. Graph. 2017, 23, 1369–1378. [Google Scholar] [CrossRef] [Green Version]
- Bergström, I.; Azevedo, S.; Papiotis, P.; Saldanha, N.; Slater, M. The plausibility of a string quartet performance in virtual reality. IEEE Trans. Vis. Comput. Graph. 2017, 23, 1352–1359. [Google Scholar] [CrossRef] [Green Version]
- Heft, H. Affordances and the body: An intentional analysis of Gibson’s ecological approach to visual perception. J. Theory Soc. Behav. 1989, 19, 1–30. [Google Scholar] [CrossRef]
- Goldstein, E.B.; Brockmole, J. Sensation and Perception. Cengage Learning. 2016. Available online: http://www.cengage.com (accessed on 25 August 2021).
- Gibson, J. The Theory of Affordances. Perceiving Act. Knowing 1977, 67–82. [Google Scholar] [CrossRef]
- Hassenzahl, M. User Experience and Experience Design. Encycl. Hum.-Comput. Interact. 2013, 2. Available online: https://www.interaction-design.org/literature/book/the-encyclopedia-of-human-computer-interaction-2nd-ed/user-experience-and-experience-design (accessed on 18 June 2021).
- Pucillo, F.; Cascini, G. A framework for user experience, needs and affordances. Des. Stud. 2014, 35, 160–179. [Google Scholar] [CrossRef]
- Hassenzahl, M.; Diefenbach, S.; Göritz, A. Needs, affect, and interactive products–Facets of user experience. Interact. Comput. 2010, 22, 353–362. [Google Scholar] [CrossRef]
- Sheldon, K.M.; Elliot, A.J.; Kim, Y.; Kasser, T. What is satisfying about satisfying events? Testing 10 candidate psychological needs. J. Personal. Soc. Psychol. 2001, 80, 325. [Google Scholar] [CrossRef] [PubMed]
- Hassenzahl, M. Experience design: Technology for all the right reasons. Synth. Lect. Hum.-Cent. Inform. 2010, 3, 1–95. [Google Scholar] [CrossRef]
- Steffen, J.H.; Gaskin, J.E.; Meservy, T.O.; Jenkins, J.L.; Wolman, I. Framework of affordances for virtual reality and augmented reality. J. Manag. Inf. Syst. 2019, 36, 683–729. [Google Scholar] [CrossRef]
- Regia-Corte, T.; Marchal, M.; Cirio, G.; Lécuyer, A. Perceiving affordances in virtual reality: Influence of person and environmental properties in perception of standing on virtual grounds. Virtual Real. 2013, 17, 17–28. [Google Scholar] [CrossRef]
- Hameed, A.; Perkis, A.; Möller, S. Evaluating Hand-tracking Interaction for Performing Motor-tasks in VR Learning Environments. In Proceedings of the 2021 13th International Conference on Quality of Multimedia Experience (QoMEX), Montreal, QC, Canada, 14–17 June 2021; pp. 219–224. [Google Scholar]
- Perkis, A.; Timmerer, C.; Baraković, S.; Husić, J.B.; Bech, S.; Bosse, S.; Botev, J.; Brunnström, K.; Cruz, L.; De Moor, K.; et al. QUALINET White Paper on Definitions of Immersive Media Experience (IMEx). arXiv 2020, arXiv:2007.07032. [Google Scholar]
- Shin, D.H. The role of affordance in the experience of virtual reality learning: Technological and affective affordances in virtual reality. Telemat. Inform. 2017, 34, 1826–1836. [Google Scholar] [CrossRef]
- Kahneman, D. A perspective on judgment and choice: Mapping bounded rationality. Am. Psychol. 2003, 58, 697. [Google Scholar] [CrossRef] [Green Version]
- Lombard, M.; Ditton, T.B.; Weinstein, L. Measuring presence: The temple presence inventory. In Proceedings of the 12th Annual International Workshop on Presence, Los Angeles, CA, USA, 11–13 November 2009; pp. 1–15. [Google Scholar]
- Lessiter, J.; Freeman, J.; Keogh, E.; Davidoff, J. A cross-media presence questionnaire: The ITC-Sense of Presence Inventory. Presence Teleoper. Virtual Environ. 2001, 10, 282–297. [Google Scholar] [CrossRef] [Green Version]
- Makransky, G.; Lilleholt, L.; Aaby, A. Development and validation of the Multimodal Presence Scale for virtual reality environments: A confirmatory factor analysis and item response theory approach. Comput. Hum. Behav. 2017, 72, 276–285. [Google Scholar] [CrossRef]
- Friard, O.; Gamba, M. BORIS: A free, versatile open-source event-logging software for video/audio coding and live observations. Methods Ecol. Evol. 2016, 7, 1325–1330. [Google Scholar] [CrossRef]


| Item | Condition | Mean (µ) | Std.Dev |
|---|---|---|---|
| Spatial Presence (SP) | PW | 3.18 | 0.61 |
| IW | 3.65 | 0.50 | |
| Engagement (EN) | PW | 3.56 | 0.57 |
| IW | 3.89 | 0.50 | |
| Naturalness (NV) | PW | 3.66 | 0.73 |
| IW | 3.84 | 0.64 | |
| Negative Effects (NE) | PW | 2.13 | 0.91 |
| IW | 1.94 | 0.79 |
| Item | Condition | Mean (µ) | Std.Dev |
|---|---|---|---|
| Run-Time (s) | PW | 480.5 s | 221.2 |
| IW | 593.47 | 247.2 | |
| Stride (s) | PW | 36.21 s | 23.1 |
| IW | 44.92 s | 29.8 | |
| Still (s) | PW | 139.48 s | 26.9 |
| IW | 33.58 s | 32.8 | |
| Turn (no.) | PW | 17.72 | 5.2 |
| IW | 15.75 | 5.4 | |
| Bend (no.) | PW | 0.66 | 1.04 |
| IW | 1.16 | 1.7 | |
| Click (no.) | PW | 23.28 | 12.0 |
| IW | 30.47 | 14.3 |
| S. | Cdn. | RT. | St. | Sr. | Cl. | Tn. | Bd. |
|---|---|---|---|---|---|---|---|
| S15 | PW | 4 m 8 s | 52 | 48 | 20 | 26 | 1 |
| IW | 3 m 56 s | 76 | 22 | 43 | 26 | 3 | |
| S27 | PW | 9 m 13 s | 68 | 29 | 11 | 14 | 0 |
| IW | 9 m 52 s | 74 | 26 | 10 | 18 | 0 | |
| S05 | PW | 12 m 45 s | 99 | 0 | 25 | 20 | 2 |
| IW | 16 m 31 s | 99 | 0 | 51 | 10 | 0 |
Publisher’s Note: MDPI stays neutral with regard to jurisdictional claims in published maps and institutional affiliations. |
© 2021 by the authors. Licensee MDPI, Basel, Switzerland. This article is an open access article distributed under the terms and conditions of the Creative Commons Attribution (CC BY) license (https://creativecommons.org/licenses/by/4.0/).
Share and Cite
Hameed, A.; Perkis, A. A Subjective and Behavioral Assessment of Affordances in Virtual Architectural Walkthroughs. Appl. Sci. 2021, 11, 7846. https://doi.org/10.3390/app11177846
Hameed A, Perkis A. A Subjective and Behavioral Assessment of Affordances in Virtual Architectural Walkthroughs. Applied Sciences. 2021; 11(17):7846. https://doi.org/10.3390/app11177846
Chicago/Turabian StyleHameed, Asim, and Andrew Perkis. 2021. "A Subjective and Behavioral Assessment of Affordances in Virtual Architectural Walkthroughs" Applied Sciences 11, no. 17: 7846. https://doi.org/10.3390/app11177846
APA StyleHameed, A., & Perkis, A. (2021). A Subjective and Behavioral Assessment of Affordances in Virtual Architectural Walkthroughs. Applied Sciences, 11(17), 7846. https://doi.org/10.3390/app11177846