1. Introduction
The Fukushima Daiichi Nuclear Power Plant (FDNPP) disaster that occurred in 2011 was caused by earthquakes and tsunamis. Due to the nuclear meltdown, the nuclear fuels in the reactor pressure vessel (RPV) were melted and mixed with other materials, and a large amount of fuel debris was formed. Some fuel debris fell into the pedestal below the RPV, and the rest remained in the RPV. Fuel debris removal is an inevitable mission to complete the decommissioning of the FDNPP.
Numerous decommissioning activities have been conducted thus far using robot technology because of the high-dose radiation environment, where it is dangerous for humans to stay for long [
1,
2]. Some inspections conducted in the primary containment vessel (PCV) of Units 1, 2, and 3 of the FDNPP [
3,
4] revealed that waterdrops were dripping from the bottom of the RPV into the pedestal. Water was injected into the RPV to cool the remaining fuel debris that generated decay heat, and the water leaked from the damage at the bottom of the RPV. Determining the leakage position of the cooling water helped us estimate the location of the damaged area at the bottom of the RPV, which should be beneficial for estimating the rough distribution of the fuel debris in the pedestal because the fuel debris fell through the damage to the bottom of the RPV.
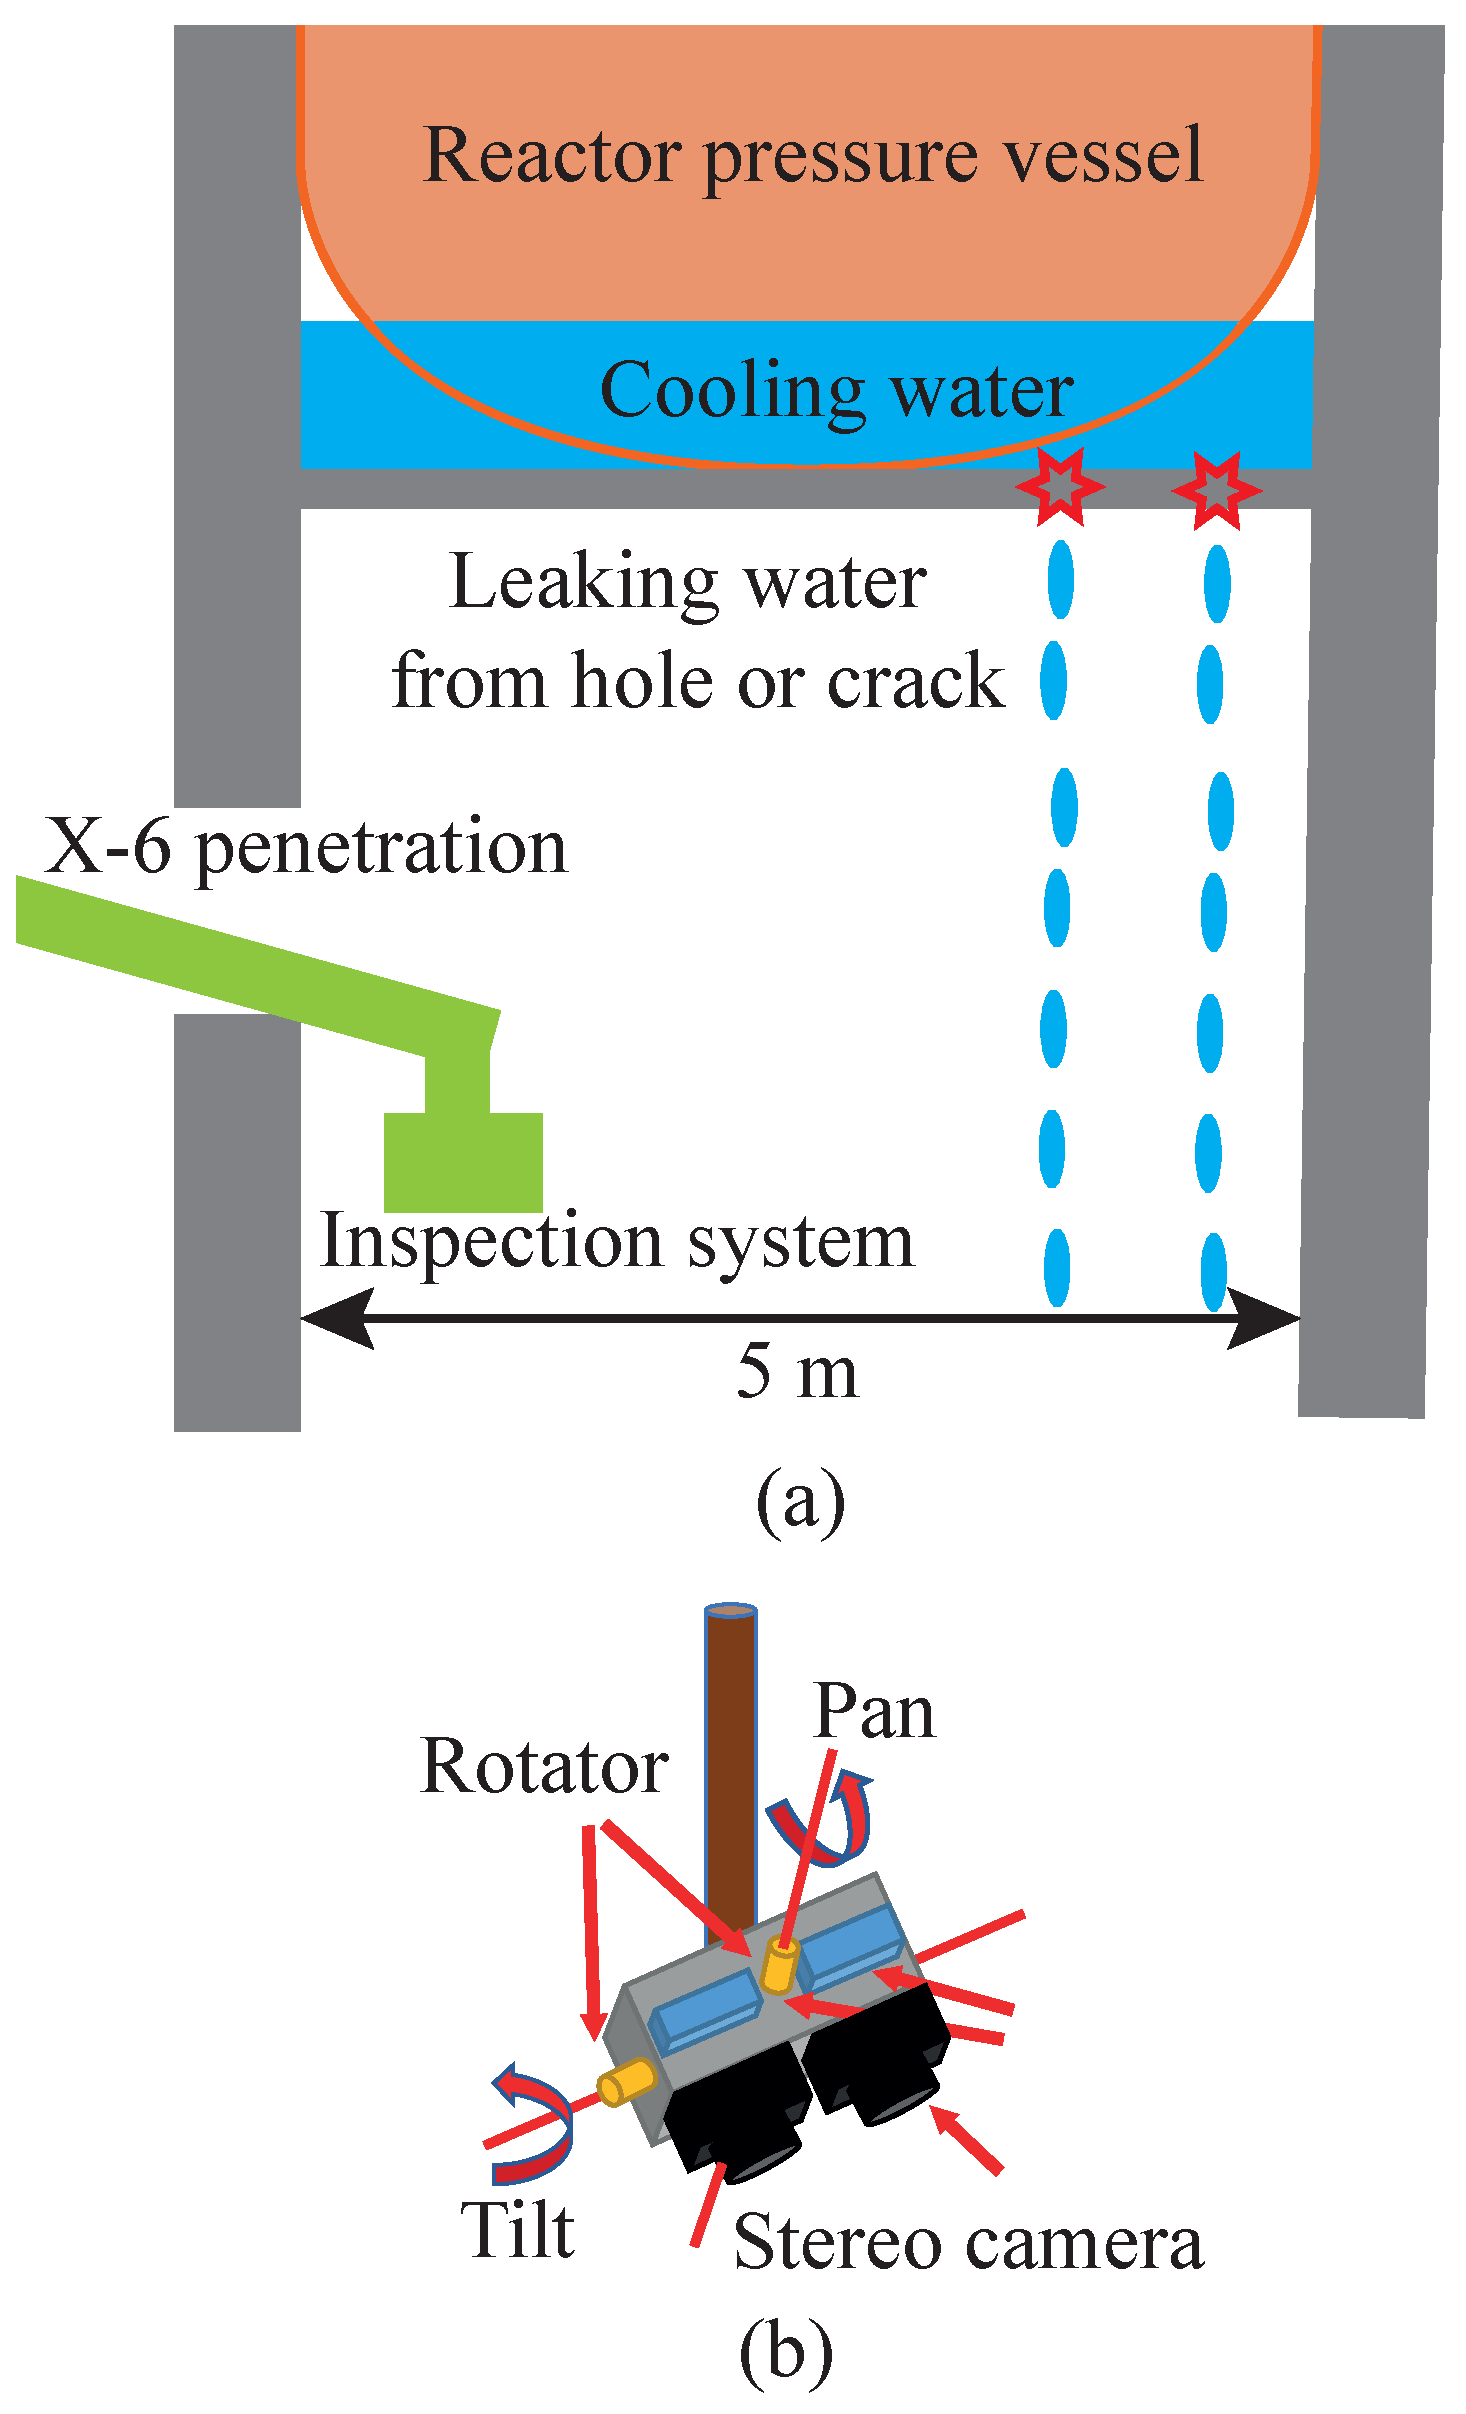
In this study, we propose a method of estimating the leakage position of cooling water using a stereo camera for the FDNPP. A stereo camera mounted on an inspection system with a rotating base is inserted through X-6 penetration into the pedestal below the RPV, as shown in
Figure 1.
Figure 1a illustrates the RPV, pedestal, and inspection system inserted into the pedestal. Water leaks from the damaged area to the pedestal.
Figure 1b depicts the inspection system with a stereo camera, where the orientation of the stereo camera can be changed using the rotating base. It is assumed that the inspection system includes a sensor that detects the direction of gravity such that the pan axis of the stereo camera can be aligned with gravity.
In the proposed method, we capture the waterdrops coming from the leakage position using a stereo camera, and the leakage positions are estimated by triangulating the waterdrop trajectory lines in the stereo image. The main contribution of this study is the extraction and matching of the waterdrop trajectories in a stereo image in the FDNPP. In particular, high radiation should be considered in the pedestal because of a severe high-dose environment owing to the fuel debris. Approximately 10 Gy/h was measured in the pedestal of Unit 2 according to an investigation [
5]. Radiation affects the inspection system in two ways. First, radiation energy is accumulated in electronic devices and causes malfunctions. However, the proposed method only requires a few seconds to capture stereo frames; therefore, malfunctions are not important in this study because ordinary electronic devices can survive at least a total dose of 100 Gy [
6,
7]. Second, strong radiation, especially gamma rays, causes image noise. Gamma rays are a form of light that has a shorter wavelength than visible light; therefore, image sensors capture gamma rays along with visible light. Moreover, gamma rays can penetrate matter easily, making it difficult to prevent gamma rays from being captured by image sensors. Gamma-ray noise appears in images as salt-and-pepper noise and line-shaped noise; the noise hinders the detection and matching of waterdrop trajectories from images because waterdrops do not have a strong color and texture.
We propose a leakage position estimation method that is robust against gamma-ray image noise. The challenge is to distinguish and match waterdrop trajectories from images with severe radiation noise. It is assumed that the waterdrops drip vertically in indoor environments without wind, such as in the FDNPP. Hence, the orientation of the stereo camera can be adjusted by the rotating base such that the vertical lines in the three-dimensional (3D) space are also projected as vertical lines in the image planes. Thereafter, the columns of pixels in the images are treated as image features and used to extract and match the waterdrop trajectories. Here, waterdrops appear in certain vertical lines in the images, whereas radiation noise appears in a uniformly distributed location in the images. Hence, we utilize the statistical difference to distinguish between waterdrops and radiation noise. Note that we previously proposed a camera orientation estimation method using the vanishing point of waterdrops [
8]. The concept of using waterdrops is similar to the one in this study; however, this study is completely different because we focus on the leakage position estimation, and the camera pose is given by the inspection system. Finally, we demonstrate the effectiveness of our leakage position estimation method in a simulated environment of the FDNPP with gamma-ray image noise.
2. Related Work
This study focuses on leakage position estimation, which is one of the inspection tasks for removing fuel debris and decommissioning the FDNPP. Kikura et al. and Wang et al. developed a remote leakage locating system using an ultrasonic array sensor to investigate the leakage locations in the FDNPP [
9,
10]. The ultrasonic array sensor was placed in the water to detect the water flow for localization of the leakage positions; hence, for the leakage positions to be applicable to their methods, they needed to be submerged. However, the bottoms of the RPV of Units 1, 2, and 3 were not submerged; therefore, it was difficult to estimate the leakage position of the bottom of the RPV using their methods.
Some studies utilized thermographic cameras to detect leakage positions. Penteado et al. and Pauline et al. employed thermographic cameras to detect the leakage positions of buried pipes [
11,
12]. They detected the leakages by capturing the temperature changes of the soil surface, because water leakage from pipes decreases the temperature of the soil. However, it is difficult to detect water dripping from the bottom of the RPV using thermographic cameras because of the small volume of a waterdrop. Moreover, it is unclear how radiation affects the thermographic cameras.
Compared to ultrasonic array sensors and thermographic cameras, conventional optical cameras are widely available. Xue et al. proposed a method to estimate the leakage positions in tunnels from images using a deep learning-based approach [
13]. They assumed that the environment was dry except for areas of the leakage. They used color change, because areas around the leakage positions had darker colors compared to the dry ones. In the FDNPP, most of the environment is wet; therefore, their methods cannot be applied.
In this study, we utilized a stereo camera to detect waterdrops and triangulate the trajectories of the waterdrops to estimate the leakage positions on a two-dimensional map. In addition, the radiation noise was considered. There are affordable depth sensors available these days; however, it would be difficult for depth sensors to detect small and transparent objects such as waterdrops. For instance, the depth sensors would not measure a waterdrop itself but the wall of the pedestal, based on the study [
14] on the performance in the rain of LiDAR (light detection and ranging). It is worth noting that some studies have focused on detecting waterdrops that adhere to the protection glass of cameras [
15,
16]. We assume that the inspection system has wipers to remove the adherent waterdrop on the camera glass; therefore, we considered the adherent waterdrop as beyond the scope of this study.
3. Method
3.1. Overview
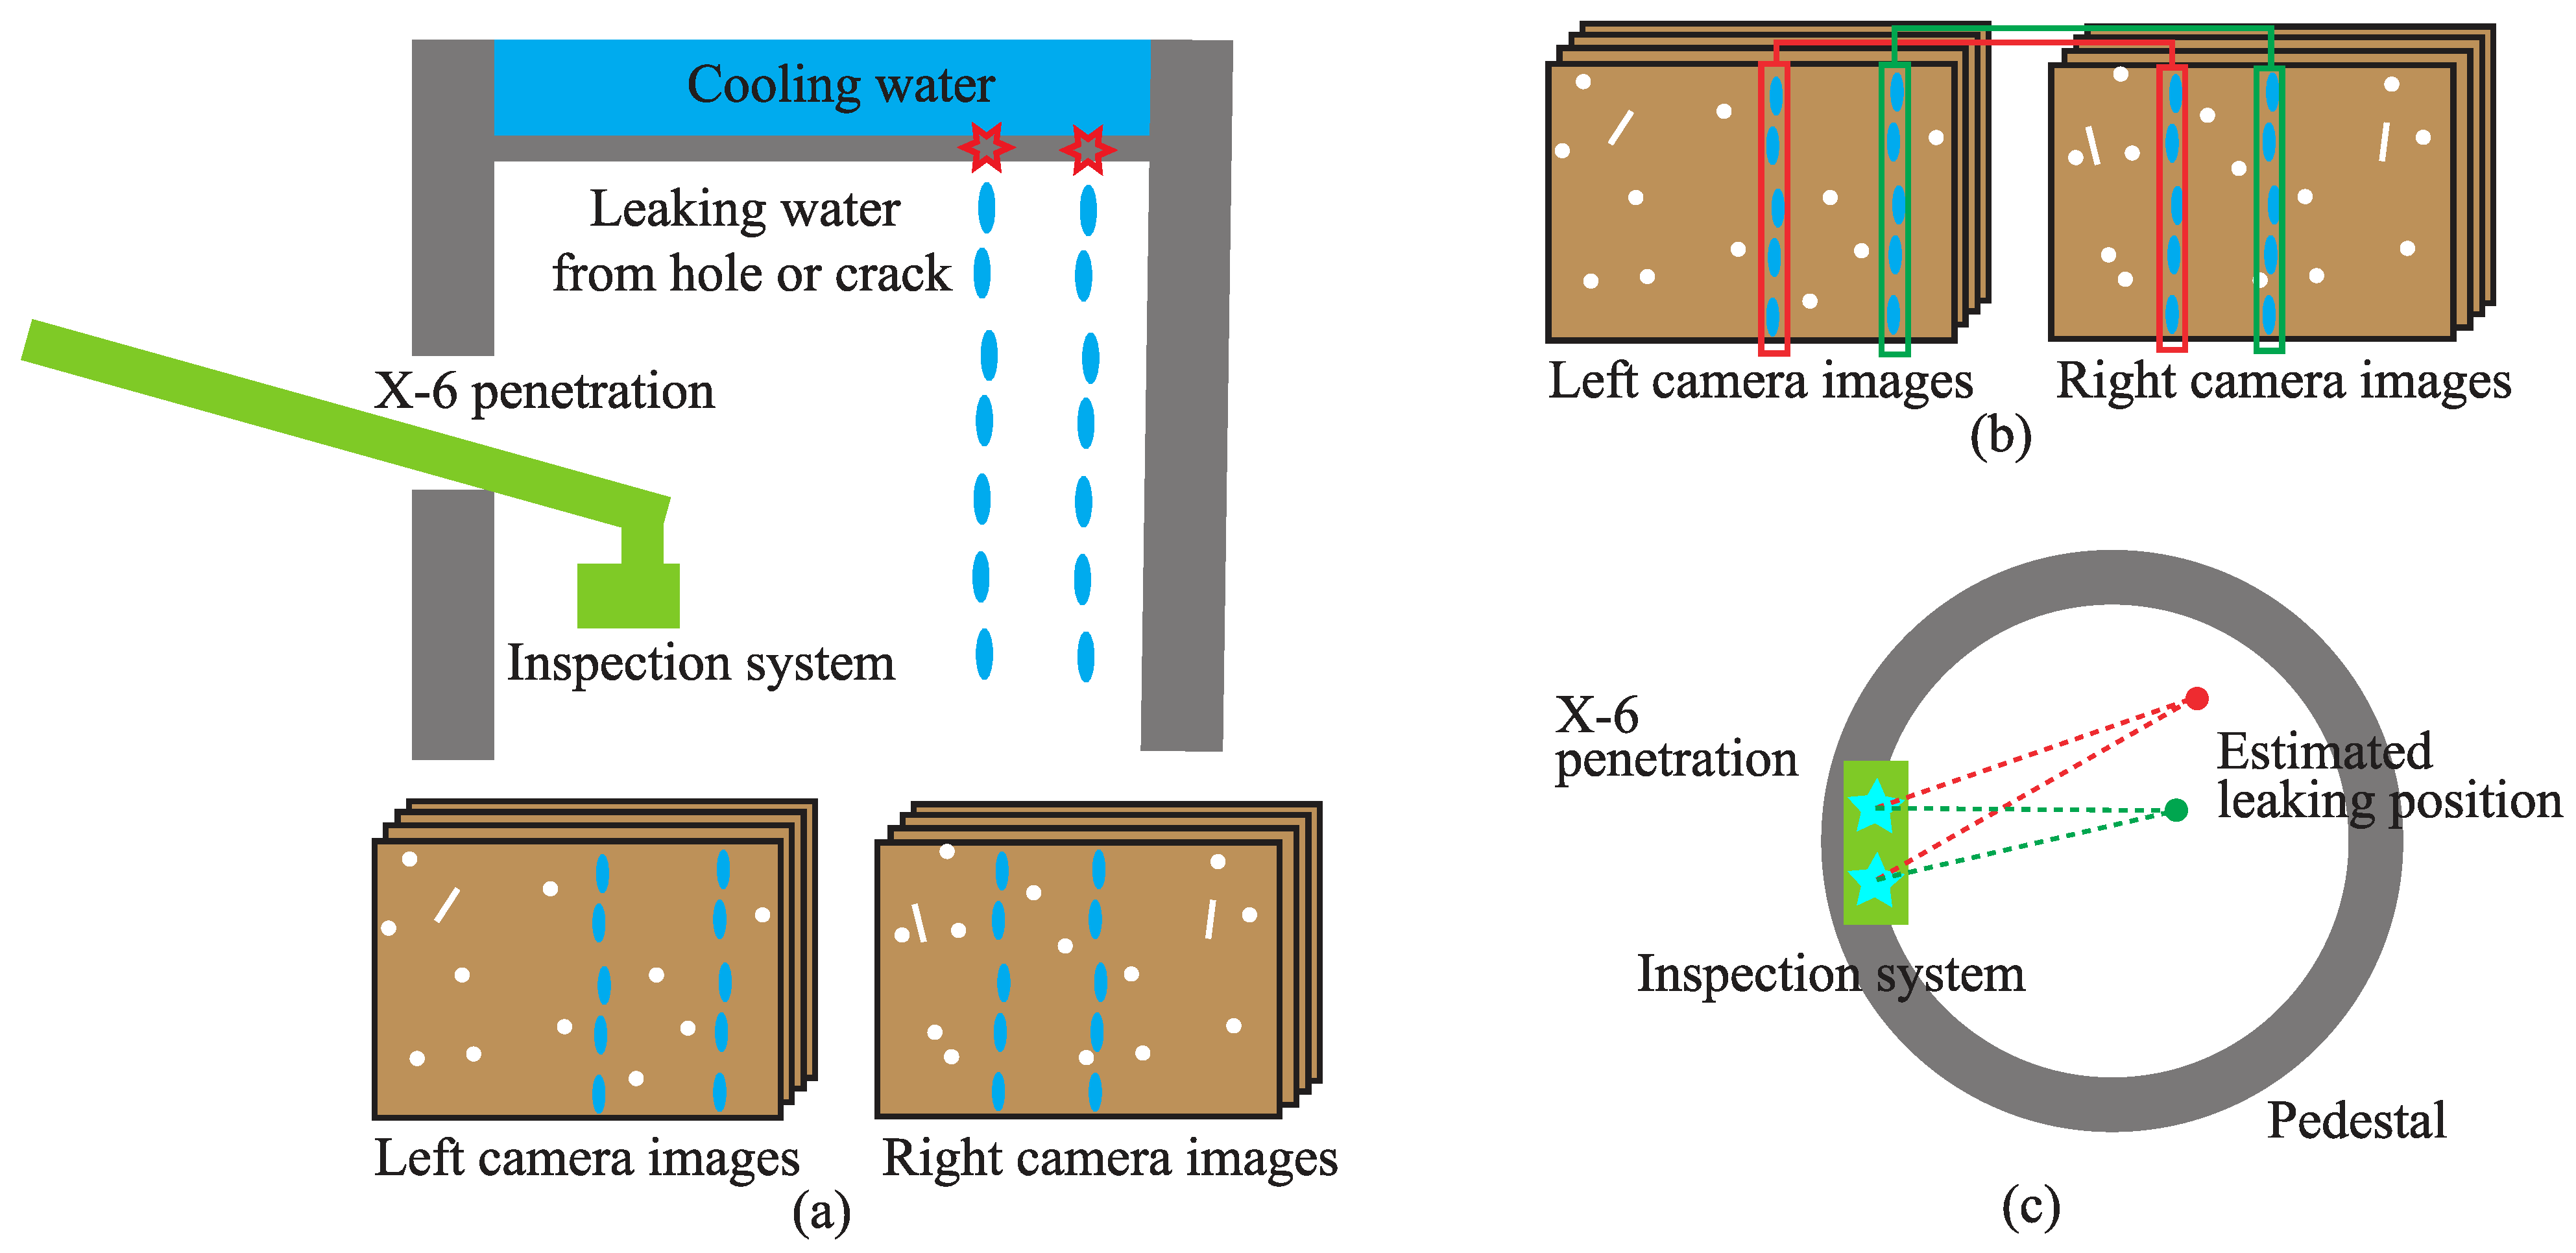
An overview of the proposed method is shown in
Figure 2. First, waterdrops from the leaking positions are captured by the stereo camera for a few seconds, as shown in
Figure 2a. The orientation of the stereo camera is adjusted before capturing the waterdrops such that the trajectories of the waterdrop are vertical lines in the stereo images.
Second, the waterdrops are detected and matched using the proposed method, as shown in
Figure 2b. Waterdrop trajectory detection and matching is explained in
Section 3.2 and
Section 3.3, respectively.
Finally, the leakage positions are estimated by triangulating the corresponding trajectory lines, as illustrated as dotted lines in
Figure 2c. The red and green dots in
Figure 2c represent the leakage positions estimation by the triangulation, which are the relative positions of estimated leakage with respect to the stereo camera coordinates. We can estimate the leaking positions from the top view of the pedestal by utilizing the location of X-6 penetration, which is similar to the location of the stereo camera. This is explained in
Section 3.4.
3.2. Waterdrop Trajectory Detection
Detecting a waterdrop is difficult because of its transparency, motion blur, etc.; therefore, we focus on detecting waterdrop trajectories in this study. It is assumed that water drips from the leaking position continuously and vertically without wind. Thus, the waterdrop trajectories are captured as vertical lines in the stereo images after aligning the pan axis of the stereo camera with gravity. Therefore, waterdrop trajectory detection can be accomplished by detecting vertical lines in images that belong to the waterdrop trajectories. The challenge is to distinguish waterdrop trajectories from images with severe radiation noise.
Waterdrops appear in certain vertical lines in such images. Meanwhile, radiation noise can be treated as independent and identically distributed (i.i.d.) random noise. Thus, statistical operations can distinguish between the waterdrop trajectories and radiation noise. Initially, we captured waterdrops for a few seconds using the stereo camera from a fixed position in the pedestal, resulting in stereo images , where and represent the grayscale left and right images with a resolution of , respectively.
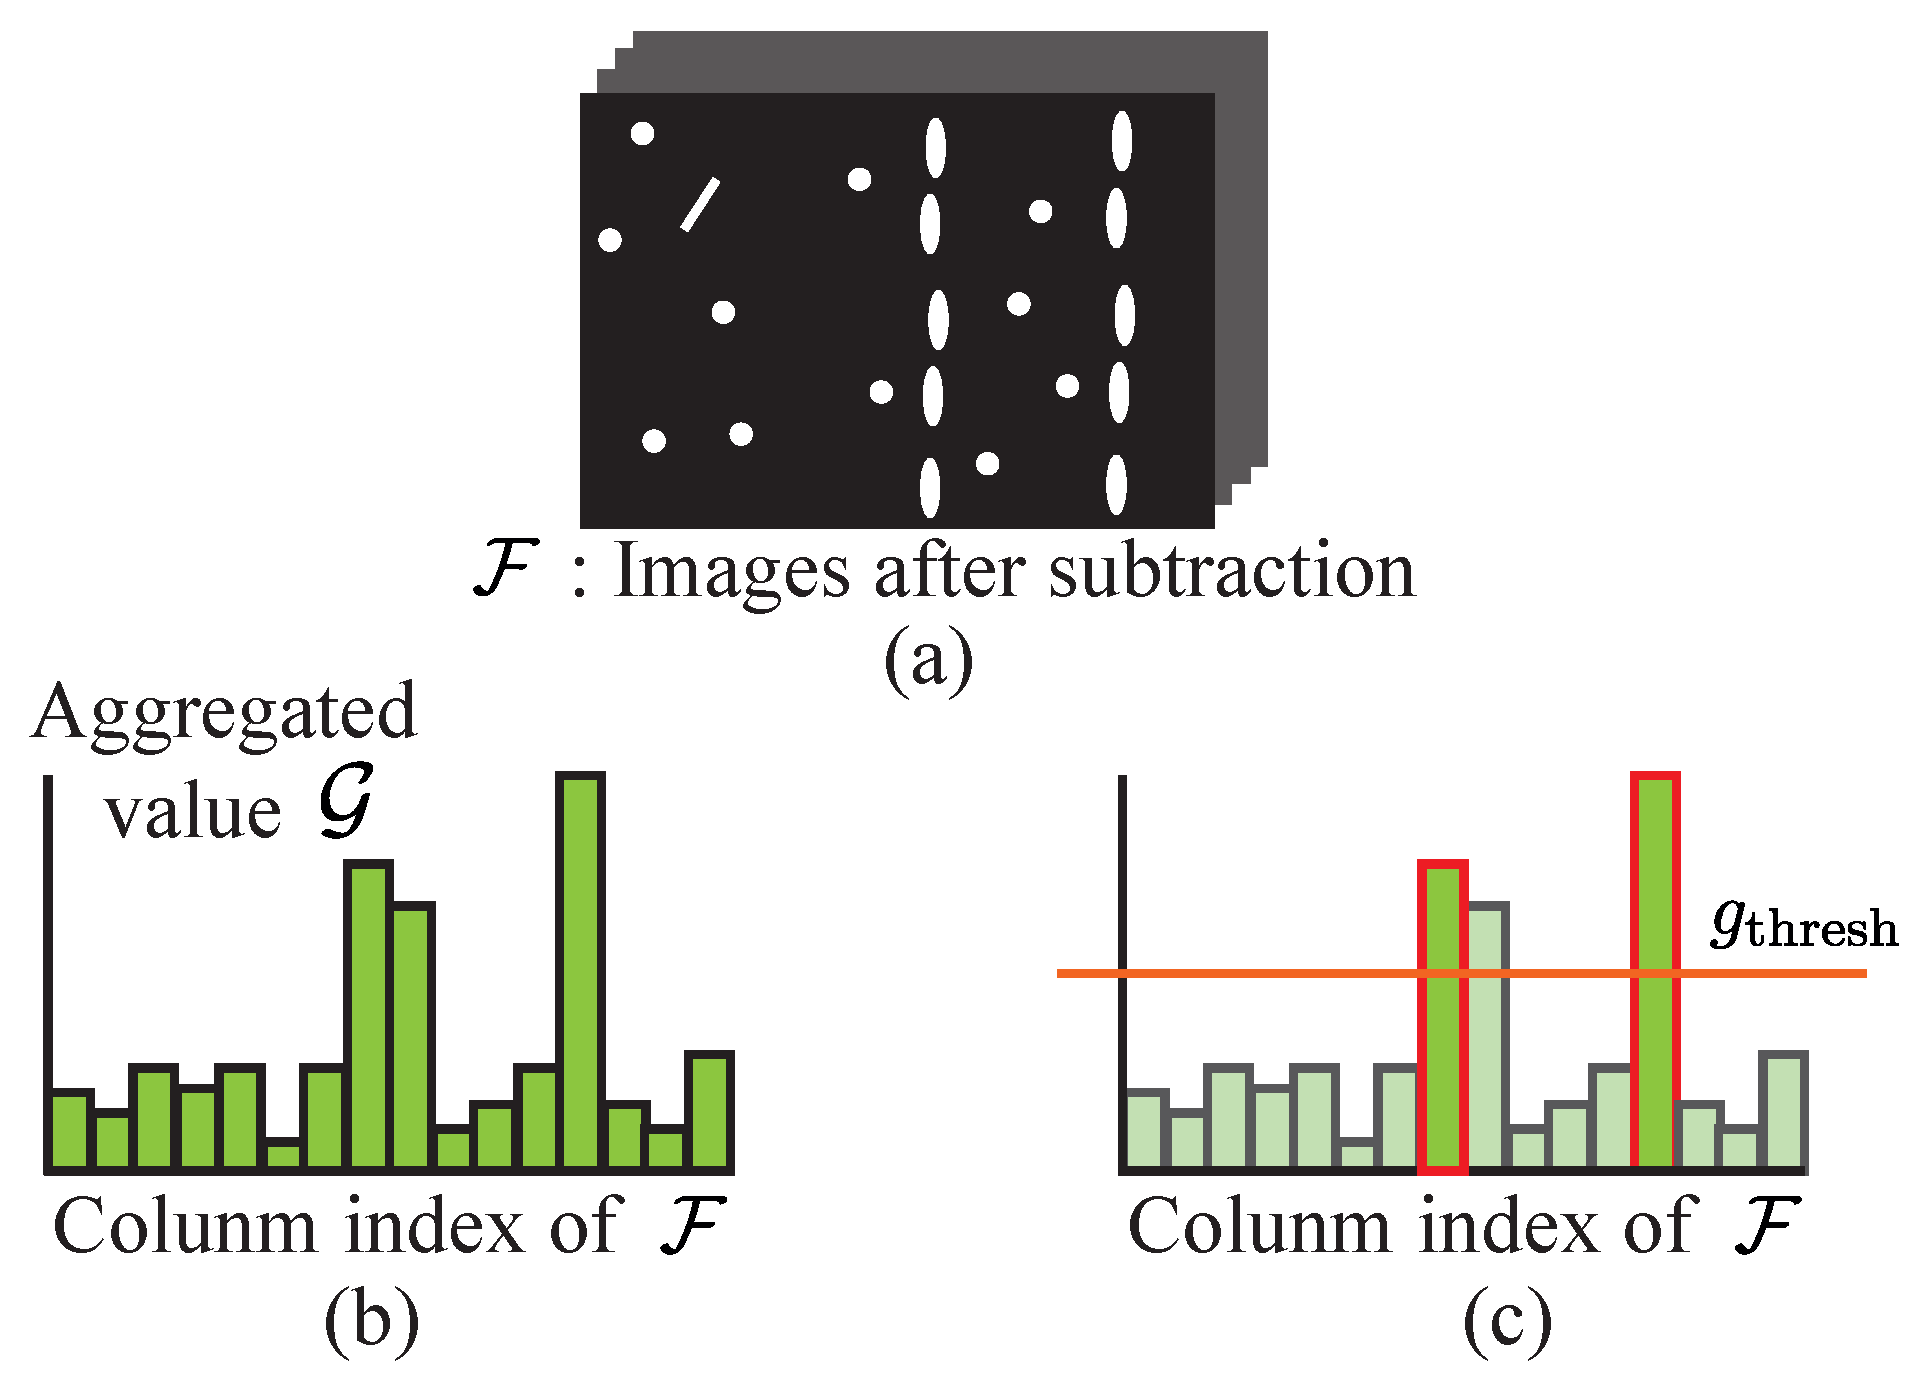
The remaining detection procedure is illustrated in
Figure 3. First, background subtraction is applied to the stereo images
and
to extract the waterdrops and radiation noise, as shown in
Figure 3a, which is formulated as follows:
where
denotes the extracted waterdrops and radiation noise, and
represents the temporal median filter. The same operation is applied to
, and
is obtained. It is worth noting that we also employed a background subtraction method proposed in [
17]; however, their method failed to extract waterdrops because waterdrops tended to be categorized as background.
Next, vertical lines that belong to the waterdrop trajectories are detected from
and
using the following approach: The same procedure is applied to
and
; hence, we omit the superscript and describe the extracted waterdrops and radiation noise as
. As explained above, radiation noise can be treated as i.i.d. random noise, whereas waterdrops appear in certain vertical lines in the images; therefore, vertically aggregated values of
show a statistical difference. As can be seen in
Figure 3b, the aggregated value
obtained from the
j-th column of
is calculated as follows:
where
is the value of
at the
i-th row and
j-th column.
The final waterdrop trajectory detection result
is calculated from
using Algorithm 1, which is illustrated in
Figure 3c. As described in Algorithm 1, the
i-th column aggregated value
that has higher than
, which is two standard deviations of the mean, is detected as the water drop trajectory. This threshold value can be adjusted based on these scenes. Moreover, non-maximum suppression with window size
is applied to the detection result to prevent a waterdrop trajectory from being detected as multiple lines in the images. Finally, the detection result is obtained as
, where the waterdrop trajectory is detected at the
i-th column of the left image if
is true.
| Algorithm 1: Waterdrop trajectory detection. |
![Applsci 11 07796 i001]() |
3.3. Waterdrop Trajectory Matching
Using the detection result
, we define the set of column indices of the waterdrop trajectories as follows:
where
is the set of column indices of the waterdrop trajectories in the left images.
is defined in the same manner as
for the right images. Therefore, finding the correspondence between
and
is required to match the waterdrop trajectories. In this study,
corresponding trajectories are searched, where
denotes the cardinality of a set.
and are treated as image features, and the features and are considered to correspond if and have the closest distance in . Furthermore, we aggregate the correspondence over to make the matching method robust against radiation noise. Note that the stereo images are already rectified; hence, the epipolar line is horizontal and at the same row index in the stereo images.
The matching procedure is summarized in Algorithm 2. Algorithm 2 describes the procedure for
; otherwise, the superscript
L is interchanged with the superscript
R. In addition,
is a function for calculating the L2 distance between
and
. The final waterdrop trajectory matching result is obtained as a set of column index pairs
.
| Algorithm 2: Waterdrop trajectory matching |
![Applsci 11 07796 i002]() |
3.4. Leaking Position Estimation
The leaking positions are estimated by triangulating the corresponding trajectory lines, as shown in
Figure 2c. A vertical line
at column index
c in an image is formulated as follows:
and a plane
calculated from
in the world coordinates is formulated as follows:
where
is a camera projection matrix that transforms a point
in the image coordinates into a point
in the world coordinates.
A line in a 3D space drawn by a waterdrop trajectory is calculated by intersecting two planes
from the left images and
from the right images, which is formulated as follows:
where
is the null space and span representation of a line [
18]. The final estimated leakage position from the top view
is calculated as follows:
where Equation (
8) is well-posed because there are two equations with two unknown variables. It should be noted that the left and right camera projection matrices are defined such that the gravity direction is the
z-axis in the world coordinates.
4. Experiments
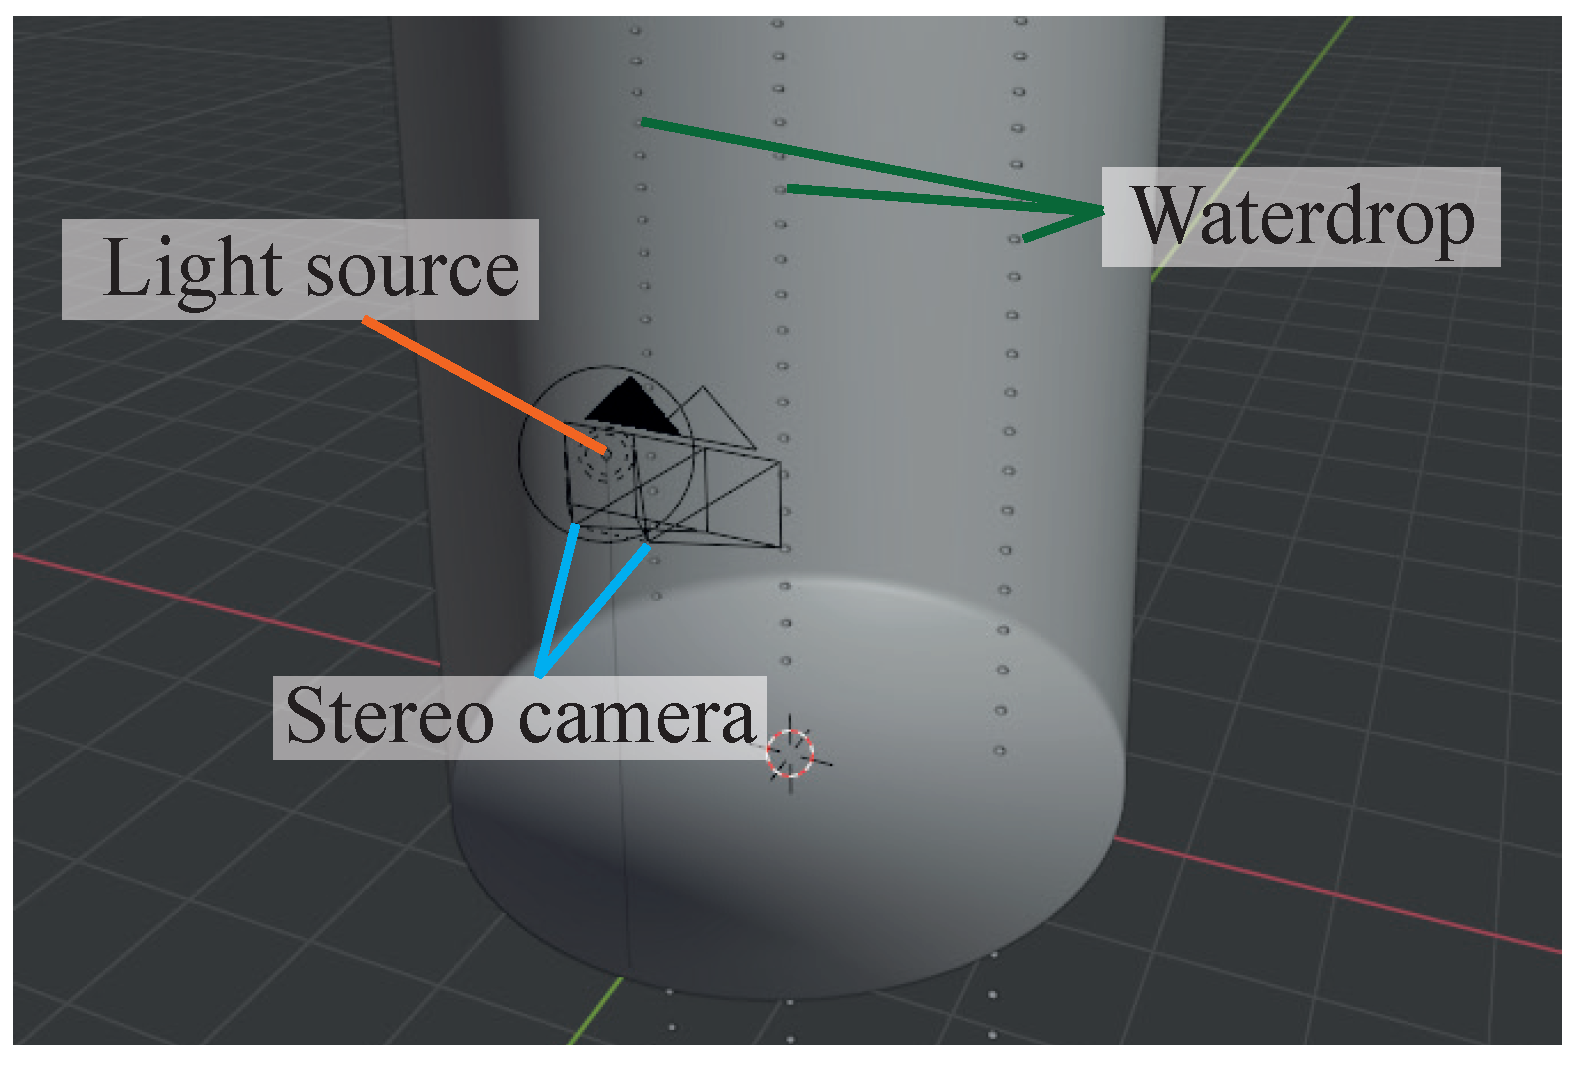
We conducted experiments to demonstrate the effectiveness of the proposed method in a simulated environment. The pedestal in Unit 2 of the FDNPP was simulated using Blender [
19], as shown in
Figure 4. The pedestal was approximated as a cylinder with a diameter of 5.0 m, and a textured rusty metal was added to the cylinder. The waterdrops were dripped continuously from three leakage positions, as shown in
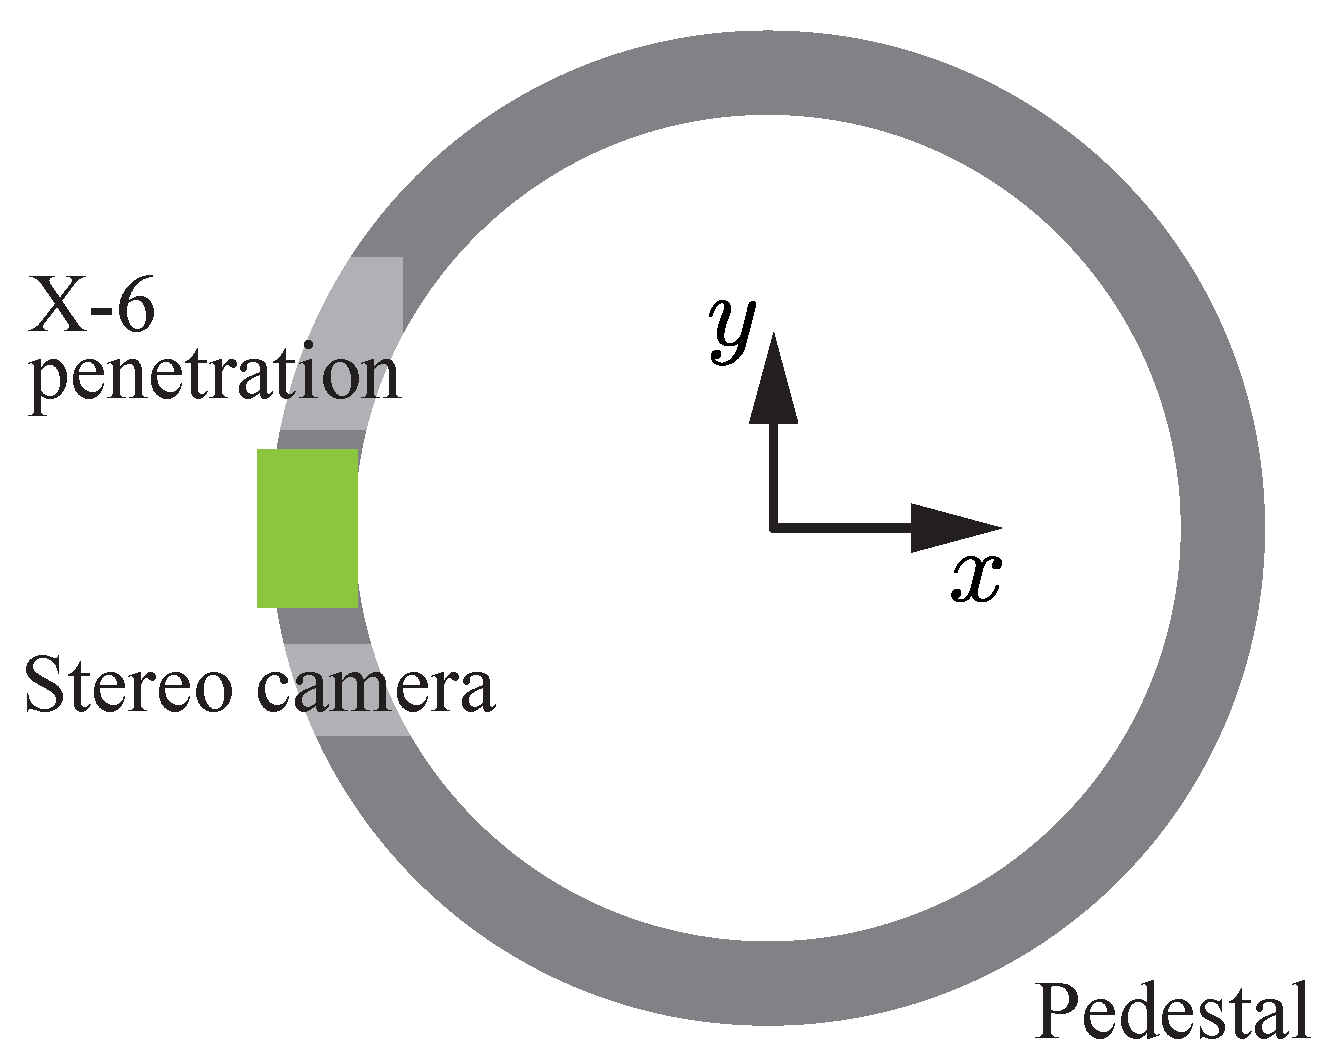
Figure 4. The coordinate system in a simulated environment is shown in
Figure 5. A stereo camera was placed near the X-6 penetration in the pedestal. The baseline of the stereo camera was set to 0.5 m, as the width of X-6 penetration is 0.6 m [
20]. Specifically, the left and right cameras were located at
and
, respectively (note that
z values were omitted). Both cameras faced in the same direction as the
x-axis. A single point light source was also added above the stereo camera to the environment.
The stereo camera images were rendered at 12 frames per second using physically-based rendering software called Cycles [
21]. Both cameras had a resolution of
pixels with a horizontal field of view of
. Thereafter, radiation noise was added to the images using the method proposed in [
22]. In particular, we added 662 keV gamma rays caused by Cesium-137, which is a common radioactive material in the FDNPP, using Monte Carlo simulation called Geant4 [
23,
24]. In [
22], the parameters for generating radiation noise were estimated using cameras capturing 12 frames per second. Therefore, the same frame rate was chosen for rendering stereo images to generate gamma-ray radiation noise that was as realistic as possible. Three different intensities of the radiation noise, namely, low level (L), middle level (M), and high level (H), were applied to images to evaluate the robustness of the proposed method against the radiation noise levels. The intensity of the high level radiation noise was determined based on the air dose rate of approximately 10 Gy/h to simulate the actual environment [
5]. We set the radiation noise levels of M and L as 33% and 17% of H, respectively.
In this study, was set to 24, implying that the stereo cameras captured the scene for two seconds as the input stereo images. Moreover, was set to 10 pixels.
The evaluation was conducted using the Euclidean distance between the ground truth and the estimation from the top view, which is formulated as follows:
where
and
are the ground truth and the estimation of the corresponding leakage position, respectively.
We conducted evaluations in three different settings, namely
three separated waterdrops,
three crowded waterdrops, and
multiple waterdrops, which are described below. Please watch the video of the simulated environment (
https://drive.google.com/drive/folders/11A_bxKxLl5pt04pVg3M_m2giJNoZCaUx?usp=sharing, accessed on 21 August 2021). In all settings, leakage positions were generated in the right semicircle of the pedestal in
Figure 5. We limited the generated leakage positions to the right semicircle of the pedestal because we wanted to capture the waterdrops in both left and right cameras to evaluate the proposed method properly. If the waterdrops were generated in the left semicircle, the waterdrops were close to the stereo camera; therefore, it was highly likely that the waterdrops appeared to only one camera or none of the cameras.
4.1. Three Separated Waterdrops
Ten different scenes were rendered with random three leakage positions for the
three separated waterdrops evaluation. In this evaluation, we generated scenes that were easy for our proposed method. In the scene generation process, a scene was rejected if the distances between the leakage positions were closer than 0.5 m, because if two waterdrops were generated close together, our method would not detect two waterdrops but one waterdrop, an estimation error. We evaluated a scene where the distances between the leakage positions were closer than 0.5 m in
Section 4.2. As mentioned above, three different levels of radiation noise were applied to each scene, which resulted in 30 pairs of stereo videos for the evaluation.
4.2. Three Crowded Waterdrops
We evaluated the performance of the proposed method when the distances between the leakage positions were smaller than 0.5 m. Eight different scenes with three leakage positions were rendered and the leakage positions are listed in
Table 1. As can be observed in
Table 1, the minimum distance between the leakage positions was 0.05 m for scenes 1 and 4, which we knew would be hard for the proposed method. Three different levels of radiation noise were applied to each scene, which resulted in 24 pairs of stereo videos for the evaluation.
4.3. Multiple Waterdrops
To further investigate the limitations of the proposed method, experiments with more than three leakage positions were conducted. In the experiments, scenes with five and seven leakage positions were rendered randomly, and four scenes were generated for each number of the leakage positions. Only a high level of radiation noises was applied to each scene, which resulted in eight pairs of stereo videos for the evaluation.
5. Results
5.1. Results with Three Separated Waterdrops
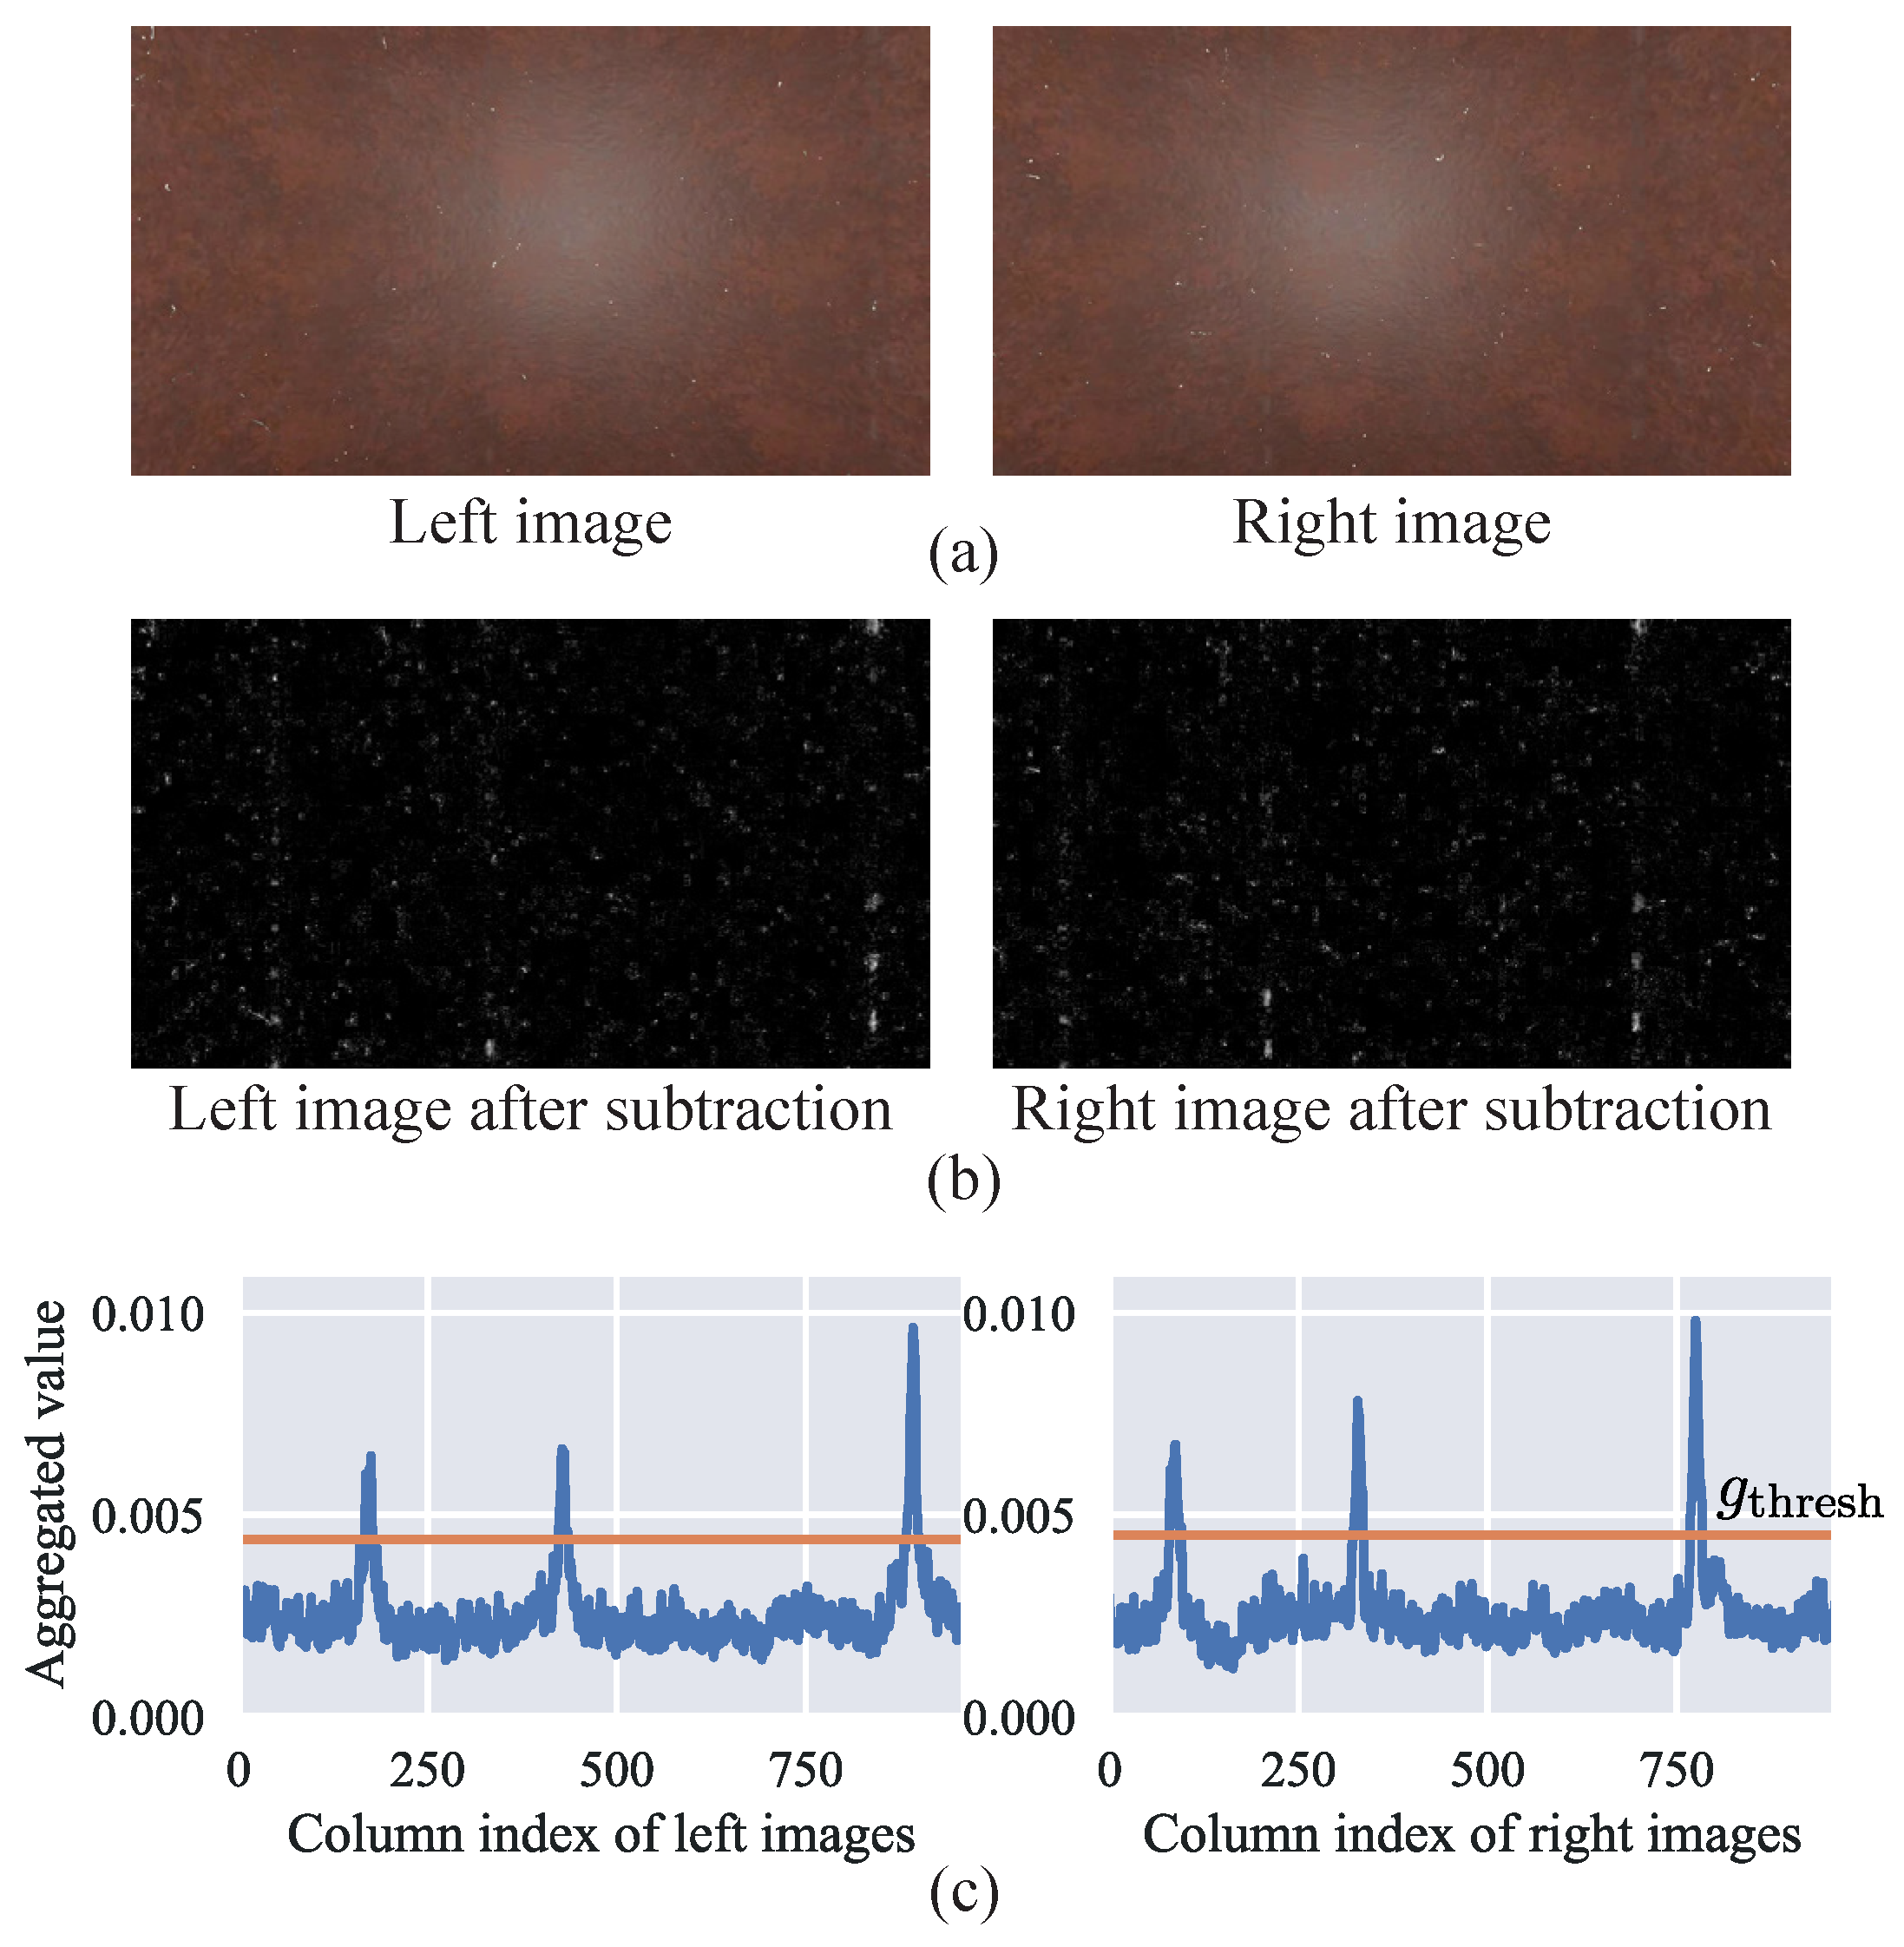
Examples of input stereo images, images after background subtraction
, and aggregated values of
are shown in
Figure 6. Even though it is difficult to observe waterdrops in the input stereo images, the proposed method can detect the vertical lines of the waterdrop trajectories. Note that color stereo images are presented in
Figure 6a for reference, although the grayscale images were processed using the proposed method. In addition, the contrast of the images was adjusted in
Figure 6b for visualization.
The results of the number of the detected leakages using the proposed method are shown in
Table 2. As can be seen in
Table 2, the proposed method detected 26 out of 30 leakage positions, and the noise level did not affect the results. We investigated the failed cases and found out the waterdrops were out of the field of view of the stereo cameras. Therefore, the proposed method can detect and match water trajectories correctly if the waterdrops are captured by both stereo cameras.
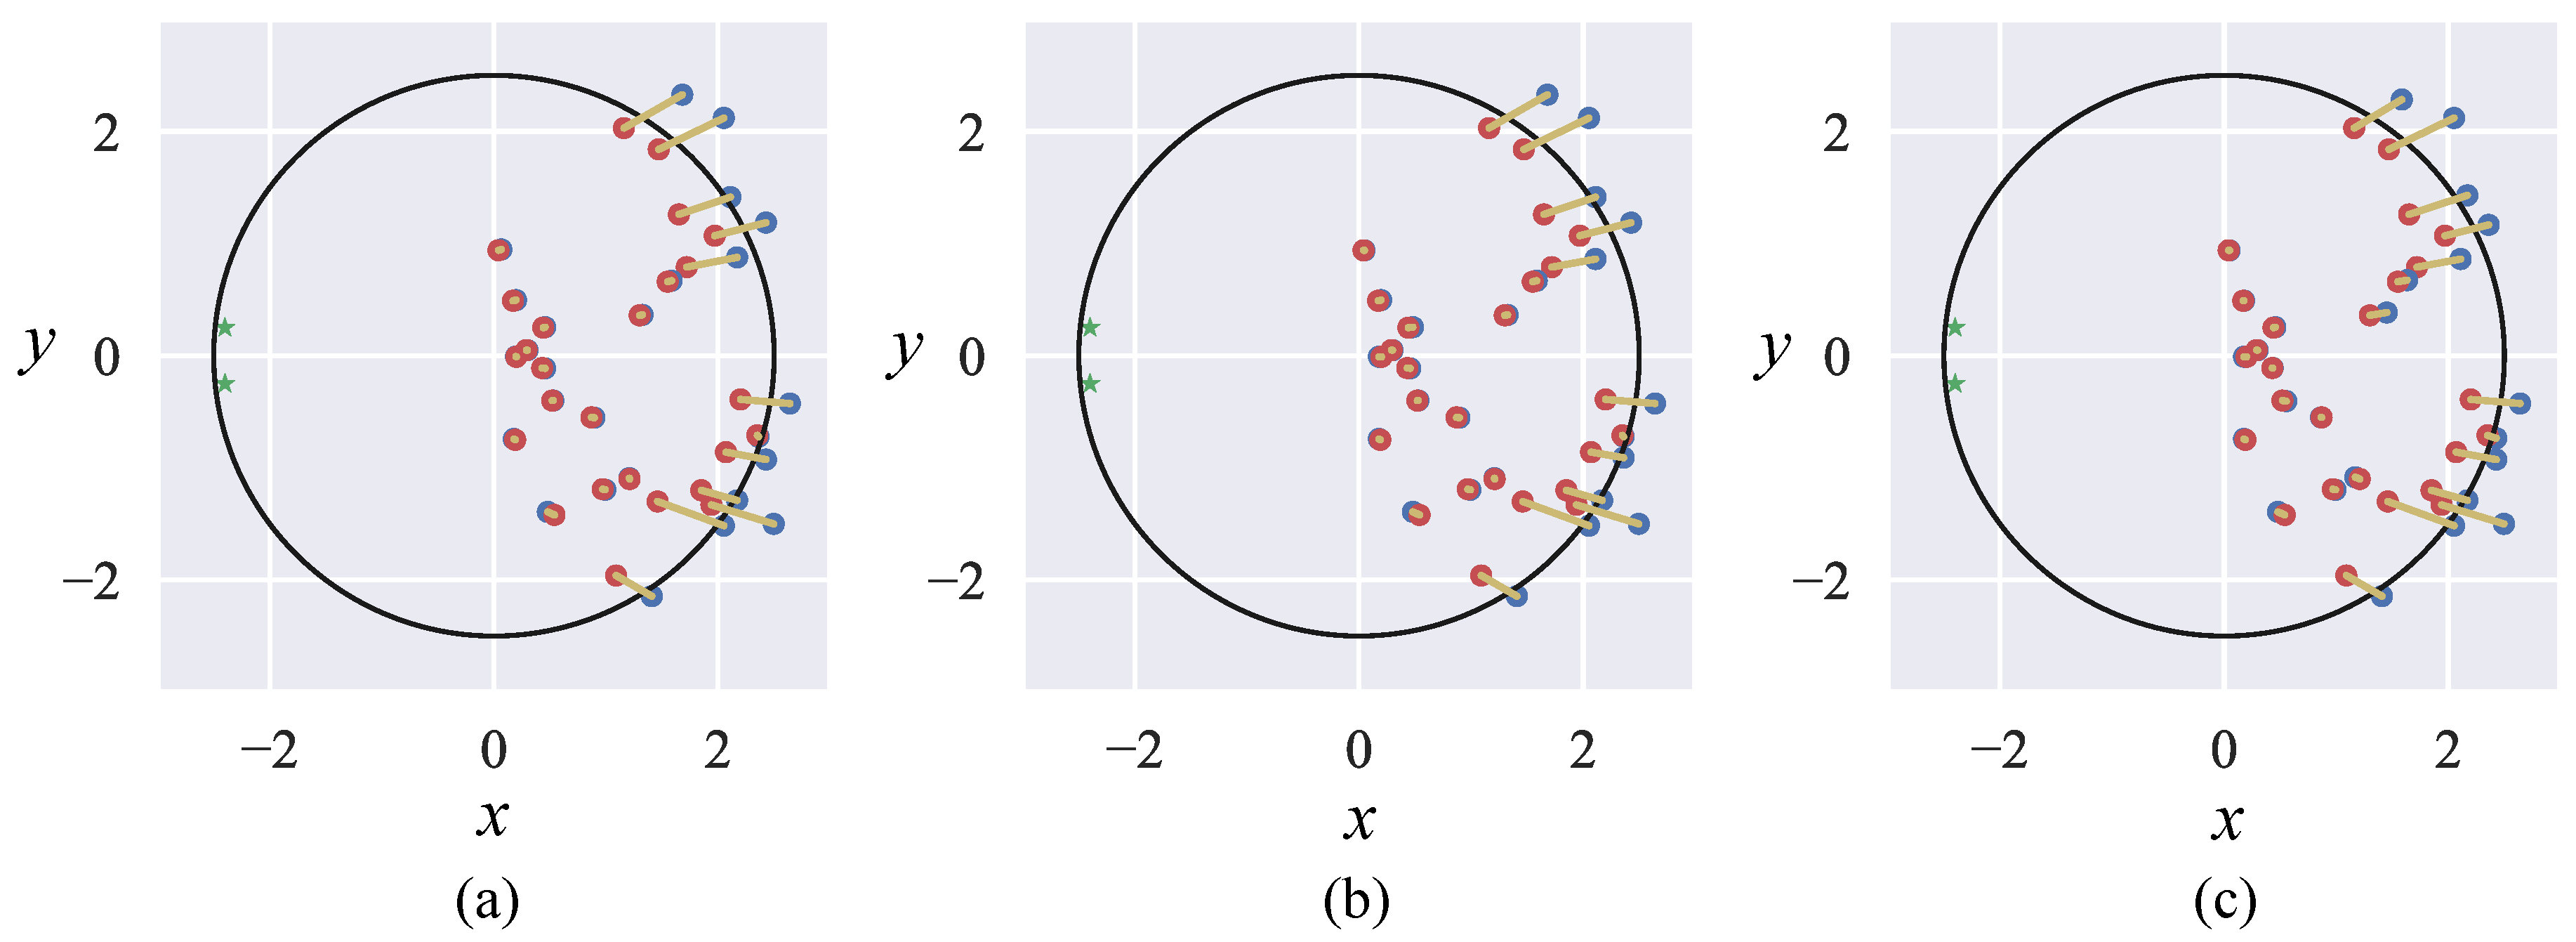
The accuracy of the estimated leakage position is presented in
Table 3. The accuracy was evaluated using the mean and standard deviation (SD) of 26 leakage positions at each radiation noise level. As can be observed in
Table 3, the proposed method estimated the leakage positions robustly in the face of radiation noise. Besides, it was surprising that the SD was smaller when the noise level was high. Therefore, the ground truth and the estimated leakage positions of each noise level are illustrated in
Figure 7 for further clarity. In
Figure 7, the yellow lines represent the estimation errors, and the error distributions are almost the same for all noise levels. Besides, the difference in the SD is relatively small. It can be estimated that the waterdrop trajectory estimations of the stereo images were a few pixels different with different noise levels. Thus, it can be considered that the differences in SD were just perturbations caused by the radiation noise.
Another interesting fact can be observed in
Figure 7: that the estimation errors were large near the wall. It turned out that the shadows caused large errors in the proposed method. In our scenarios, a single light source was available above the stereo camera; therefore, when waterdrops were generated near the wall of the pedestal, the waterdrops cast shadows on the wall. In the proposed method, the shadows could be detected as waterdrops after background subtraction, which prevented the trajectory estimation module from estimating the centers of the waterdrops accurately. Thus, the estimation errors near the wall were large. The shadows could be removed by using multiple light sources in the environment; however, we will leave adding additional light sources as future work.
We conducted another experiment on
three separated waterdrops with the H noise level, where different
were used to estimate the leakage positions. As shown in
Table 4, the larger the
, the more accurate the estimation results. However, the larger the
, the longer the stereo cameras were placed without moving; therefore, too large an
is not realistic. Besides, the improvement in the accuracy saturated with enough
(in this case, 18 or 24 frames). Surprisingly, fewer
got better results in terms of the detection rate. We further investigated the aggregated value of the column pixels of different
, and it was revealed that larger
made the peak of the plot smoother (wider width), which means it is harder for the proposed method to distinguish two waterdrops generated close together. In this study, we prioritized the accuracy; thus, we set
as 24, assuming that placing the stereo camera for two seconds without moving is acceptable.
5.2. Results with Three Crowded Waterdrops
We conducted experiments for difficult scenarios where the distances between the leakage positions were closer than 0.5 m. The detection rates and the estimated errors are listed in
Table 5. The detection rate was the same across the different radiation noise levels, which demonstrates the robustness of the proposed method against the radiation noise. The proposed method only failed to detect the leakage positions when the distance between the leakage positions was 0.05 m.
The mean errors in
Table 5 were considerably low compared to
Table 3 because waterdrops were not generated near the walls, which means there were no shadows of the waterdrops in the rendered images. As can be observed in
Table 5, the high radiation noise affected the accuracy; however, the mean errors only increased by 0.01 m, which demonstrates the robustness of the proposed method against radiation noise. We believe the proposed method can handle even higher radiation noise, as long as waterdrops are visible in the stereo cameras.
5.3. Results with Multiple Waterdrops
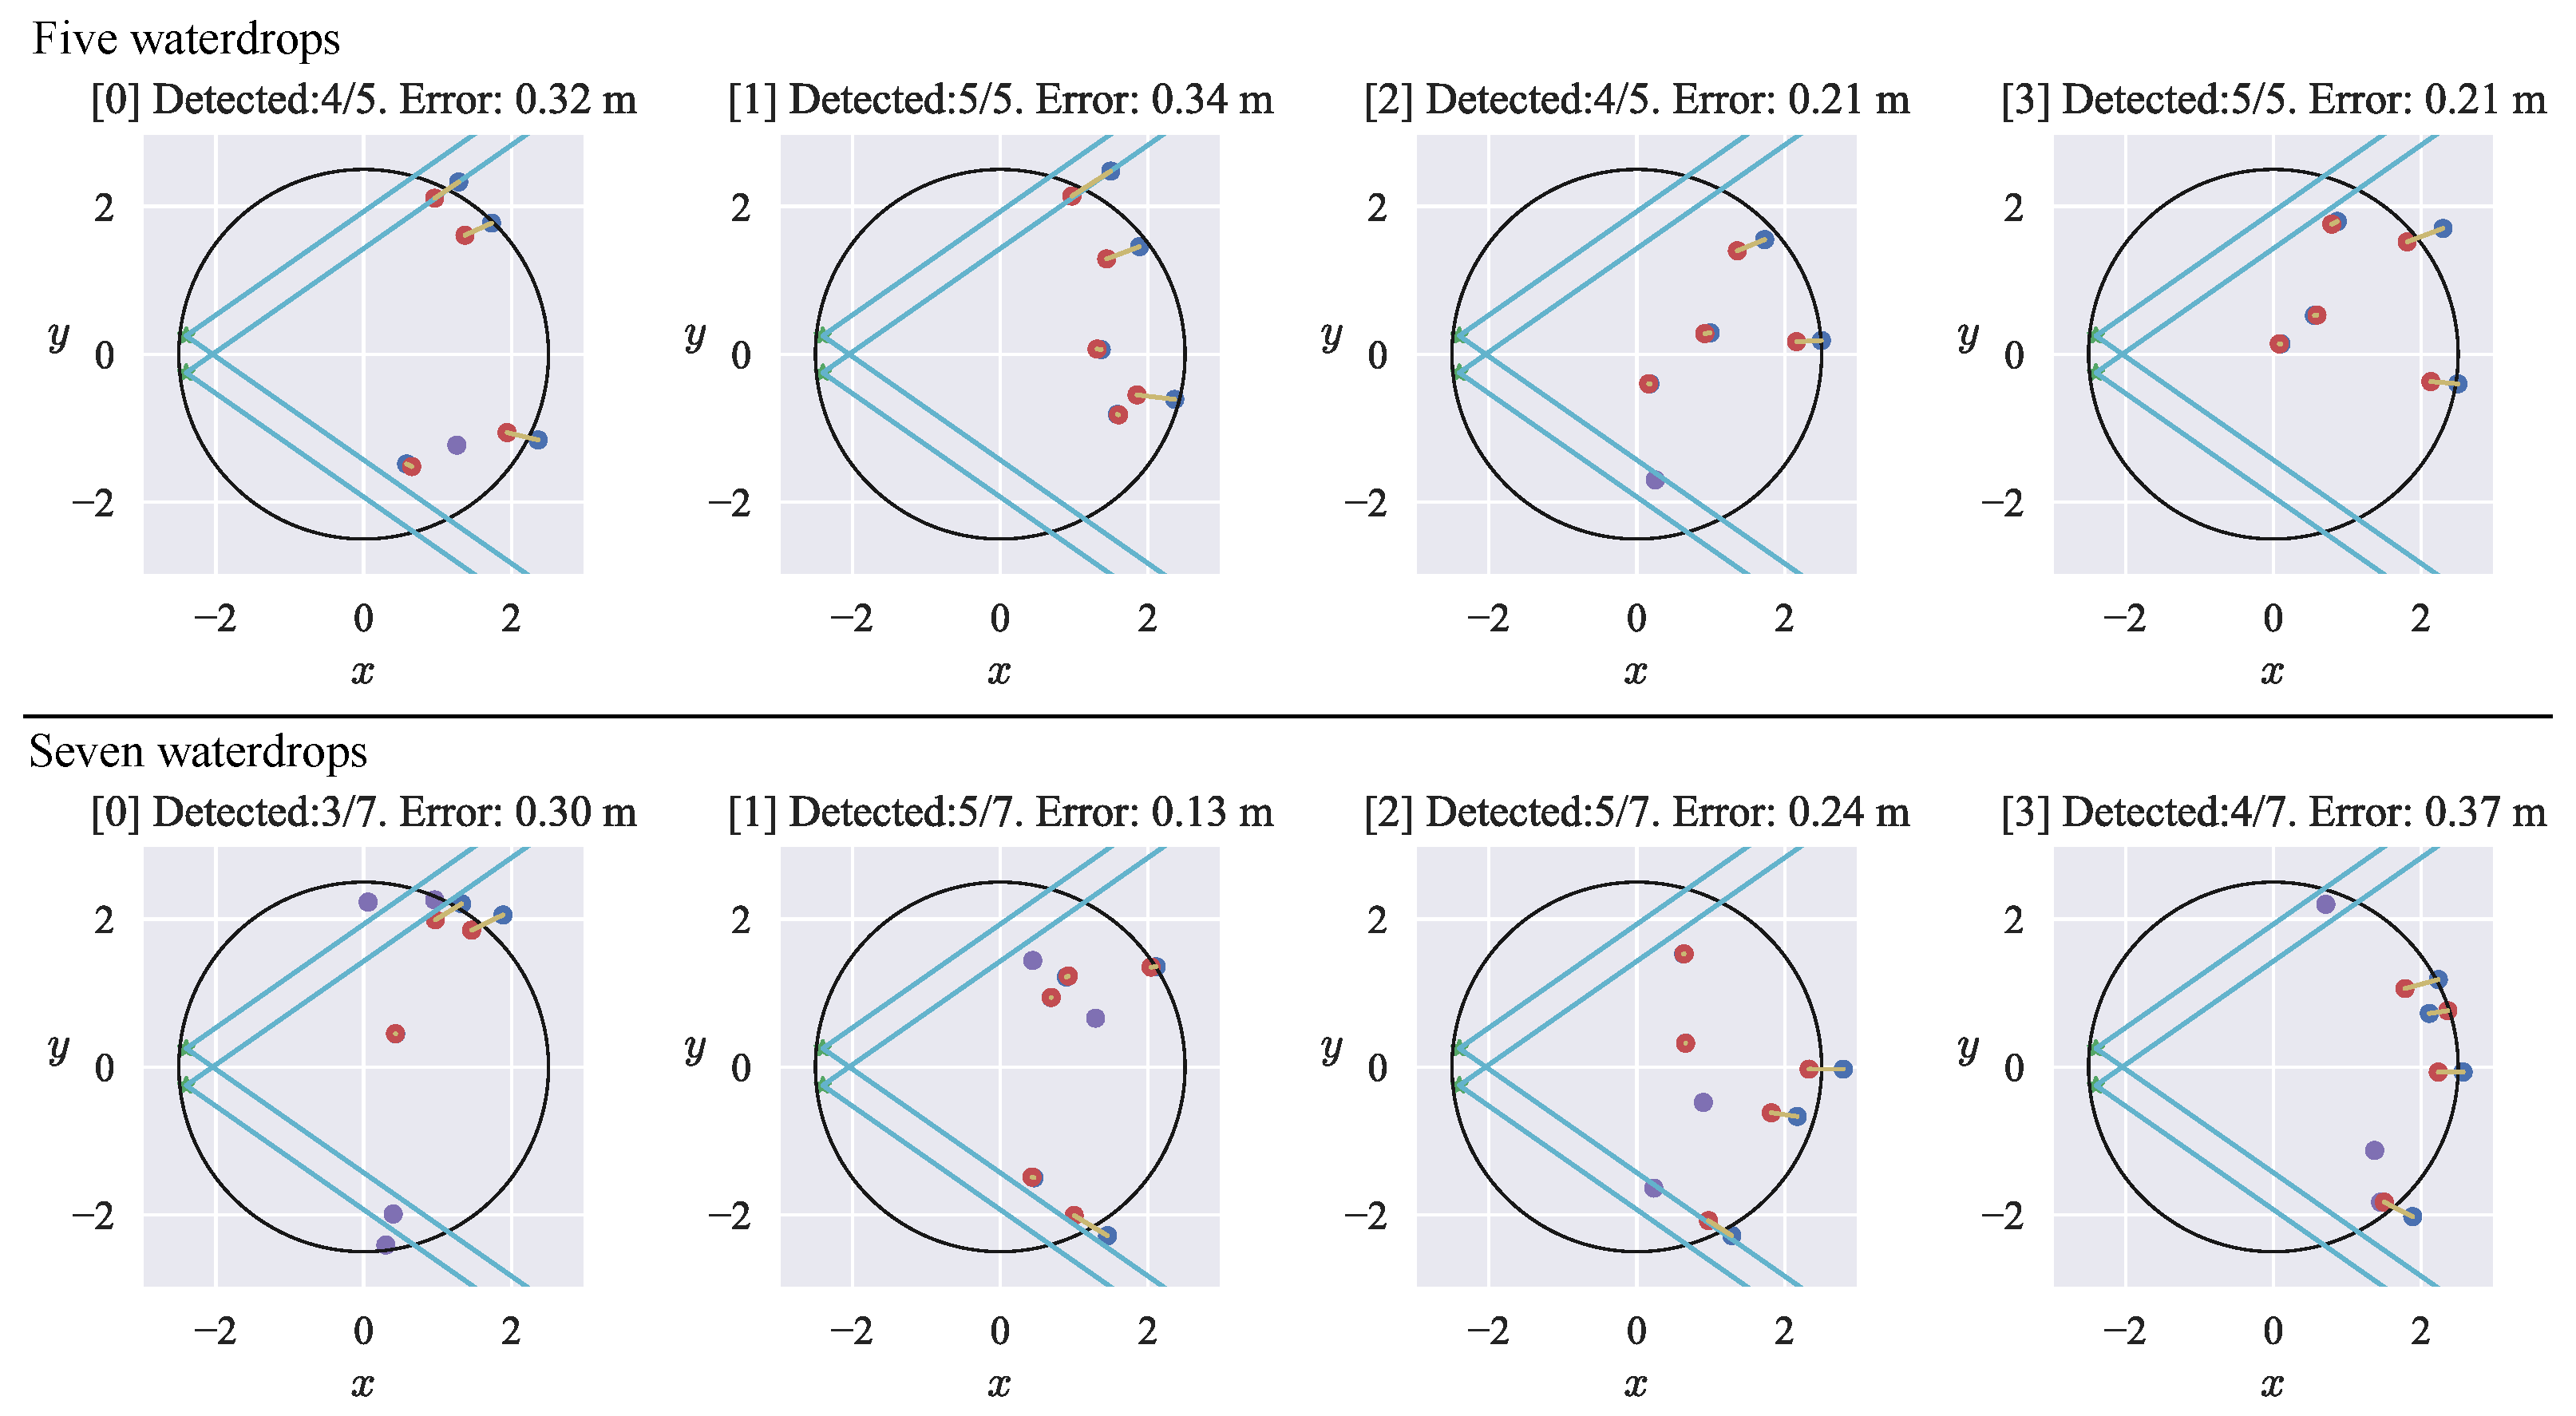
We conducted experiments to evaluate the performance of the proposed method in scenarios with more than three leakage positions. The results of scenarios with five and seven waterdrops are presented in
Figure 8. In
Figure 8, the detections and mean errors of the estimated leakage positions are indicated above the figures, and the yellow lines represent the estimation errors. Similarly to the result with
three separated waterdrops, the errors were small if waterdrops were not generated near the walls, which indicates the number of waterdrops does not affect the accuracy of the leakage position estimation.
However, the detection rates were low if the number of waterdrops was large because the chances of waterdrops occluding each other increasing. If waterdrops were occluded in the stereo images, the proposed method failed to detect them as separate waterdrops. Furthermore, the proposed method failed to estimate the leakage positions outside of the fields of view of the stereo cameras, as can be seen in
Figure 8, where the fields of view of the stereo cameras are illustrated as the cyan lines. It is worth noting that the use of a wider field of view camera would improve the detection rate of the proposed method.
In conclusion, the proposed method can estimate multiple leakage positions if the waterdrops are captured by both cameras and not occluded in the stereo images.
6. Conclusions
In this study, we proposed a method for estimating the leakage positions in the pedestal of the FDNPP using a stereo camera. The leakage positions are estimated by detecting, matching, and triangulating waterdrop trajectories in the stereo images. The leakage position estimation is important because the estimation would give the rough distribution of the unknown fuel debris on the floor of the pedestal, which should be removed for decommissioning. The challenge was to distinguish and match waterdrop trajectories from images with severe radiation noise owing to fuel debris in the pedestal. We assumed that the waterdrops fell vertically without wind; therefore, the waterdrop trajectories could be captured as vertical lines in the images by aligning the pan axis of the stereo camera with gravity. As a waterdrop appeared at a certain column index in an image, a vector of the column pixels was utilized as an image feature. In this study, the aggregated value of the column pixels was employed to detect the waterdrop trajectory lines in the images, and the vector of the column pixels was used to match the waterdrop trajectories between the left and right images. We simulated the pedestal in Unit 2 of the FDNP, and the proposed method succeeded in estimating the leakage positions from stereo images with severe radiation noise.
During the experiments, our method only failed to detect waterdrops due to two conditions: if the waterdrop only appeared to only one of the stereo cameras or none of them; second, if the waterdrops were occluded in the stereo images. Therefore, the radiation noise did not affect the detection rate, which demonstrates the robustness of the proposed method against radiation noise.
The worst mean error of the estimated leakage position was 0.37 m, and 0.37 m is 7.4% of 5 m, which is the diameter of the pedestal. In the current FDNPP situation with a lot of uncertainty, we believe errors lower than 10% would be beneficial for decommissioning. Furthermore, the experimental results suggested that shadows degrade the accuracy of the proposed method. Thus, there is room for improvement in deciding on the locations of multiple light sources. Therefore, we believe that the proposed method would be beneficial for estimating the rough distribution of the fuel debris that fell through the damage to the bottom of the RPV. We hope that our proposed system can be applied to the actual pedestal in the FDNPP and help with decommissioning.
The proposed method was specifically designed for scenarios with leakages and high radiation noise. At the moment, the FDNPP is the only applicable situation for the proposed method. However, in the future, there might be a similar nuclear accident where a hydrogen explosion occurs, followed by the nuclear meltdown; therefore, the proposed method might be useful in the future.
As future work, in addition to using multiple light sources, investigating the optimal frame rate for the stereo cameras is worth exploring. On one hand, capturing at a lower frame rate produces longer waterdrop trajectories, which would be helpful for detecting and matching the trajectories using our method. However, the stereo images would have more accumulated radiation noise. On the other hand, capturing at a higher frame rate produces shorter waterdrop trajectories, which would make it difficult for the proposed method to detect and match the trajectories. In contrast, the total radiation noise in the image would be lower due to a shorter exposure time. It is worth noting that less radiation noise in an image does not necessarily mean less noise in the images because the gain of the cameras also increases with a shorter exposure time, which might emphasize noise that is not noticeable with a fewer frame rate. Therefore, extensive investigation on the optimal frame rate will be required.
Author Contributions
Conceptualization, H.X., R.K., H.W., A.Y. and H.A.; methodology, H.X., R.K. and H.W.; software, H.X. and R.K.; validation, H.X., R.K. and H.W.; formal analysis, H.X. and R.K.; investigation, H.X. and R.K.; writing—original draft preparation, H.X. and R.K.; writing—review and editing, R.K.; visualization, H.X. and R.K.; supervision, A.Y. and H.A.; project administration, H.A.; funding acquisition, H.A. All authors have read and agreed to the published version of the manuscript.
Funding
A part of this work is financially supported by the Nuclear Energy Science and Technology and Human Resource Development Project (through concentrating wisdom) from the Japan Atomic Energy Agency/Collaborative Laboratories for Advanced Decommissioning Science.
Institutional Review Board Statement
Not applicable.
Informed Consent Statement
Not applicable.
Data Availability Statement
Conflicts of Interest
The authors declare no conflict of interest.
References
- Kawatsuma, S.; Fukushima, M.; Okada, T. Emergency response by robots to fukushima-daiichi accident: Summary and lessons learned. Ind. Robot. Int. J. 2012, 39, 428–435. [Google Scholar] [CrossRef]
- Kawatsuma, S. Contribution by incorporation of laser technology and robotics technology for Fukushima Daiichi Nuclear Power Plants Decommissioning. Reza Kenkyu 2017, 45, 413–417. [Google Scholar]
- TEPCO. Investigation Inside the Reactor Primary Containment Vessel. Available online: https://www.tepco.co.jp/en/decommision/planaction/pcv/index-e.html (accessed on 23 July 2021).
- TEPCO. 2018.1.22 Unit 2 PCV Internal Investigation. Available online: https://www.tepco.co.jp/en/news/library/archive-e.html?video_uuid=uikti9fd&catid=61785 (accessed on 23 July 2021).
- TEPCO. Fukushima Daiichi Nuclear Power Station Unit 2 Primary Containment Vessel Internal Investigation Results. Available online: https://www4.tepco.co.jp/en/nu/fukushima-np/handouts/2018/images/handouts_180201_01-e.pdf (accessed on 23 July 2021).
- Nagatani, K.; Kiribayashi, S.; Okada, Y.; Otake, K.; Yoshida, K.; Tadokoro, S.; Nishimura, T.; Yoshida, T.; Koyanagi, E.; Fukushima, M.; et al. Emergency response to the nuclear accident at the fukushima daiichi nuclear power plants using mobile rescue robots. J. Field Robot. 2013, 30, 44–63. [Google Scholar] [CrossRef]
- Komatsu, R.; Fujii, H.; Kono, H.; Tamura, Y.; Yamashita, A.; Asama, H. Bird’s-eye view image generation with camera malfunction in irradiation environment. In Proceedings of the 6th International Conference on Advanced Mechatronics, Tokyo, Japan, 5–8 December 2015; pp. 177–178. [Google Scholar]
- Xu, H.; Komatsu, R.; Woo, H.; Faragasso, A.; Yamashita, A.; Asama, H. Camera orientation estimation in leaking indoor environment via vanishing point of water drops. In Proceedings of the 2020 IEEE International Symposium on Safety, Security, and Rescue Robotics, Abu Dhabi, United Arab Emirates, 4–6 November 2020; pp. 176–181. [Google Scholar]
- Kikura, H.; Ihara, T.; Kawachi, T. Study on ultrasonic measurement for determination of leakage from reactor vessel and debris inspection. In Proceedings of the 2015 National Conference on Nuclear Science and Technology, Da Nang City, Vietnam, 5–7 August 2015; pp. 1–11. [Google Scholar]
- Wang, Z.; Endo, G.; Takahashi, M.; Nabae, H.; Suzumori, K.; Nobuyoshi, T.; Takahashi, H.; Kimoto, K.; Ihara, T.; Kikura, H. Study of a robotic system to detect water leakage and fuel debris-System proposal and feasibility study of visual odometry providing intuitive bird’s eye view. ROBOMECH J. 2020, 7, 1–15. [Google Scholar] [CrossRef]
- Penteado, C.; Olivatti, Y.; Lopes, G.; Rodrigues, P.; Filev, R.; Aquino, P.T. Water leaks detection based on thermal images. In Proceedings of the 2018 IEEE International Smart Cities Conference, Kansas City, MO, USA, 16–19 September 2018; pp. 1–8. [Google Scholar]
- Pauline, E.; Meza, G.R. Water leak detection by termographic image analysis, in laboratory tests. Proceedings 2020, 48, 15. [Google Scholar] [CrossRef] [Green Version]
- Xue, Y.; Cai, X.; Shadabfara, M.; Shaob, H.; Zhang, S. Deep learning-based automatic recognition of water leakage area in shield tunnel lining. Tunn. Undergr. Space Technol. 2020, 104, 103524. [Google Scholar] [CrossRef]
- Filgueira, A.; González-Jorge, H.; Lagüela, S.; Díaz-Vilariño, L.; Arias, P. Quantifying the influence of rain in LiDAR performance. Measurement 2017, 95, 143–148. [Google Scholar] [CrossRef]
- Yamashita, A.; Tanaka, Y.; Kaneko, T. Removal of adherent waterdrops from images acquired with stereo camera. In Proceedings of the 2005 IEEE/RSJ International Conference on Intelligent Robots and Systems, Edmonton, AB, Canada, 2–6 August 2005; pp. 400–405. [Google Scholar]
- You, S.; Tan, R.T.; Kawakami, R.; Mukaigawa, Y.; Ikeuchi, K. Adherent raindrop modeling, detection and removal in video. IEEE Trans. Pattern Anal. Mach. Intell. 2015, 38, 1721–1733. [Google Scholar] [CrossRef] [PubMed]
- Zivkovic, Z.; Heijden, F.V.D. Efficient adaptive density estimation per image pixel for the task of background subtraction. Pattern Recognit. Lett. 2006, 27, 773–780. [Google Scholar] [CrossRef]
- Hartley, R.; Zisserman, A. Multiple View Geometry in Computer Vision; Cambridge University Press: Cambridge, UK, 2003. [Google Scholar]
- Blender Foundation. Blender—A 3D Modelling and Rendering Package. Available online: http://www.blender.org (accessed on 23 July 2021).
- TEPCO. Unit 2 Primary Containment Vessel Investigation at Fukushima Daiichi Nuclear Power Station (by the Self-Propelled Investigation Device). Available online: https://www.tepco.co.jp/en/nu/fukushima-np/handouts/2017/images/handouts_170215_01-e.pdf (accessed on 23 July 2021).
- Blender Foundation. Cycles Open Source Production Rendering. Available online: https://www.cycles-renderer.org (accessed on 23 July 2021).
- Komatsu, R.; Woo, H.; Tamura, Y.; Yamashita, A.; Asama, H. Gamma-ray image noise generation using energy-image converter based on image histogram. In Proceedings of the 2021 IEEE/SICE International Symposium on System Integration, Iwaki, Fukushima, Japan, 11–14 January 2021; pp. 93–99. [Google Scholar]
- Agostinelli, S.; Allison, J.; Amako, K.; Apostolakis, J.; Araujo, H.; Arce, P.; Asai, M.; Axen, D.; Banerjee, S.; Barrand, G.; et al. Geant4—A simulation toolkit. Nucl. Instrum. Methods Phys. Res. Sect. A Accel. Spectrometers Detect. Assoc. Equip. 2003, 506, 250–303. [Google Scholar] [CrossRef] [Green Version]
- Allison, J.; Amako, K.; Apostolakis, J.; Arce, P.; Asai, M.; Aso, T.; Bagli, E.; Bagulya, A.; Banerjee, S.; Barrand, G.; et al. Recent developments in Geant4. Nucl. Instrum. Methods Phys. Res. Sect. A Accel. Spectrometers Detect. Assoc. Equip. 2016, 835, 186–225. [Google Scholar] [CrossRef]
Figure 1.
The inspection system inserted into the pedestal below the RPV of Unit 2. (a) Pedestal where water leaks from the damaged area. The inspection system is inserted into the pedestal through the X-6 penetration. (b) The stereo camera mounted on the inspection system with a rotating base.
Figure 1.
The inspection system inserted into the pedestal below the RPV of Unit 2. (a) Pedestal where water leaks from the damaged area. The inspection system is inserted into the pedestal through the X-6 penetration. (b) The stereo camera mounted on the inspection system with a rotating base.
Figure 2.
Overview of the proposed method. (a) Capturing waterdrops for a few seconds using a stereo camera in the pedestal. Blue eclipses represent waterdrops, and white circles and lines represent the radiation noise in the stereo images. (b) Waterdrop trajectory detection and matching. The red and green rectangles represent the corresponding trajectories. (c) Estimation of the leakage position by triangulating the corresponding trajectory lines. The concept of the triangulation is illustrated as dot lines, and the cyan stars on the inspection system represent the stereo cameras. This figure illustrates a top view of the pedestal.
Figure 3.
Waterdrop trajectory detection. (a) Images obtained after background subtraction. Waterdrops and radiation noise are extracted from the images. (b) Vertically ggregated values of . (c) Waterdrop trajectory detection followed by non-maximum suppression. The red rectangles represent the final detection results.
Figure 4.
The simulated pedestal of Unit 2 in FDNPP for the experiment. A stereo camera was placed in the pedestal using a single light source. Waterdrops were dripping from above.
Figure 4.
The simulated pedestal of Unit 2 in FDNPP for the experiment. A stereo camera was placed in the pedestal using a single light source. Waterdrops were dripping from above.
Figure 5.
The coordinate system of the simulated environment. The origin of the coordinates is at the center of the pedestal where the z-axis is in the direction of gravity.
Figure 5.
The coordinate system of the simulated environment. The origin of the coordinates is at the center of the pedestal where the z-axis is in the direction of gravity.
Figure 6.
Intermediate representation of proposed method. (a) Input stereo image with radiation noise. Please check the supplemental video. (b) Images obtained after background subtraction, . (c) Vertically aggregated values of .
Figure 6.
Intermediate representation of proposed method. (a) Input stereo image with radiation noise. Please check the supplemental video. (b) Images obtained after background subtraction, . (c) Vertically aggregated values of .
Figure 7.
Ground truth and estimated values of the leakage positions of three separated waterdrops. The results of all ten different scenes are combined together. Only detected waterdrops are illustrated. (a) Noise level L. (b) Noise level M. (c) Noise level H. The red and blue dots indicate the ground truth and estimated leakage positions, respectively. The yellow lines illustrate the correspondence of the ground truth with the estimated leakage positions. The camera positions are also illustrated as the greed dots for reference.
Figure 8.
Ground truth and estimated leakage positions. The first row and second row are the results with five and seven leakage positions, respectively. The number of detections and mean error of the estimated leakage positions are indicated above each figure. The red and blue dots indicate the ground truth and estimated leakage positions, respectively. The yellow lines illustrate the correspondence of the ground truth with the estimated leakage positions. The leakage positions that were not detected are represented as the purple dots. For reference, the camera positions and the fields of the view are illustrated as the greed dots and the cyan lines, respectively.
Table 1.
Leakage positions (m) of three crowded waterdrops.
Table 1.
Leakage positions (m) of three crowded waterdrops.
| Scene | Leakage 1 | Leakage 2 | Leakage 3 |
|---|
| 1 | | | |
| 2 | | | |
| 3 | | | |
| 4 | | | |
| 5 | | | |
| 6 | | | |
| 7 | | | |
| 8 | | | |
Table 2.
Results of the leakage detection of three separated waterdrops.
Table 2.
Results of the leakage detection of three separated waterdrops.
| Noise Level | Detected Number (Max 30) | Detected Rate [%] |
|---|
| L | 26 | 86.7 |
| M | 26 | 86.7 |
| H | 26 | 86.7 |
Table 3.
Results of leakage position estimation of three separated waterdrops ().
Table 3.
Results of leakage position estimation of three separated waterdrops ().
| Noise Level | Error (Mean ± SD) [m] |
|---|
| L | 0.22 ± 0.25 |
| M | 0.22 ± 0.24 |
| H | 0.22 ± 0.23 |
Table 4.
Result of leakage position estimations with different .
Table 4.
Result of leakage position estimations with different .
| Detected Number (Max 30) | Detected Rate [%] | Error (Mean ± SD) [m] |
|---|
| 3 | 27 | 90.0 | 0.37 ± 0.78 |
| 6 | 27 | 90.0 | 0.36 ± 0.84 |
| 12 | 27 | 90.0 | 0.34 ± 0.67 |
| 18 | 26 | 86.7 | 0.22 ± 0.24 |
| 24 | 26 | 86.7 | 0.22 ± 0.23 |
Table 5.
Results of leakage position estimations with three crowded waterdrops.
Table 5.
Results of leakage position estimations with three crowded waterdrops.
| Noise | Detected Number (Max 24) | Detected Rate [%] | Error (Mean ± SD) [m] |
|---|
| L | 22 | 91.7 | 0.05 ± 0.05 |
| M | 22 | 91.7 | 0.05 ± 0.06 |
| H | 22 | 91.7 | 0.06 ± 0.07 |
| Publisher’s Note: MDPI stays neutral with regard to jurisdictional claims in published maps and institutional affiliations. |
© 2021 by the authors. Licensee MDPI, Basel, Switzerland. This article is an open access article distributed under the terms and conditions of the Creative Commons Attribution (CC BY) license (https://creativecommons.org/licenses/by/4.0/).


