1. Introduction
In railway freight transport, there might be decoupling accidents that would seriously threaten a train’s operation safety. As shown in
Table 1, according to the analysis of train integrity-related accidents or events caused by train couplers and traction devices in the United States in the past 40 years (1975–2015) [
1], coupler breakage, caused by acceleration, and fault of management or maintenance, leads to train vehicle separation. Without protection, the left behind train vehicles will lead to rear-end collision with the approaching train, which would cause severe casualties and economic loss. Train integrity detection means checking and reporting on train completeness in movement. The train integrity monitoring system (TMIS) is a signaling platform to ensure trains consistently remain intact. Once trains split unintentionally, TMIS will send alarms to the relevant personnel to take appropriate measures to avoid a collision.
A train integrity monitoring system based on on-board equipment is a low-cost solution for freight trains in middle and low-density railway lines. So far, there are train integrity solutions based on brake air pipe pressure, wireless sensor network, and GNSS as presented in reference [
2,
3,
4,
5,
6]. In these systems, GNSS and other sensors are employed for self-localization and wireless communication. The risks of using GNSS are due to its inherent features [
7], especially for safety relevant TIMS. It is necessary to point out the positioning faults or failures when the GNSS-based position is used in TIMS to ensure a safe and reliable position determination. So, a safety evaluation and verification in the system design phase should be done for the development of GNSS-based TIMS. CPN [
8,
9] has been successfully applied for the modeling and verification of safety-relevant systems, including risk analysis, accident modeling, and system verification [
10,
11,
12]. Colored Petri Net (CPN) is selected as the simulation of train positioning errors for the newly developed GNSS-based TIMS.
The paper is organized as follows. Firstly, system structure and train integrity detection logic of GNSS-based TIMS are introduced. Secondly, the safety of train integrity detection is evaluated based on the positioning errors and protection level using an indicator of Failure per Hour (PFH) to quantify the criteria of SIL, and an experiment-based Monte Carlo simulation verification procedure is proposed. Finally, simulations are carried out by CPN and MATLAB using the statistics from field tests.
2. GNSS-Based Train Integrity Detection
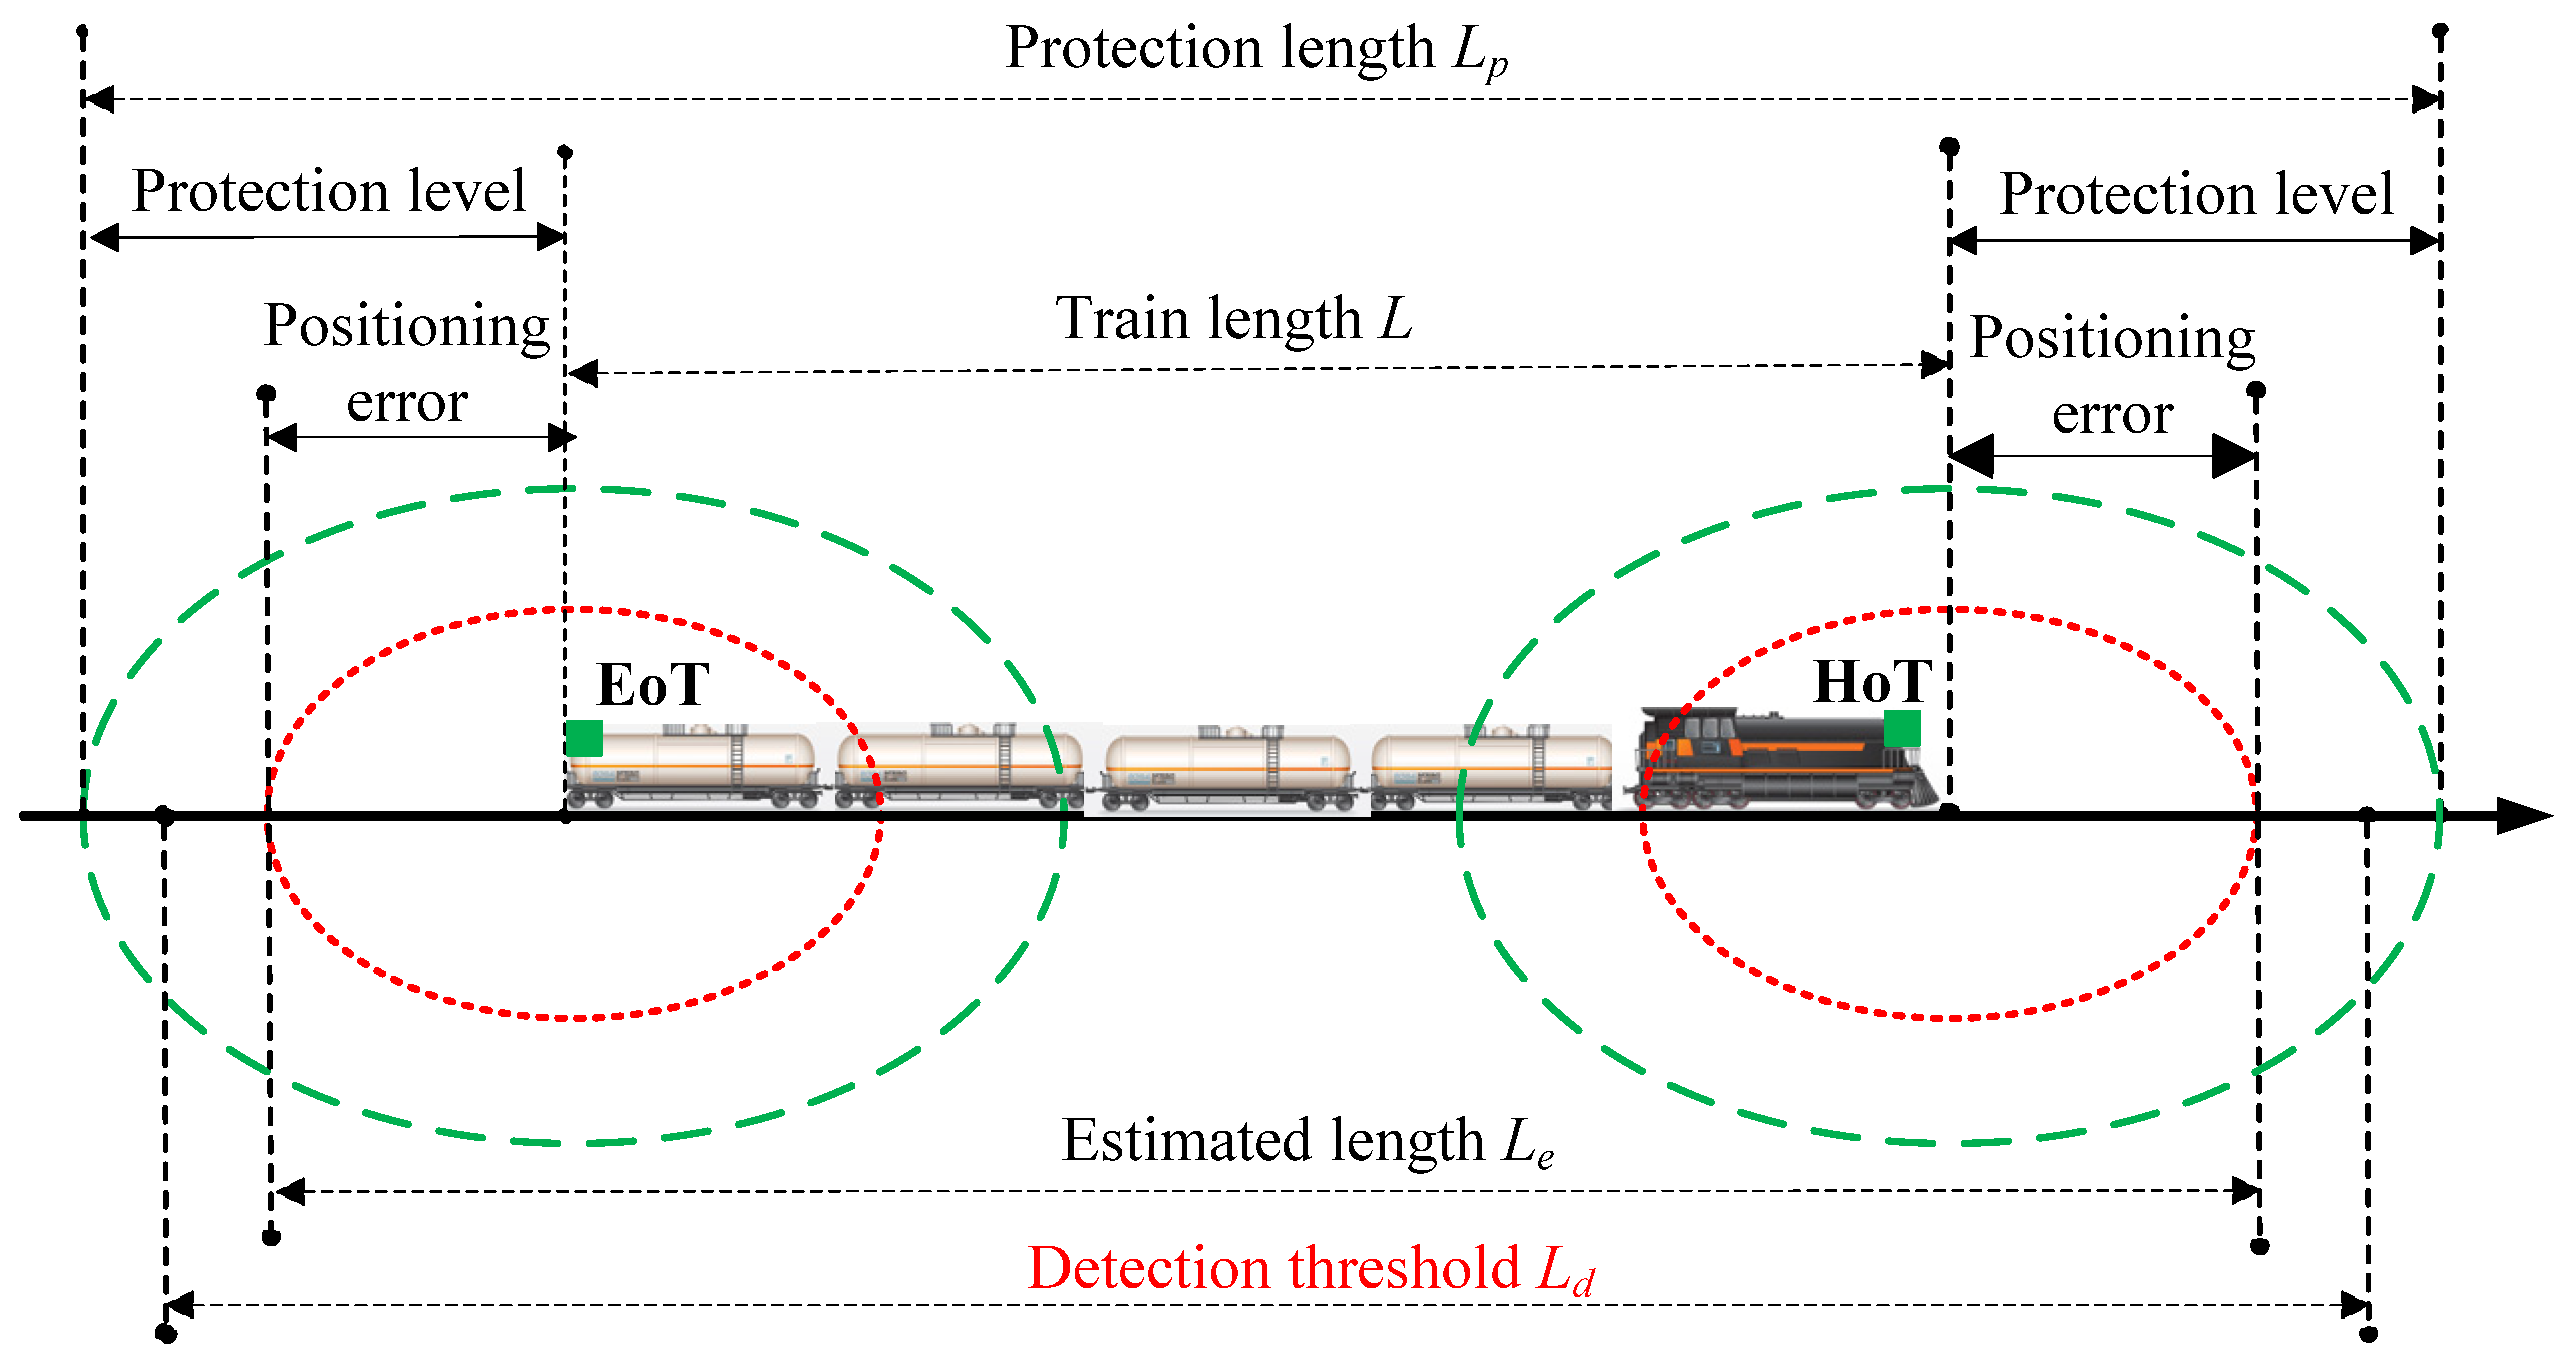
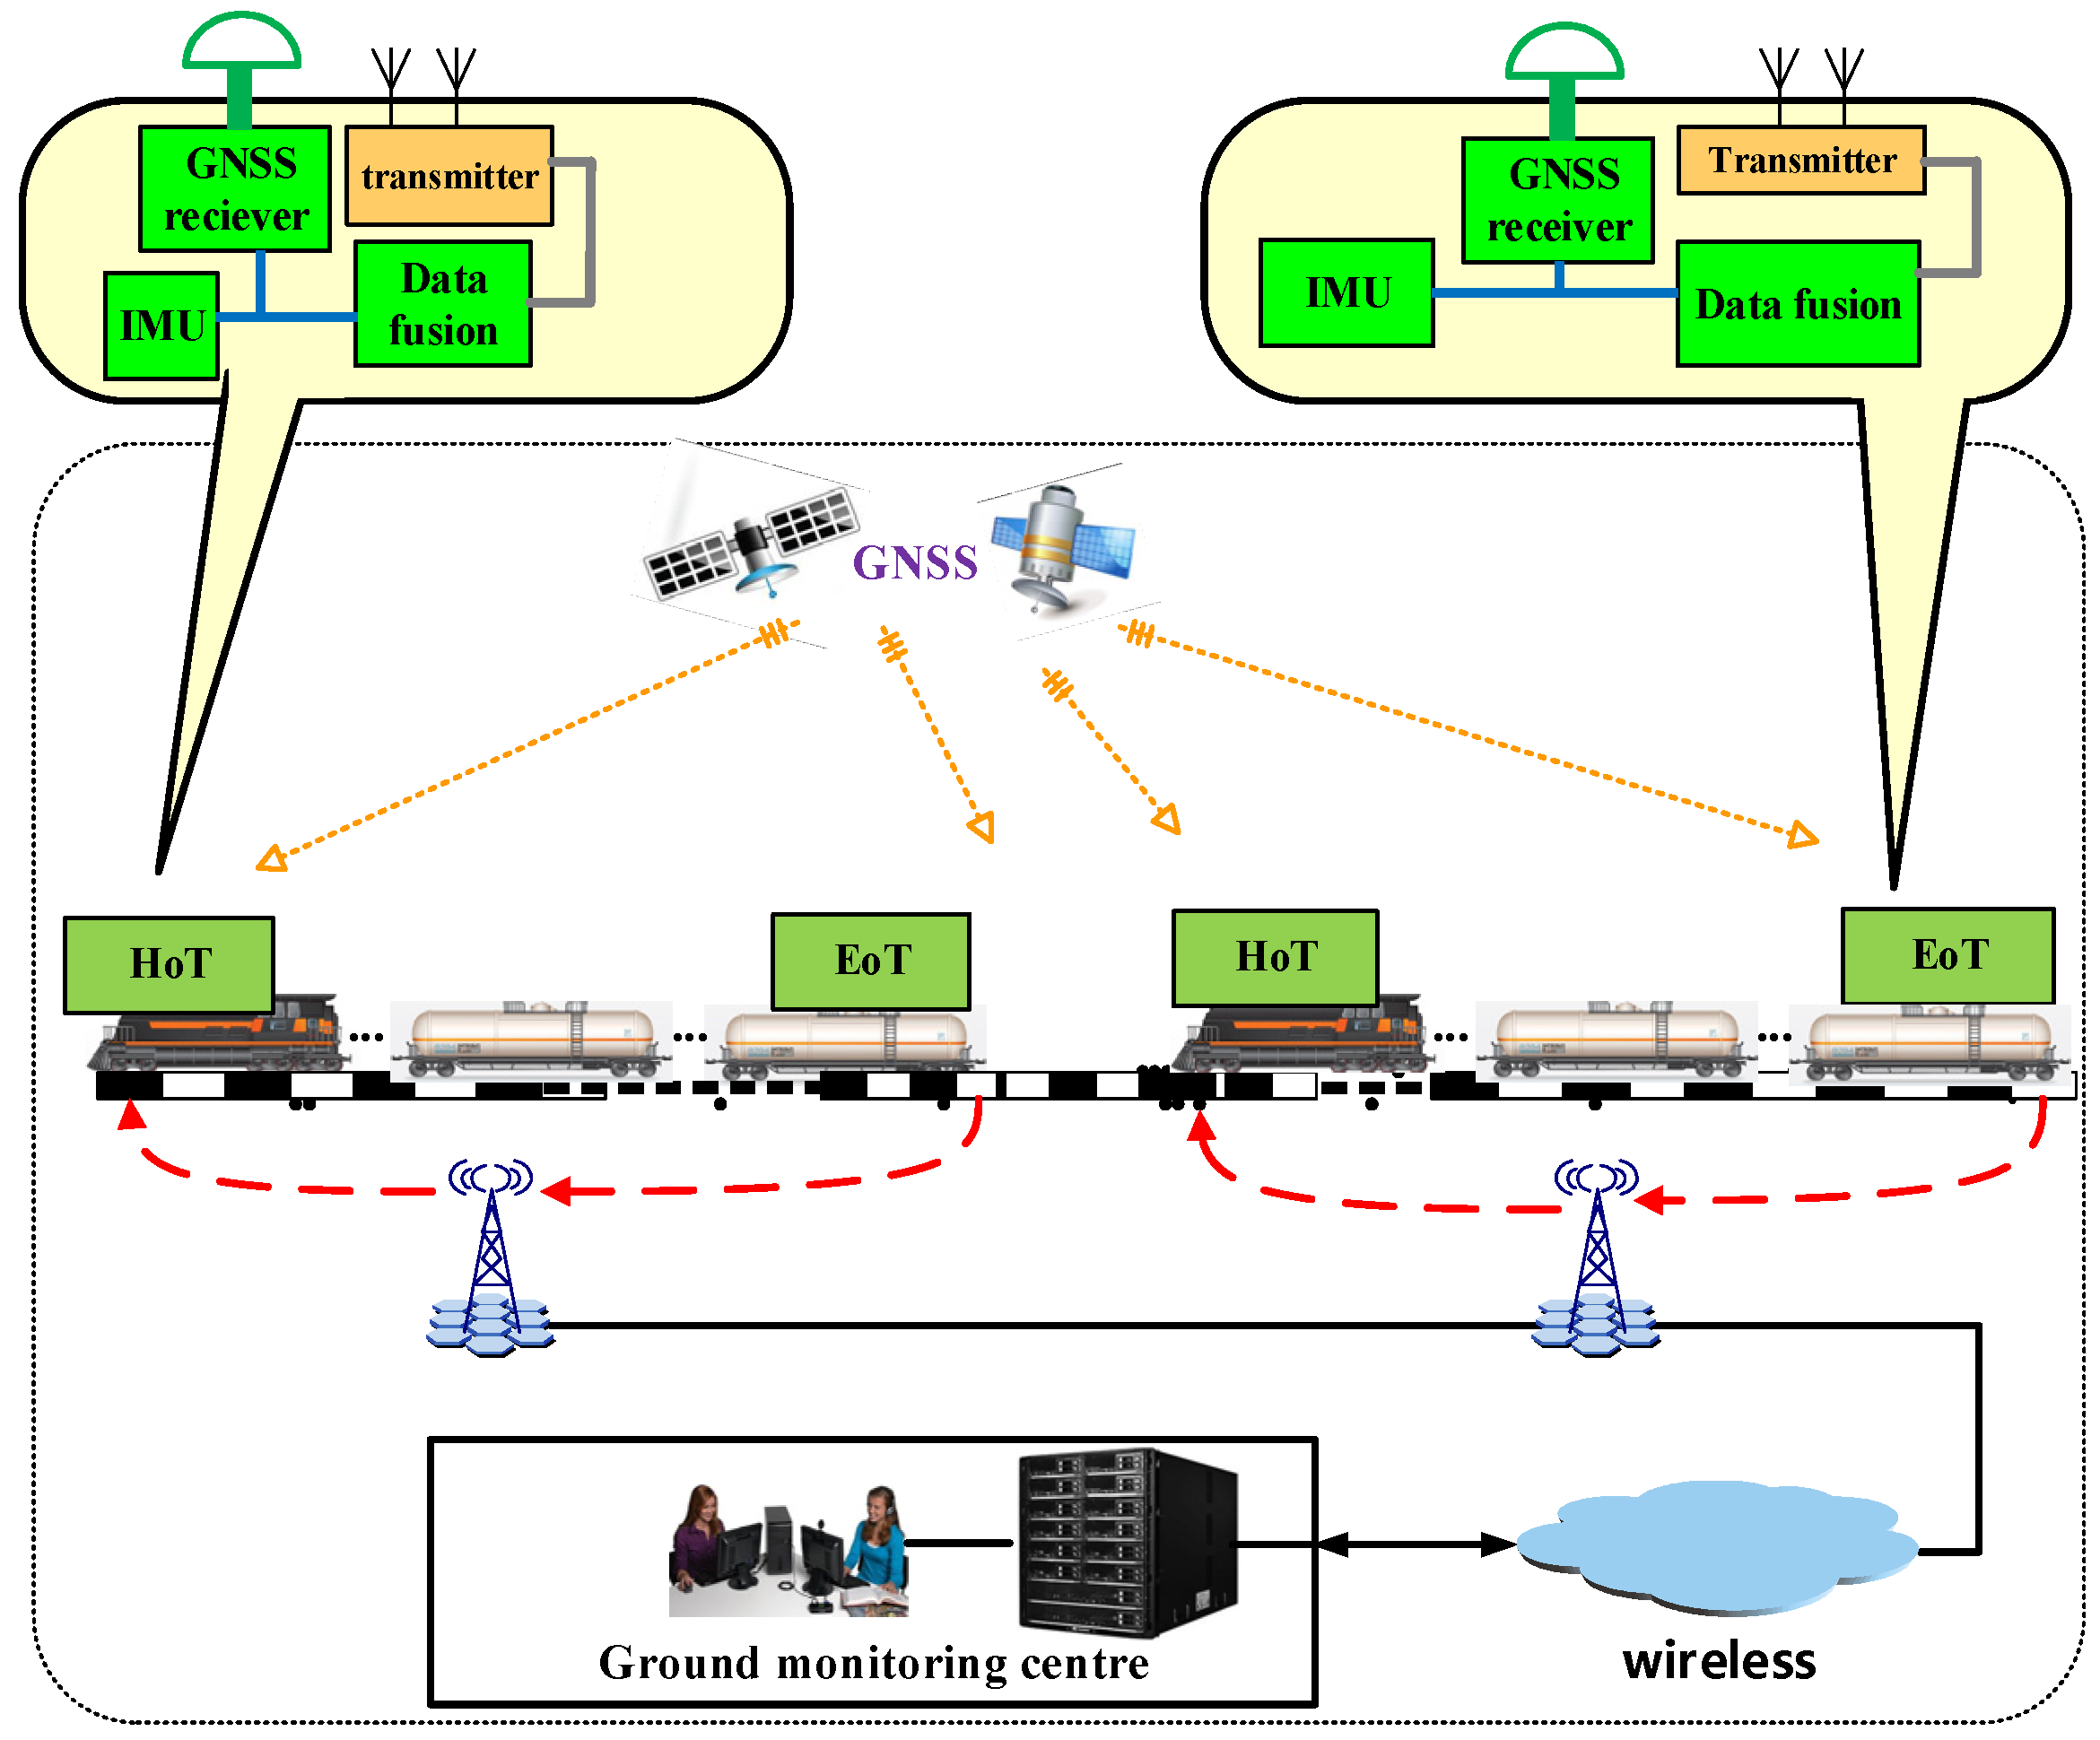
A typical GNSS-based TIMS consists of a ground monitoring center, Head-of-Train (HoT), and End-of-Train (EoT) units. An integrated train positioning system (in
Figure 1), including a BDS, GPS, and inertial measurement unit (IMU), is employed to monitor the dynamic state of trains. EoT-HoT and train-ground communication are achieved by The General Packet Radio Service (GPRS) wireless channel. Messages from EoTs and HoTs are gathered by the train’s integrity detection software in the ground monitoring center, where the train’s integrity decisions are made.
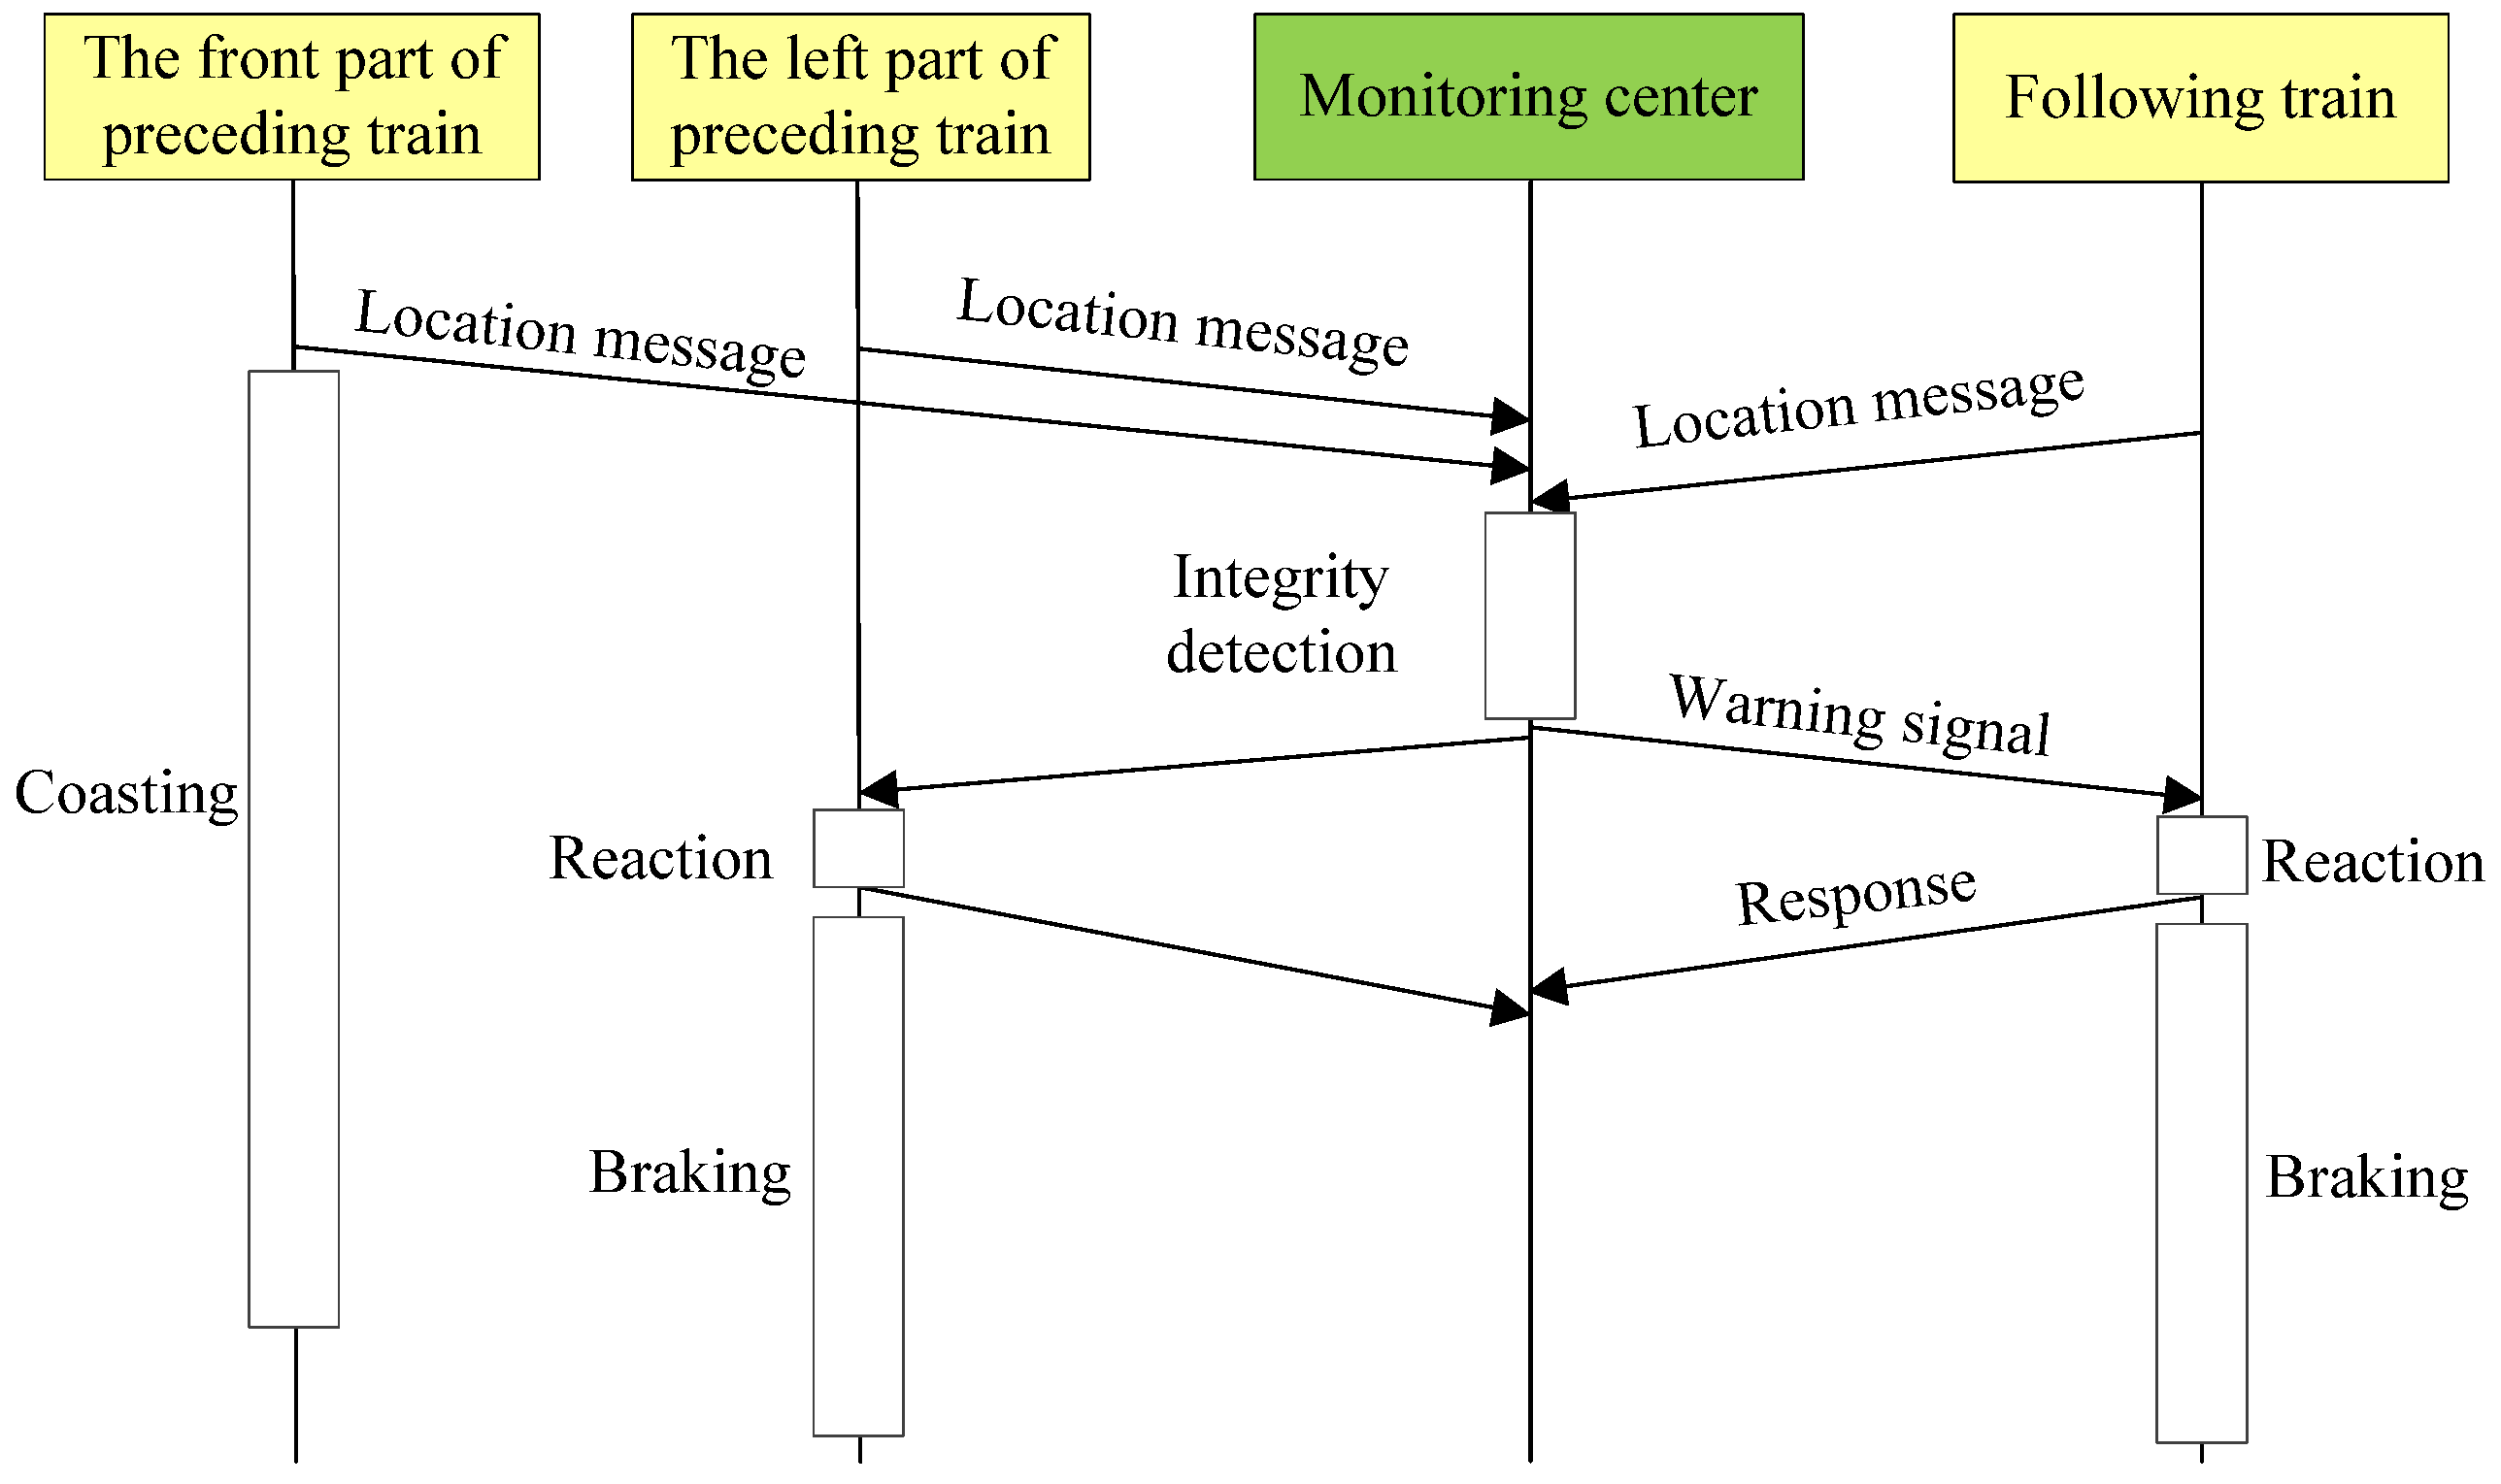
The ground monitoring center receives the train’s location messages, such as traveling mileage, velocity, and direction, and the train’s integrity and potential collision will be detected. Any warning would be sent to the managers and drivers to take safety action to avoid accidents. The TIMS should locate the train position, detect loss of train integrity (accidental train parting) and also point out the potential collision. The detailed timeline of a train’s integrity detection under potential collision risk is illustrated in
Figure 2.
In the GNSS-based TIMS, an undetected train parting is a dangerous failure. When a limited safe time is exceeded, the undetected train breakage will lead to a rear-end collision. For the development of the safety-relevant GNSS-based TIMS, the safety evaluation and verification should be done based on a simulation in the system design phase.
TIMS is based on GPS/BDS and integrated with an IMU sensor to realize train localization. The GNSS-based train position error is the absolute difference between the estimated position and the actual position in two dimensional space [
1,
2], while the protection level (PL) is the uncertainty of location estimation, extending in a bounded domain under a certain confidence probability [
13,
14], bound to the horizontal PL with a probability derived from the integrity requirement (see
Figure 3). Then we can form a safe train position description.
3. Collision Risk Evaluation of Train Integrity Detection
The EN 50129 standard is a common basis for railway executives, recognizing and approving safety-relevant systems for signaling in railway applications [
15]. EN 50129 and EN 50126 [
16] can both quantitatively and qualitatively assess the risk. The IEC 61508 standard [
17] thus defines quantitative safety requirements for each SIL. The quantitative requirements for the standard are summarized in
Table 2, where the SILs are differentiated by using the Probability of dangerous Failure per Hour (PFH), showing the quantitative SIL requirements with a minimal and maximal boundary.
Determining the probabilistic aspects of SIL for safety functions is performed differently [
17]. The supplier designs the system safety and verifies these specifications using the dependability parameters of the components integrated in the system. The Probability of Failure on Demand (PFD) [
17] is used to determine the PFH value related to a SIL (see
Table 2). PFH is calculated during the system design analysis.
In which Ti is the time interval between two proof tests, identical for the different subsystems.
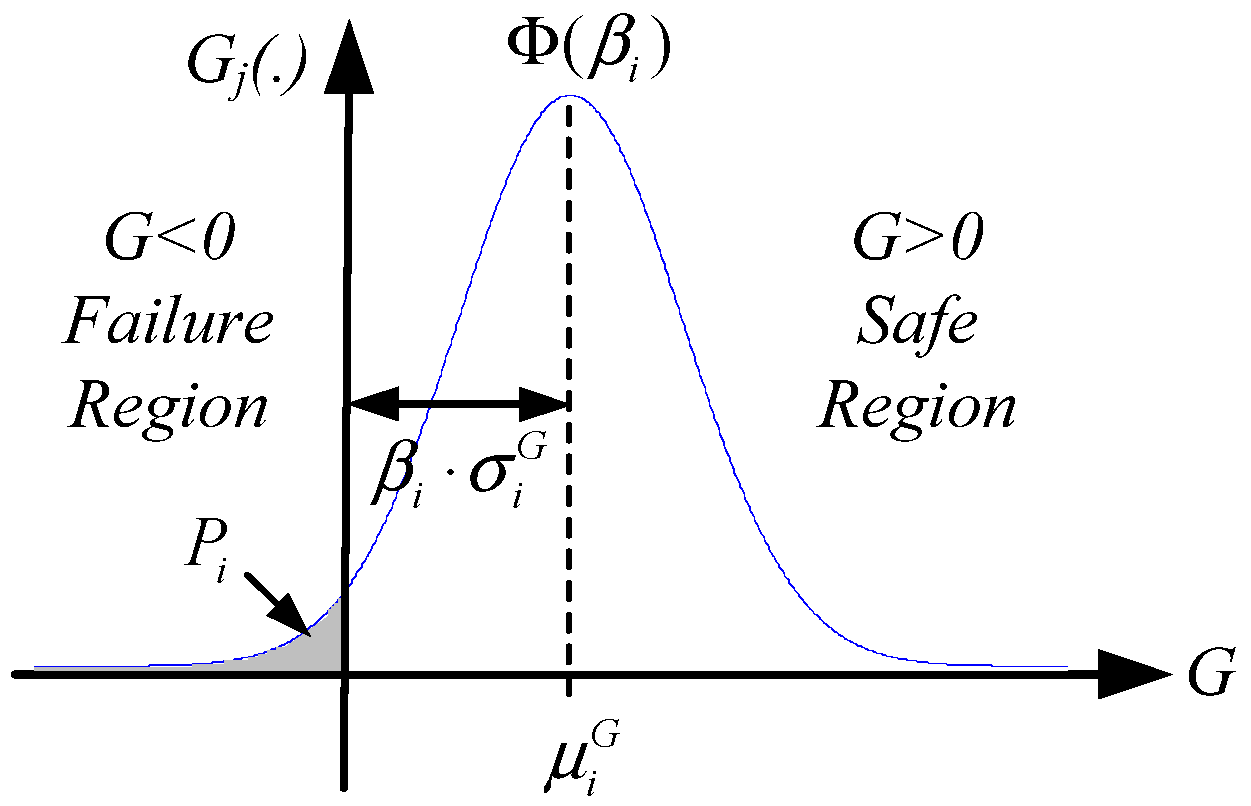
A probabilistic analysis is about assessing the probability that a method is satisfying one or more performance criteria. It is up to the analyst to formulate what constitutes acceptable performance, or conversely failure, for the method under consideration. The limit state concept provides a unified framework for expressing the probability of failure definitions, which defines the boundary between the safe and unsafe regions of the design space. In terms of the detection threshold and measuring results, whether a system is safe or not is captured by one quantity, which is referred to as the performance function and is commonly denoted by
Z. More generally, the performance function may be expressed in terms of all of the basic random variables in the problem:
In which
stands for the probability of the random event in the bracket, and
being the measurement variables. As shown in
Figure 4,
is the limit state function. The notation
denotes the failure region. Likewise,
and
indicate the failure surface and safe region, respectively.
For the GNSS-based train integrity detection, the limit-state indicates the margin of safety between the detection threshold and the estimated train positioning results. The limit state function
can be described as:
where
is the train integrity detection threshold;
are the positioning results. As
Figure 5 shows,
is the estimated train length and
is the train protection length.
We assume in GNSS-based positioning that PE and PL are normally distributed
. The mean and standard deviation of the limit-state,
, can be determined from the elementary definition of the mean and variance,
. Where
is the mean.
and
are the means of D and
, respectively.
is the standard deviation. Thus, the probability of failure is
where
is defined as the safety index. Values of
β for typical values of
are shown in [
18].
is the standard normal cumulative distribution function.
Kalman filter (KF) is employed to solve the Bayesian filtering problem and obtain the state estimation results in GNSS-based train position estimation. Variation of PL is determined by relevant information from the Kalman filtering process. Besides, an efficient way is to project the test statistic to the position domain by using the uncertainty of position estimation.
The first step for identifying PL is to carry out the state estimation by fusing information with the system model and sensor measurement. Assume that
hk denotes the state vector at instant
k that describes the dynamic state of a train moving along the track; the system model for fusion is:
where
is the active transition matrix at time
k;
is the active emission matrix at time
k.
and
are the independent Gaussian transitions and observation noises, and
yk is the observation vector with instant sensor measurement. As the definition of filtering state, the horizontal position uncertainty of PL can be calculated as
where
is the factor determined to reflect the probability of missed detection of PL, and the value
= 6.18 indicates a probability of missed detection of
[
19].
is the is the estimation residual in KF [
14].
For GNSS-based train localization, the probability of failure, risk of GNSS integrity monitoring, which indicates the positioning error exceeding PL, can be calculated as:
where
and
are the mean and variance of the position estimation error
.
Then we can work out the safety risk of train integrity. As shown in
Figure 5, there are two different situations in train integrity monitoring:
The detection threshold
Ld is lower than the measured train length
Le and protection length
Lp. Then,
and the PFD can be derived as:
The detection threshold
Ld is bigger than the measured train length
Le and lower than the protection length
Lp. Then
, and the PFD can be derived as:
If the train parting is still not detected in the limited safe time, a rear-end collision will occur. Then we can get the safety risk for collision in GNSS-based train integrity detection:
where
m is the limited safe time. In the train control system, the time interval between the adjacent two trains is greater than the train braking time, as illustrated in
Table 3 [
20]. There are differences in the train coasting time and braking coefficient between full-service braking and emergency braking. In this paper, the limited safe time
m is chosen as the same as the full-service braking time according to the velocity, and on the assumption that the following train shares the same velocity with the preceding train.
4. Experiments Based Simulation for Collision Risk Verification
For each specific scenario in GNSS-based TIMS constructed from the attributes of the operating situation (both GNSS positioning situation and train motion situation), the probability of a specific event in a scenario depends on the frequency range assigned to the safety function [
21].
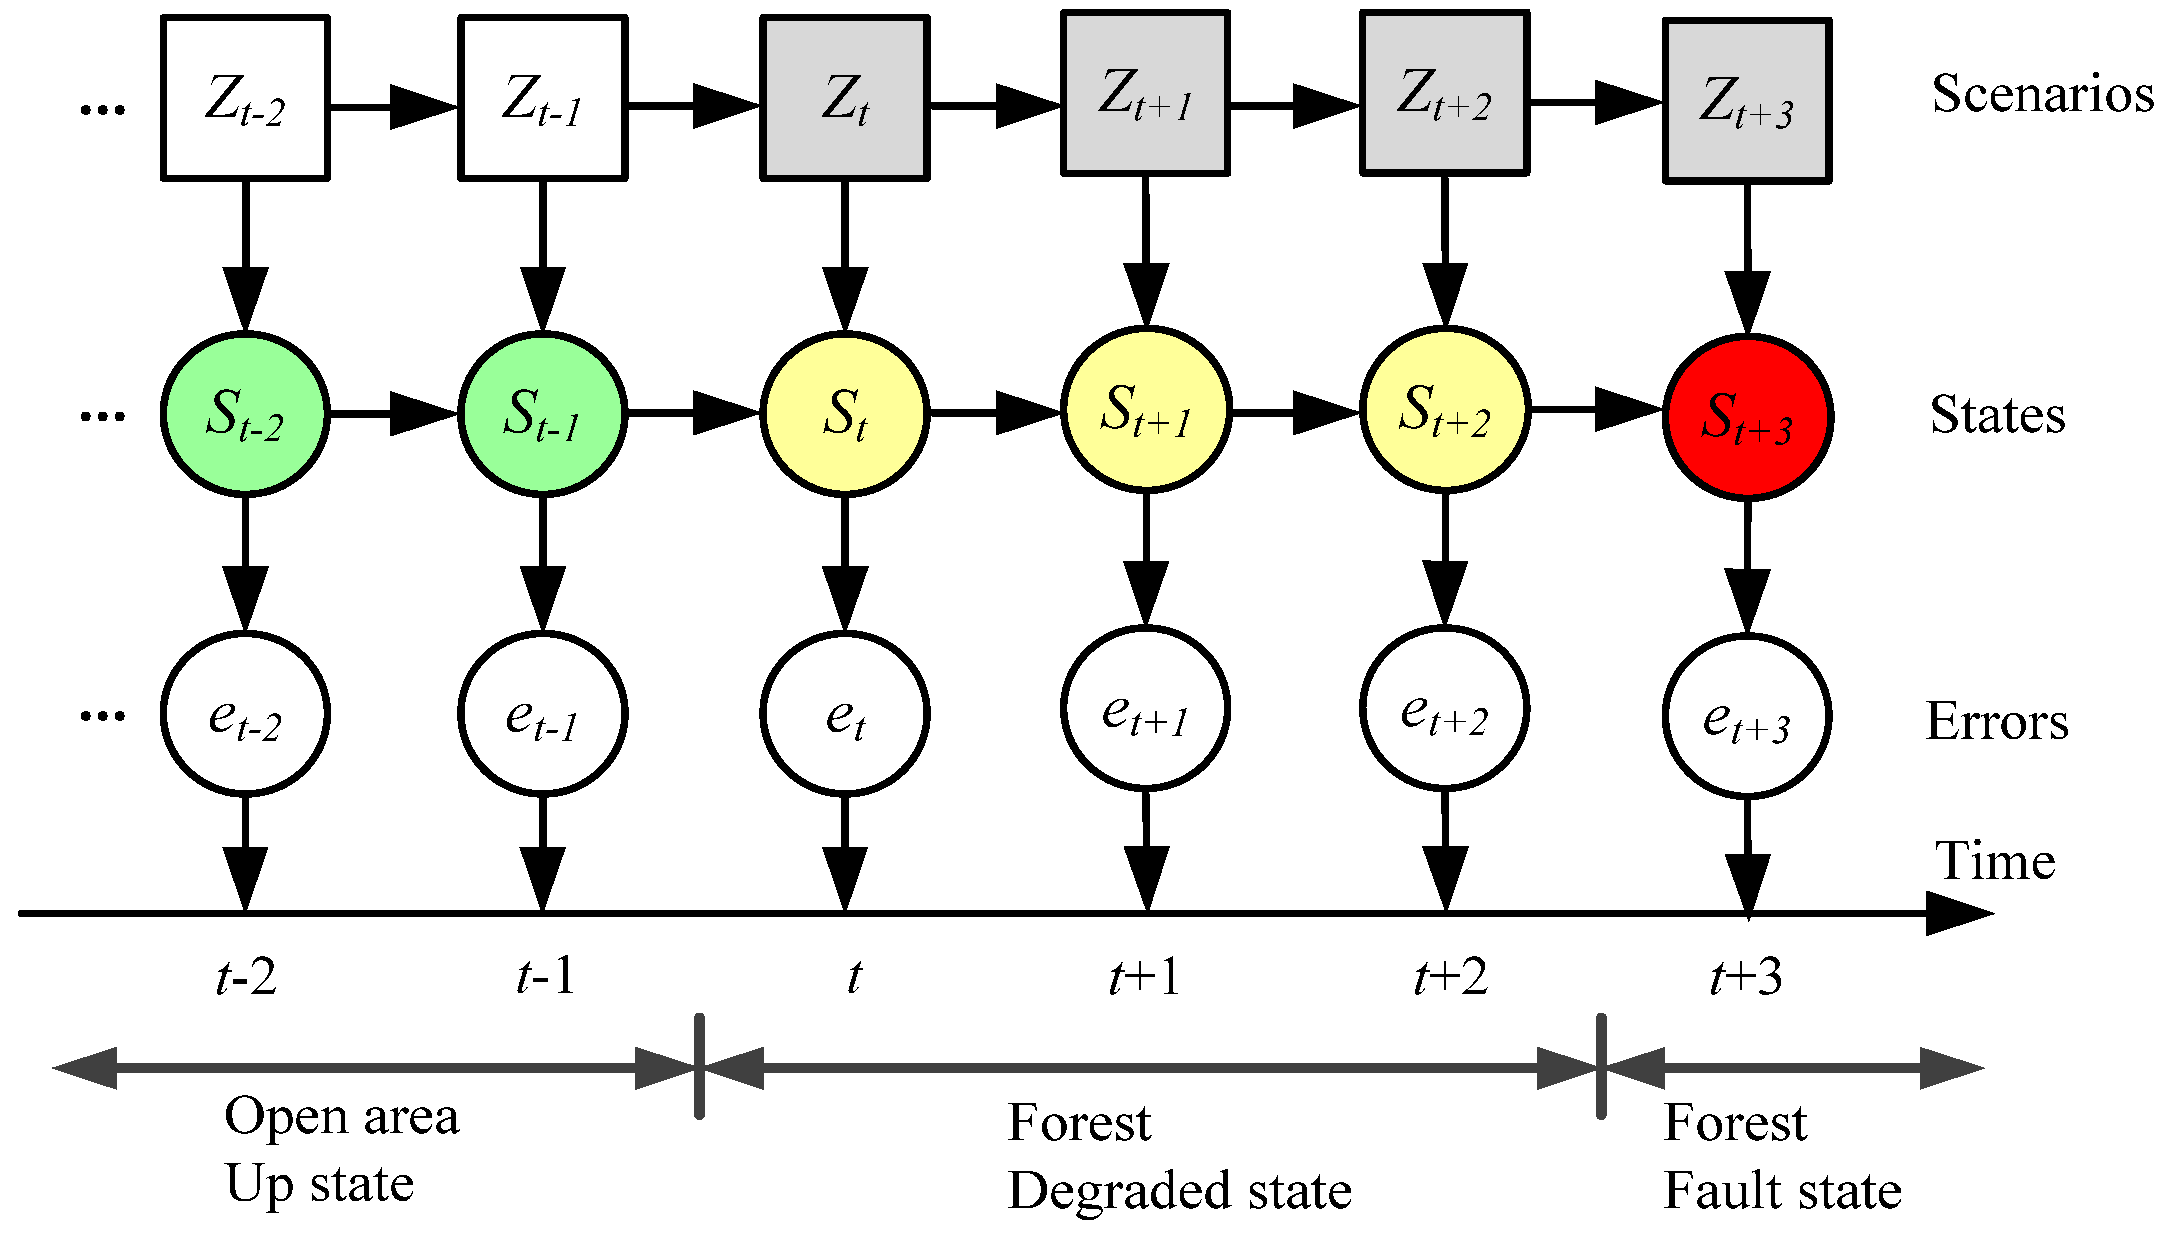
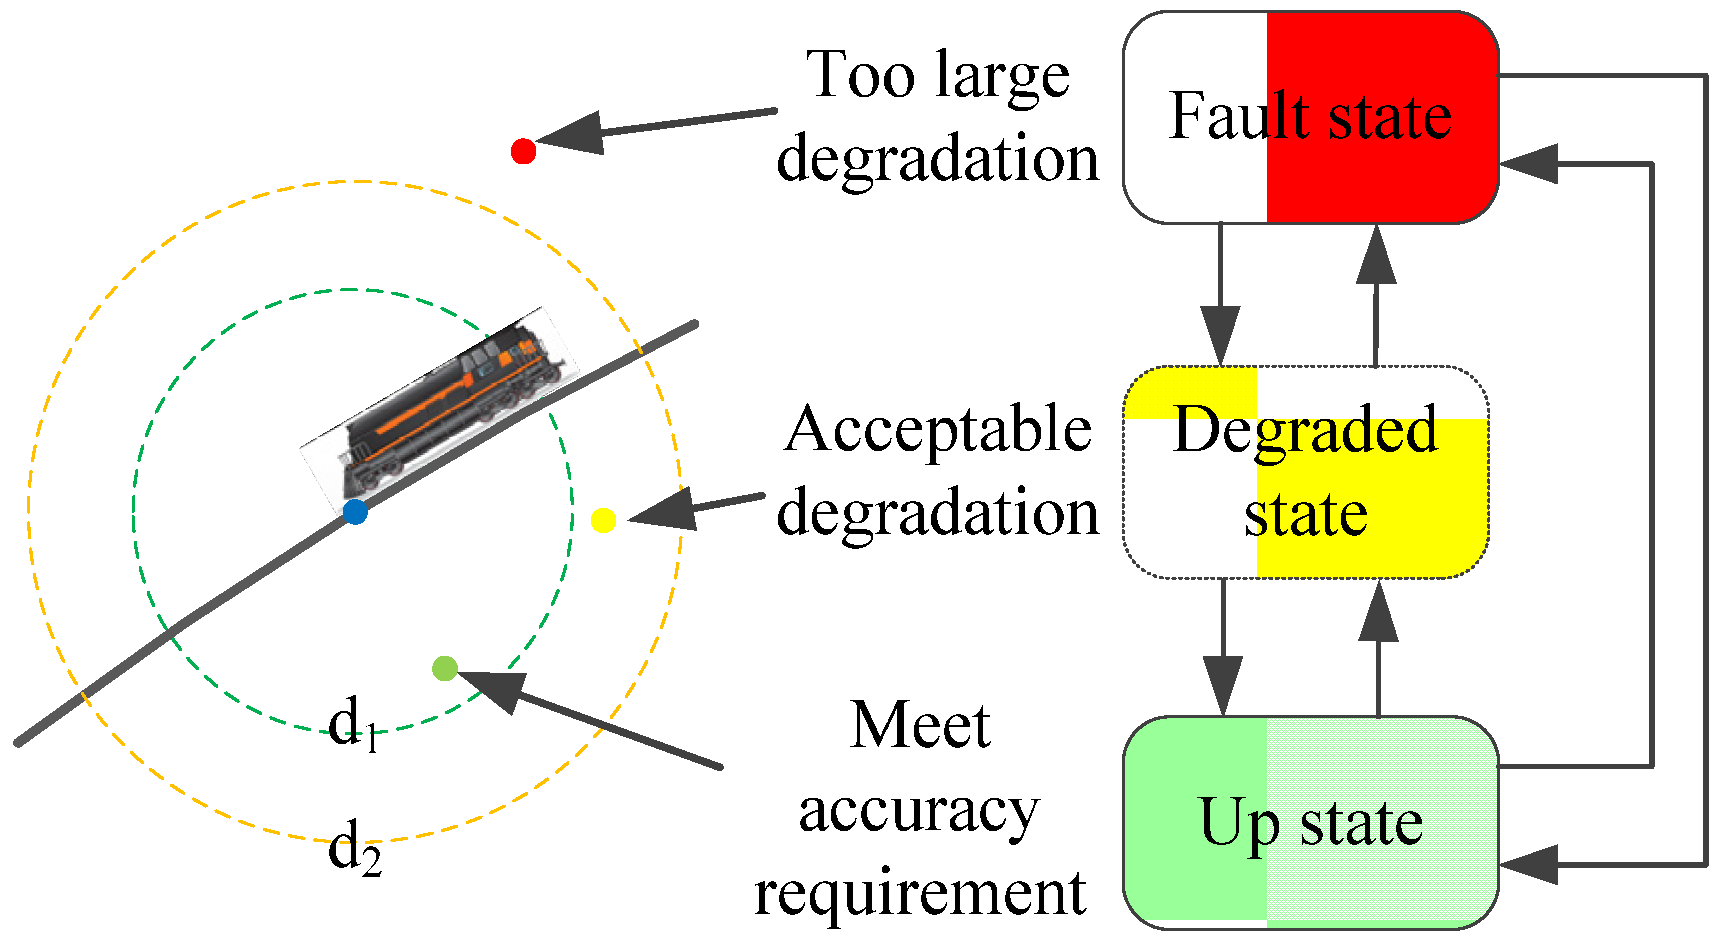
To consider the influence of the environment along train routes, it is obviously impossible to describe a limited number of representative geometries to cover all situations of signal visibility. Environmental configurations along the train itinerary present identical geometry features. The area around this itinerary constitutes a ‘‘typical’’ environment. Safety results can then give representative characteristics for the different typical environments observed [
21]. The GNSS-based positioning system can be decomposed as a state to help identify the system performance level. These states of GNSS in TIMS are related to location measurements. So from the GNSS receiver perspective, three states are defined for the GNSS receiver locations. These three states [
21] are upstate, degraded state, and faulty state, as shown in
Figure 6.
The measured position of the GNSS-based positioning unit is the most important factor for train parting incident detection. So, a hazardous event is more likely to occur when the localization function reaches the degraded state and fault state. A train, which has been wrongly positioned, can lead to unexpected estimated train length and false detection results. This situation can lead to a rear-end collision. Safety activities on a GNSS-based TIMS concentrate on these states of GNSS-based localization.
The Monte Carlo simulation is a numerical process that is able to generate both GNSS positioning errors and train parting sequences composed of dependent situations where failure frequencies are subject to uncertainty [
22]. Several possible evolutions in the life of the system (i.e., the dynamic transitions of the GNSS positioning system in an up or degraded state) can be obtained with a Monte Carlo simulation. In GNSS-based applications in railways, we use an Experience Statistics (ES) methodology [
7] to obtain an efficient procedure capable of managing a huge quantity of data in order to evaluate the safety properties of GNSS-based positioning. This approach follows the usual steps that we have here adapted to the GNSS localization.
To determine the accuracy of an estimated position, a reference is needed. The inertial navigation sensors and other technical solutions-based reference systems can provide an accurate reference for measurement data evaluation.
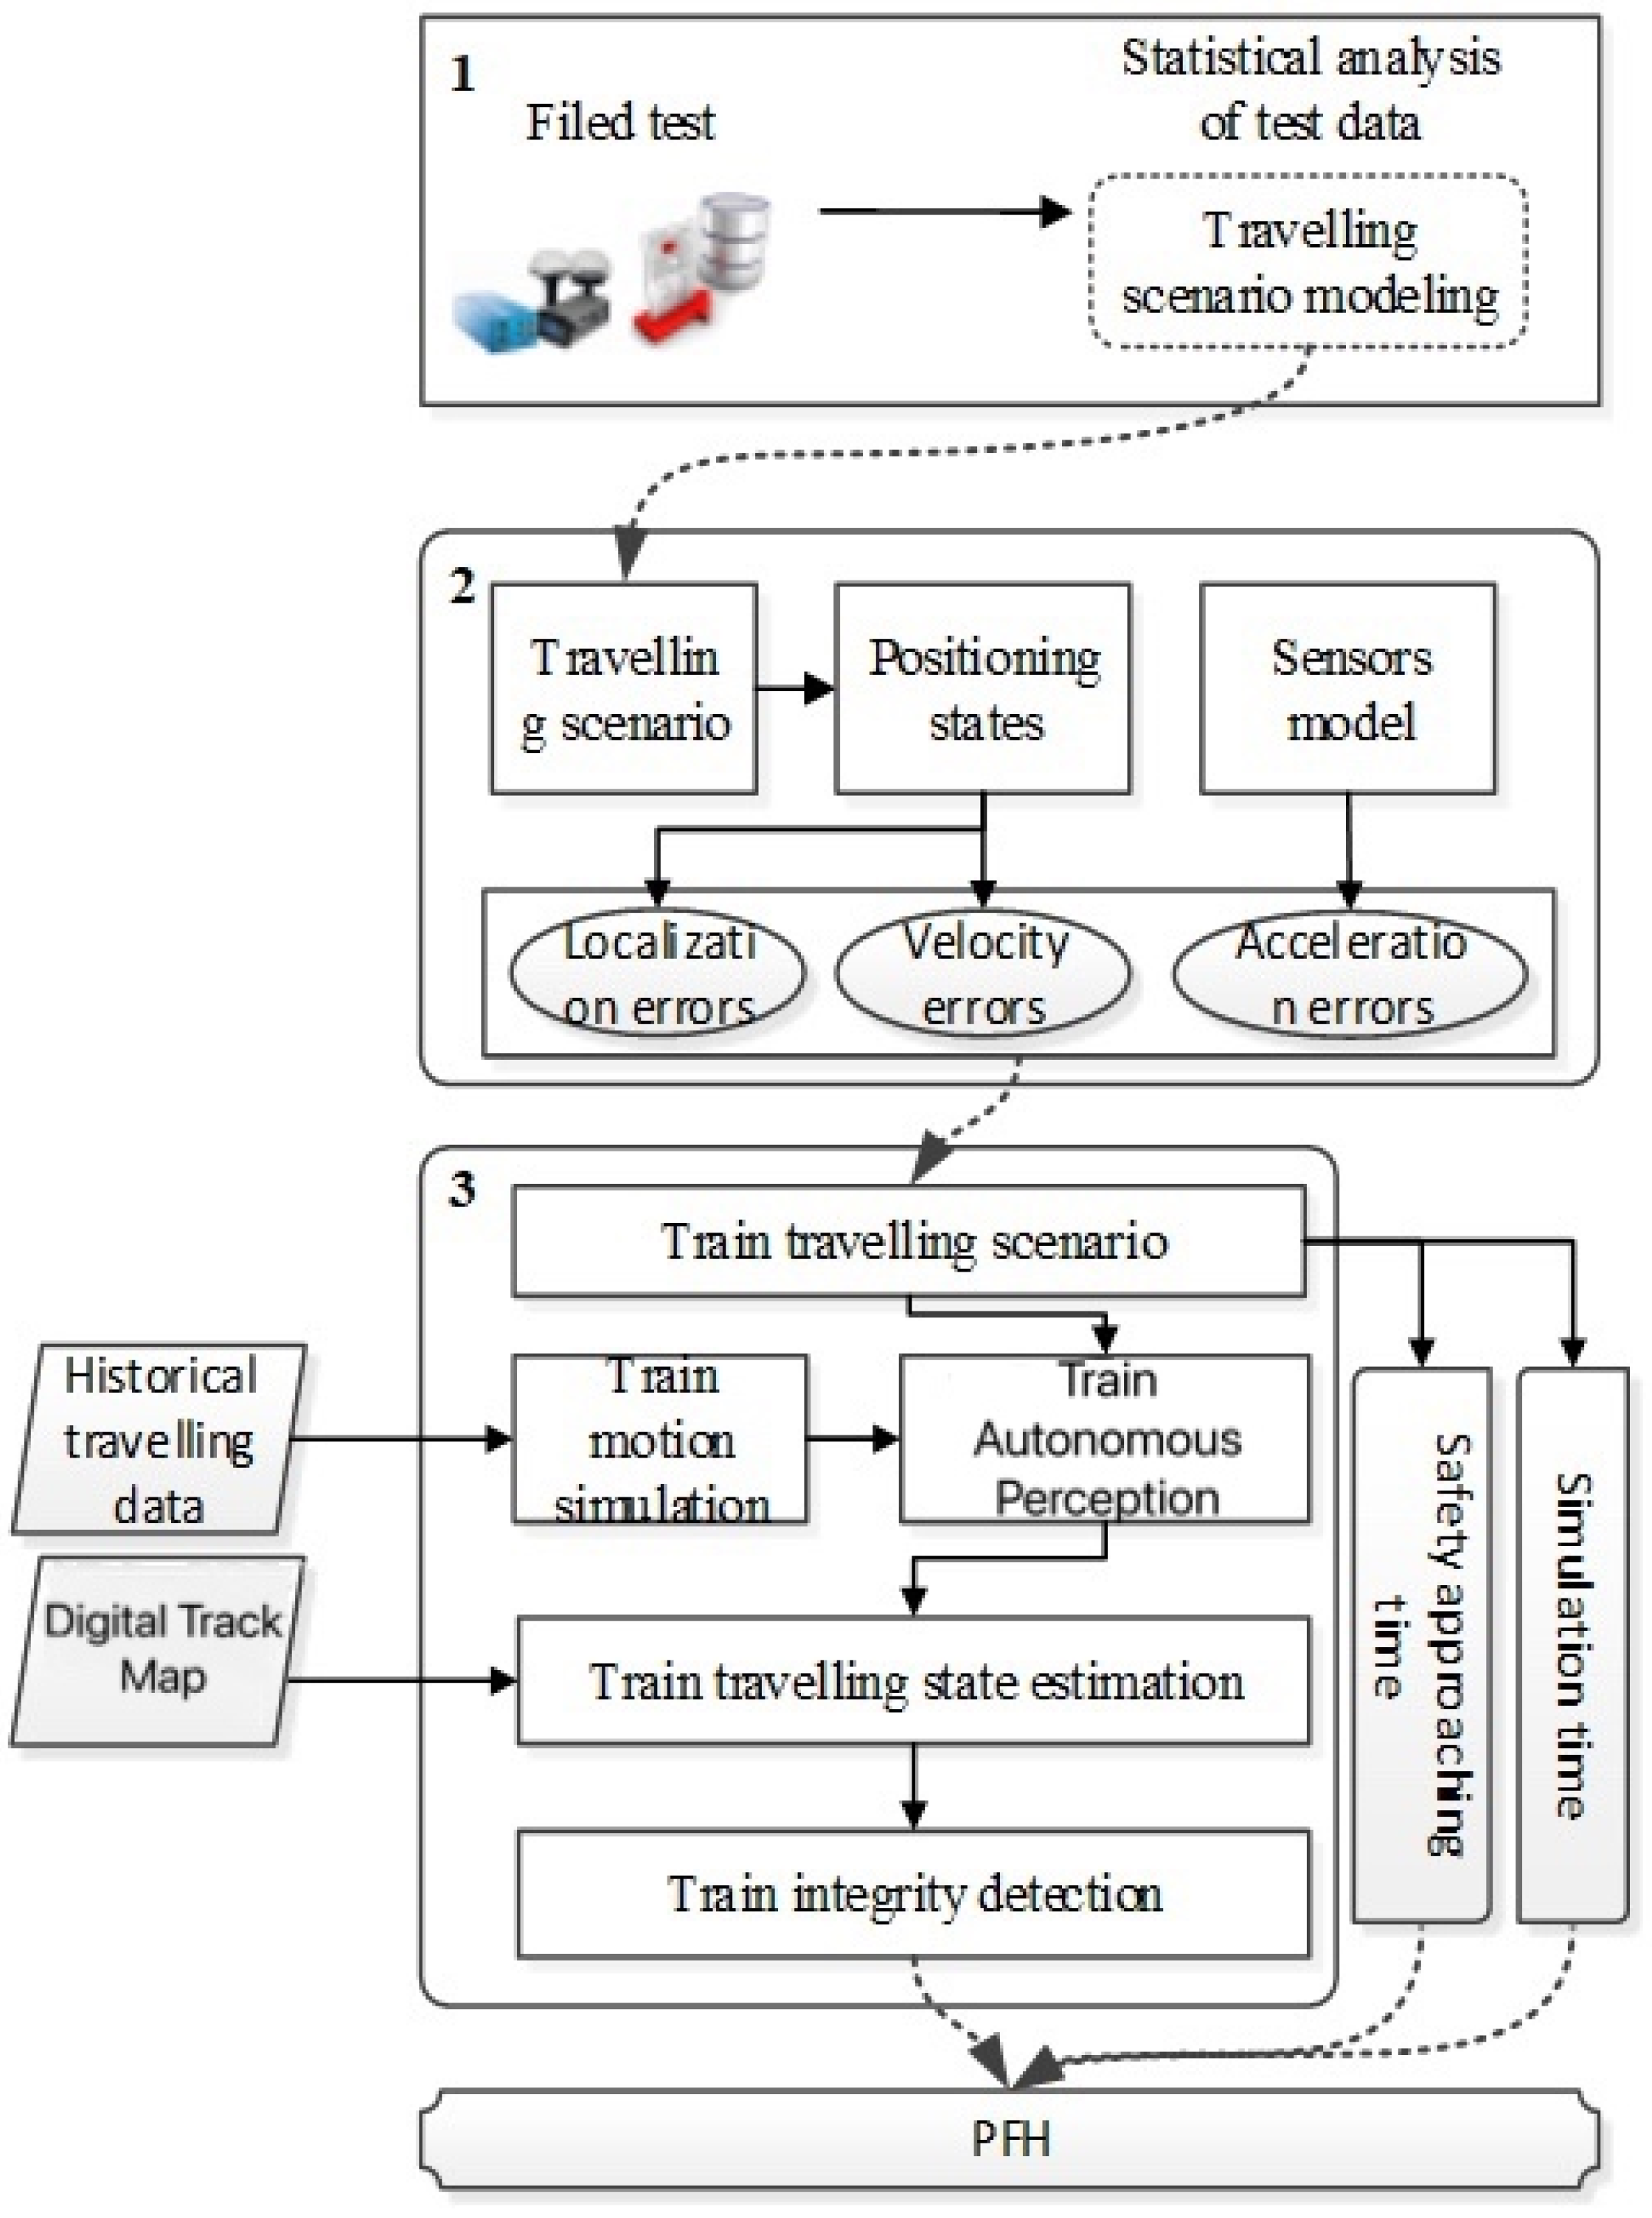
Figure 7 illustrates the proposed ES-based Monte Carlo simulation procedure, which begins with this data collection and continues with several processing steps:
Step 1, a selection is carried out by the amount of collected data stemming from receiver output files. They constitute raw data that are unworkable for a safety evaluation. Useful data leading to the position estimation are extracted at each sampling instant. Then the useful data are processed to obtain information related to correct and hazardous states. To determine if there is a failure or not, a position has to be compared with the true position (the reference). The obtained information leads to quantitative values that can be subsequently analyzed statistically in order to get safety results
Step 2, the typical testing scenarios can be simulated by different probabilities from Step 1. The system states of GNSS-based positioning in each scenario will be defined and transformed to each other. Aligned with time, states, and scenarios, positioning errors are obtained with the normal distribution, of which the mean and variant can be found from the statistics.
Step 3, the train motion of both the preceding train and following train will be simulated with different velocities and accelerations. Integrated with positioning errors, the train movement state can employ a Kalman filter to compute the protection level. With different train operation situations, the limited safety time, simulation time, and detection time can be found. Based on the detection threshold, a limit-state-based probability method will be applied to get the PFD and PFH. Finally, the SIL of GNSS-based TIMS in the design phase are achieved.
5. Simulation and Results
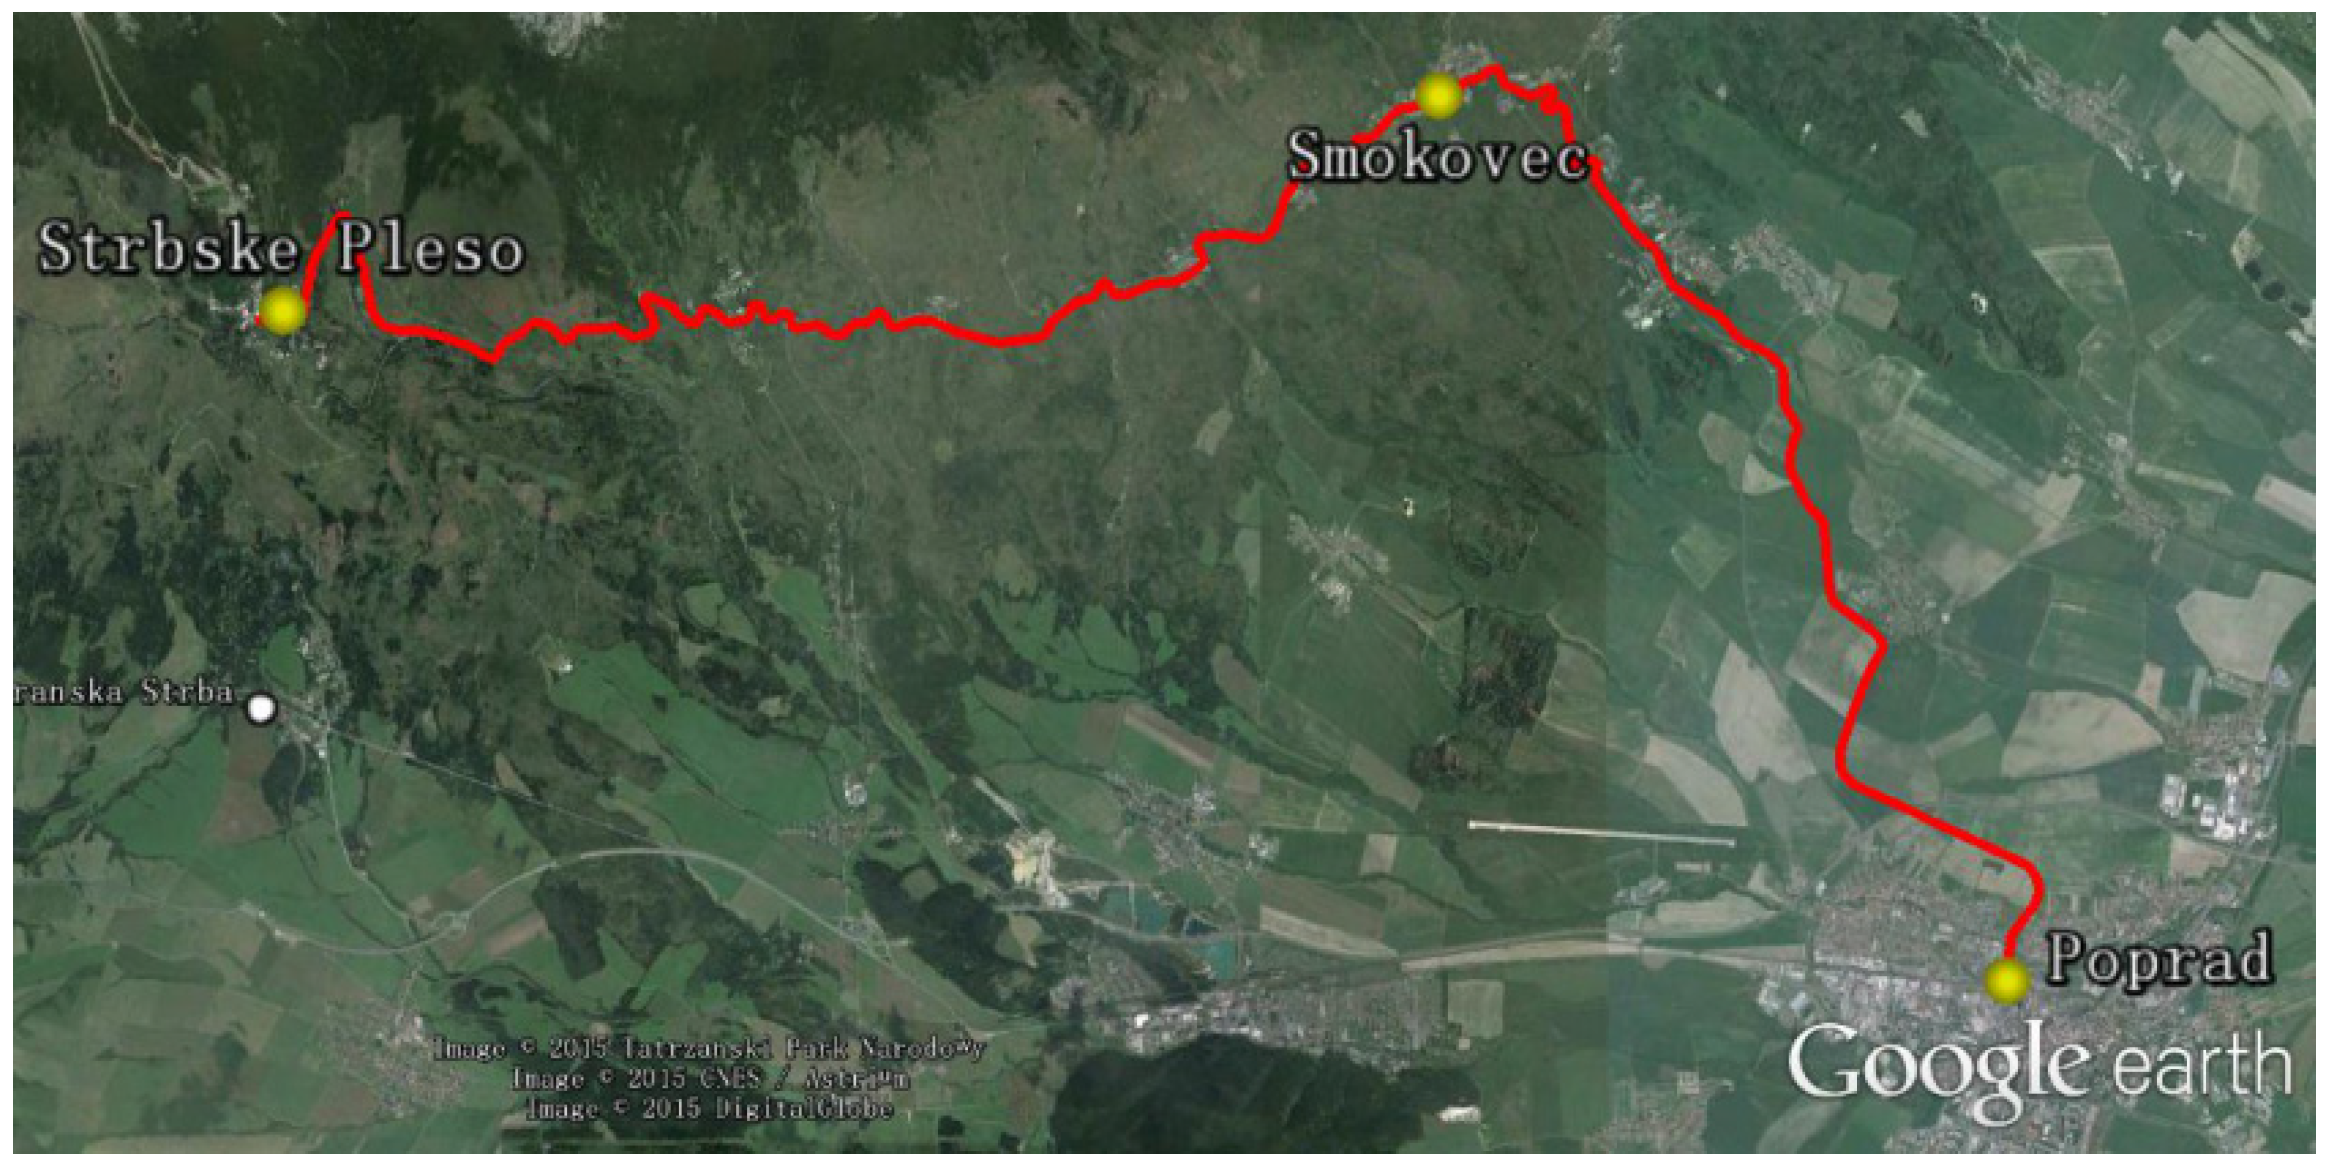
To obtain different scenarios and positioning states, raw data are collected as follows: the runs of a train equipped with a GPS receiver and reference system are tested in order to evaluate the positioning errors. The GNSS and the reference location data were collected along the High Tatra Mountain railway line from May 2008 to February 2009 (see
Figure 8) [
23,
24,
25,
26], and the deviation between GNSS receiver and reference locations is calculated for performance evaluation.
The High Tatra Mountain railway line is 29.1 km long from Poprad to Smokovec until Strbske Pleso. There are open areas and forests but no tunnels or railway bridges. The thresholds for the required train localization function are set as an upstate threshold of 10 m, and the positioning deviations bigger than 10 m and lower than 20 m are set as the degraded state. A faulty state is defined when the deviation is bigger than 20 m, which indicates it ceases to be a localization function and is no longer available as a resource for the localization function. Then, the statistics of positioning errors in different scenarios (open area and forest) and localization states (upstate, degraded state and fault state) are found out [
27], as shown in
Table 4. Since the mean and variance of deviation normal distribution in upstate from the test run are chosen, the mean and variance of the other two states are set depending on the thresholds.
Not only the localization states but also the transitions between the states are considered here. The mean time of the six transitions can be found out from the measured individual time span staying in one state to another. The mean times from one state transition to another are categorized, and the results [
27] of all six transitions are estimated in
Table 5.
The procedure is based on the statistically processed fieldmeasurements. One scenario is a sequence constituted of a succession of states associated with the localization function. The transition between the different states is also associated with time.
Figure 9 illustrates scenarios (open area with white color and forest with grey color) in which states (upstate with green color, degraded state with yellow color, and fault state with red color) are distinguished at each sampling instant using unit steps and colors.
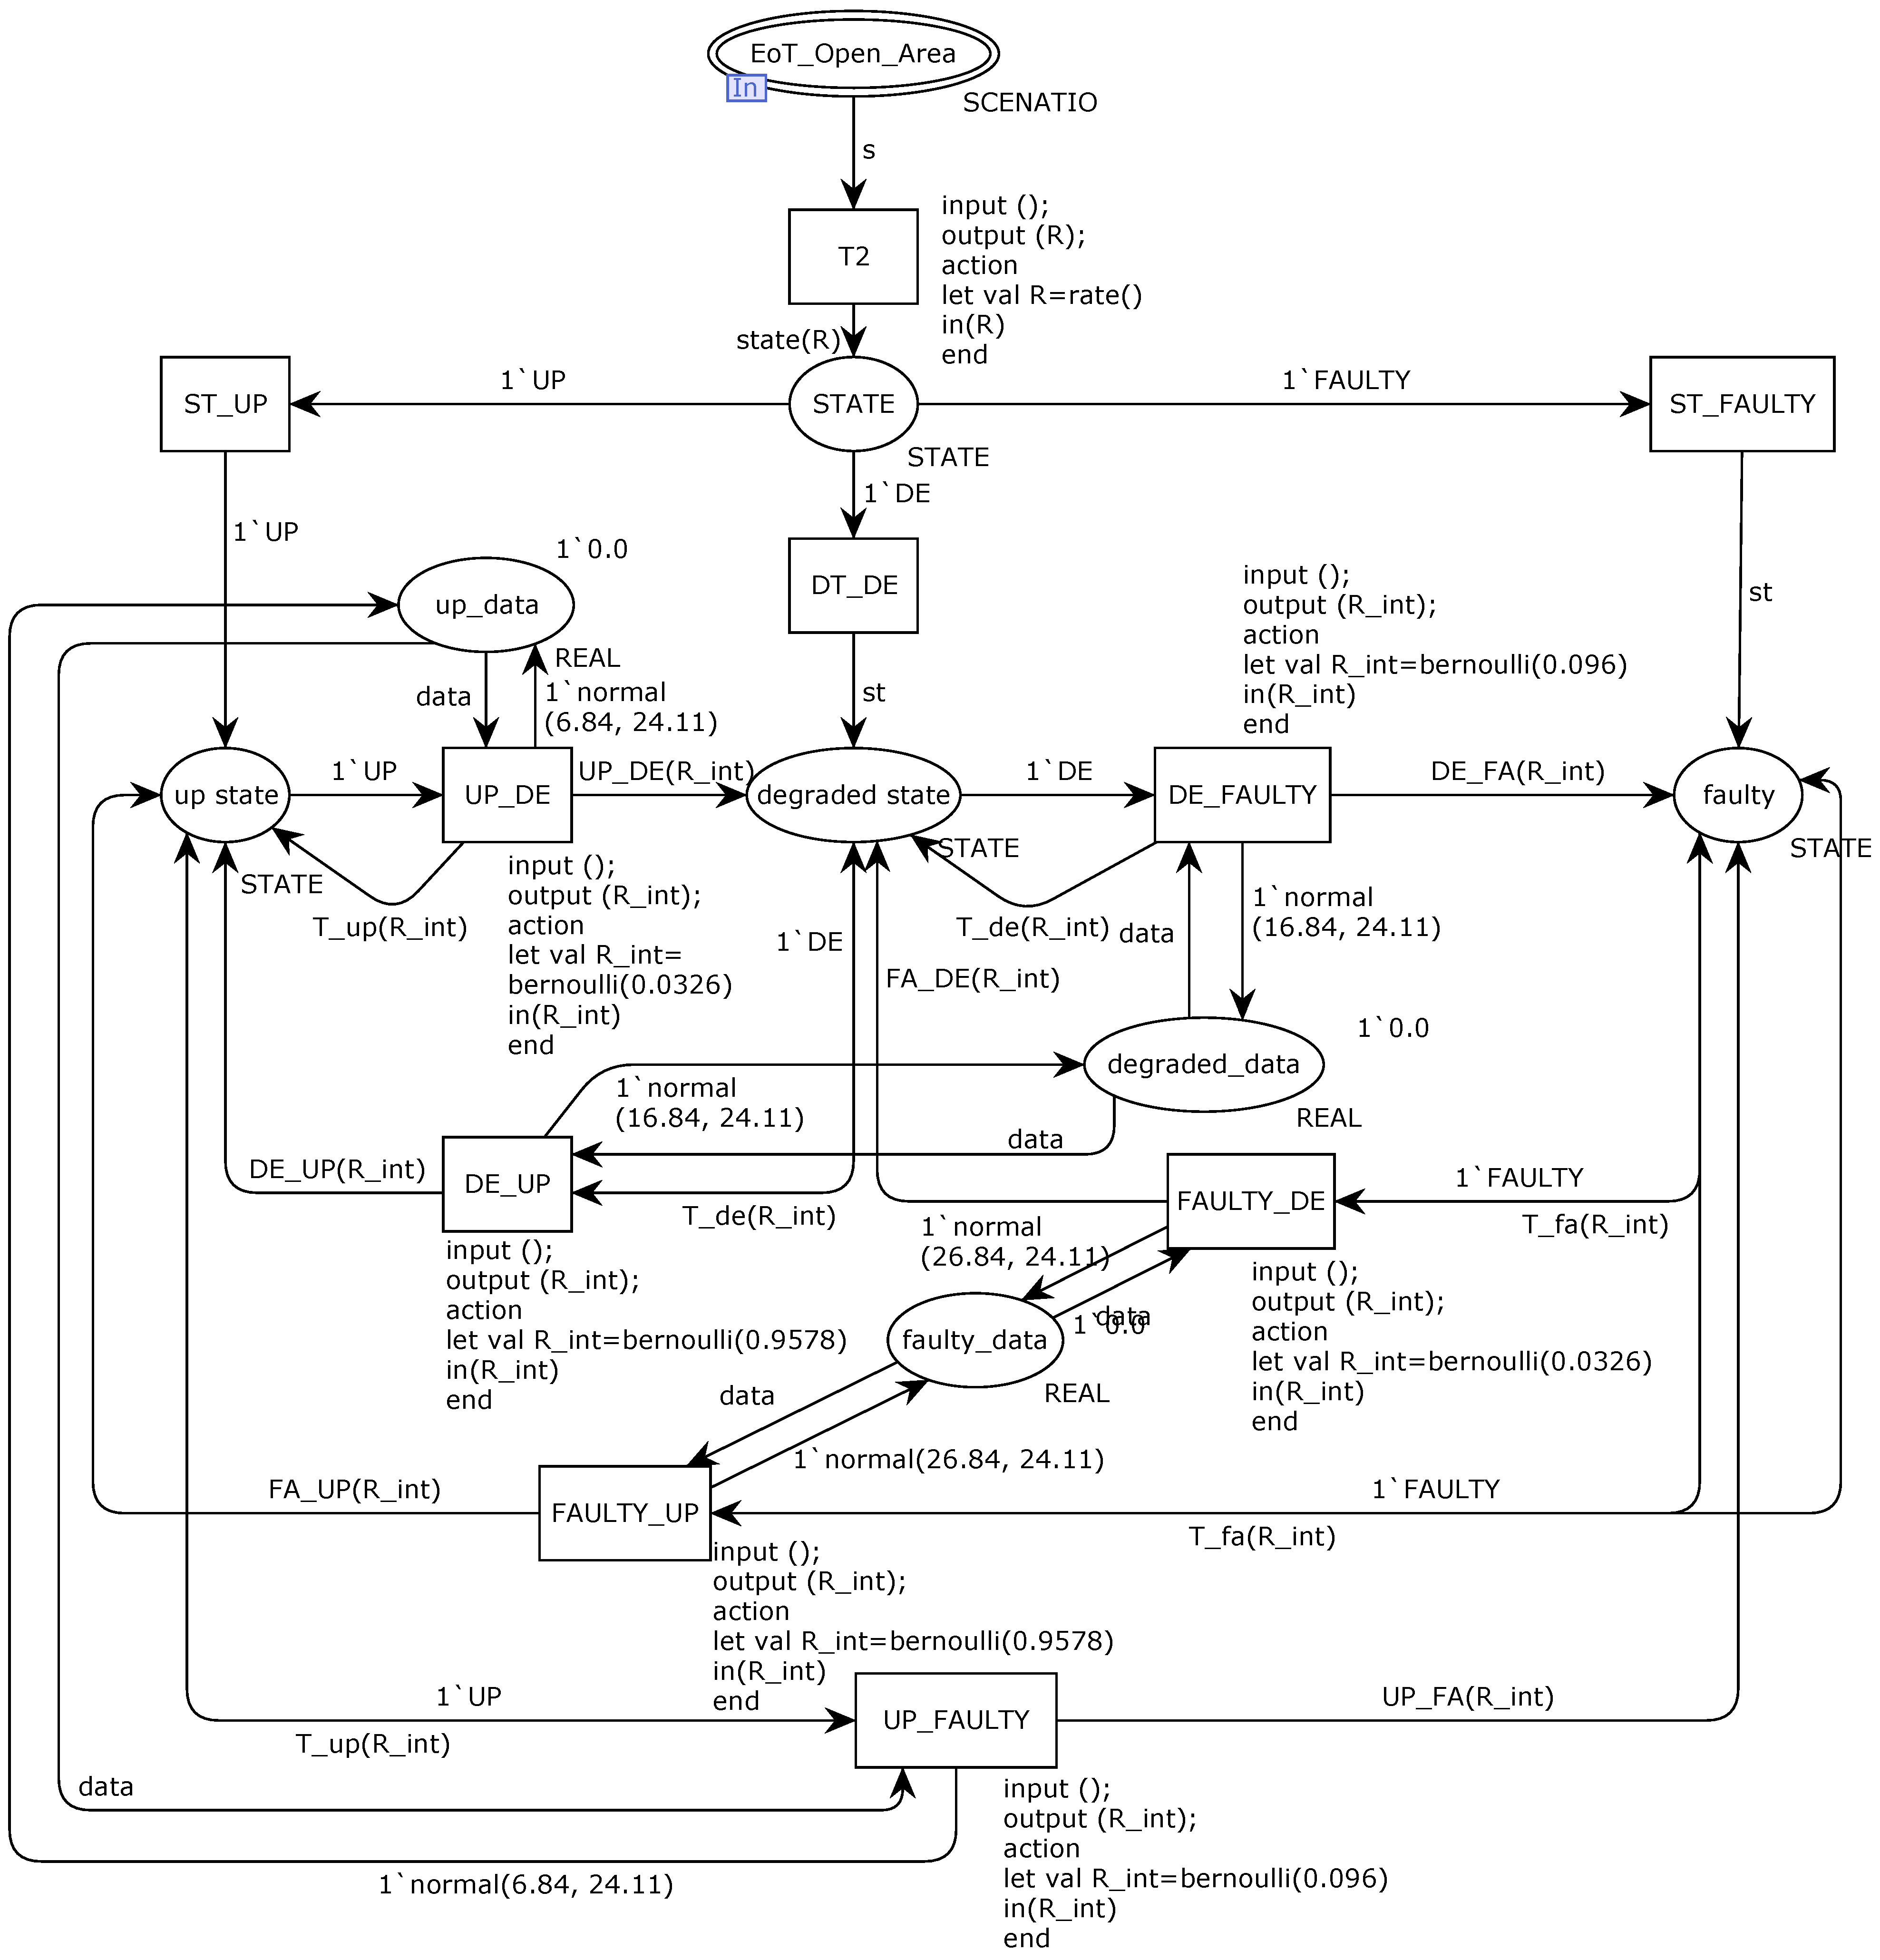
Because of the timed and stochastic nature of the GNSS-based positioning system, formal and simulation-based verification are combined to generate the GNSS positioning errors. The CPN model of the GNSS positioning errors is shown in
Figure 10 and
Figure 11. In order to evaluate the existing or planned systems, a performance analysis is conducted. In CPN, each token can be parameterized with the required meaning, which is not available in low-level Petri Nets. By adapting values to corresponding quantities, the system can be easily understood and changed, then described in executable code. During simulation-based performance analysis, data is collected from the occurring binding elements, and the markings reached [
15]. With the data obtained from the model, performance measures of the GNSS-based TIMS are available.
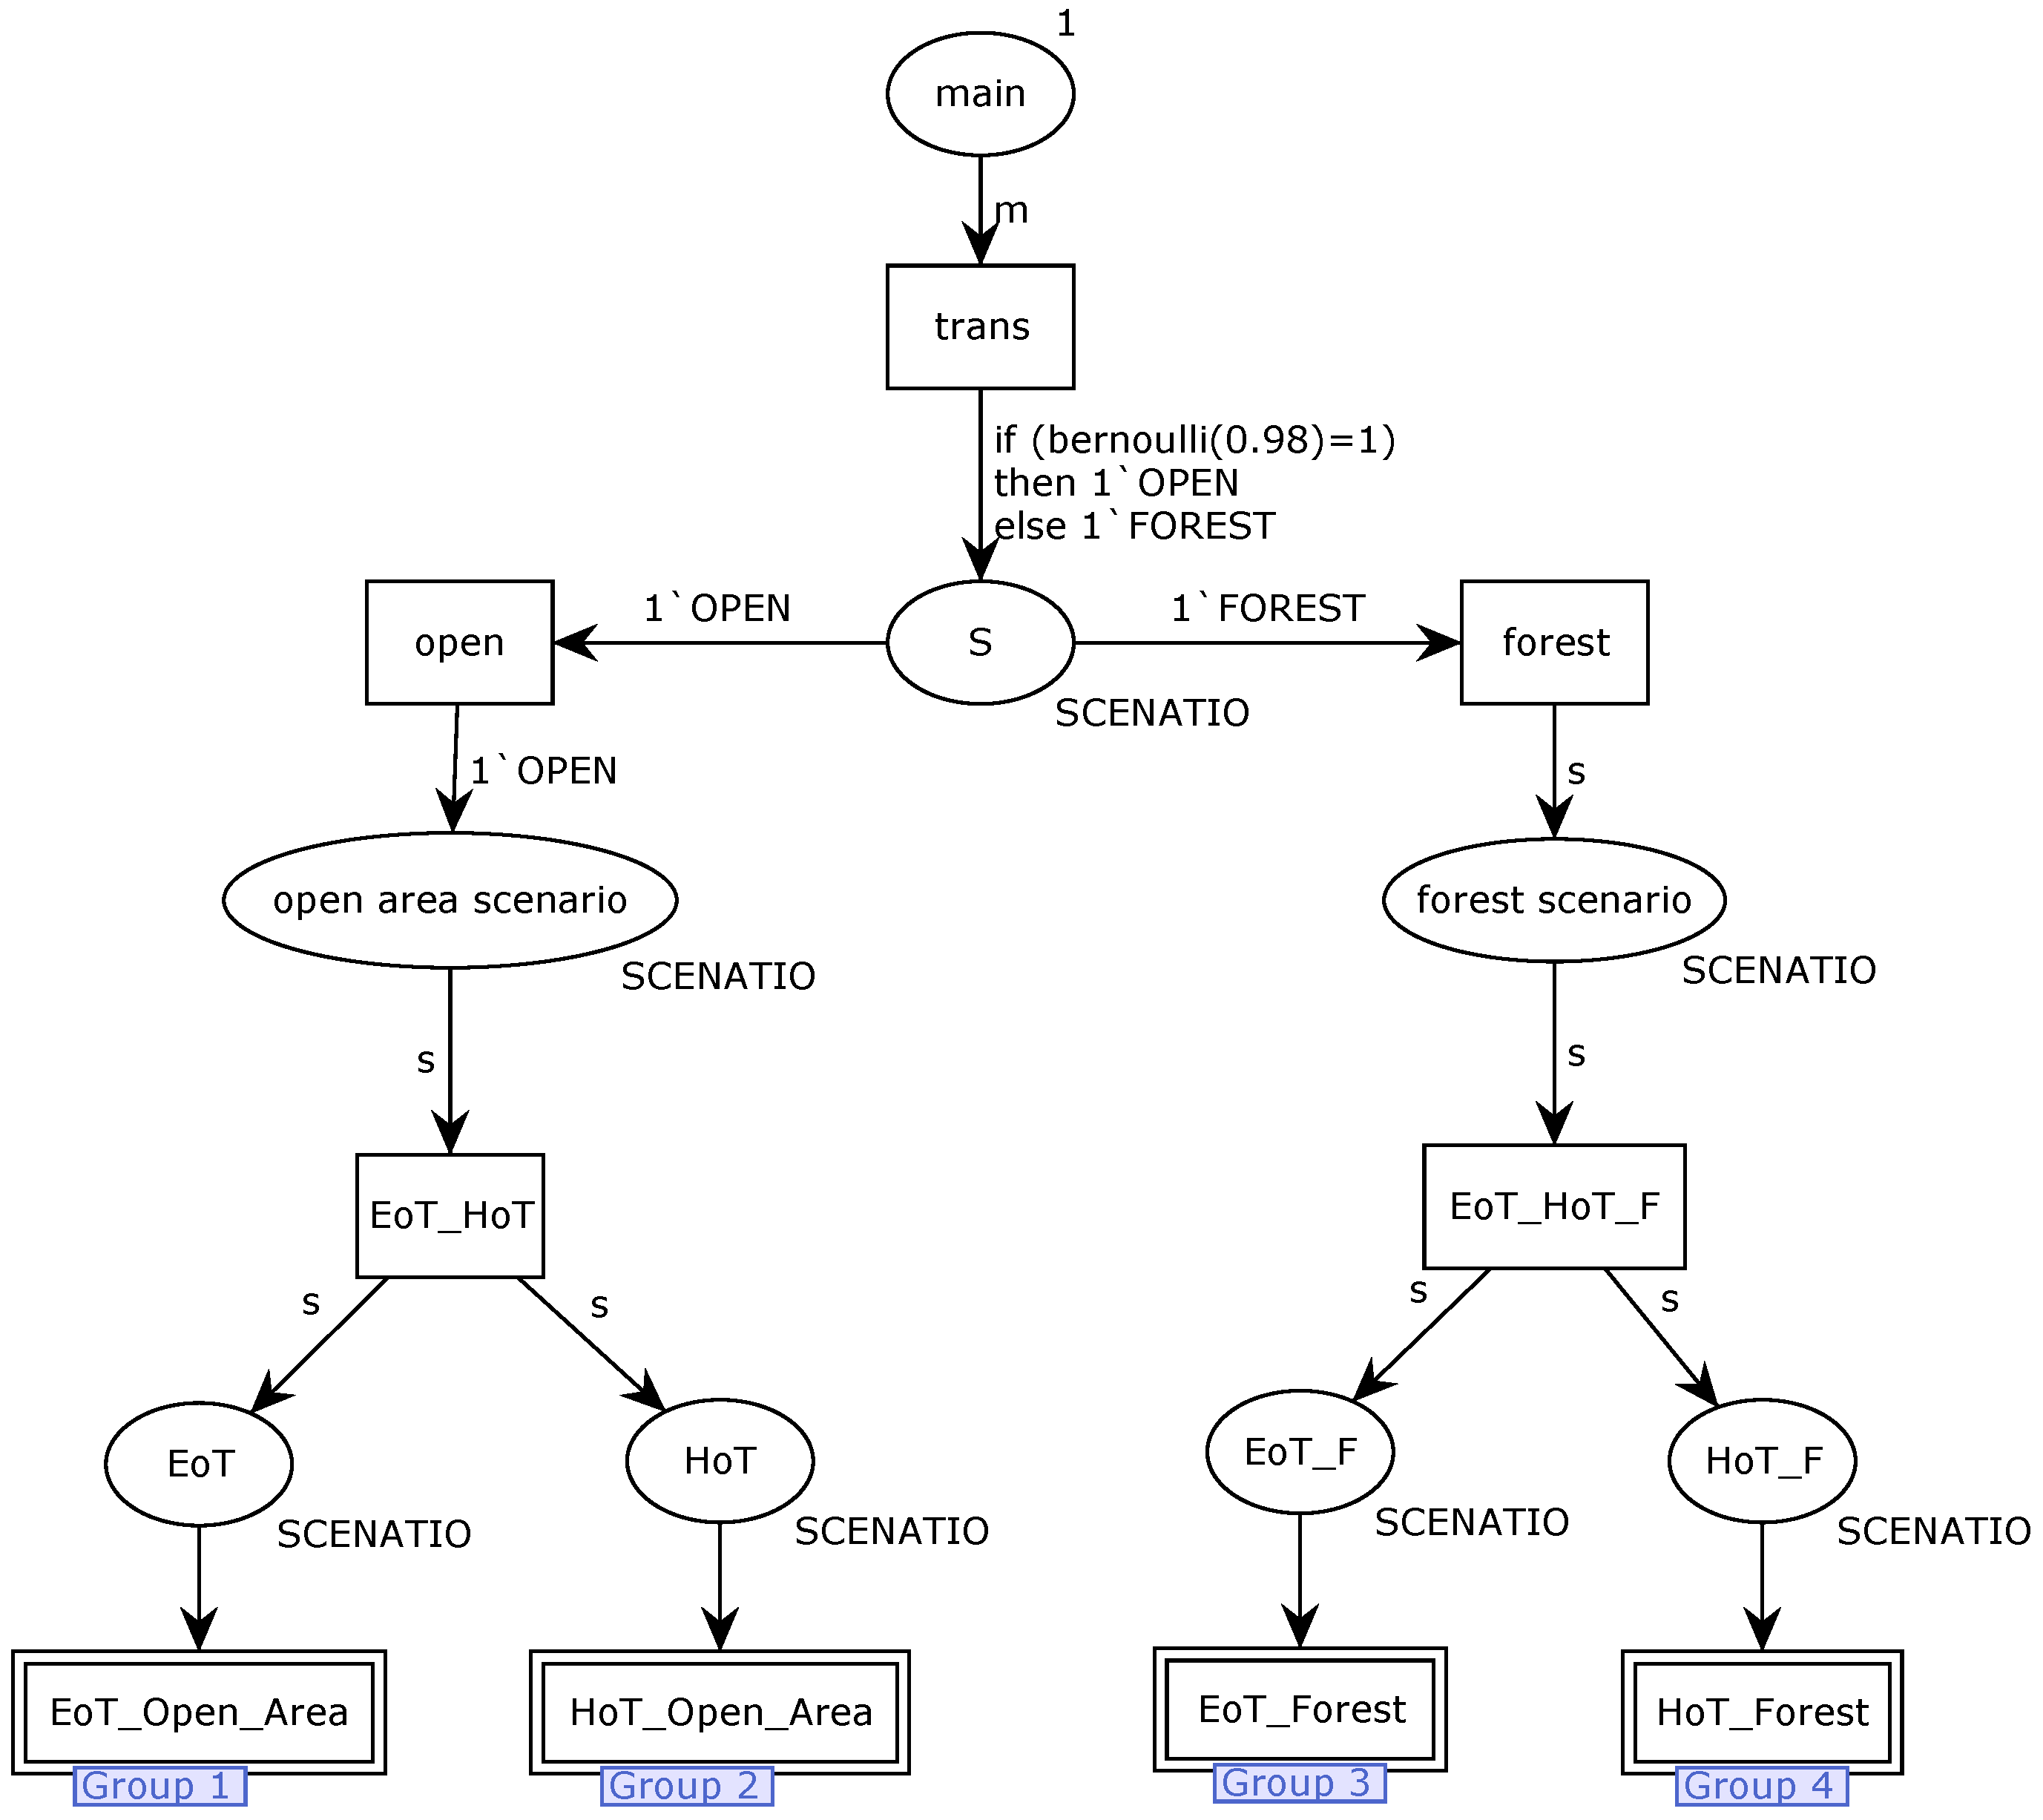
The model is divided into two layers; the first layer (see
Figure 10) includes EoT and HoT in open area scenarios and forest scenarios. As shown in
Figure 11, the second layer described each scenario in detail; parameterization was done in this layer (EoT_Open_Area, HoT_Open_Area, EoT_Forest, and HoT_Forest share the same model structure in
Figure 11, different parameters according to
Table 4). Relative time and distributions characteristics are involved in the second layer; position error data can be extracted from up_data, degraded_data, and faulty_data.
The off-line data positioning errors (see
Figure 12) aligned to simulation time from CPN tools are imported into MATLAB and integrated with the train motion simulation. The train motion simulation generates kinematic data (i.e., position, velocity, and acceleration) of both HoT and EoT. Train parting events are so rare that they do not provide enough information for statistical analysis, and we cannot have a true experiment yet. To take into account each parameter subject to failure, train parting processes are simulated with different relative distances, velocities, and accelerations over a mission time to provide an interval of time-dependent probabilities for the train integrity detection. Hence in this Monte Carlo process, the system states evolve, while the operating context remains the same and experiences all the possible GNSS localization and train operation scenarios and states.
The autonomous positioning error of offline data corresponding to the simulation time from the CPN tool (see
Figure 5) are imported into MATLAB and combined with the simulation data of train motion characteristics to generate kinematic data (i.e., position, speed, and acceleration) for evaluating hot and EoT. Due to the severity and contingency of train separation accidents, they cannot provide enough measurement information for a statistical analysis, and it is difficult to carry out corresponding field tests. In order to consider the parameters of each safety failure model, different relative distances, speeds, and accelerations are used to simulate the train separation process in order to provide the time-dependent probability interval of train integrity detection. Therefore, through the Monte Carlo simulation process of multi-level state transition, train integrity detection results of all simulation operation scenarios, environment scenarios, train positioning status, train integrity status, and other system’s multi-level state evolution can be completed.
For accelerometers, the sensor error includes three parts: bias, temperature drift, and random interference. Taking the measurement result of the x-axis of the accelerometer as an example, the error model [
28] is as follows:
The meaning of each symbol in the formula is as follows: is the measured value of acceleration; is the actual acceleration; S is the scale factor error; is the zero bias error; is the random noise error.
In order to verify the performance of the proposed train integrity detection based on autonomous perception, this paper takes the actual operation of the Ge NJ2 train on Qinghai Tibet Railway as an example and uses the combination of measured data and numerical simulation data to verify the performance of the train operation state estimation, train integrity detection and collision risk evaluation and verification. See
Table 6 for the main parameters of the Ge NJ2 train.
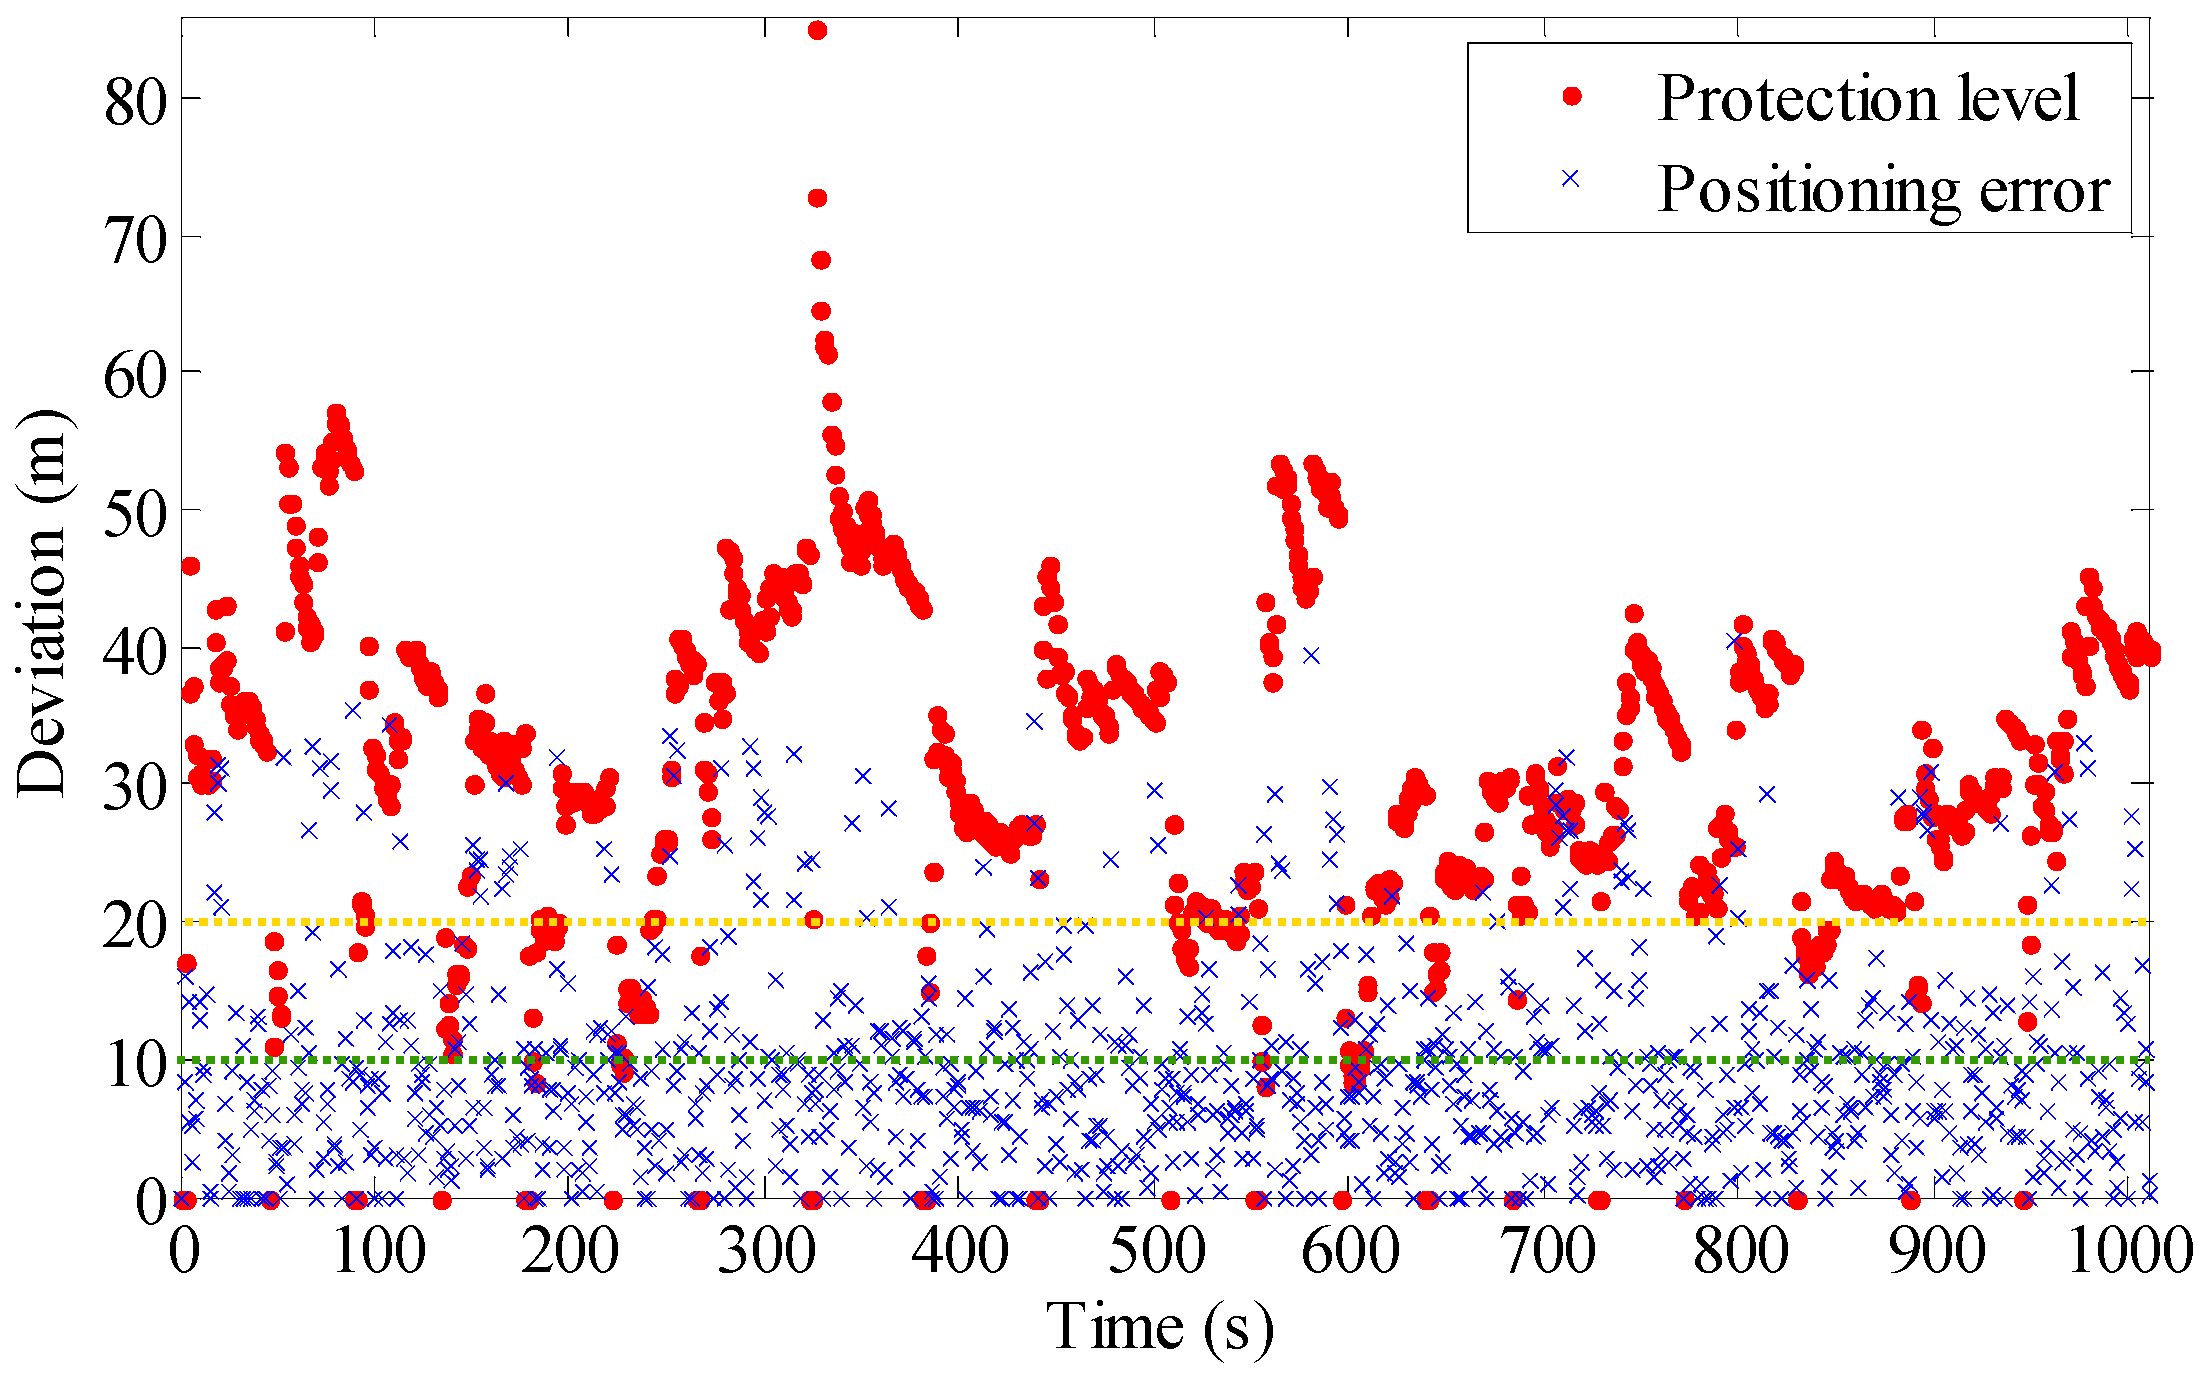
The simulated train operation time of the train parting process in every single simulation is 100 s. Every set of simulation tests include 2700 simulation tests, in which the velocity increases from 0 to 50 m/s (almost the maximum velocity that a freight train can reach) by 1 m/s and the acceleration from 0 to 0.54 m/s
2 (maximum traction acceleration) by 0.01 m/s
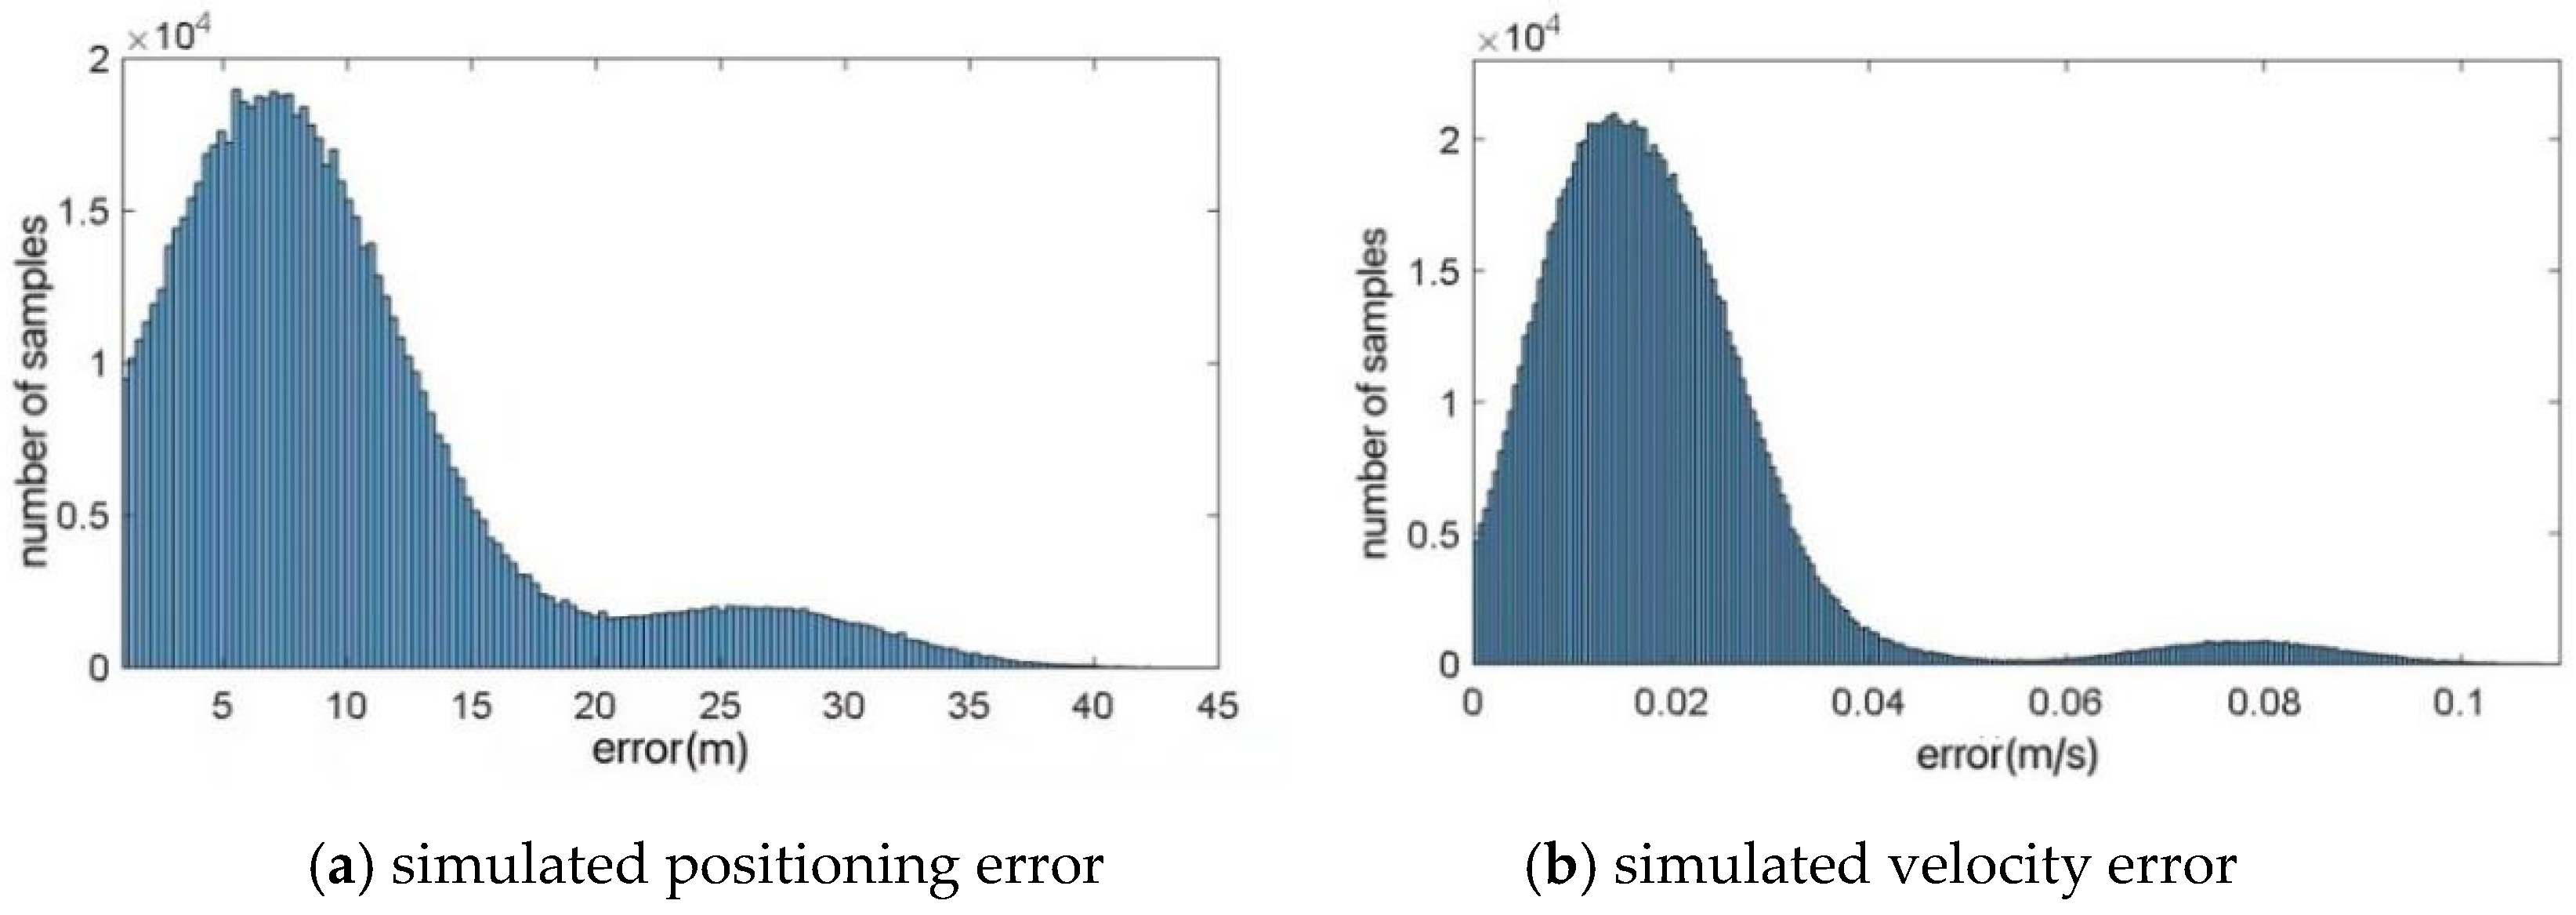
2. Kalman filtering is employed to smooth the data and compute the protection level. Based on the positioning errors and protection level (see
Figure 13), the train integrity detection threshold is set to be 50 m. Then a safety evaluation procedure is launched, and plenty of PFDs in different simulations are computed. As presented in
Figure 14, a set of simulation tests with all the train motion situations show the calculated PFD. The results show that the PFD varies from 10
−20 to 10
−50, and higher PFD’s have smaller velocity and acceleration.
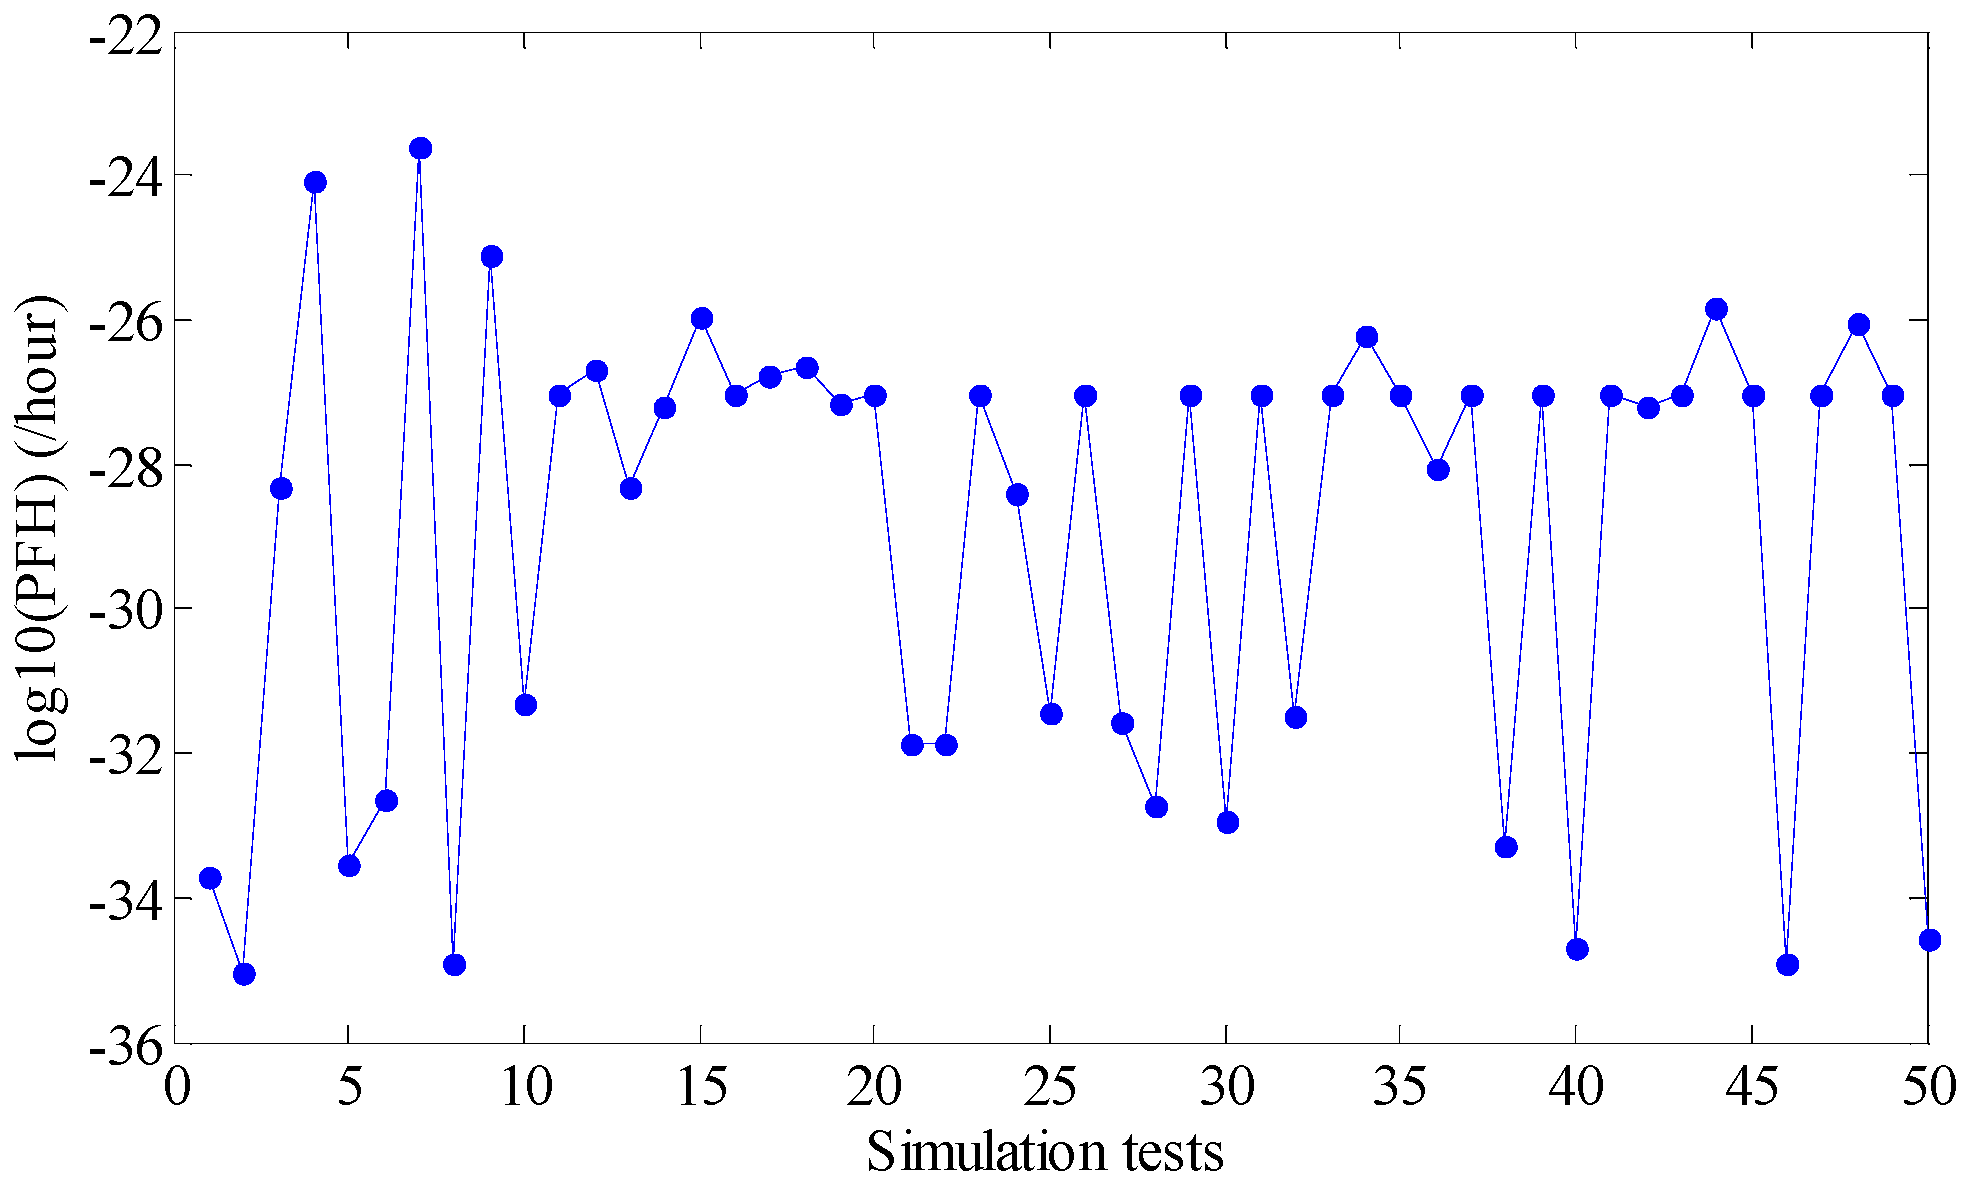
Due to the limit of computing performance, 50 sets of simulation tests are carried out, and the total simulated train operation time is 1.35 × 10
−7 s. Plenty of PFD in both different GNSS localization scenarios and states and train motion states are calculated and followed by the PFH with simulated train operation time. The calculated PFH (see
Figure 15) in the 50 sets of simulation range from 10
−23 per hour to 10
−35 per hour.
An average PFH = 10−25.1482 is found, in reference to the corresponding relationship of SIL and PFH, the value of the PFH goes into SIL4. Additionally, in the simulated 3750 h of train operation, no collision accidents happen. Consequently, GNSS technologies can be applied in safety-related TIMS. Yet it is worth more time to verify, since the results of SIL quantities were gained over a limited time period. To improve the performance of GNSS-based train integrity detection, an innovative method should be offered.


