1. Introduction
An offshore plant topside is equipped with various production facilities to fully utilize the limited available space. Due to small accidents that may occur during operation leading to large accidents involving serious marine pollution and loss of life and property, risk-based engineering technologies are applied from the initial design stage. Additionally, because oil and gas fire accidents cause extensive damage, quantitative risk assessment (QRA) must always be conducted throughout the design process. Accurate analysis and understanding of fire accidents is necessary for reliable risk assessment. QRA was first developed in the late 1970s through systematic research and practical verification in Norway. Since the Piper Alpha incident in 1988, the importance of ocean plant explosion fires has become more apparent and QRA applications have been widely applied in the UK. Despite these efforts, the Gulf of Mexico accident that occurred on 20 April 2010 resulted in 11 casualties, 17 wounded, and
$2.7 billion worth of environmental damage [
1]. Therefore, to prevent such accidents, a method for designing a facility system using cutting-edge design technology, such as accident investigation and safety systems, is required to eliminate various potential risk factors [
2]. Conventional risk analysis methods, including fault tree (FT), event tree (ET) and bow-tie (BT), have been extensively adopted in previous studies. These methods are static and fail to capture the variation in risk as change occurs in the operation and environment [
3]. In addition, conventional methods cannot account for the various states of a variable, commonly cause failures, and conditional dependency among events contributing to an accident [
4,
5,
6]. Initial QRA approaches were more qualitative than quantitative, identifying accident risks through methods such as hazard and operability analysis (HAZOP), failure mode and effects analysis (FMEA), and defined risk probabilities, causes, and consequences of accident risks in a deterministic manner. Similarly, a study on marine fire hazard identification (HAZID) was conducted by analyzing the results of a questionnaire appropriate for the analytic hierarchy process (AHP) technique [
7]. However, over time, following the accumulation of accident data and development of technologies, methods such as computational fluid dynamics (CFD) were proposed as probabilistic rather than deterministic methods of evaluating the probability of accident occurrence and risk. Simulations of fires, gas diffusion, and explosions have allowed for relatively more rational quantitative assessment of risk consequences.
2. Literature Review
Recently, the application of QRA technology is required. In particular, the application of CFD and nonlinear finite element analysis (FEA) is required to quantify accident risks by quantitatively analyzing the effects of an accident. The reliability of these methods is improved using empirical data, such as results and accident cases. Steel construction institute (SCI) [
8] published a procedure for the probabilistic assessment of fire load and structural response. This procedure includes the application of CFD-assisted three-dimensional (3D) fire simulation to capture the essence of an actual fire accident. It also evaluates design accidental loads (DALs) by adopting a conventional exceedance curve of heat dose. Although DALs are probabilistically determined, their use in a complete structural consequence analysis and probabilistic safety assessment is not straightforward. Paik et al. [
9] and Paik and Czujko [
10] proposed another quantitative procedure, the joint industry project on the explosion and fire engineering of floating, production, storage and off-loading units, which randomly generates fire scenarios based on an input of several random variables associated with individual probability density functions. This procedure follows the same exceedance curve-based approach as DAL determination, resulting in the same limitations [
11].
Accidents on offshore structures occur frequently. Accident statistics for floating offshore units state that falling objects are the most common type of marine accidents, as illustrated in
Figure 1 [
12]. The collision of a falling object with the deck structure or equipment during the operational scope of a topside crane can cause structural damage or interrupt operations. It may even lead to pipeline gas leakage or a fire disaster, endangering lives and health, and damaging the marine environment [
12,
13]. Although international rules and regulations strongly recommend the evaluation of probabilistic impact risk from dropped objects in the offshore industry, most engineers find it difficult to estimate a reliable failure probability because there are no tangible guidelines on probabilistic impact analysis for dropped objects [
14]. Therefore, an effective impact analysis method for dropped objects on a topside platform is crucial for marine engineering.
Several relevant analytical methods have been proposed for offshore risk assessment. Numerical simulation techniques have been used to address structural integrity in the case of impact scenarios. The selection of relevant design accidental loads is dependent on a safety philosophy to provide a satisfactory level of safety. The loads defined by the present study represent the level of safety considered acceptable by DNVGL-OS-A101 [
15] and are generally based on accidental loads affecting safety functions with an individual frequency of occurrence in the order of 1 × 10
−4 per year. This will normally correspond to an overall frequency of 5 × 10
−4 per year as the impairment frequency limit. Sun et al. [
16] simulated the response of stiffened plates to dropping objects using nonlinear finite element software, where various boundary conditions, horizontal speed of dropped items, and geometry of dropped items were considered. The effective contact area, speed of dropping items, and impact location served as important factors influencing the safety of offshore platforms. Moan [
17] focused on the Accidental Limit State (ALS) basis used for the offshore platforms in Norway and other geographical locations, and dealt with the development of an operational design standard for ALS to establish damage tolerance and robustness [
18]. Ehlers [
19] illustrated a true strain and stress relation for mild steel that was suitable for implementation in finite element models. The true strain and stress relation was utilized to simulate a plate punching experiment until fracture using the finite element model (FEM). Similarly, Storheim and Amdahl [
20] surveyed the effect of various features of the complete stress-strain curve on the predicted outcome of a collision simulation. Nonlinear finite element analysis simulations of a full-scale impact scenario revealed that the slope of the stress-strain curve determined how strains localized, and thereby when and where fracture propagated.
Akkus and Kaeding [
21] performed drop tests to evaluate accidental impacts using the analysis system (ANSYS). The comparisons of simulation and experiment demonstrated the strong effect of mesh size, dropped object geometry definition, and material model. Paik [
22] analyzed structural crashworthiness under dynamic and impact loading to compute structural deformations or damage and associated reaction forces over time. The energy absorption properties of structures in accidental loads can be calculated by integrating the area below the accidental force-deformation curve. Ozguc [
23] performed a drop object study to identify the effect of dropping heavy items on the floating production storage and offloading (FPSO) hull structure. The drop object impact analyses showed that even though certain structural members were permanently deformed by drop loads, failure did not occur in accordance with the plastic strain criteria outlined in NORSOK standards. They observed that the pillars supporting the main lay-down area had not been subjected to buckling failure through the examined reaction forces. Further, the impact resistance of a deck depended on the plate thickness and the size and spacing of the supporting stringers. For future study, drop experiments on a deck model made of conventional ship-building steels and comparison with numerical findings via nonlinear finite element (FE) analysis are recommended. In addition, the examination of possible statics on the load-response relationship owing to dropped object loads is recommended, primarily to determine the extent of damage caused by the impacted versus impacting structure.
Therefore, this study focused on the impacts of dropped objects by combining frequency and consequence analyses in the design of a modern offshore platform. This paper proposes a modified QRA procedure for assessing production module protection against accidental external loads. Based on the proposed QRA procedure, frequency and consequence analyses were performed to solve the dropped object problem. An exceedance curve was plotted and a high-risk management item was derived through this process. In particular, the difference between the potential energy and impact energy according to the drop orientation was verified by simulation and experimentally. In structural design, the proposed procedure should be used to calculate the maximum impact energy. Numerical simulations were performed to verify the QRA procedure and the results for dropped objects.
3. Research Basis
The FPSO unit can produce and store liquefied natural gas (LNG) in the sea and transfer LNG products through offloading facilities to LNG carriers worldwide. The LNG-FPSO is movable and can be reused in other offshore applications [
24].
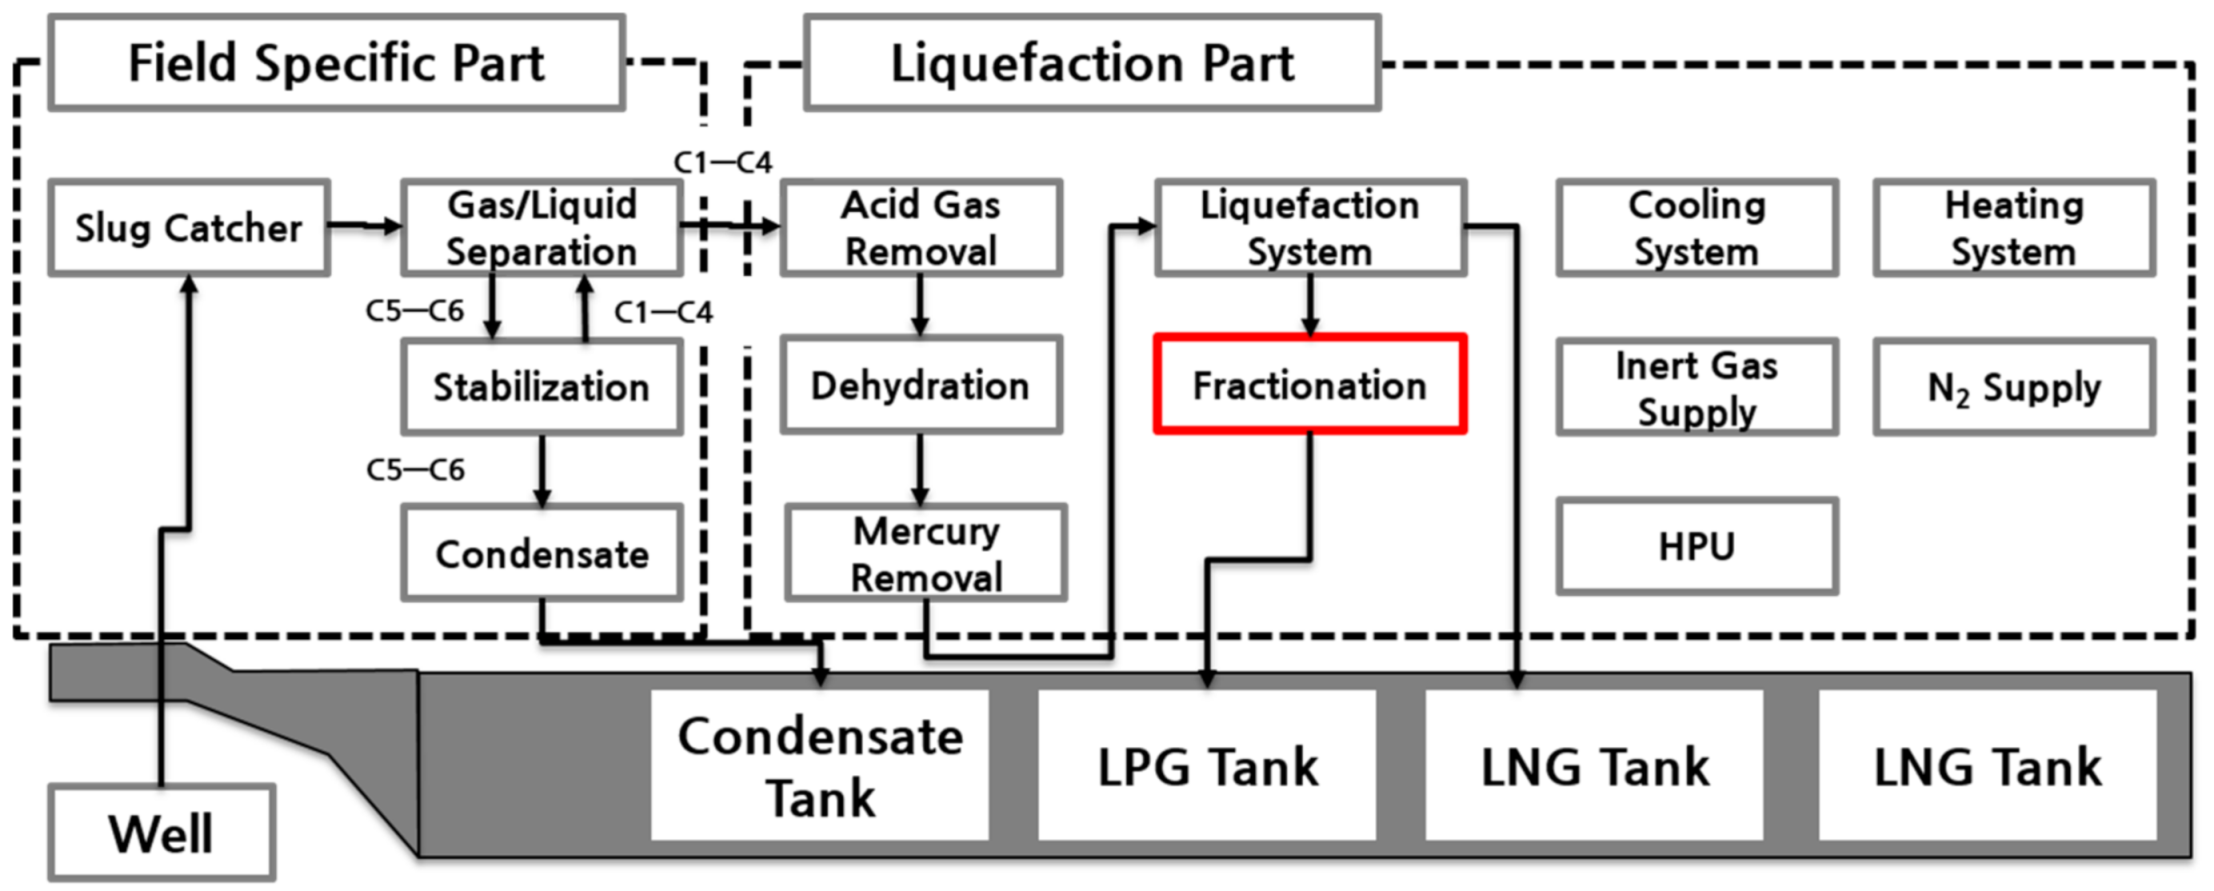
In this study, the LNG-FPSO fractionation module was selected for the QRA of dropped objects on the offshore platform [
25]. Fractionation is part of liquefaction, as shown in
Figure 2. Fractionation was selected because of its high frequency of accidents among the liquefaction processes, and the QRA procedure and results of a heavy weight drop are discussed in this context.
The fractionation module consists of a process deck, mezzanine deck, and upper deck. The key locations in the module are shown in
Figure 3. The first process entails a separation/extraction system. The separation process separates the gas into hydrocarbons C1–C2, C3–C4, and other configurations via a demethanizer and stabilizer, as shown in
Figure 2. The second process entails a liquid petroleum gas (LPG) system, where C3 and C4 are stored in respective LPG tanks.
The maintenance equipment of the module is divided into 15 types, as listed in
Table 1. Equipment specifications are subdivided into size, quantity, weight, and force. The heaviest equipment listed in
Table 1 is the LPG compressor, and the lightest is the condensate cooler. These specifications are provided by a project named QRA based on design verification technology for highly hazardous accidents of offshore installations (10041090).
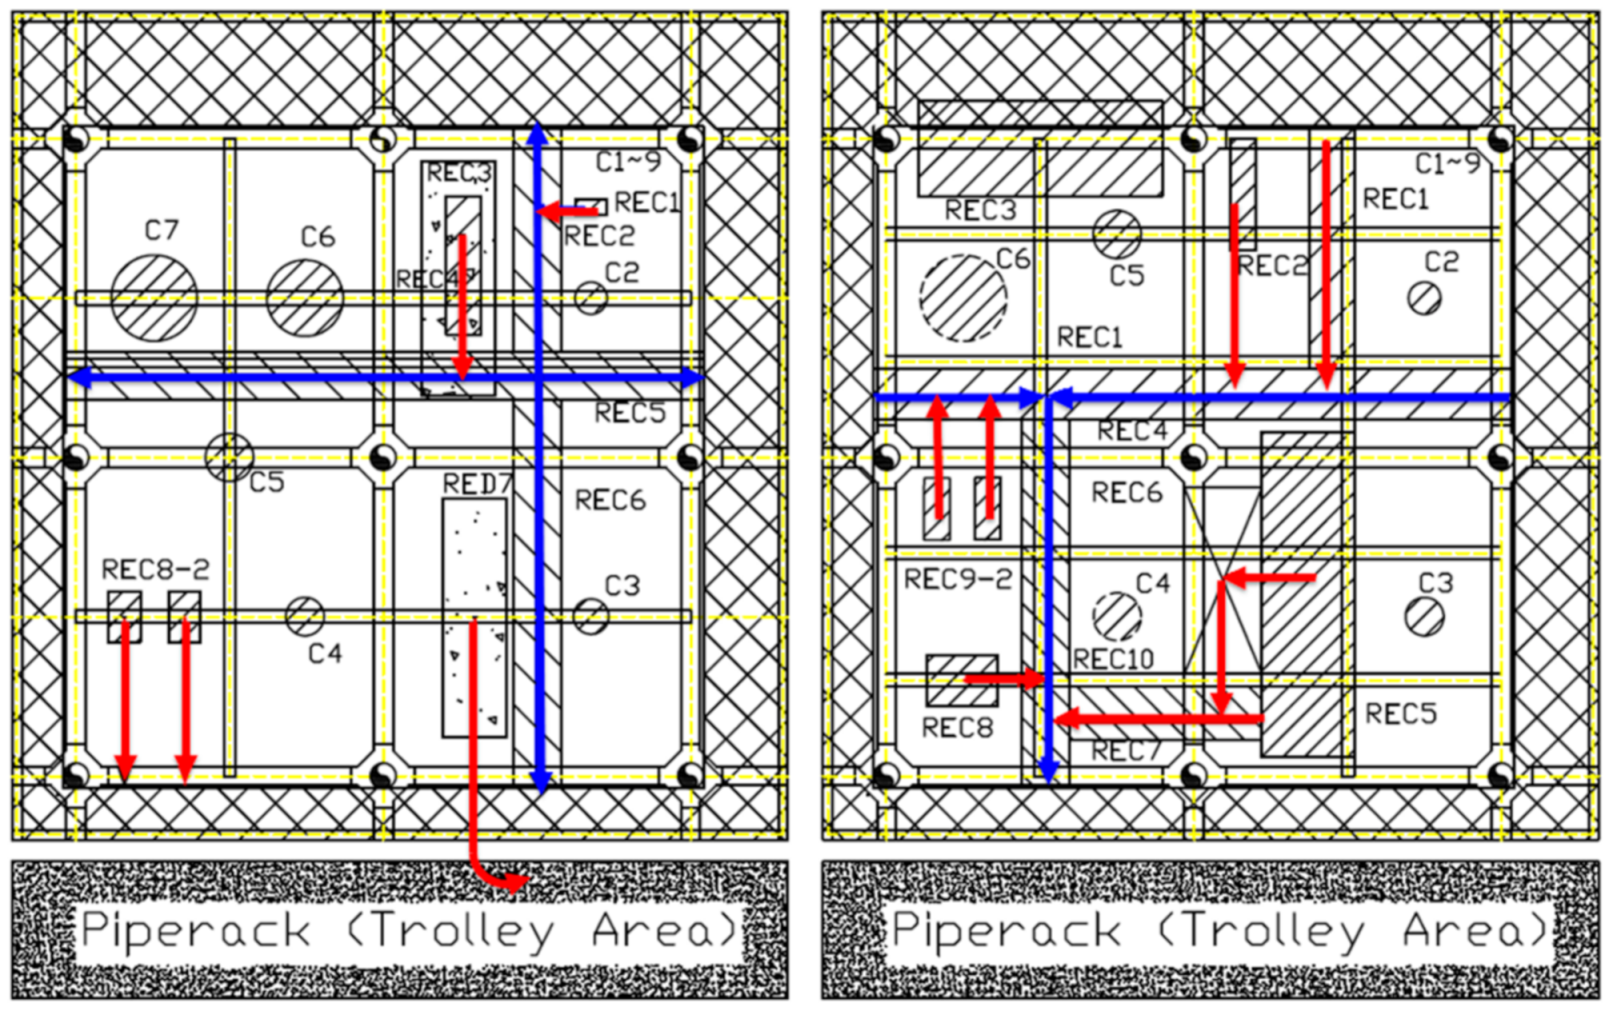
Figure 4 shows the material handling route for the process deck and upper deck.
Table 2 describes the material handling symbols.
4. Dropped Object Frequency and Consequence Analyses
Research on dropped objects on an offshore plant is divided into the topside and subsea areas, as shown in
Figure 5. In this study, topside frequency and consequence analyses were performed simultaneously. Frequency analysis was divided into the crane area and monorail areas. This study focused on heavy objects falling on board. The frequency and consequence analysis results for an on board dropped object can be used to create an exceedance plot. The DAL focused on items exceeding the critical criteria among the maintenance equipment items derived from the exceedance curve, and the influence of the dropped objects on the equipment was analyzed extensively.
Figure 6 shows the detailed QRA procedure for topside dropped object analysis of offshore structures. Material handling was investigated based on topside and equipment layouts of offshore structures, and results were derived from crane operation and material handling procedures. Based on the results of the material handling study, QRA engineers constructed an accidental load scenario, identified key service areas where equipment protection was required, and then categorized the areas where objects were likely to fall.
QRA engineers identified the equipment and devices that required protection in the specified drop zones and evaluated the impact of dropped objects on said equipment. The six major parameters required for heavy-object drops are weight, position, impact energy, impact orientation, impact type, and stiffener position, as shown in
Figure 6. In this study, impact energy was considered to be sufficient for accidental load design because it yielded different results depending on the object impact orientation.
The impact locations were determined, and frequency and consequence analyses were performed according to service areas, moderate areas, and non-critical areas after estimating key variables. The frequency and consequence analytical processes are described in detail in the case of heavy objects. The impacted structure energy absorption was evaluated according to the analytical results. Service and operational constraints were added to the final design, depending on whether the estimated energy could be absorbed. If this was not satisfied, the first six design variables were reselected, and the design process was repeated.
The probability of a dropped object is defined as the probability that equipment will fail because of a heavy object drop [
26]. The probability of a dropped object is expressed by the following formula:
PFDI = Probability of equipment failure because of a dropped object impact
Ni = Number of lifts per load category i
PDi = Probability of a load dropped from a crane for load category i
PHij = Probability of equipment j being hit by a falling load in category i
given that the load is dropped
PFij = Probability of failure of equipment j given impact by load category i
The predicted impact energy (
E) due to a dropped object was modeled as potential energy using Equation (2).
Table 3 lists the numerical modeling specifications. This table shows the service items, expected impact energy, weight, height, annual lifting frequency, drop probability, and drop impact probability. The probability of falling was derived from the “Mechanical lifting failures” of Oil and Gas Producers (OGP) [
27] by citing the dropped object probabilities for fixed installation data:
where
m = drop mass,
g = gravitational acceleration,
h = drop height.
According to the material handling standard for the FPSO topside, a load is transported by the operator when it is less than 50 kg and by a monorail, such as a passive chain block and beam clamp or manual trolley hoist and jib crane, when it is between 50 kg and 2 tons. If it exceeds 2 tons, pedestal cranes are required to lift it by a chain block or trolley hoist. The items maintained by the FPSO separation module are listed in
Table 1, and include details on the sizes of the listed items.
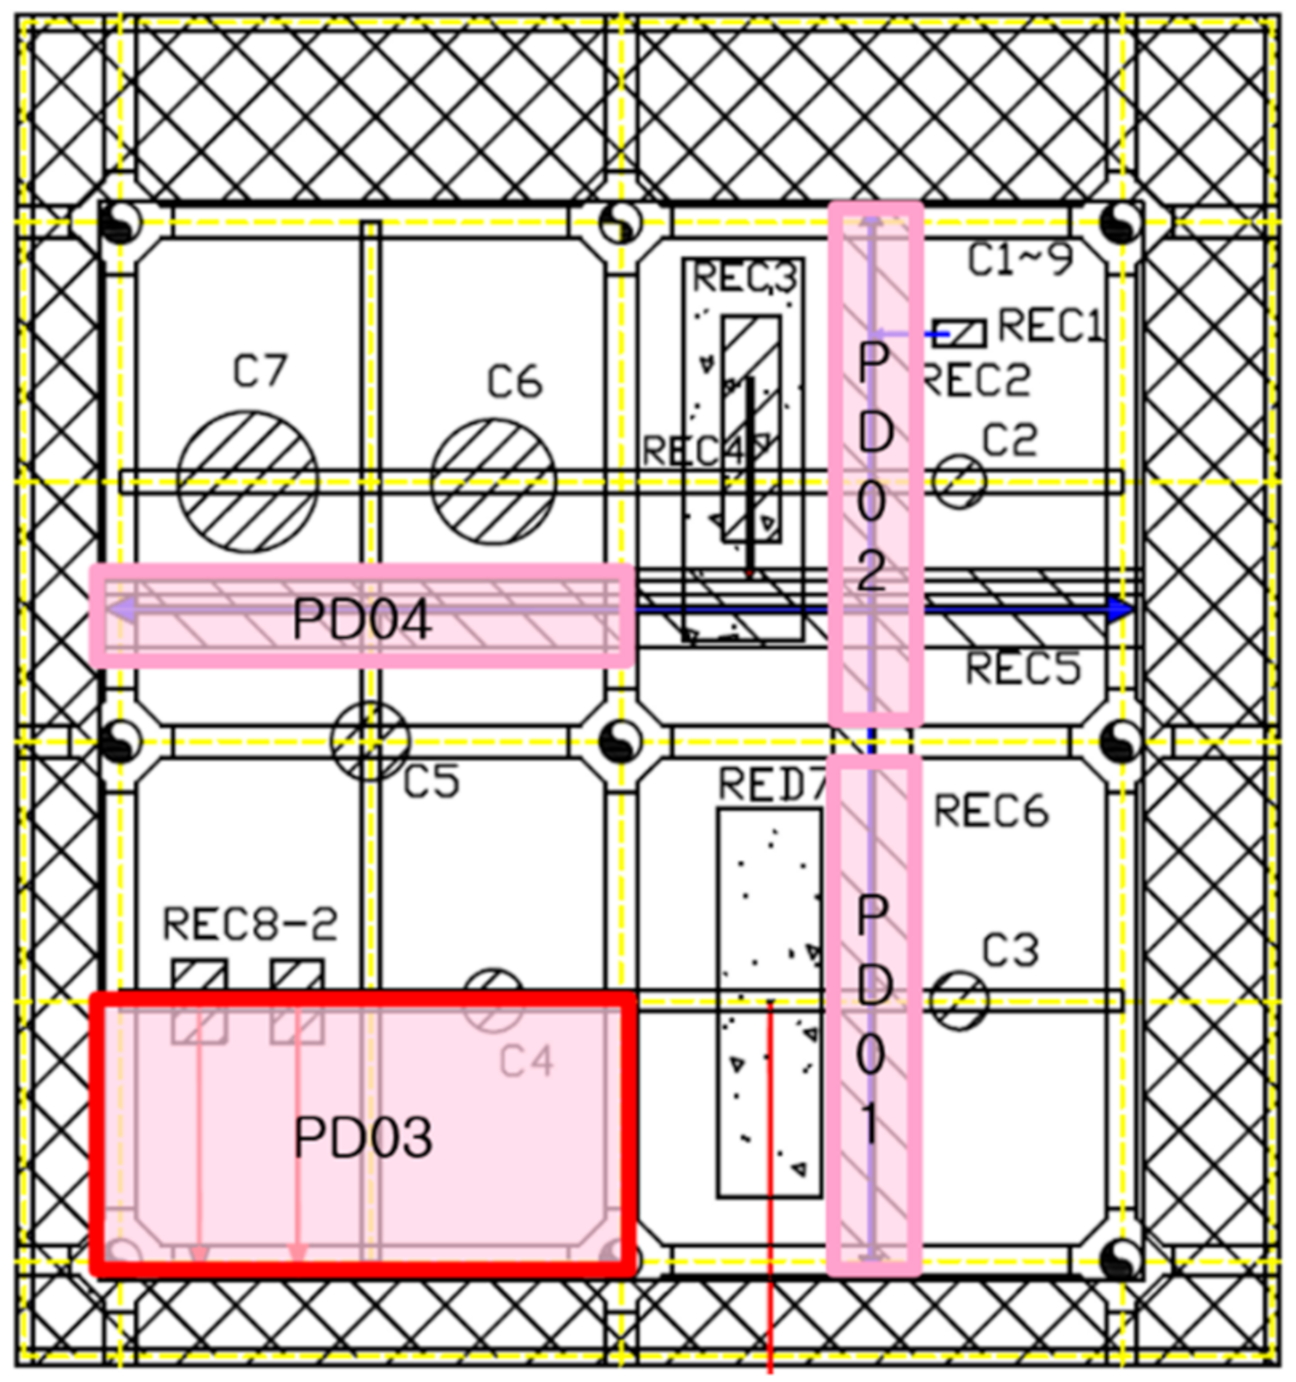
As shown in
Figure 7, the drop area was set to PD01–PD04 on the process deck of the fractionation module. The manual defines constraints for constructing scenarios corresponding to lifting devices and paths of process decks.
− Removal of equipment via the monorail, jib crane, cart, etc., in the case of a process deck,
− Removal of the demethanizer and stabilizer reboilers via the monorail,
− Removal of the LPG rundown pump after being moved to the trolley area using a cart.
The probability of a dropped object is defined as the probability that equipment will fail because of a heavy object being dropped, as listed in
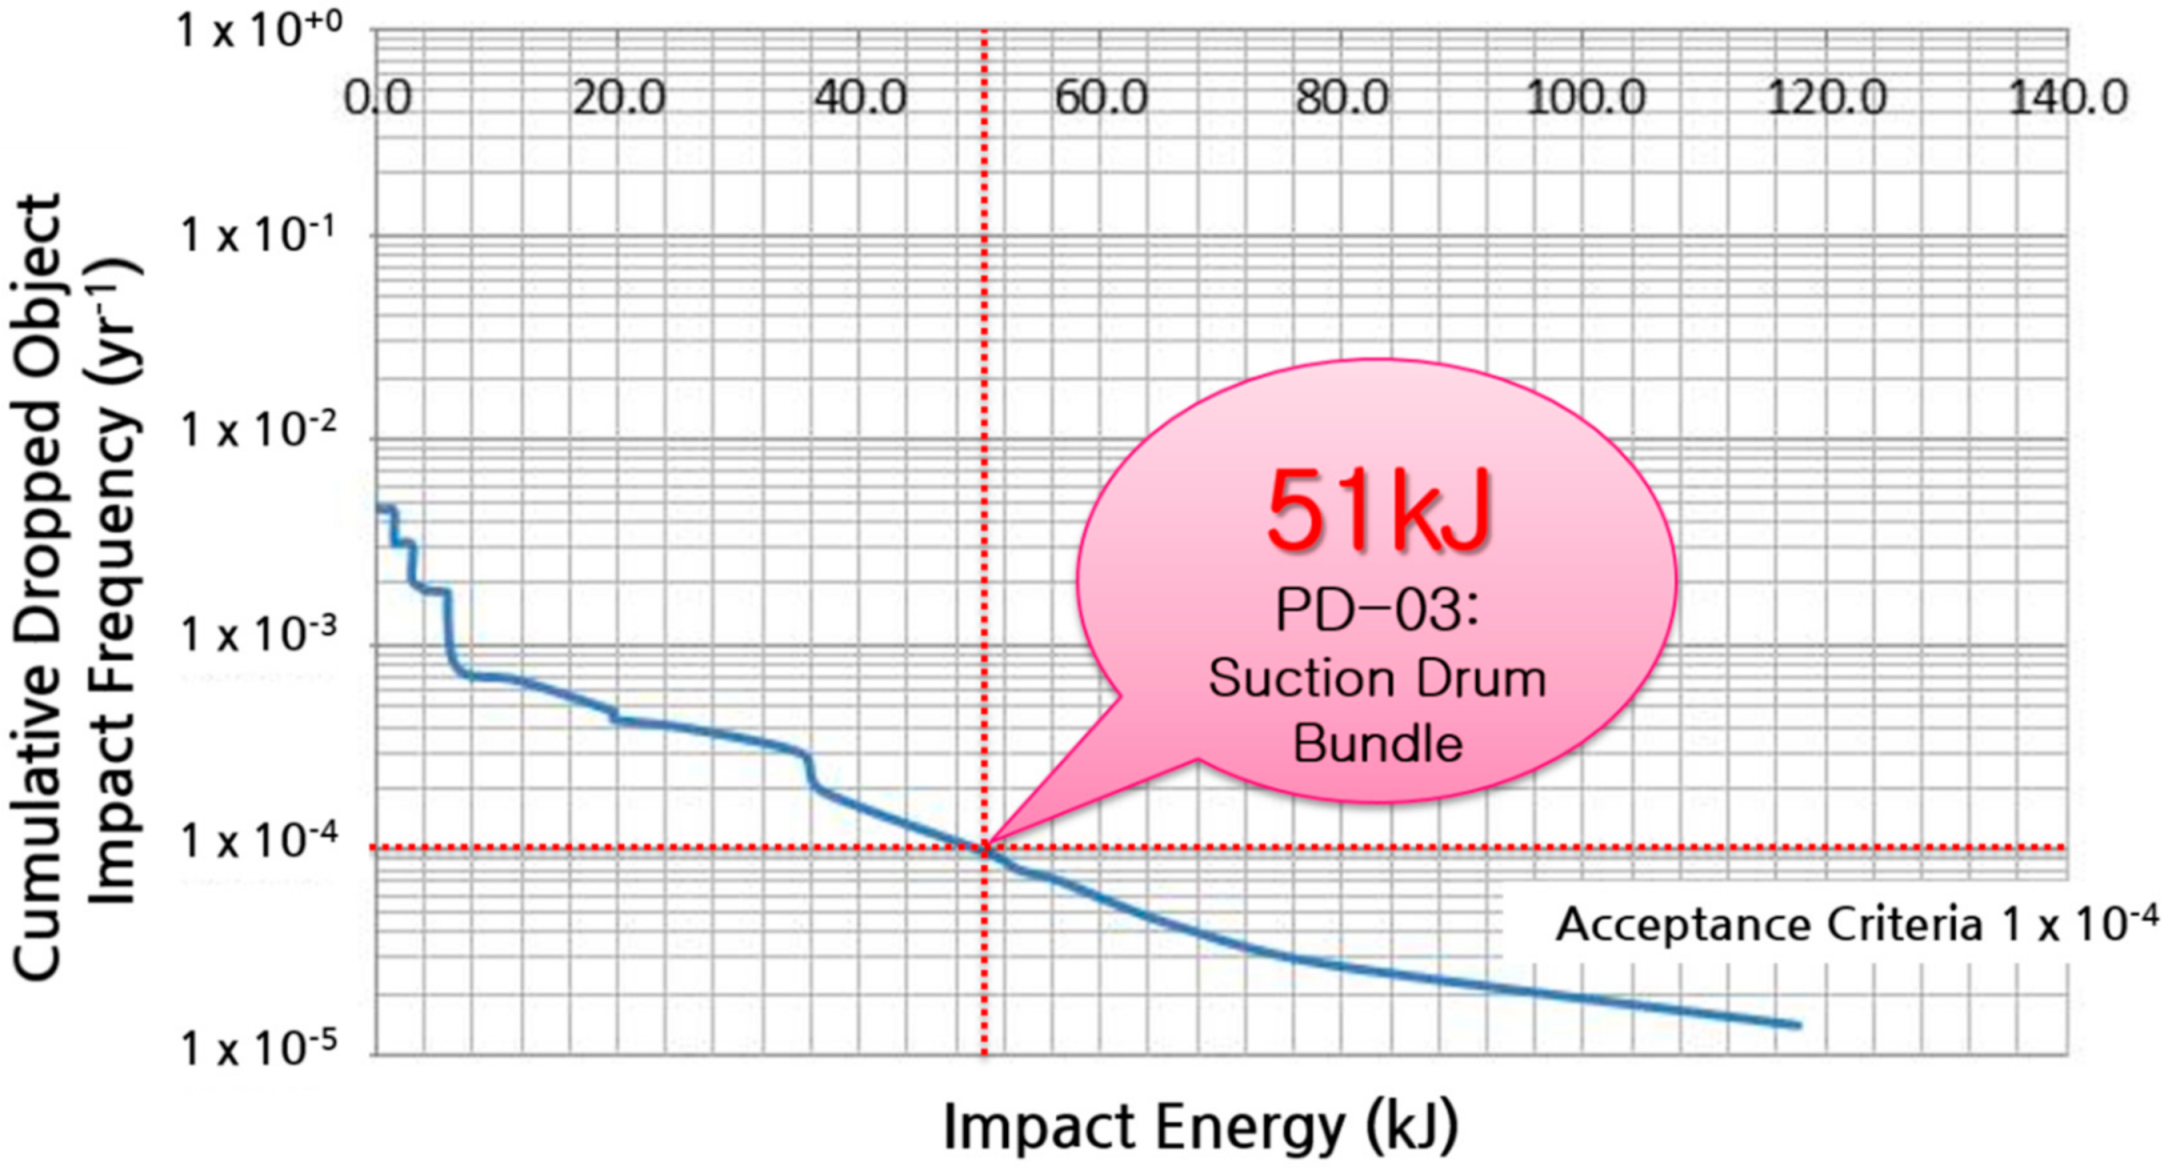
Table 3. The impact energy was modeled to express an exceedance curve, which is a graph of impact energy according to the drop probability, as shown in
Figure 8.
The impact energy of 51 kJ was derived from the acceptance criteria of 1 × 10
−4 [
28] by expressing the exceedance curve according to the dropped object. The corresponding weight was derived from the suction drum bundle in Drop Zone PD03:
− Impact Energy: 51 kJ,
− Shape: Cylinder type,
− Material Type: AH36 steel plate,
− Size: 1.6 m × 6.8 m,
− Weight: 1.3 MT (metric tons),
− Height: <5 m.
The six parameters affecting the process deck of the fractionation module are drop weight, position, impact energy, impact angle, impacted body type, and stiffener position. Sensitivity was analyzed according to the drop weight and impact frequency. As illustrated in
Figure 9, the sensitivities to the drop weights were confirmed to be 0.5, 0.7, 1.0, 1.5, and 2.0 × W (W = 1.3 metric tons). We checked each exceedance curve based on the proposed acceptance criteria 1 × 10
−4, and the impact energies were 25.5, 35.7, 51.0, 76.5, and 102.0 kJ, respectively.
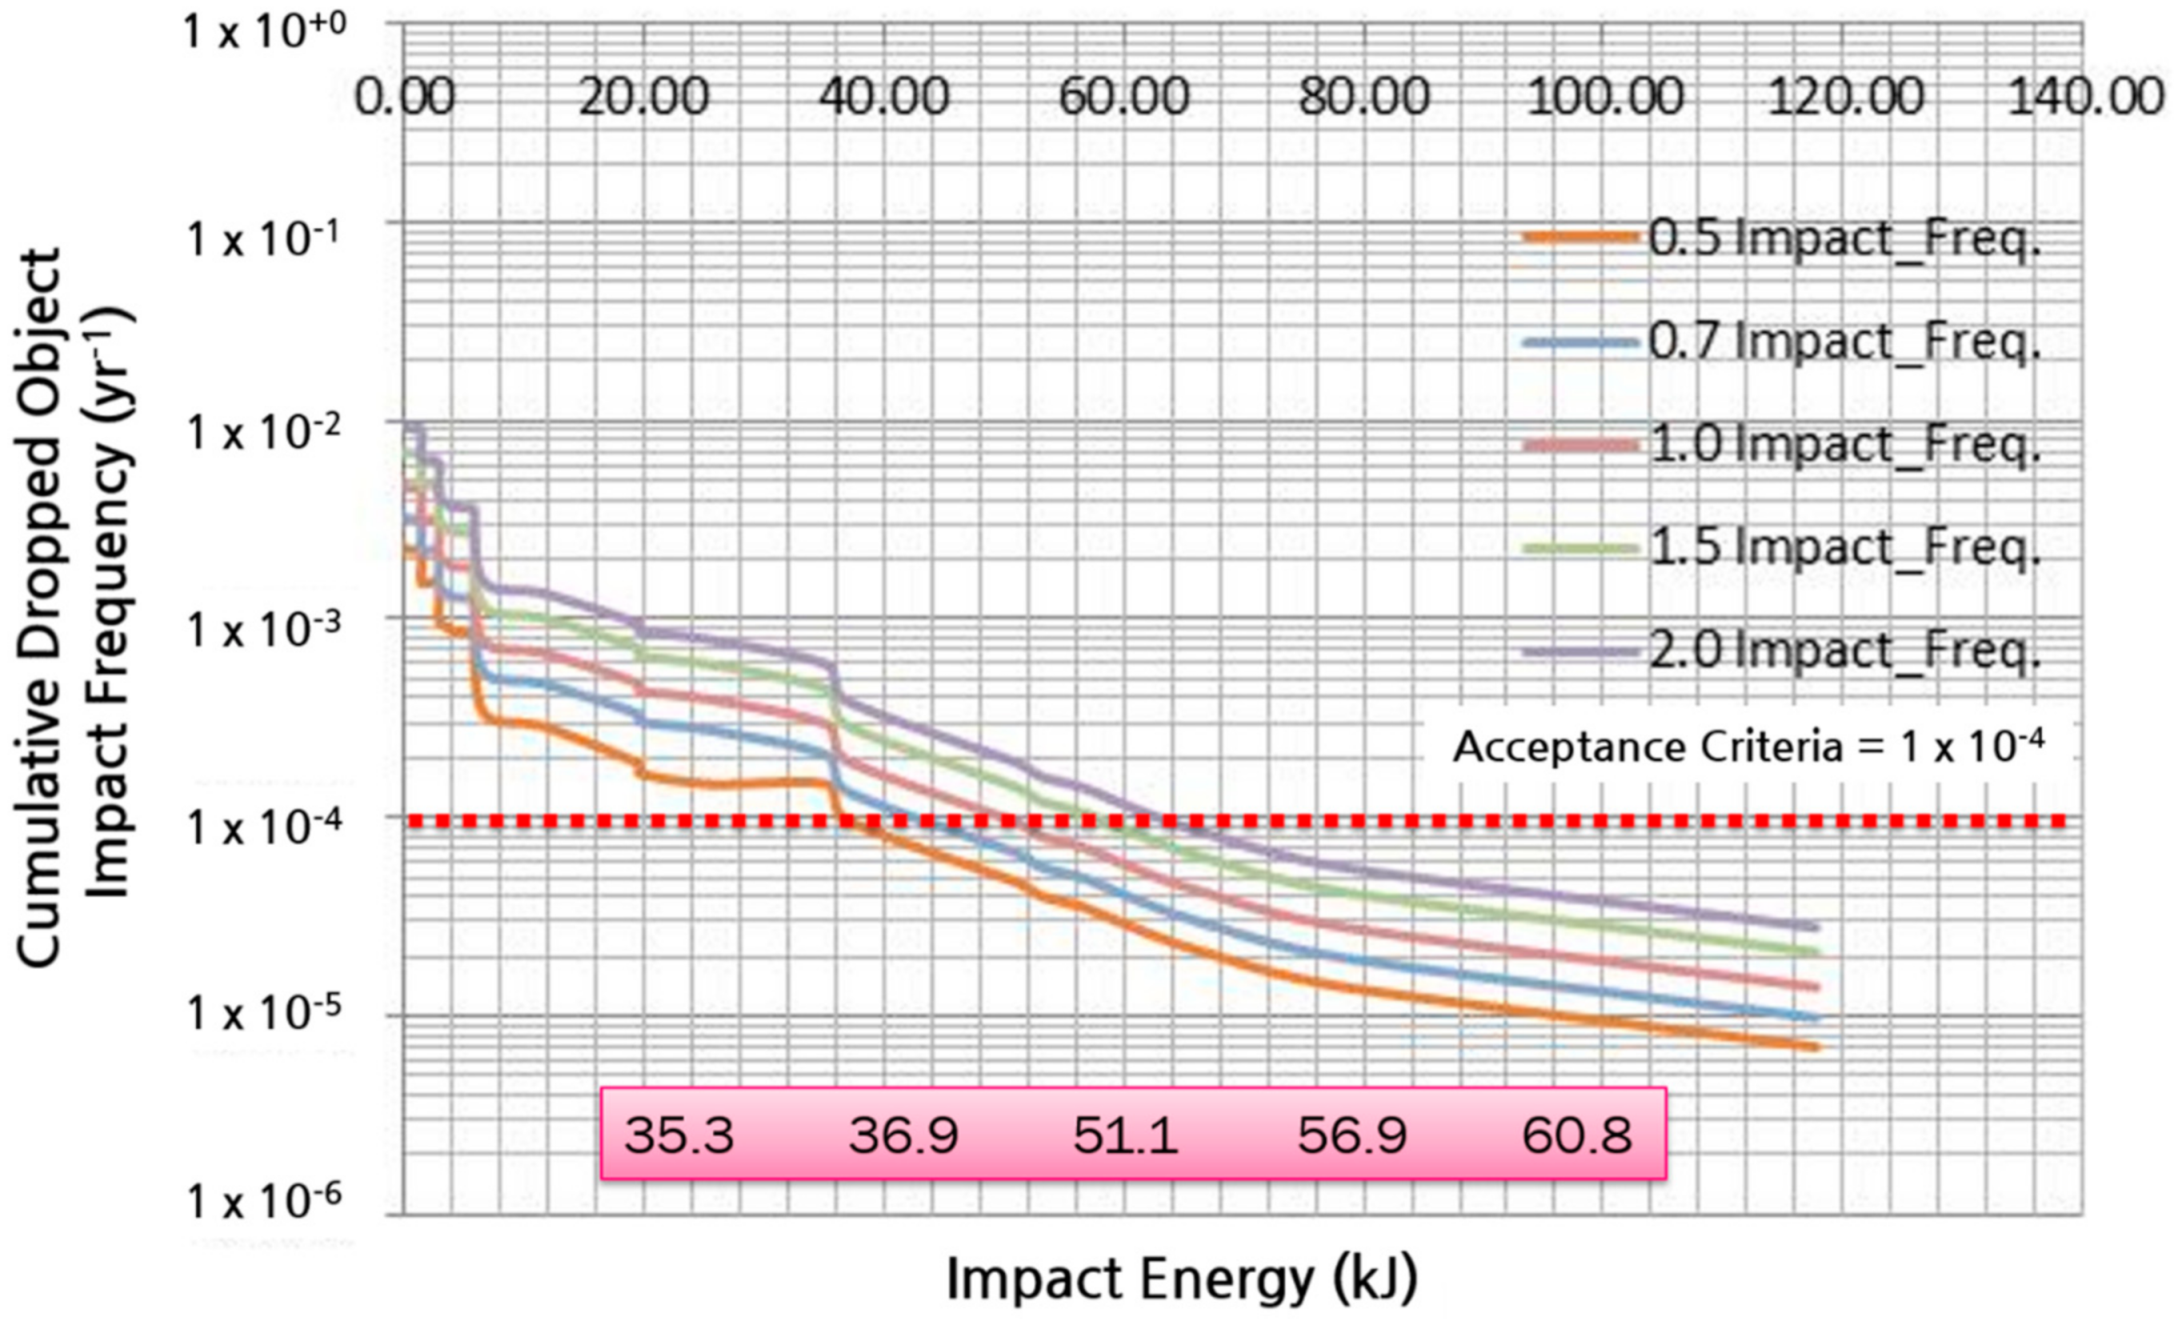
The sensitivity analysis of the impact frequency was conducted at 0.5, 0.7, 1.0, 1.5, and 2.0 × F (F = Impact Frequency), as shown in
Figure 10. Impact energies of 35.3, 36.9, 51.1, 56.9, and 60.8 kJ were obtained for the acceptance criterion of 1 × 10
−4 based on each exceedance curve. The minimum value was 1.72 times less sensitive than the maximum value for drop frequency and 4.0 times for the drop weight.
Figure 9 and
Figure 10 show that drop weight affects the impact energy more than impact frequency. The results drive the focus towards the relationship between impact energy and impact orientation in
Section 5.
5. Numerical Simulation and Test Evaluation
In this study, to develop a solution to reflect various drop conditions and calculate accurate impact energy, we propose a drop impact analysis method for cone-type objects as follows, and compare the analytical results to experimental results. Additionally, a drop impact simulation was performed using the proposed solution to quantitatively analyze impact energy differences according to the drop angles of the suction drum bundle.
5.1. Drop Impact Experiment for a Cone-Type Object
In this study, the impact energy of the suction drum bundle selected as the QRA results needs to be more precisely calculated through drop impact simulation and reflected in the evaluation. To verify this, the following basic experiment was conducted and the drop impact simulation of cone-type object verified by comparing the experimental results to the analytical results. A drop impact simulation was then performed on the suction drum bundle.
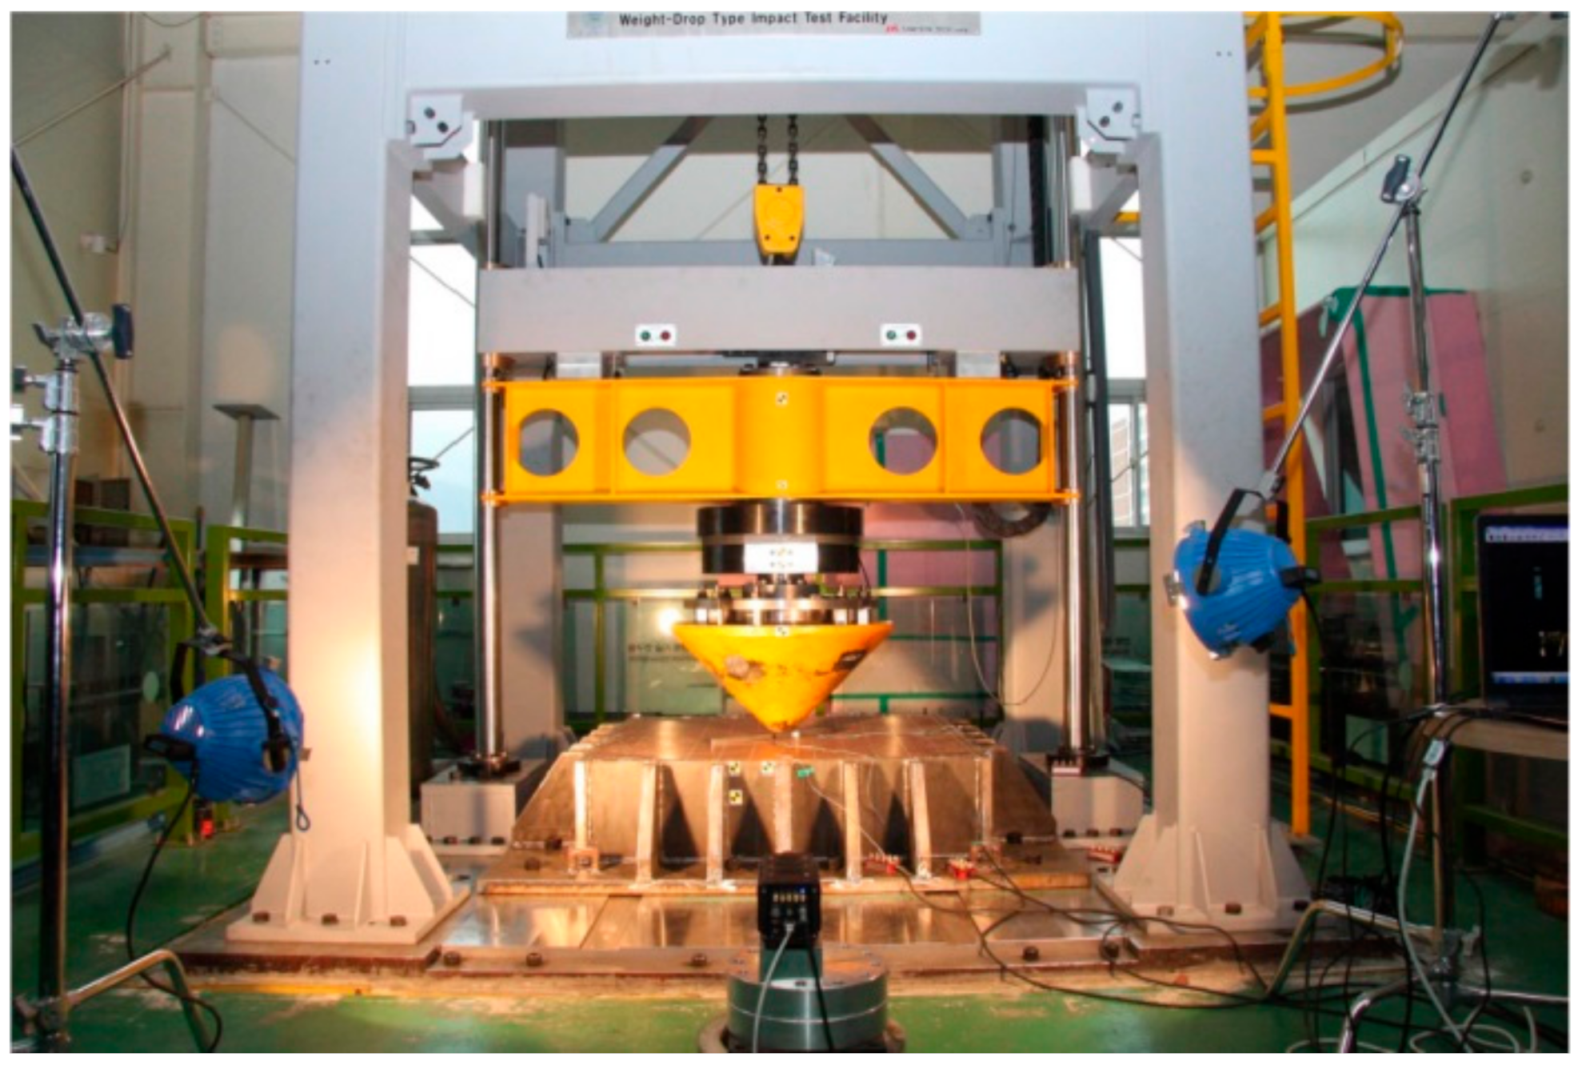
Figure 11 shows the drop impact experimental facility used in this study. The facility’s capacity is described in
Table 4.
The drop impact experiment shows that cone-type objects, such as in
Figure 12, perpendicularly free fall to the steel plate at a height of 3 and 5 m, respectively. The maximum vertical displacement of the steel plate is observed along the A-A’ and B-B’ lines, totaling 25 measuring points as shown in
Figure 13.
As a result, the maximum vertical displacement at the drop height of 3 m was 79.6 mm and the maximum vertical displacement at the drop height of 5 m was 98.4 mm as shown in
Figure 14 and
Figure 15. This means that as the drop height increases, the maximum vertical displacement also increases with the increase in the impact amount; thus, the experiment was effectively conducted.
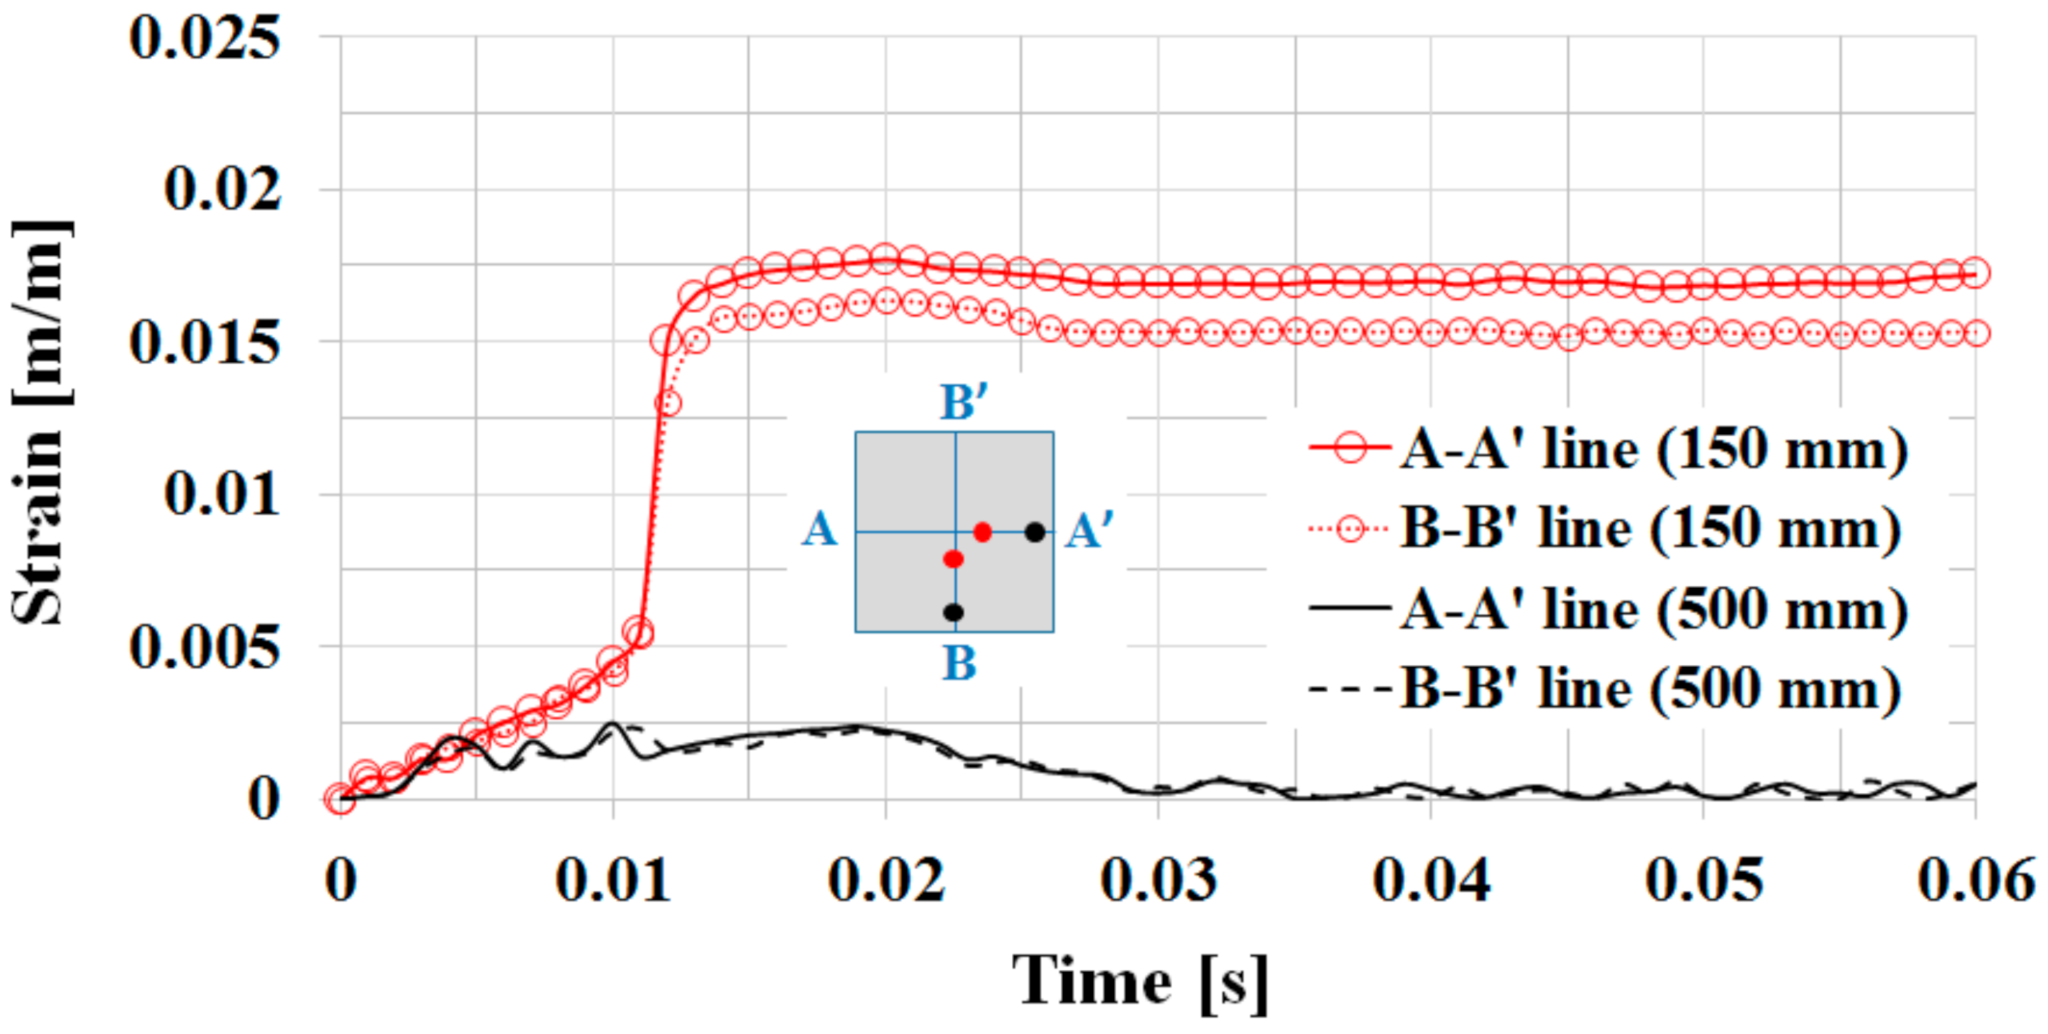
Figure 16 and
Figure 17 show the strain changes over time immediately after impact (0 s) at the drop height of 3 and 5 m, respectively. In both cases, it can be seen that the maximum strain at the 150 mm spot is greater than eight times the maximum strain at the 500 mm location. In addition, it is possible to verify that the strain remains after 0.06 s at the 150 mm spot, but at the 500 mm location, the strain converges to a value that is nearly zero. This means that the test was effectively conducted and can be seen as a relatively good implementation of local variations caused by a drop impact near the collision point.
From the aforementioned results, it was confirmed that the experiment was effectively conducted and the resultant values of vertical displacement and strain were used as a reference to verify the validity of the simulation method by comparing it to the results of the drop impact analysis later introduced.
5.2. Drop Impact Analysis of the Cone-Type Object
The drop impact analysis was performed using ANSYS/LS-DYNA software, which is able to calculate valid results for nonlinear impact phenomena.
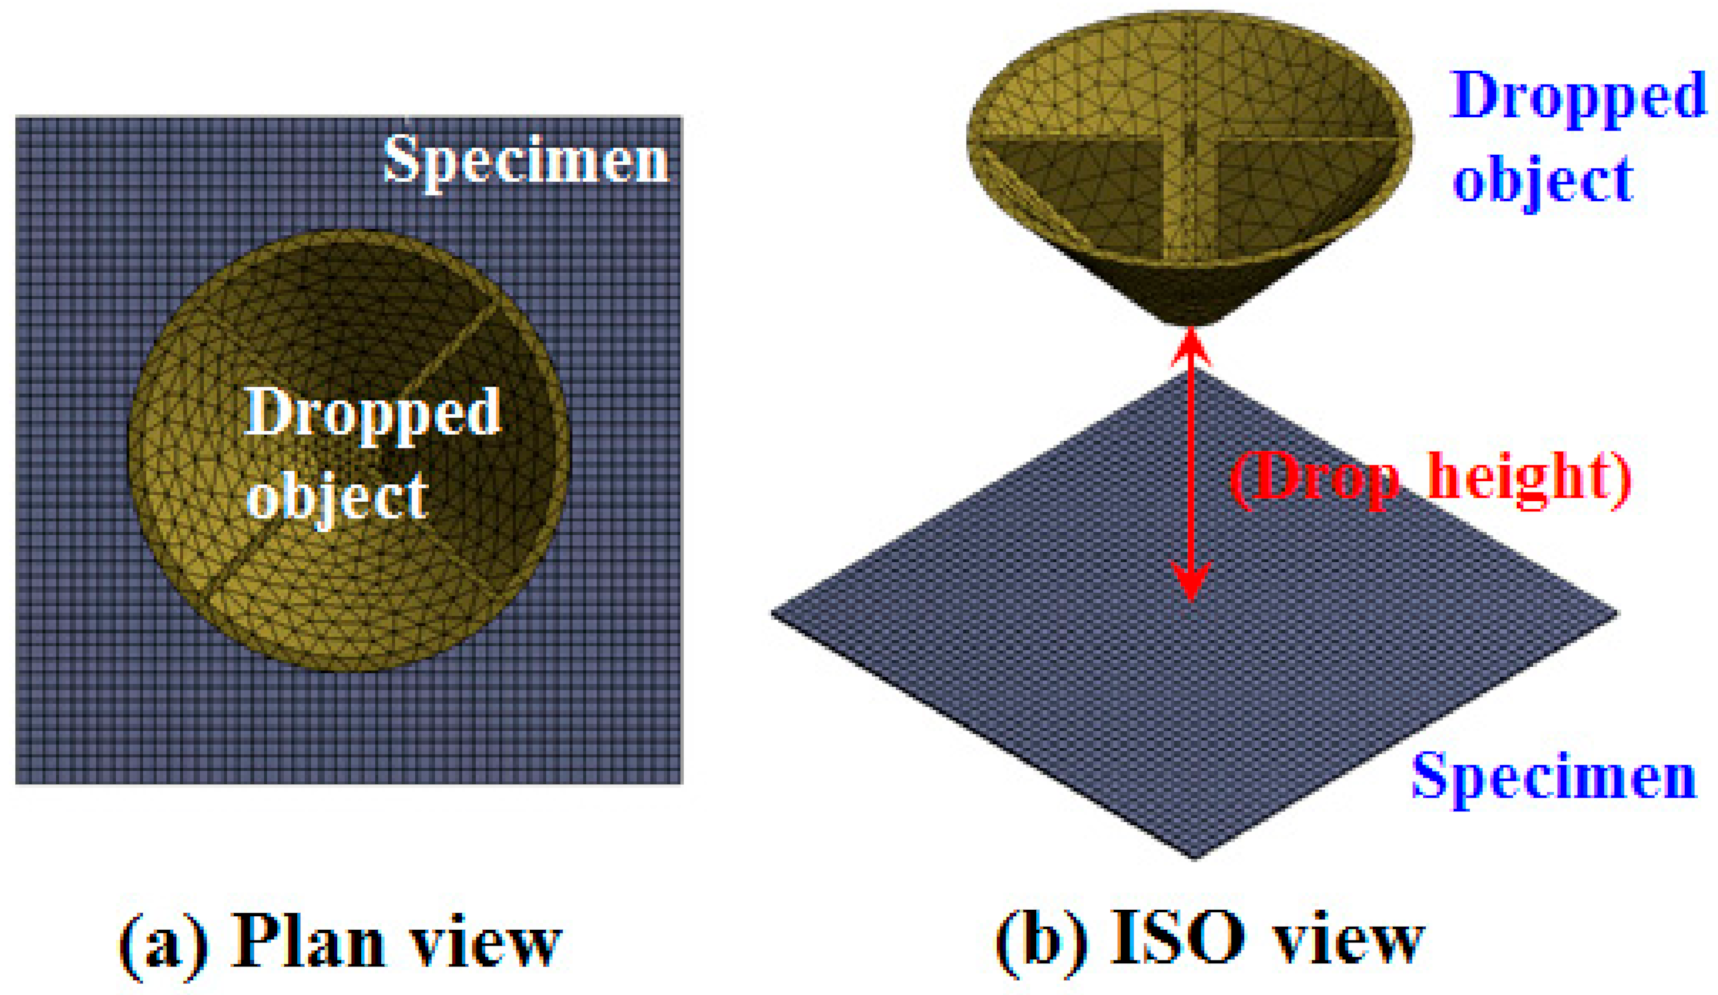
Figure 18 shows finite element (FE) models for the dropped object and specimen. The shape and size of the finite element model were identically generated to those of the dropped object and specimen used during the experiment. The FE model was generated using a four-node solid element consisting of 4517 elements and 5564 nodes.
The dropped object was assumed to have a rigid body and the average values of the mechanical properties of the specimen used are shown in
Table 5 based on the results of the self-performed tensile test.
A free fall condition (gravity acceleration of 9.81 m/s2) for the dropped object was applied as a loading condition of the drop impact analysis and a fixed support condition (six degrees of freedom of nodes on the four edge faces are set to zero) was applied as a boundary condition of the specimen. Based on these analytical conditions, drop impact analysis was performed and the analytical results of the vertical deformation and strain of the specimen according to the drop height were derived and compared to the experimental results.
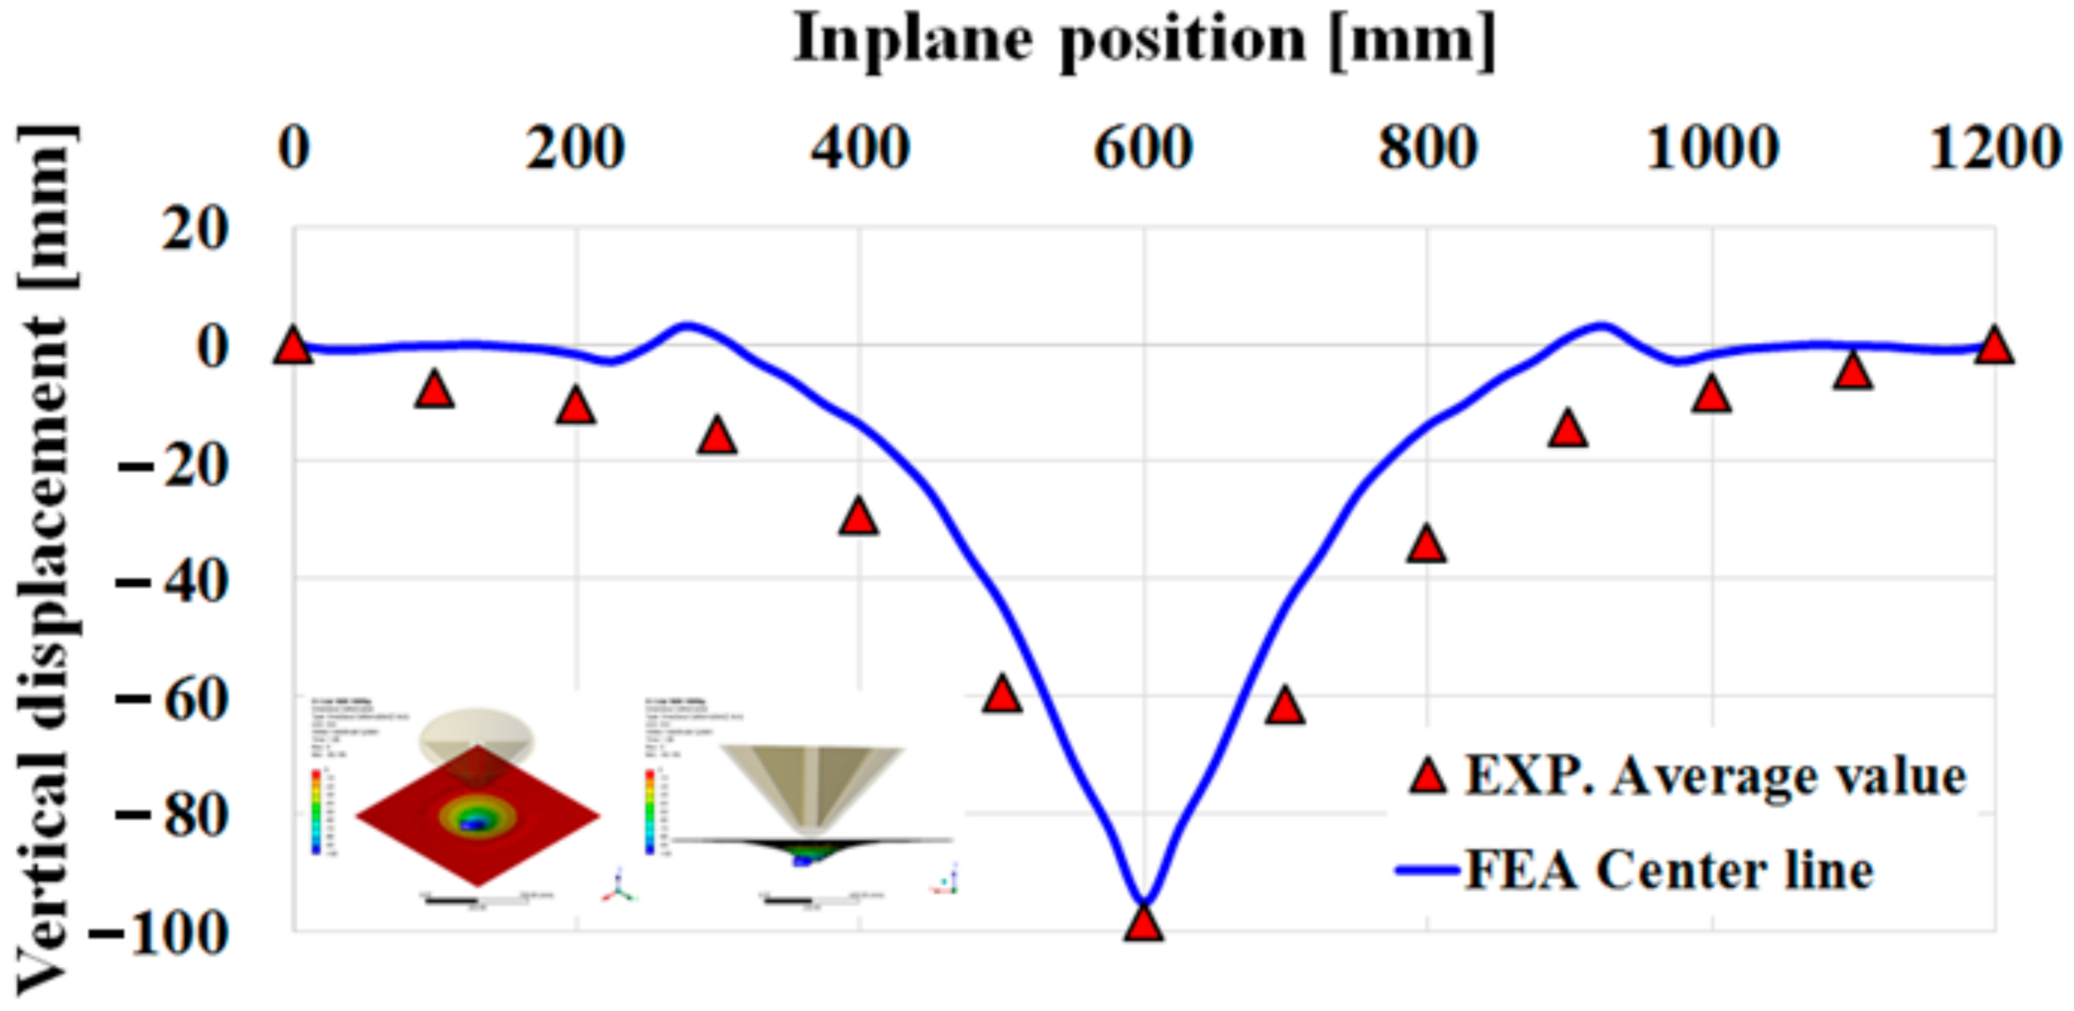
Figure 19 shows analytical and experimental results for vertical displacement in the case of a drop height of 3 m. Considering the symmetry of the analysis model, the analytical result is a plot of vertical displacement for the center line (A-A’ and B-B’) of the specimen and the experimental result (EXP.) is a plot of the average values between the A-A’ line and B-B’ line shown in
Figure 14.
As illustrated in
Figure 19, the analytical and experimental results show some differences between the 300 and 900 mm positions, but the overall pattern of change is similar. In particular, the maximum vertical displacements at the impact point which is intimately related to the value of the impact energy are −79.6 mm (experimental value) and −75.5 mm (analytical value). This is an error of approximately 5.2%, but is acceptable in the research field of nonlinear collision analysis. The drop impact analysis method as proposed can be used for relatively accurate calculation of drop impact energy considering the angle of collision of the suction drum performed in this study.
Figure 20 compares the analytical results to the experimental results when the drop height is 5 m. As in the case of a drop height of 3 m, the overall pattern of deformation in the analytical and experimental results is similar. In addition, the maximum vertical displacement value during the experiment is −98.4 mm and the FEA value is −95.2 mm, with an error rate of approximately 3.3%. This value is also acceptable in the research field of nonlinear collision analysis. In
Figure 20, it can be observed that the kink occurred at approximately 900 mm in the FEA curve. This is considered to be the point where a relatively large deflection occurs in very small area. To analyze local large deflection phenomena, the mesh control in that area is important. However, the simulation time cost for fine meshes increases significantly. In this study, the mesh size selected can yield analysis results of vertical displacements that agree well with the experimental values.
Meanwhile, to demonstrate the application possibilities of the proposed drop impact analysis, experimental results of strain measured near the impact point (at a point 150 mm from the crash point) and analytical results of strain calculated at the same position were compared as shown in
Figure 21 and
Figure 22.
Figure 21 shows a comparison of the strain values over time immediately after impact (0 s) in the case of a drop height of 3 m. The average value is plotted based on the data shown in
Figure 16 and FEA is the value of strain calculated at a point 150 mm from the crash point. As shown in
Figure 21, the tendency of the strain change from the moment of impact up to 0.01 s is somewhat different but the plastic strain value, which is closely related to the impact energy, has a margin of approximately 8.6% error with 0.0163 (experiment) and 0.0149 (analysis) at 0.06 s. The elastic strain generated in a very short time is closely related to the friction between two objects and the initial collision conditions. The difference between the analysis result and the experimental result in the elastic region can be considered as a limitation that such a phenomenon cannot be strictly simulated by analysis.
Figure 22 shows a comparison of the strain values over time immediately after impact (0 s) in the case of a drop height of 5 m. As shown in
Figure 22, although the pattern of instantaneous change in the strain from the moment of impact to 0.015 s is somewhat different, the plastic strain is 0.0189 (experimental) and 0.0207 (analytical) with a margin of approximately 9.5% error at 0.06 s.
Based on the aforementioned drop impact analysis results, it is possible that the proposed method can sufficiently reproduce drop impact experiments. Therefore, using the proven method, a drop impact simulation for the suction drum bundle was performed to calculate the impact energy considering drop angles.
5.3. Drop Impact Simulation of a Suction Drum Bundle
In this study, a drop impact simulation was performed using the drop impact analysis method to quantitatively analyze impact energy differences according to the drop angles of the suction drum bundle derived from the QRA results provided in
Section 4.
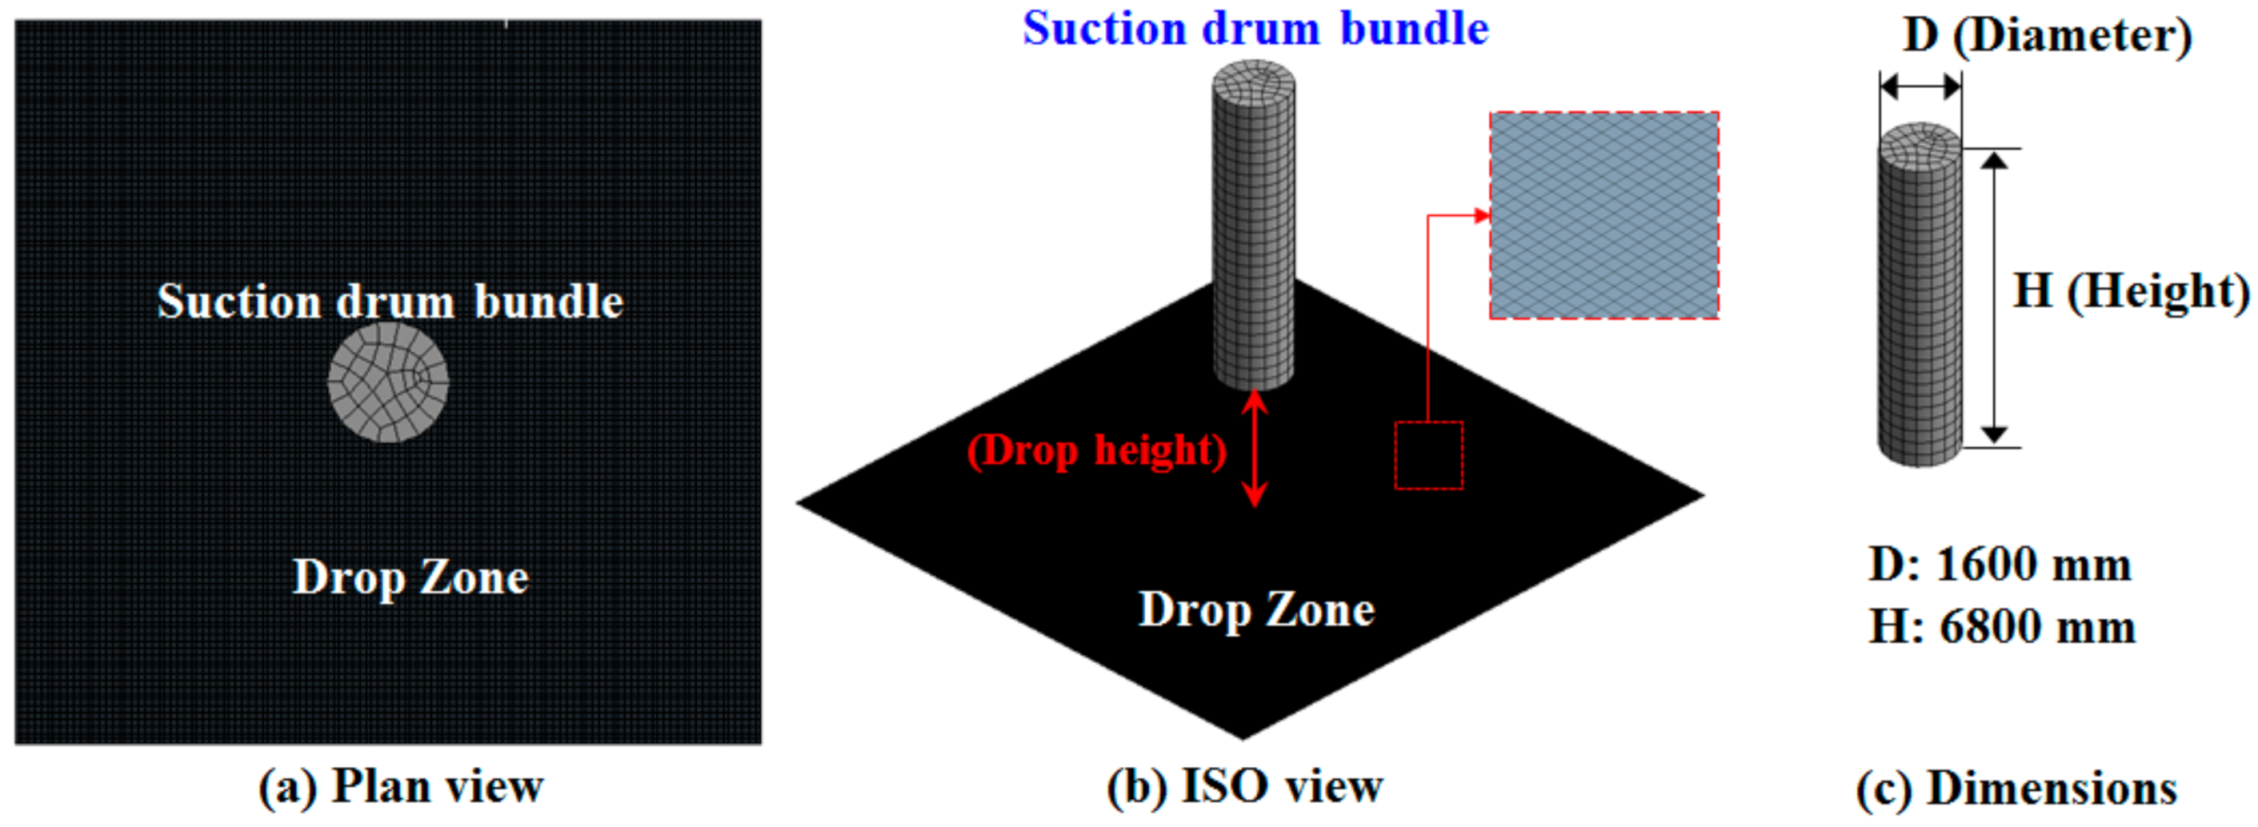
Figure 23 shows the FE model of the suction drum bundle of the cylinder type and the drop zone PD03. It is composed of 102,686 finite elements and 205,998 nodes.
To conduct the drop impact simulation, the free fall condition (gravity acceleration of 9.81 m/s
2) of the suction drum bundle (1.3 MT) was applied as a loading condition and fixed support conditions were applied as a boundary condition on the side areas of the drop zone. To compare the difference in the impact energy according to the drop angle, a simulation was performed in three cases as follows; the simulation results are shown in
Figure 24,
Figure 25 and
Figure 26.
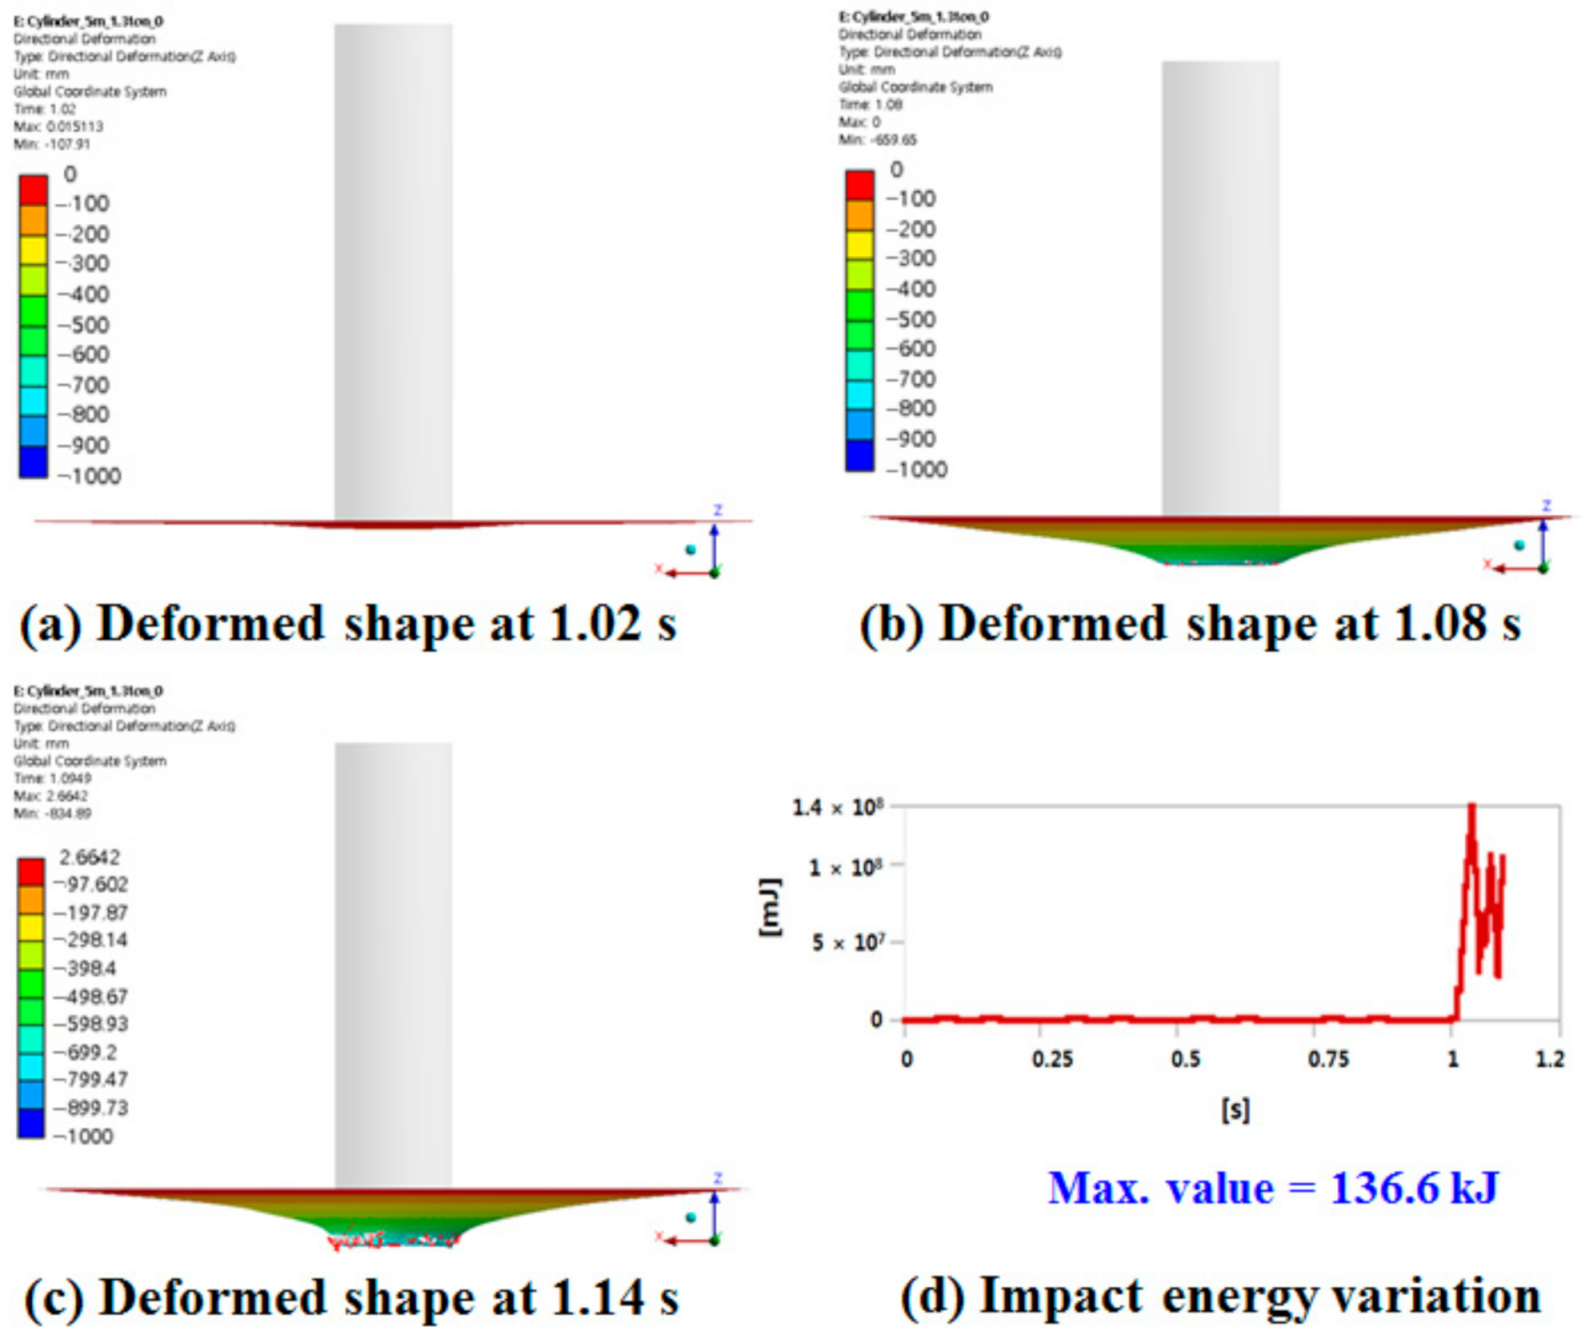
− Case 1: Vertical drop of suction drum bundle, 0°,
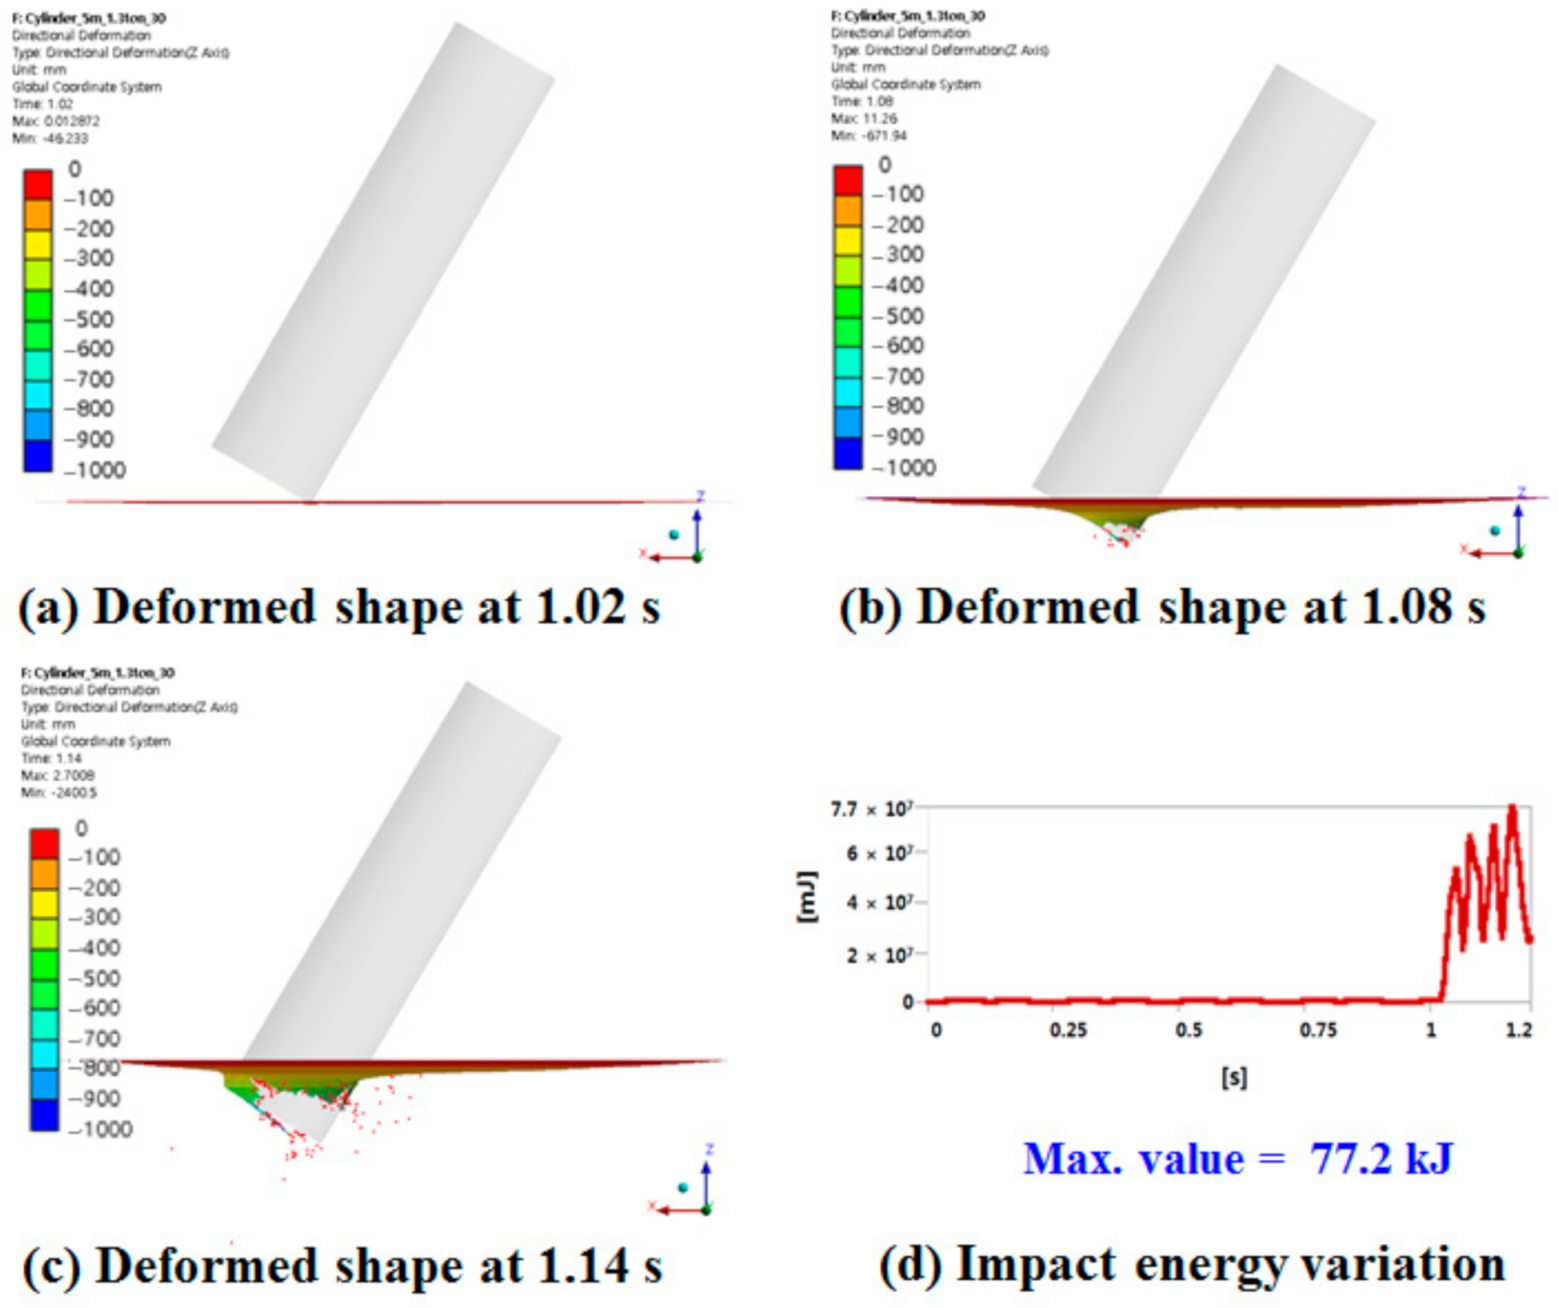
− Case 2: Drop at a certain angle, 30°,
− Case 3: Horizontal drop of suction drum bundle, 90°
As shown in
Figure 24,
Figure 25 and
Figure 26, the maximum impact energy values exceed the potential impact energy (51 kJ) of the suction drum bundle shown in
Table 3 in all cases. Particularly, the maximum impact energy value (240.3 kJ) in case 3 is 4.7 times the potential impact energy value. Meanwhile, the difference in the impact energy between case 1 and case 2 is −43.5% and that between case 1 and case 3 is +75.9% based on the impact energy value (136.6 kJ) in case 1. These results imply that the impact energy value generated by the suction drum bundle shows a large difference according to the impact orientation. Therefore, it is necessary to analyze the impact energy value and collision phenomenon according to drop angle via quantitative analysis using the drop impact analysis method in the detailed structure design stage of the drop zone following the QRA step. In addition, it is recommended that one examine the structural safety of the drop zone based on quantitative analytical results.
6. Conclusions
Offshore structure accidents occur frequently, and falling objects are the most common marine accident types. The collision of a falling object in the operation of the topside crane with the deck structure or deck equipment can cause structural damage or loss of production. Recently, QRA has been widely used as a tool for decision-making in the offshore industry.
This study focused on dropped object risk assessment based on frequency and consequence analyses in the design of a modern offshore platform. A modified QRA procedure was developed for assessing production module protection against accidental external loads. Based on the proposed QRA procedure, frequency and consequence analyses were performed to solve the dropped object problem. An exceedance curve was plotted, and a high-risk management item was derived through this process. In particular, the difference between the potential energy and impact energy according to drop orientation was verified via simulation and experiment. The maximum vertical displacements in the case of a drop height of 3 m are −79.6 mm (experimental value) and −75.5 mm (analytical value). This is an error of approximately 5.2%. In the case of a drop height of 5 m, the maximum vertical displacement value during the experiment is −98.4 mm and the FEA value is −95.2 mm, with an error rate of approximately 3.3%. Based on the simulation results of a suction drum bundle, a large difference in impact energy according to the orientation of the dropped object was quantitatively confirmed. When the object dropped in a specific orientation, the impact energy was confirmed to be up to 4.7 times greater than the assumed potential energy.
In conclusion, a dropped object risk assessment should be performed according to the proposed QRA procedure. Subsequently, drop impact analyses and simulations should be performed to calculate the maximum impact energy and the results incorporated into a robust structural design for modern offshore platforms. The proposed procedure and simulation method provide a step-by-step guide to assess the damage capacity of a production area as well as damage frequency and consequences.


