1. Introduction
The analysis of microstructure of metal artefacts is an important branch of material characterization since many mechanical and thermal properties strongly depend on the microscopic characteristics within a metal specimen. Neutron methods offer a wide range of diagnostic results ranging from quantitative multiphase analysis [
1], residual stress distribution [
2,
3,
4], domain size and defect density, obtained through neutron diffraction [
5,
6], to microstructural morphological details as domain size, presence of re-crystallization phenomena, presence and distribution of texture obtained through white beam and monochromatic neutron imaging [
7,
8].
More specifically, when it is important to verify the microstructural conditions of re-crystallized metal samples, i.e., to study special thermal treatments or multiple thermal cycles, it is quite important to exploit a non-invasive technique able to provide a mapping of single crystal domain size, distribution and orientation. Monochromatic neutron imaging scan is, probably, the most powerful non-invasive tool able to provide a spatial map of oligocrystals, including their size, shape and distribution within metal samples.
In this work, we analysed a high purity copper rod that was thermally treated by selective heat blade melting to re-crystallize as a single crystal by using neutron wavelength selective scanning radiography and monochromatic neutron tomography at selected wavelengths.
2. Method
Monochromatic neutron radiography is based on the analysis of images of a transmitted monochromatic neutron beam which is attenuated by a combination of scattering and absorption. Concerning the effect of scattering induced by a crystalline material, its intensity with respect to the wavelength depends on the crystalline structure of the material. Some pure metal samples with simple cubic structures can be very strong neutron scatterers depending on the nature of the constituent atom, and the coherent scattering effects generate a non-negligible variation of the transmitted intensity as a function of the crystalline state of the analysed sample. In general, when a polycrystalline isotropic sample is analysed, the transmitted beam is attenuated according to a specific model, complementary to the Bragg scattering effect. The wavelength-dependent attenuation spectrum can be measured through the scan of a monochromatic neutron beam tuned at different wavelengths, using, e.g., a double crystal monochromator (DCM). When measuring the attenuation spectrum of an isotropic powder-like sample, it is possible to observe the presence of an attenuation signal following a regular structure, composed by linear intensity variation followed by abrupt discontinuities in correspondence to the backscattering conditions of specific lattice plane families of the metal structure (called Bragg edges) [
9].
The position of Bragg edges measured as a function of neutron wavelength is correlated with the lattice plane families of the crystalline specimen according to the following relation:
where λ
hkl is the incident neutron wavelength and d
hkl is the distance of the hkl indexed lattice plane family.
By performing Bragg edge analysis, and verifying how deviant the measured profile is with respect to the ideal powder conditions (large-size, defect-free, random domains) it is possible to evaluate several microstructural features such as the presence of defects, the existence of any anisotropy in the sample and of residual strain along the neutron beam measurement direction in a very similar way as for diffraction analysis. Bragg edge imaging techniques rely on the simultaneous measurement of the attenuation spectrum at each pixel of a detector device, allowing characterization of the microstructural properties of a metal specimen to a spatial resolution comparable with the typical radiographic methods (few hundreds of microns), much higher than typical neutron diffraction gauge volumes.
In case large size single crystal grains are present within a sample, the wavelength scan analysis of the areas in which they are present shows an intensity attenuation profile, which is affected by the strong scattering effect of a few selected neutron wavelengths interacting with the specifically oriented lattice planes of the single crystal. Since such single crystal areas only interact with specific neutron wavelengths, the transmitted beam exhibits an almost flat profile showing the presence of dips at specific wavelengths corresponding to the Bragg scattering conditions of the lattice planes, according to their 2θ orientation with respect to the primary beam direction [
10,
11,
12,
13,
14].
These dips correspond to the interaction of the corresponding neutron wavelength with a specific lattice plane so for low Miller index planes it is, in theory, possible to reconstruct the relative orientation of the planes with respect to the beam. When multiple dips are present, it is further possible to reconstruct the specific orientation of the crystals within the sample. It is uncommon to deal with pure single crystal materials since the production procedure of large size single crystals is quite difficult, thus the samples observed commonly are a mixture of polycrystalline samples containing large size single crystals within. The resulting attenuation spectrum is hence a mixture of Bragg edge profiles combined with Bragg dips.
3. Sample
The single crystal copper sample under investigation was grown vertically upward in a unidirectional solidification experiment. The solidification reaction occurred in a cylindrical graphite crucible of 10 mm inner diameter and 180 mm long, which was positioned inside a high-purity Al2O3 tube of 16 mm inner diameter. This graphite crucible-alumina tube assembly was inserted through the cylindrical cavity of a vertical electric tube furnace. The lower end of the alumina tube was closed, and the upper end was O-ring sealed to a head, which allowed vacuum/atmosphere control so that the solidification reaction occurred in an inert atmosphere, filled with either argon or nitrogen. The solidification experiment was conducted with the electric furnace set at 1300°C. A hollow water-cooled cold finger, which was vertically attached to the bottom of the furnace, served to have a positive temperature gradient established upward. The furnace-cooling assembly was supported by a carriage, which moved upward on three ball bushing guided rods driven from below by two symmetrically placed ball screw rods, which were turned by a synchronous stepper motor using a belt drive. The rate of motion was computer controlled.
In an effort to have control over nucleation events, the cavity of the graphite crucible was made to have a cone-shaped bottom with the opening angle of 30°. The initial position of the furnace-cooling assembly relative to the graphite crucible-alumina tube assembly was determined such that the copper in the crucible was all in the liquid state. The molten copper in the graphite crucible was then solidified vertically in keeping with the motion of the furnace-cooling assembly driven upward at a controlled speed, 10μm/s for the sample in question. Upon completion of the experiment, specimens were taken from the directionally grown sample for metallographic examination. For the present sample, the cross section normal to the growth direction was examined by optical microscope using specimens taken at both ends of the cylindrical part. No grain boundaries were visible in them. The sample was then selected as a single crystal sample to be analysed by using monochromatic neutron imaging methods. Its size was 9 mm diameter, 97 mm axial length.
4. Experimental Procedure and Data Analysis
In order to perform a characterization experiment of the copper rod based on monochromatic neutron imaging, we used the BOA beamline at the Paul Scherrer Institute, which receives a cold neutron spectrum from the moderator [
15] and is equipped with a double crystal monochromator in order to perform monochromatic radiographies and tomographies. [
15] The L/D collimation power was set at the minimum value of 140 to privilege the neutron flux, while the resolution of the double crystal monochromator device was Δλ/λ = 1.4%.
The detector used was a 16-bit IKON-M camera from Andor coupled with a 50 mm objective looking onto a 100-um thick 6LiF-ZnS scintillator. The 1024 × 1024 pixels chip was focused on a field of view 37 × 37 mm and 80 um effective resolution, each pixel corresponding to 36 μm on the scintillator.
The wavelength scan in radiography mode was performed with the DCM in a wavelength range between 2.450 Å and 4.300 Å with a wavelength step of 0.025 Å, resulting in a total of 75 monochromatic radiographies. Each radiography was acquired with an exposure time of 60 seconds and was repeated twice. Direct beam measurements for the transmission normalization were repeated three times with identical exposure time. The copper rod was measured in two specific relative orientations: the second configuration was rotated 90° around the rod axis with respect to the first one.
Data reduction and normalization was performed by using ImageJ code. [
16,
17]
Since preliminary observation of the normalized wavelength scan showed the presence of dark areas with the aspect of branched structures within specific areas of the rod (similar to what can be expected by dendritic growth structures), we decided to perform two monochromatic tomographies at the wavelength values in which the contrast of such structures was maximum with respect to the rest of the rod body: 3.6 Å and 3.75 Å. The tomography measurements were performed by taking 181 projections with 1° angular step size and 60 s exposure time per projection for each of the selected wavelengths. The tomography reconstruction routine included a dedicated pre-processing algorithm for the correction of lines in the sinograms, to mitigate the presence of ring artefacts in the reconstructions, which deteriorates the segmentation of the investigated structures [
18]. The software used for the reconstruction was the ASTRA toolbox [
19], which includes the SIRT iterative reconstruction technique, particularly efficient for limited projections and noisy data such as the ones obtained with wavelength selective techniques. We took into account that Bragg dips only appear at certain projection angles and their number is enough for the reconstruction technique to catch the 3D geometry. This is possible since the rest of the sample was composed by a single crystal.
5. Results
Image analysis provided several interesting features related to the microcrystalline structure of the single crystal copper rod.
First, the attenuation profile in different areas of the sample did not show Bragg edge profiles, which are typically found for polycrystalline systems. However, multiple dips in the attenuation spectra were observed.
Figure 1 shows a few monochromatic transmission radiographs, from which it can be observed that the rod is not a complete single crystal since dark areas are visible at specific wavelengths. In addition to the misaligned areas, appearing as dark spots, a structured branch figure is clearly visible.
In
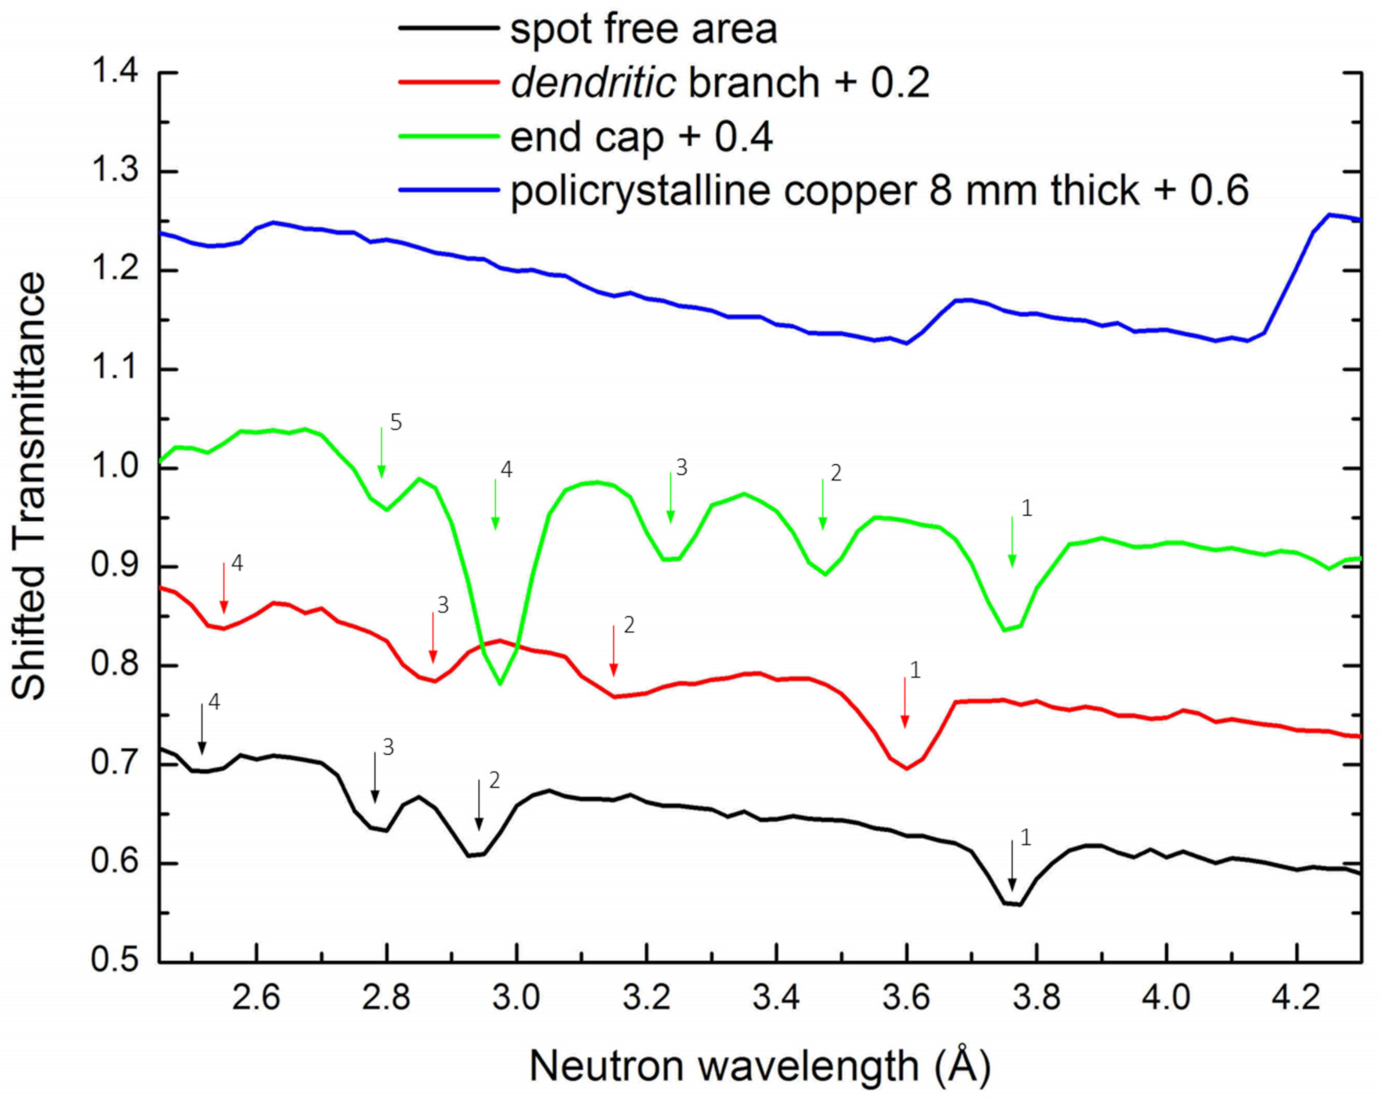
Figure 2, we show some transmission profiles taken in different sample areas using a rectangular region of interest with size 60 × 15 pixels, showing the presence of Bragg dips which width is compatible with the neutron wavelength resolution. The results are compared with the typical polycrystalline copper Bragg edge profile measured on a reference sample acquired on the same radiography scan window. According to more than 30 sampled areas, the selected windows are representative of the whole volume of the sample, showing the dips profile and the position of the most significant crystallization typologies.
Different areas of the sample exhibit the presence of dips at various wavelengths. It is generally difficult to assign a dip to specific lattice plane family but, in specific cases, it becomes possible; i.e., the rightmost dips in green and black spectra in
Figure 2 can only be reflections of 111 lattice planes since the wavelength is larger than all reflections except 111.
The results of the wavelength fit of the dips shown in
Figure 2 are reported in
Table 1, including the possible relative lattice plane assignment and the angular displacement (θ) of the planes with respect to the primary neutron beam.
Considering there is a certain wavelength dispersion within the field of view due to the double crystal monochromator behaviour, it is reasonable to consider that the dips #1 and #3 of the spot free area coincide with the dips #1 and #5 of the end cap area. Thus, in this area we observe a mixture of a set of differently oriented single crystal blocks.
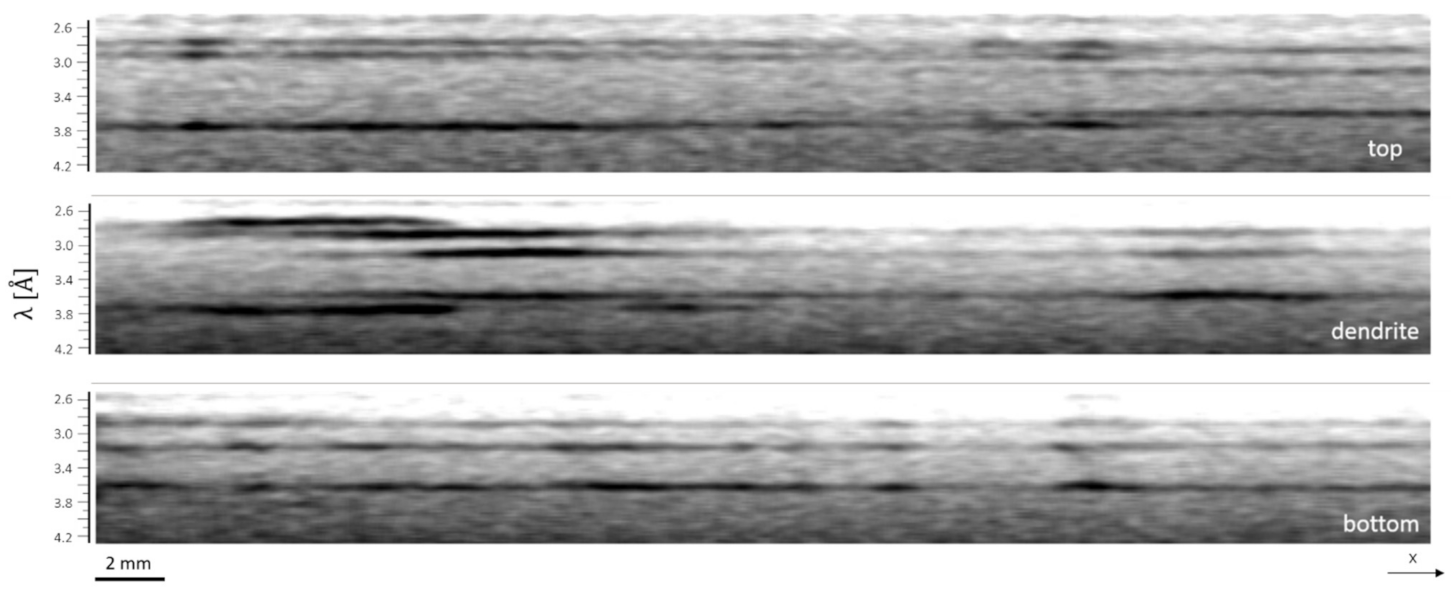
Another way to qualitatively observe the behaviour of the recrystallization procedure is the analysis of re-sliced images of the wavelength scan stack performed starting from the top according to the coordinates of
Figure 1 (negative y direction). In this way, each image represents the x-λ view of the rod taken at a specific y height.
Three different images taken respectively in the top area, the branched dendrite area and the bottom area of the rod, with respect to the y direction of
Figure 1 are shown in
Figure 3; the external caps were cut to ease visualization. In the top and bottom images, the presence of three main dips along the rod length shows the reflections related to the bulk single crystal. The top image shows a discontinuity in two of the three dips at two thirds of the full length: the recrystallization was somehow distorted. Nothing happens on the bottom image where the single crystal is the same for the whole length. The central image shows the distribution of the dips at the height of the dendrite, showing the presence of several localized dips related to the spurious single crystal areas misaligned with respect to the bulk.
In order to try to visualize on a 3D image the differently recrystallized areas, especially concerning the branched dendritic structure, we selected two specific wavelengths in which the radiographies showed the dendrite was (partially or completely) well visible, aiming to perform two monochromatic tomographies. The selected wavelengths are λ = 3.60 Å and λ = 3.75 Å showing, respectively, a clear image of the dendrite on the right side and the final end of the dendrite on the left side (see
Figure 1B,C).
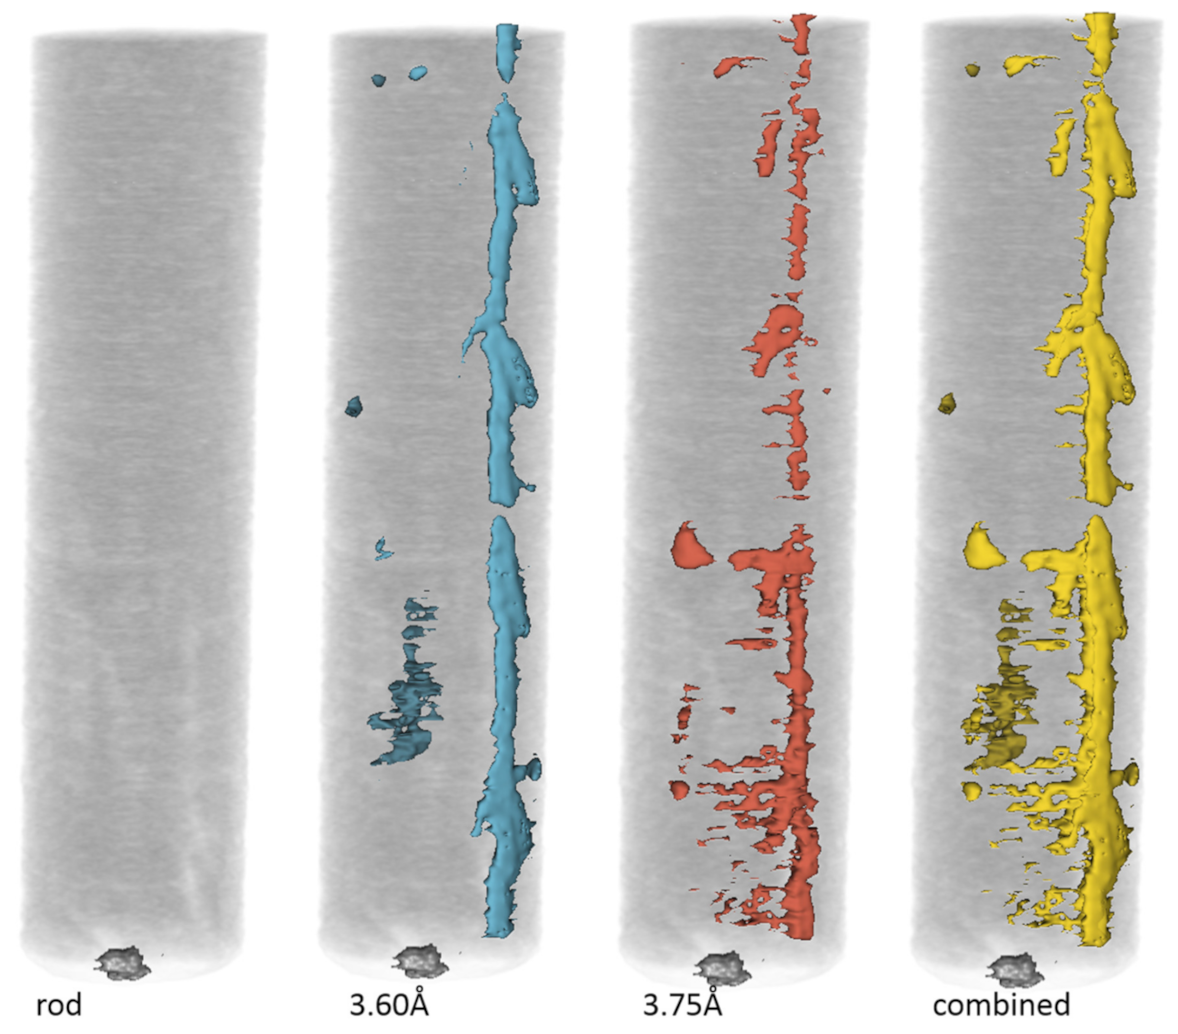
The monochromatic tomography reconstructions at the two selected wavelengths both exhibited the presence of the branched dendritic structure with a slight difference in their spatial localization as if the high contrast of the dendrite taken on the two tomographies were slightly misaligned. A 3D view of the tomography reconstruction showing the high contrast areas attributed to single crystals are shown in
Figure 4. The volume of the rod is visualized using the
volume rendering module of 3D Slicer [
20,
21] that on one hand is guaranteed to maintain the same contrast as the projection but allows on the other hand selection of specific areas of the grey tones scale (dynamic range) to make them transparent. The volume of the single crystal branch was enhanced by segmentation module exploiting the thresholding algorithm to select the specific high contrast volume and in order to fill some gaps in the model, the growing function was also used.
It seems clear that the dendritic structure is in truth formed by a combination of differently aligned crystals. Only part of those was exhibiting high contrast in the 3.60 Å tomography while another part (partially superimposed to the previous one) was exhibiting high contrast in the 3.75 Å tomography. The recrystallized branch is localized close to the rod surface as evidenced in the 3D visualization movie available in
Supplementary Materials to this paper.
The main body of the rod, concerning the results from the tomographies at the two selected wavelengths, shows an almost perfect single crystal structure, as evidenced by visualization of the transmitted intensity as a function of the wavelength in several selected areas.
6. Conclusions
In this paper, we showed how it is possible to exploit neutron wavelength selective radiographic scan and monochromatic tomography as powerful tools to characterize the morphology and the microstructure of single crystal bodies and inner structures. We were able to determine the qualitative distribution of the single crystal bulk of a pure copper sample rod and the presence and degree of misalignment of smaller single crystal grains spatially dispersed within the structure. We also observed the presence of a dendritic structure, spatially localized close to the external surface, which appears as an almost perfect single crystal strongly misaligned with respect to the single crystal bulk. The level of microstructural details that can be achieved using these techniques can open important research topics in non-invasive characterization of metal artefacts in historical, archaeological and industrial interest.
Author Contributions
Conceptualization, F.G. and J.-S.P.; Data curation, F.C. and M.M.; Formal analysis, M.B.; Investigation, F.G. and M.M.; Software, M.B.; Supervision, J.-S.P.; Validation, J.-S.P.; Visualization, F.C.; Writing—original draft, F.G.; Writing—review & editing, F.G., F.C., M.M., M.B. and J.-S.P. All authors have read and agreed to the published version of the manuscript.
Funding
This research received no external funding.
Acknowledgments
INFN-CHNet financial contribution for experimental costs coverage is gratefully acknowledged. M.B. acknowledges funding from DanScatt.
Conflicts of Interest
The authors declare no conflict of interest.
References
- Polatidis, E.; Morgano, M.; Malamud, F.; Bacak, M.; Panzner, T.; van Swygenhoven, H.; Strobl, M. Neutron Diffraction and Diffraction Contrast Imaging for Mapping the TRIP Effect under Load Path Change. Materials 2020, 13, 1450. [Google Scholar] [CrossRef] [PubMed] [Green Version]
- Morgano, M.; Kalentics, N.; Carminati, C.; Capek, J.; Makowska, M.; Woracek, R.; Maimaitiyili, T.; Shinohara, T.; Loge, R.; Strobl, M. Investigation of the effect of Laser Shock Peening in Additively Manufactured samples through Bragg Edge Neutron Imaging. Addit. Manuf. 2020, 34, 101201. [Google Scholar] [CrossRef]
- Busi, M.; Kalentics, N.; Morgano, M.; Griffiths, S.; Tremsin, A.S.; Shinohara, T.; Logé, R.; Leinenbach, C.; Strobl, M. Nondestructive characterization of laser powder bed fusion parts with neutron Bragg edge. Addit. Manuf. 2021, 39, 101848. [Google Scholar] [CrossRef]
- Busi, M.; Kalentics, N.; Morgano, M.; Griffiths, S.; Tremsin, A.S.; Shinohara, T.; Logé, R.; Leinenbach, C.; Strobl, M. A Parametric Neutron Bragg Edge Imaging Study of Additively Manufactured Samples Treated by Laser Shock Peening. Sci. Rep. 2021. in review. [Google Scholar] [CrossRef]
- Fedrigo, A.; Grazzi, F.; Williams, A.R.; Panzner, T.; Lefmann, K.; Lindelof, P.E.; Jørgensen, L.; Pentz, P.; Scherillo, A.; Porcher, F.; et al. Extraction of archaeological information from metallic artefacts—A neutron diffraction study on Viking swords. J. Archaeol. Sci. Rep. 2017, 12, 425. [Google Scholar] [CrossRef]
- Harjo, S.; Kawasaki, T.; Grazzi, F.; Shinohara, T.; Tanaka, M. Neutron diffraction study on full-shape Japanese sword. Materialia 2019, 7, 100377. [Google Scholar] [CrossRef]
- Fedrigo, A.; Strobl, M.; Williams, A.R.; Lefmann, K.; Lindelof, P.E.; Jørgensen, L.; Pentz, P.; Bausenwein, D.; Schillinger, B.; Kovyakh, A.; et al. Neutron imaging study of ‘pattern-welded’swords from the Viking Age. Archaeol. Anthropol. Sci. 2018, 10, 1249. [Google Scholar] [CrossRef]
- Salvemini, F.; Williams, A.; Edge, D.; Schillinger, B.; Cantini, F.; Grazzi, F. On the use of neutron imaging methods to identify microstructural features in ancient Indian swords and armour. Microchem. J. 2020, 159, 105397. [Google Scholar] [CrossRef]
- Sato, H.; Shinohara, T.; Kiyanagi, R.; Aizawa, K.; Ooi, M.; Harada, M.; Oikawa, K.; Maekawa, F.; Iwase, K.; Kamiyama, T.; et al. Upgrade of Bragg edge analysis techniques of the RITS code for crystalline structural information imaging. Phys. Procedia 2013, 43, 186. [Google Scholar] [CrossRef] [Green Version]
- Santisteban, J.R. Time-of-flight neutron transmission of mosaic crystals. J. Appl. Crystallogr. 2005, 38, 934. [Google Scholar] [CrossRef]
- Malamud, F.; Santisteban, J.R. Full-pattern analysis of time-of-flight neutron transmission of mosaic crystals. J. Appl. Crystallogr. 2016, 49, 348. [Google Scholar] [CrossRef]
- Sato, H.; Shiota, Y.; Morooka, S.; Todaka, Y.; Adachi, N.; Sadamatsu, S.; Oikawa, K.; Harada, M.; Zhang, S.; Su, Y.; et al. Inverse pole figure mapping of bulk crystalline grains in a polycrystalline steel plate by pulsed neutron Bragg-dip transmission imaging. J. Appl. Crystallogr. 2017, 50, 1601. [Google Scholar] [CrossRef] [Green Version]
- Strickland, J.; Tassenberg, K.; Sheppard, G.; Nenchev, B.; Perry, S.; Li, J.; Dong, H.; Burca, G.; Kelleher, J.; Irwin, S. 2D single crystal Bragg-dip mapping by time-of-flight energy-resolved neutron imaging on IMAT@ISIS. Sci. Rep. 2020, 10, 20751. [Google Scholar] [CrossRef] [PubMed]
- Sakurai, Y.; Sato, H.; Adachi, N.; Morooka, S.; Todaka, Y.; Kamiyama, T. Analysis and Mapping of Detailed Inner Information of Crystalline Grain by Wavelength-Resolved Neutron Transmission Imaging with Individual Bragg-Dip Profile-Fitting. Appl. Sci. 2021, 11, 5219. [Google Scholar] [CrossRef]
- Morgano, M.; Peetermans, S.; Lehmann, E.H.; Panzner, T.; Filges, U. Neutron imaging options at the BOA beamline at Paul Scherrer Institut. Nucl. Instrum. Methods Phys. Res. Sect. A 2014, 754, 46. [Google Scholar] [CrossRef]
- Schneider, C.A.; Rasband, W.S.; Eliceiri, K.W. NIH Image to ImageJ: 25 years of image analysis. Nat. Methods 2012, 9, 671. [Google Scholar] [CrossRef] [PubMed]
- Abramoff, M.D.; Magalhaes, P.J.; Ram, S.J. Image Processing with ImageJ. Biophotonics Int. 2004, 11, 36. [Google Scholar]
- Vo, N.T.; Atwood, R.C.; Drakopoulos, M. Superior techniques for eliminating ring artifacts in X-ray micro-tomography. Opt. Express 2018, 26, 28396. [Google Scholar] [CrossRef] [PubMed]
- Van Aarle, W.; Palenstijn, W.J.; Cant, J.; Janssens, E.; Bleichrodt, F.; Dabravolski, A.; de Beenhouwer, J.; Batenburg, K.J.; Sijbers, J. Fast and flexible X-ray tomography using the ASTRA toolbox. Opt. Express 2016, 24, 25129. [Google Scholar] [CrossRef] [PubMed]
- Pieper, S.; Halle, M.; Kikinis, R. 3D Slicer. In Proceedings of the 2nd IEEE International Symposium on Biomedical Imaging: Nano to Macro (IEEE Cat No. 04EX821), Arlington, VA, USA, 15–18 April 2004; Volume 1, p. 632. [Google Scholar] [CrossRef]
- Velazquez, E.R.; Parmar, C.; Jermoumi, M.; Mak, R.H.; van Baardwijk, A.; Fennessy, F.M.; Lewis, J.H.; de Ruysscher, D.; Kikinis, R.; Lambin, P.; et al. Volumetric CT-based segmentation of NSCLC using 3D-Slicer. Sci. Rep. 2013, 3, 3529. [Google Scholar] [CrossRef] [PubMed] [Green Version]
| Publisher’s Note: MDPI stays neutral with regard to jurisdictional claims in published maps and institutional affiliations. |
© 2021 by the authors. Licensee MDPI, Basel, Switzerland. This article is an open access article distributed under the terms and conditions of the Creative Commons Attribution (CC BY) license (https://creativecommons.org/licenses/by/4.0/).


 and
and 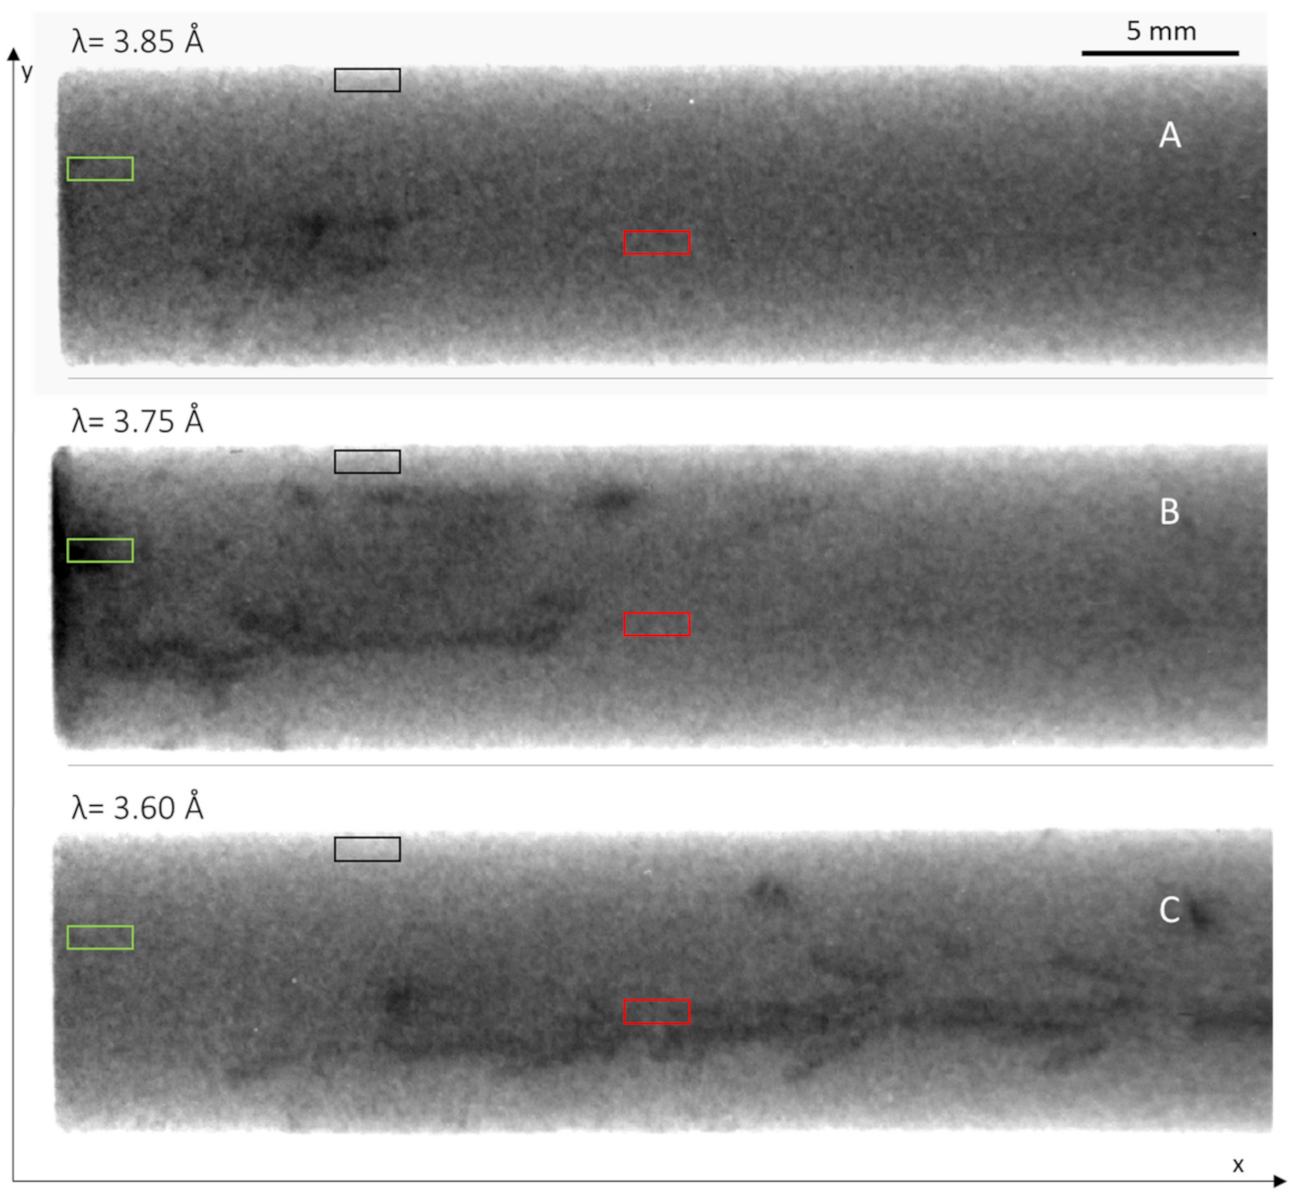
